Zip Codes with the Highest Percentage of Population Employed in Health Diagnosing & Treating in Grand Junction, CO
RELATED REPORTS & OPTIONS
Health Diagnosing & Treating
Grand Junction
Compare Zip Codes
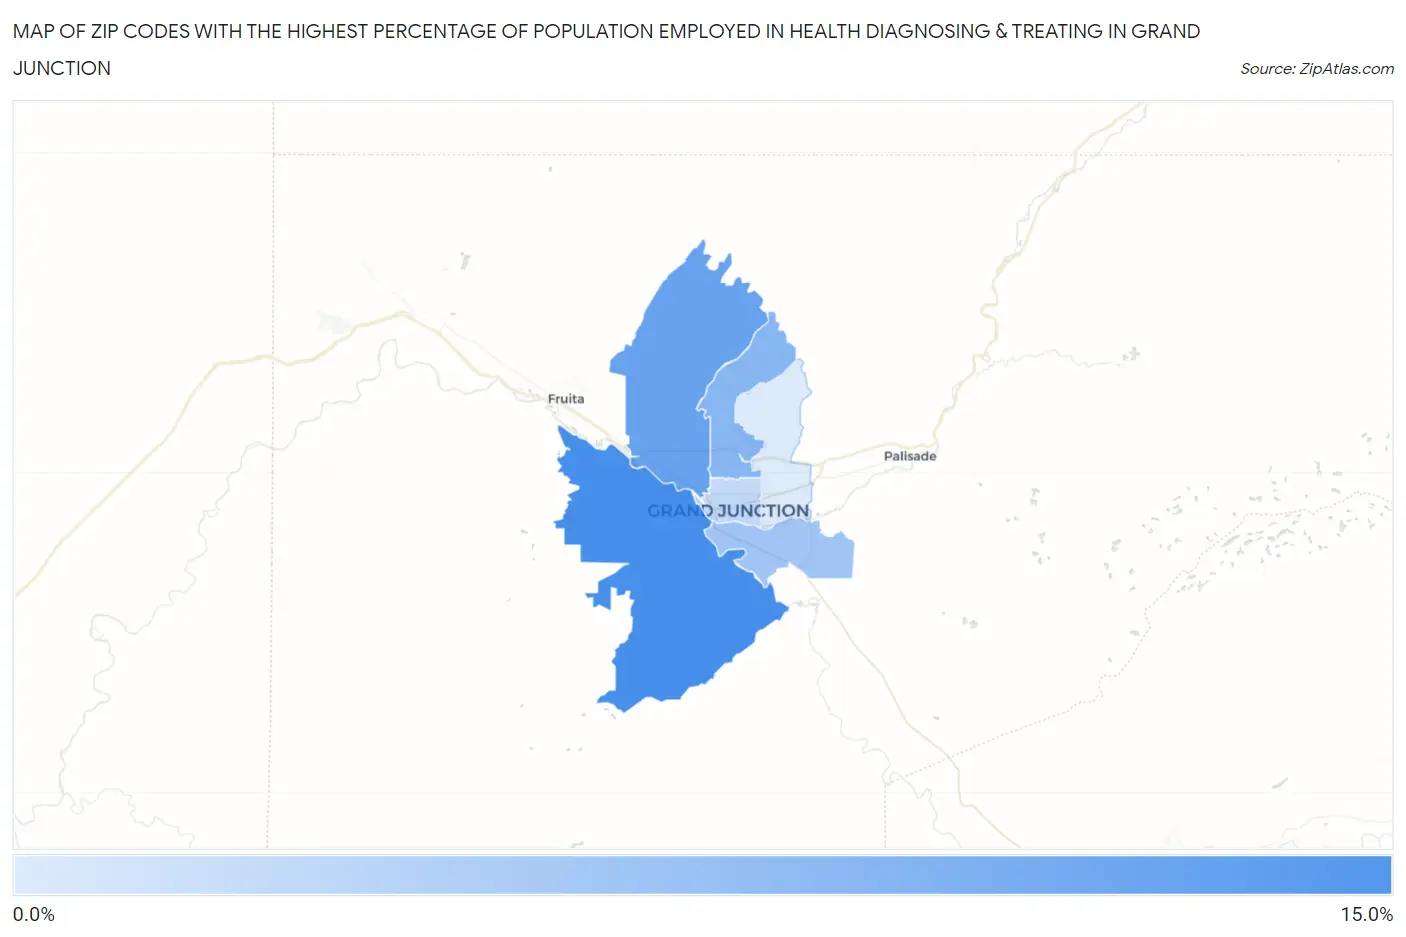
Map of Zip Codes with the Highest Percentage of Population Employed in Health Diagnosing & Treating in Grand Junction
0.0%
15.0%
Zip Codes with the Highest Percentage of Population Employed in Health Diagnosing & Treating in Grand Junction, CO
| Zip Code | % Employed | vs State | vs National | |
| 1. | 81507 | 12.9% | 5.8%(+7.08)#29 | 6.2%(+6.64)#1,785 |
| 2. | 81505 | 11.0% | 5.8%(+5.21)#39 | 6.2%(+4.78)#2,877 |
| 3. | 81506 | 9.1% | 5.8%(+3.26)#68 | 6.2%(+2.82)#5,246 |
| 4. | 81503 | 7.7% | 5.8%(+1.86)#104 | 6.2%(+1.42)#8,324 |
| 5. | 81501 | 5.8% | 5.8%(-0.034)#200 | 6.2%(-0.471)#14,709 |
| 6. | 81504 | 4.3% | 5.8%(-1.53)#291 | 6.2%(-1.97)#20,414 |
1
Common Questions
What are the Top 5 Zip Codes with the Highest Percentage of Population Employed in Health Diagnosing & Treating in Grand Junction, CO?
Top 5 Zip Codes with the Highest Percentage of Population Employed in Health Diagnosing & Treating in Grand Junction, CO are:
What zip code has the Highest Percentage of Population Employed in Health Diagnosing & Treating in Grand Junction, CO?
81507 has the Highest Percentage of Population Employed in Health Diagnosing & Treating in Grand Junction, CO with 12.9%.
What is the Percentage of Population Employed in Health Diagnosing & Treating in Grand Junction, CO?
Percentage of Population Employed in Health Diagnosing & Treating in Grand Junction is 8.4%.
What is the Percentage of Population Employed in Health Diagnosing & Treating in Colorado?
Percentage of Population Employed in Health Diagnosing & Treating in Colorado is 5.8%.
What is the Percentage of Population Employed in Health Diagnosing & Treating in the United States?
Percentage of Population Employed in Health Diagnosing & Treating in the United States is 6.2%.