Zip Codes with the Highest Percentage of Population Employed in Life, Physical & Social Science in Grand Junction, CO
RELATED REPORTS & OPTIONS
Life, Physical & Social Science
Grand Junction
Compare Zip Codes
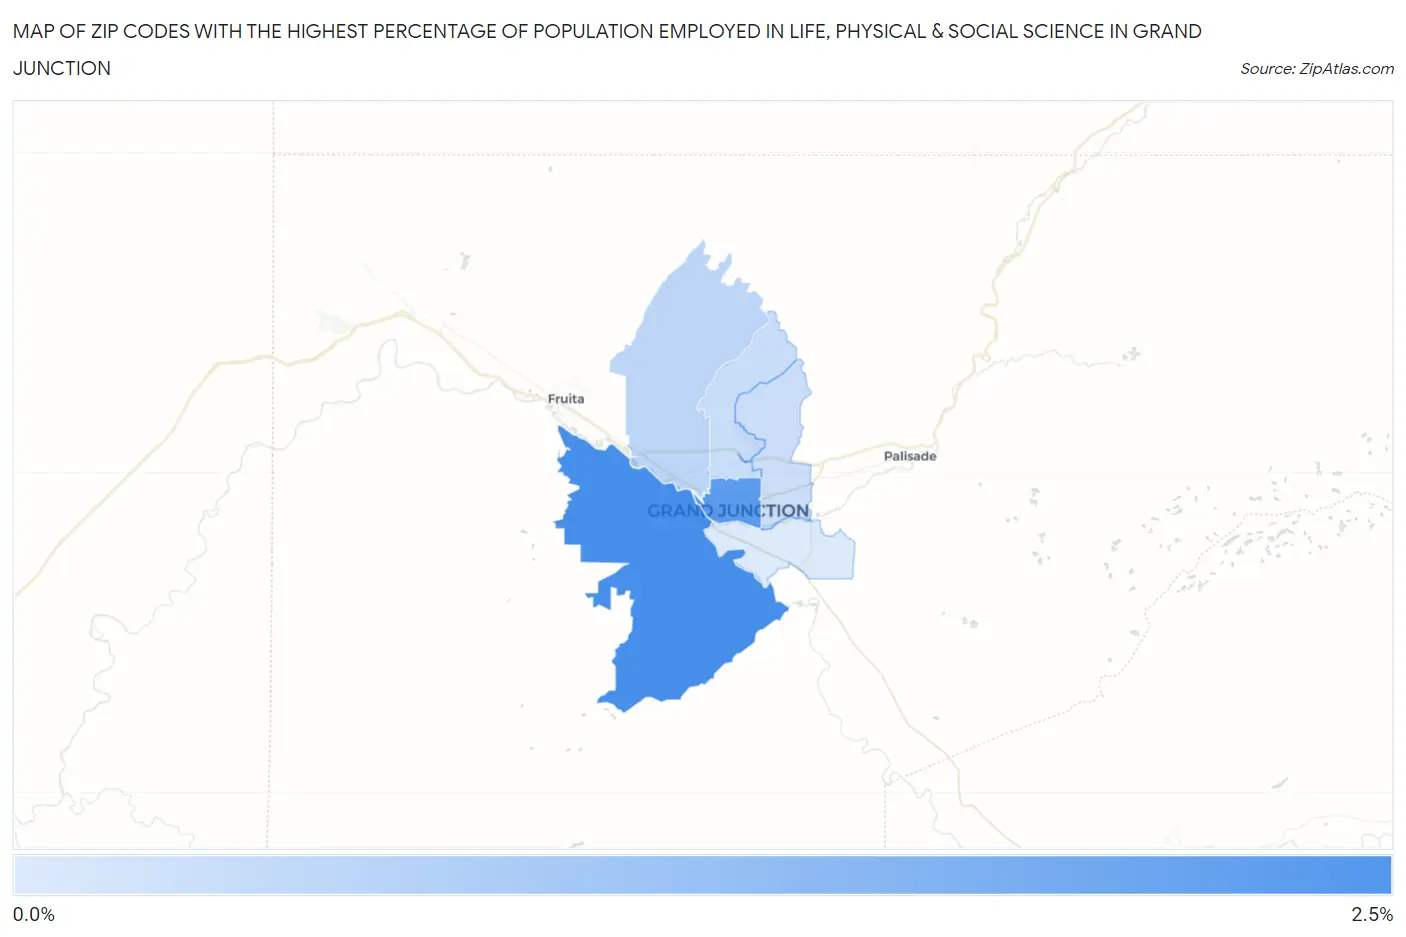
Map of Zip Codes with the Highest Percentage of Population Employed in Life, Physical & Social Science in Grand Junction
0.0%
2.5%
Zip Codes with the Highest Percentage of Population Employed in Life, Physical & Social Science in Grand Junction, CO
| Zip Code | % Employed | vs State | vs National | |
| 1. | 81507 | 2.2% | 1.3%(+0.841)#75 | 1.1%(+1.07)#3,278 |
| 2. | 81501 | 1.9% | 1.3%(+0.629)#94 | 1.1%(+0.857)#3,838 |
| 3. | 81505 | 0.80% | 1.3%(-0.518)#217 | 1.1%(-0.291)#11,002 |
| 4. | 81506 | 0.65% | 1.3%(-0.672)#243 | 1.1%(-0.445)#12,695 |
| 5. | 81504 | 0.64% | 1.3%(-0.678)#245 | 1.1%(-0.450)#12,776 |
| 6. | 81503 | 0.42% | 1.3%(-0.900)#278 | 1.1%(-0.673)#15,525 |
1
Common Questions
What are the Top 5 Zip Codes with the Highest Percentage of Population Employed in Life, Physical & Social Science in Grand Junction, CO?
Top 5 Zip Codes with the Highest Percentage of Population Employed in Life, Physical & Social Science in Grand Junction, CO are:
What zip code has the Highest Percentage of Population Employed in Life, Physical & Social Science in Grand Junction, CO?
81507 has the Highest Percentage of Population Employed in Life, Physical & Social Science in Grand Junction, CO with 2.2%.
What is the Percentage of Population Employed in Life, Physical & Social Science in Grand Junction, CO?
Percentage of Population Employed in Life, Physical & Social Science in Grand Junction is 1.1%.
What is the Percentage of Population Employed in Life, Physical & Social Science in Colorado?
Percentage of Population Employed in Life, Physical & Social Science in Colorado is 1.3%.
What is the Percentage of Population Employed in Life, Physical & Social Science in the United States?
Percentage of Population Employed in Life, Physical & Social Science in the United States is 1.1%.