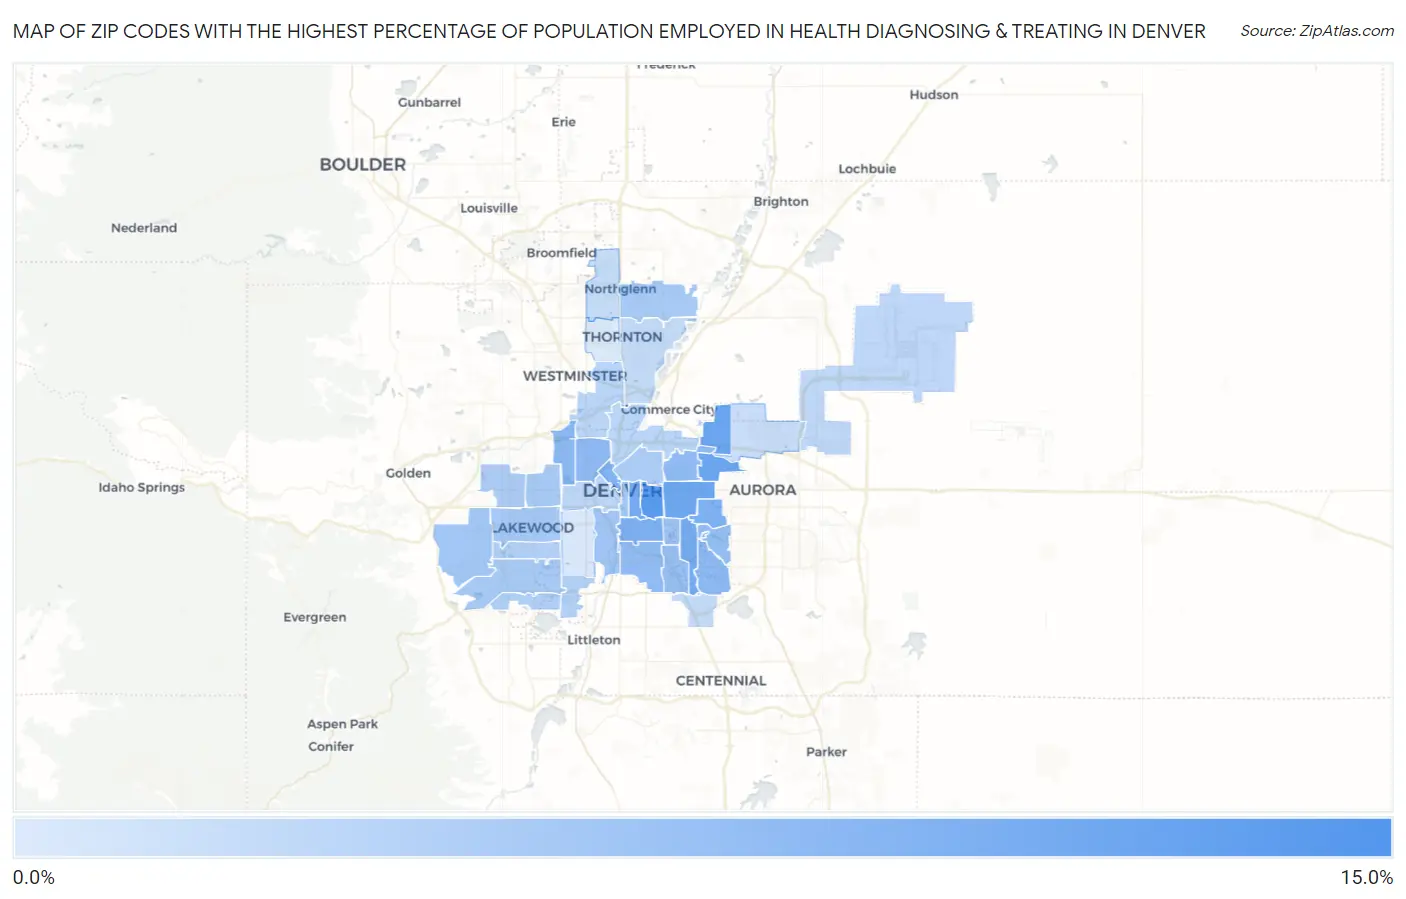
Zip Codes with the Highest Percentage of Population Employed in Health Diagnosing & Treating in Denver, CO
RELATED REPORTS & OPTIONS
Health Diagnosing & Treating
Denver
Compare Zip Codes
Map of Zip Codes with the Highest Percentage of Population Employed in Health Diagnosing & Treating in Denver
0.0%
15.0%
Zip Codes with the Highest Percentage of Population Employed in Health Diagnosing & Treating in Denver, CO
| Zip Code | % Employed | vs State | vs National | |
| 1. | 80290 | 13.0% | 5.8%(+7.21)#27 | 6.2%(+6.77)#1,734 |
| 2. | 80206 | 11.7% | 5.8%(+5.91)#33 | 6.2%(+5.47)#2,375 |
| 3. | 80238 | 10.1% | 5.8%(+4.34)#51 | 6.2%(+3.90)#3,704 |
| 4. | 80220 | 9.9% | 5.8%(+4.10)#55 | 6.2%(+3.66)#3,994 |
| 5. | 80218 | 9.5% | 5.8%(+3.71)#59 | 6.2%(+3.27)#4,512 |
| 6. | 80224 | 9.4% | 5.8%(+3.59)#61 | 6.2%(+3.15)#4,692 |
| 7. | 80230 | 8.8% | 5.8%(+2.96)#71 | 6.2%(+2.52)#5,806 |
| 8. | 80209 | 8.7% | 5.8%(+2.94)#72 | 6.2%(+2.50)#5,836 |
| 9. | 80202 | 8.4% | 5.8%(+2.58)#82 | 6.2%(+2.14)#6,554 |
| 10. | 80212 | 7.7% | 5.8%(+1.93)#102 | 6.2%(+1.49)#8,167 |
| 11. | 80211 | 7.6% | 5.8%(+1.82)#105 | 6.2%(+1.38)#8,436 |
| 12. | 80231 | 7.5% | 5.8%(+1.67)#114 | 6.2%(+1.23)#8,888 |
| 13. | 80210 | 7.5% | 5.8%(+1.66)#116 | 6.2%(+1.22)#8,913 |
| 14. | 80207 | 7.4% | 5.8%(+1.56)#120 | 6.2%(+1.12)#9,216 |
| 15. | 80247 | 7.1% | 5.8%(+1.25)#136 | 6.2%(+0.813)#10,168 |
| 16. | 80222 | 6.9% | 5.8%(+1.08)#144 | 6.2%(+0.645)#10,717 |
| 17. | 80246 | 6.4% | 5.8%(+0.623)#166 | 6.2%(+0.186)#12,274 |
| 18. | 80223 | 6.1% | 5.8%(+0.311)#181 | 6.2%(-0.126)#13,467 |
| 19. | 80203 | 6.0% | 5.8%(+0.239)#185 | 6.2%(-0.199)#13,702 |
| 20. | 80228 | 5.9% | 5.8%(+0.134)#189 | 6.2%(-0.303)#14,074 |
| 21. | 80226 | 5.8% | 5.8%(+0.041)#194 | 6.2%(-0.396)#14,422 |
| 22. | 80214 | 5.8% | 5.8%(-0.047)#203 | 6.2%(-0.484)#14,751 |
| 23. | 80233 | 5.7% | 5.8%(-0.137)#209 | 6.2%(-0.574)#15,096 |
| 24. | 80227 | 5.7% | 5.8%(-0.139)#210 | 6.2%(-0.576)#15,106 |
| 25. | 80205 | 5.4% | 5.8%(-0.408)#226 | 6.2%(-0.845)#16,174 |
| 26. | 80215 | 5.4% | 5.8%(-0.415)#227 | 6.2%(-0.852)#16,202 |
| 27. | 80235 | 4.9% | 5.8%(-0.860)#250 | 6.2%(-1.30)#17,914 |
| 28. | 80236 | 4.9% | 5.8%(-0.883)#252 | 6.2%(-1.32)#17,998 |
| 29. | 80232 | 4.8% | 5.8%(-0.990)#263 | 6.2%(-1.43)#18,441 |
| 30. | 80216 | 4.4% | 5.8%(-1.41)#283 | 6.2%(-1.85)#20,011 |
| 31. | 80221 | 4.3% | 5.8%(-1.46)#288 | 6.2%(-1.90)#20,189 |
| 32. | 80204 | 4.1% | 5.8%(-1.67)#297 | 6.2%(-2.10)#20,915 |
| 33. | 80249 | 3.9% | 5.8%(-1.87)#305 | 6.2%(-2.30)#21,553 |
| 34. | 80237 | 3.7% | 5.8%(-2.13)#326 | 6.2%(-2.57)#22,372 |
| 35. | 80229 | 3.6% | 5.8%(-2.18)#328 | 6.2%(-2.62)#22,527 |
| 36. | 80234 | 3.6% | 5.8%(-2.23)#330 | 6.2%(-2.66)#22,667 |
| 37. | 80239 | 3.4% | 5.8%(-2.43)#341 | 6.2%(-2.87)#23,251 |
| 38. | 80219 | 2.2% | 5.8%(-3.61)#385 | 6.2%(-4.05)#26,121 |
| 39. | 80260 | 1.9% | 5.8%(-3.93)#392 | 6.2%(-4.37)#26,676 |
1
Common Questions
What are the Top 10 Zip Codes with the Highest Percentage of Population Employed in Health Diagnosing & Treating in Denver, CO?
Top 10 Zip Codes with the Highest Percentage of Population Employed in Health Diagnosing & Treating in Denver, CO are:
What zip code has the Highest Percentage of Population Employed in Health Diagnosing & Treating in Denver, CO?
80290 has the Highest Percentage of Population Employed in Health Diagnosing & Treating in Denver, CO with 13.0%.
What is the Percentage of Population Employed in Health Diagnosing & Treating in Denver, CO?
Percentage of Population Employed in Health Diagnosing & Treating in Denver is 6.6%.
What is the Percentage of Population Employed in Health Diagnosing & Treating in Colorado?
Percentage of Population Employed in Health Diagnosing & Treating in Colorado is 5.8%.
What is the Percentage of Population Employed in Health Diagnosing & Treating in the United States?
Percentage of Population Employed in Health Diagnosing & Treating in the United States is 6.2%.