Zip Codes with the Highest Percentage of Population Employed in Computer, Engineering & Science in Denver, CO
RELATED REPORTS & OPTIONS
Computer, Engineering & Science
Denver
Compare Zip Codes
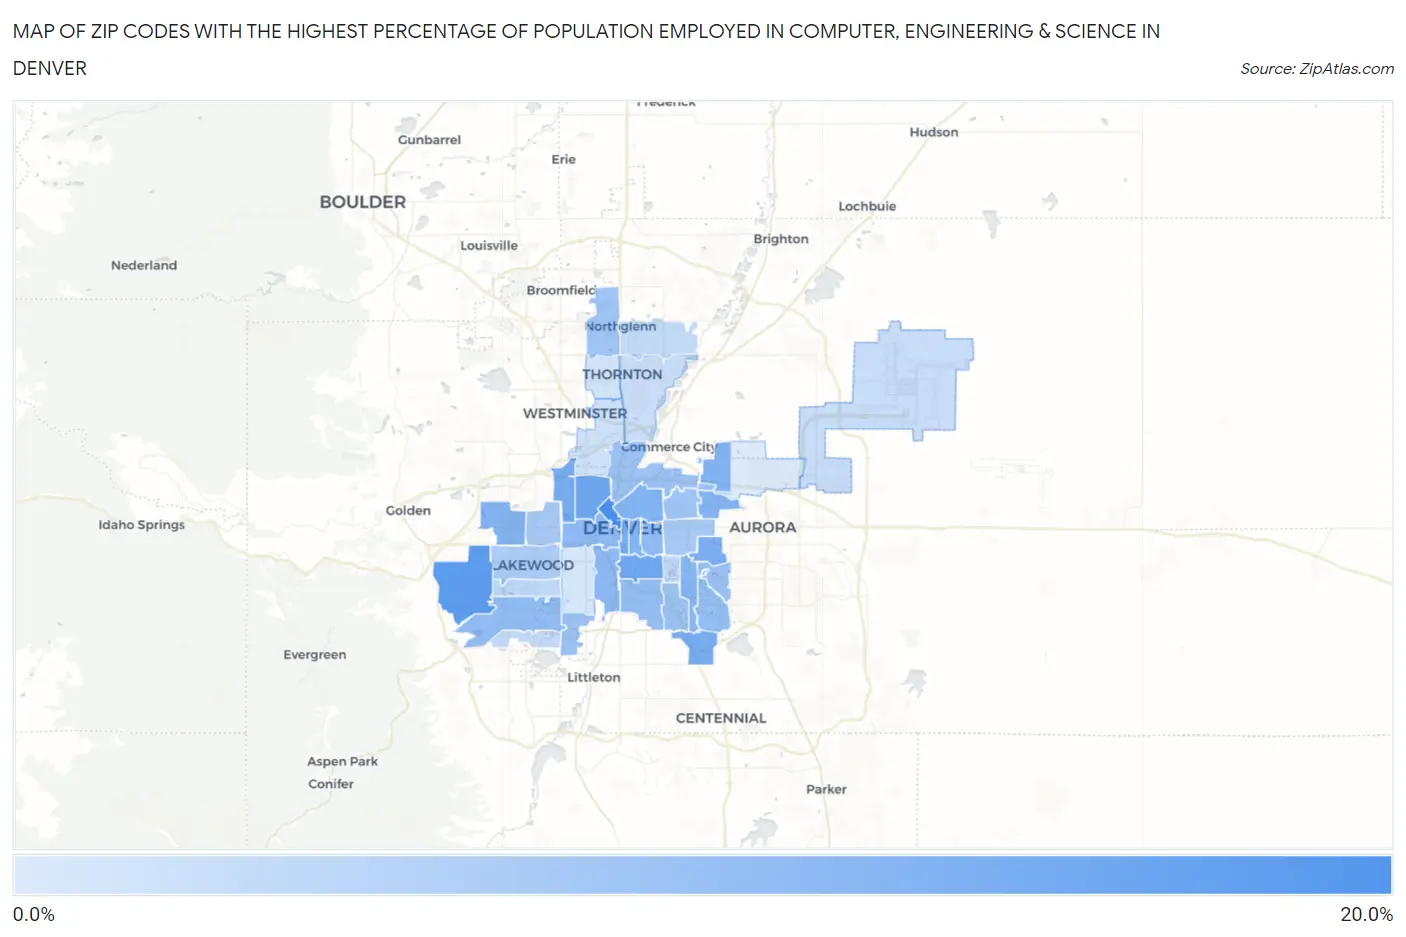
Map of Zip Codes with the Highest Percentage of Population Employed in Computer, Engineering & Science in Denver
0.0%
20.0%
Zip Codes with the Highest Percentage of Population Employed in Computer, Engineering & Science in Denver, CO
| Zip Code | % Employed | vs State | vs National | |
| 1. | 80202 | 17.7% | 9.0%(+8.68)#21 | 6.8%(+10.9)#729 |
| 2. | 80228 | 15.9% | 9.0%(+6.89)#32 | 6.8%(+9.12)#977 |
| 3. | 80211 | 13.7% | 9.0%(+4.71)#47 | 6.8%(+6.94)#1,430 |
| 4. | 80209 | 13.6% | 9.0%(+4.57)#50 | 6.8%(+6.80)#1,457 |
| 5. | 80203 | 13.1% | 9.0%(+4.09)#57 | 6.8%(+6.32)#1,615 |
| 6. | 80237 | 12.9% | 9.0%(+3.87)#60 | 6.8%(+6.10)#1,692 |
| 7. | 80212 | 12.7% | 9.0%(+3.75)#62 | 6.8%(+5.98)#1,730 |
| 8. | 80230 | 12.5% | 9.0%(+3.51)#65 | 6.8%(+5.74)#1,815 |
| 9. | 80205 | 11.9% | 9.0%(+2.95)#73 | 6.8%(+5.18)#2,058 |
| 10. | 80238 | 11.7% | 9.0%(+2.73)#78 | 6.8%(+4.96)#2,165 |
| 11. | 80218 | 11.6% | 9.0%(+2.64)#80 | 6.8%(+4.87)#2,218 |
| 12. | 80215 | 11.6% | 9.0%(+2.60)#81 | 6.8%(+4.83)#2,242 |
| 13. | 80224 | 11.3% | 9.0%(+2.27)#87 | 6.8%(+4.50)#2,427 |
| 14. | 80223 | 10.9% | 9.0%(+1.88)#93 | 6.8%(+4.11)#2,640 |
| 15. | 80204 | 10.5% | 9.0%(+1.48)#101 | 6.8%(+3.71)#2,886 |
| 16. | 80227 | 10.4% | 9.0%(+1.44)#102 | 6.8%(+3.67)#2,908 |
| 17. | 80206 | 10.3% | 9.0%(+1.30)#104 | 6.8%(+3.53)#3,000 |
| 18. | 80210 | 10.1% | 9.0%(+1.06)#112 | 6.8%(+3.29)#3,175 |
| 19. | 80231 | 9.9% | 9.0%(+0.946)#116 | 6.8%(+3.18)#3,268 |
| 20. | 80216 | 9.6% | 9.0%(+0.578)#124 | 6.8%(+2.81)#3,543 |
| 21. | 80236 | 9.5% | 9.0%(+0.519)#125 | 6.8%(+2.75)#3,586 |
| 22. | 80247 | 9.4% | 9.0%(+0.363)#128 | 6.8%(+2.59)#3,727 |
| 23. | 80222 | 9.1% | 9.0%(+0.098)#133 | 6.8%(+2.33)#3,967 |
| 24. | 80207 | 8.9% | 9.0%(-0.111)#139 | 6.8%(+2.12)#4,189 |
| 25. | 80234 | 8.8% | 9.0%(-0.159)#143 | 6.8%(+2.07)#4,225 |
| 26. | 80214 | 8.3% | 9.0%(-0.652)#155 | 6.8%(+1.58)#4,790 |
| 27. | 80220 | 8.3% | 9.0%(-0.721)#158 | 6.8%(+1.51)#4,907 |
| 28. | 80290 | 8.0% | 9.0%(-1.01)#163 | 6.8%(+1.22)#5,278 |
| 29. | 80226 | 7.8% | 9.0%(-1.23)#168 | 6.8%(+1.00)#5,594 |
| 30. | 80232 | 6.0% | 9.0%(-2.96)#202 | 6.8%(-0.731)#8,750 |
| 31. | 80246 | 6.0% | 9.0%(-3.04)#205 | 6.8%(-0.807)#8,935 |
| 32. | 80235 | 5.8% | 9.0%(-3.22)#215 | 6.8%(-0.989)#9,357 |
| 33. | 80233 | 5.6% | 9.0%(-3.44)#224 | 6.8%(-1.21)#9,942 |
| 34. | 80249 | 5.1% | 9.0%(-3.88)#242 | 6.8%(-1.65)#11,050 |
| 35. | 80229 | 5.0% | 9.0%(-4.01)#250 | 6.8%(-1.78)#11,428 |
| 36. | 80221 | 4.5% | 9.0%(-4.53)#269 | 6.8%(-2.30)#12,929 |
| 37. | 80260 | 4.2% | 9.0%(-4.78)#278 | 6.8%(-2.55)#13,797 |
| 38. | 80219 | 3.9% | 9.0%(-5.09)#291 | 6.8%(-2.86)#14,782 |
| 39. | 80239 | 3.3% | 9.0%(-5.71)#314 | 6.8%(-3.48)#17,066 |
1
Common Questions
What are the Top 10 Zip Codes with the Highest Percentage of Population Employed in Computer, Engineering & Science in Denver, CO?
Top 10 Zip Codes with the Highest Percentage of Population Employed in Computer, Engineering & Science in Denver, CO are:
What zip code has the Highest Percentage of Population Employed in Computer, Engineering & Science in Denver, CO?
80202 has the Highest Percentage of Population Employed in Computer, Engineering & Science in Denver, CO with 17.7%.
What is the Percentage of Population Employed in Computer, Engineering & Science in Denver, CO?
Percentage of Population Employed in Computer, Engineering & Science in Denver is 9.9%.
What is the Percentage of Population Employed in Computer, Engineering & Science in Colorado?
Percentage of Population Employed in Computer, Engineering & Science in Colorado is 9.0%.
What is the Percentage of Population Employed in Computer, Engineering & Science in the United States?
Percentage of Population Employed in Computer, Engineering & Science in the United States is 6.8%.