Zip Codes with the Largest Spanish Community in Denver, CO
RELATED REPORTS & OPTIONS
Spanish
Denver
Compare Zip Codes
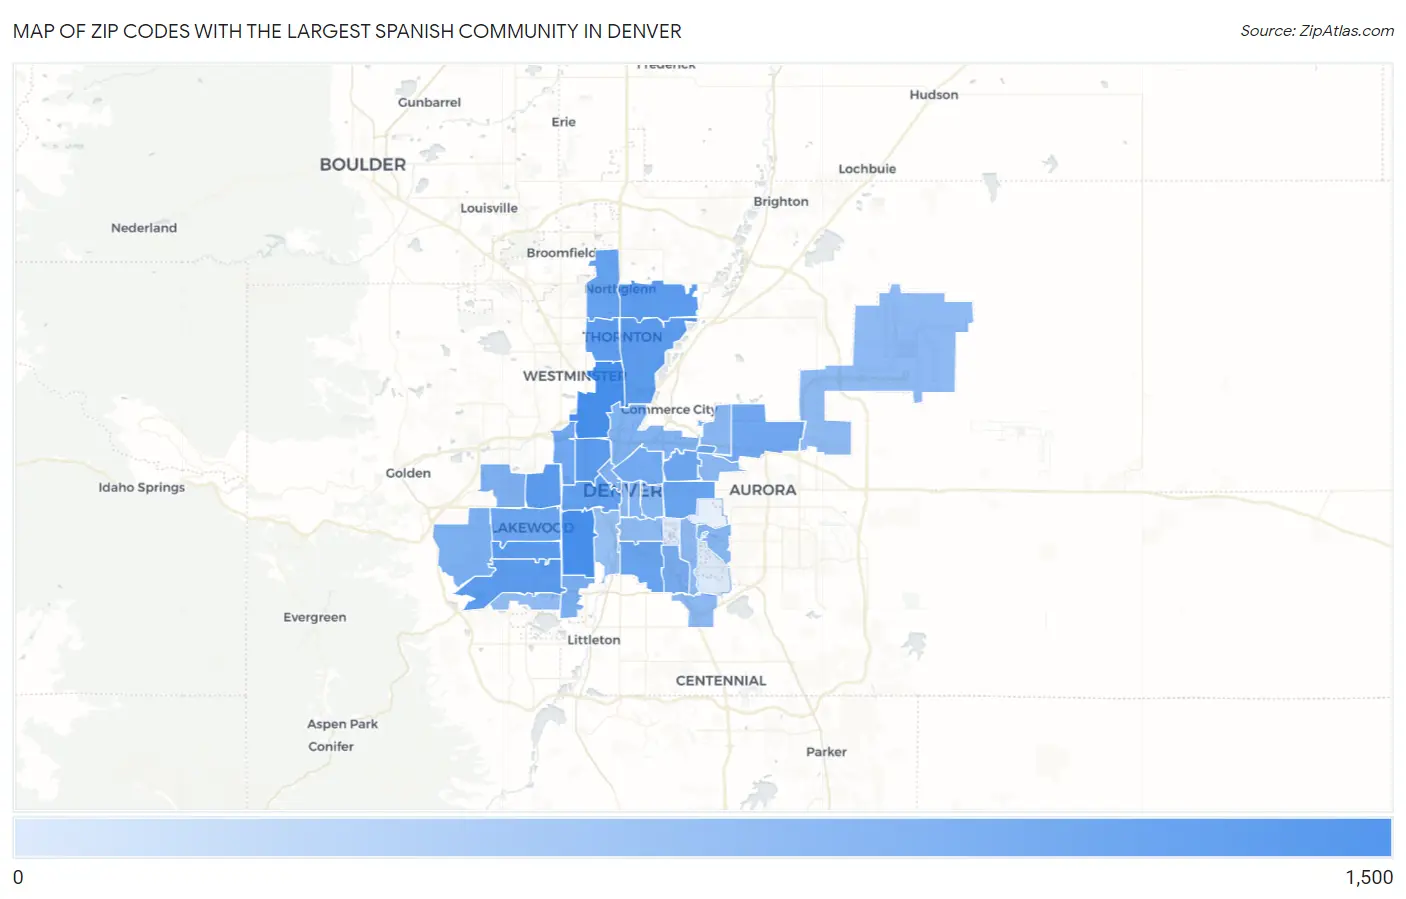
Map of Zip Codes with the Largest Spanish Community in Denver
0
1,500
Zip Codes with the Largest Spanish Community in Denver, CO
| Zip Code | Spanish | vs State | vs National | |
| 1. | 80219 | 1,482 | 63,513(2.33%)#2 | 776,448(0.19%)#18 |
| 2. | 80221 | 1,462 | 63,513(2.30%)#3 | 776,448(0.19%)#21 |
| 3. | 80211 | 724 | 63,513(1.14%)#12 | 776,448(0.09%)#65 |
| 4. | 80229 | 698 | 63,513(1.10%)#15 | 776,448(0.09%)#71 |
| 5. | 80232 | 672 | 63,513(1.06%)#17 | 776,448(0.09%)#81 |
| 6. | 80233 | 656 | 63,513(1.03%)#20 | 776,448(0.08%)#84 |
| 7. | 80227 | 650 | 63,513(1.02%)#21 | 776,448(0.08%)#86 |
| 8. | 80214 | 601 | 63,513(0.95%)#24 | 776,448(0.08%)#100 |
| 9. | 80260 | 546 | 63,513(0.86%)#29 | 776,448(0.07%)#118 |
| 10. | 80204 | 484 | 63,513(0.76%)#42 | 776,448(0.06%)#162 |
| 11. | 80234 | 420 | 63,513(0.66%)#52 | 776,448(0.05%)#226 |
| 12. | 80220 | 365 | 63,513(0.57%)#60 | 776,448(0.05%)#300 |
| 13. | 80210 | 364 | 63,513(0.57%)#61 | 776,448(0.05%)#301 |
| 14. | 80226 | 320 | 63,513(0.50%)#71 | 776,448(0.04%)#388 |
| 15. | 80207 | 285 | 63,513(0.45%)#82 | 776,448(0.04%)#496 |
| 16. | 80212 | 272 | 63,513(0.43%)#86 | 776,448(0.04%)#538 |
| 17. | 80239 | 262 | 63,513(0.41%)#90 | 776,448(0.03%)#566 |
| 18. | 80205 | 238 | 63,513(0.37%)#95 | 776,448(0.03%)#672 |
| 19. | 80222 | 190 | 63,513(0.30%)#112 | 776,448(0.02%)#961 |
| 20. | 80236 | 177 | 63,513(0.28%)#120 | 776,448(0.02%)#1,077 |
| 21. | 80228 | 165 | 63,513(0.26%)#123 | 776,448(0.02%)#1,191 |
| 22. | 80215 | 147 | 63,513(0.23%)#131 | 776,448(0.02%)#1,384 |
| 23. | 80216 | 140 | 63,513(0.22%)#133 | 776,448(0.02%)#1,449 |
| 24. | 80202 | 138 | 63,513(0.22%)#135 | 776,448(0.02%)#1,478 |
| 25. | 80218 | 121 | 63,513(0.19%)#145 | 776,448(0.02%)#1,745 |
| 26. | 80206 | 118 | 63,513(0.19%)#147 | 776,448(0.02%)#1,805 |
| 27. | 80247 | 105 | 63,513(0.17%)#152 | 776,448(0.01%)#2,057 |
| 28. | 80238 | 94 | 63,513(0.15%)#157 | 776,448(0.01%)#2,296 |
| 29. | 80224 | 83 | 63,513(0.13%)#166 | 776,448(0.01%)#2,581 |
| 30. | 80203 | 81 | 63,513(0.13%)#168 | 776,448(0.01%)#2,633 |
| 31. | 80237 | 80 | 63,513(0.13%)#170 | 776,448(0.01%)#2,665 |
| 32. | 80209 | 75 | 63,513(0.12%)#174 | 776,448(0.01%)#2,807 |
| 33. | 80249 | 74 | 63,513(0.12%)#176 | 776,448(0.01%)#2,828 |
| 34. | 80235 | 71 | 63,513(0.11%)#179 | 776,448(0.01%)#2,968 |
| 35. | 80223 | 57 | 63,513(0.09%)#191 | 776,448(0.01%)#3,536 |
| 36. | 80231 | 2 | 63,513(0.00%)#285 | 776,448(0.00%)#9,629 |
| 37. | 80246 | 2 | 63,513(0.00%)#286 | 776,448(0.00%)#9,653 |
1
Common Questions
What are the Top 10 Zip Codes with the Largest Spanish Community in Denver, CO?
Top 10 Zip Codes with the Largest Spanish Community in Denver, CO are:
What zip code has the Largest Spanish Community in Denver, CO?
80219 has the Largest Spanish Community in Denver, CO with 1,482.
What is the Total Spanish Population in Denver, CO?
Total Spanish Population in Denver is 6,911.
What is the Total Spanish Population in Colorado?
Total Spanish Population in Colorado is 63,513.
What is the Total Spanish Population in the United States?
Total Spanish Population in the United States is 776,448.