Zip Codes with the Highest Percentage of Population Employed in Installation, Maintenance & Repair in Denver, CO
RELATED REPORTS & OPTIONS
Installation, Maintenance & Repair
Denver
Compare Zip Codes
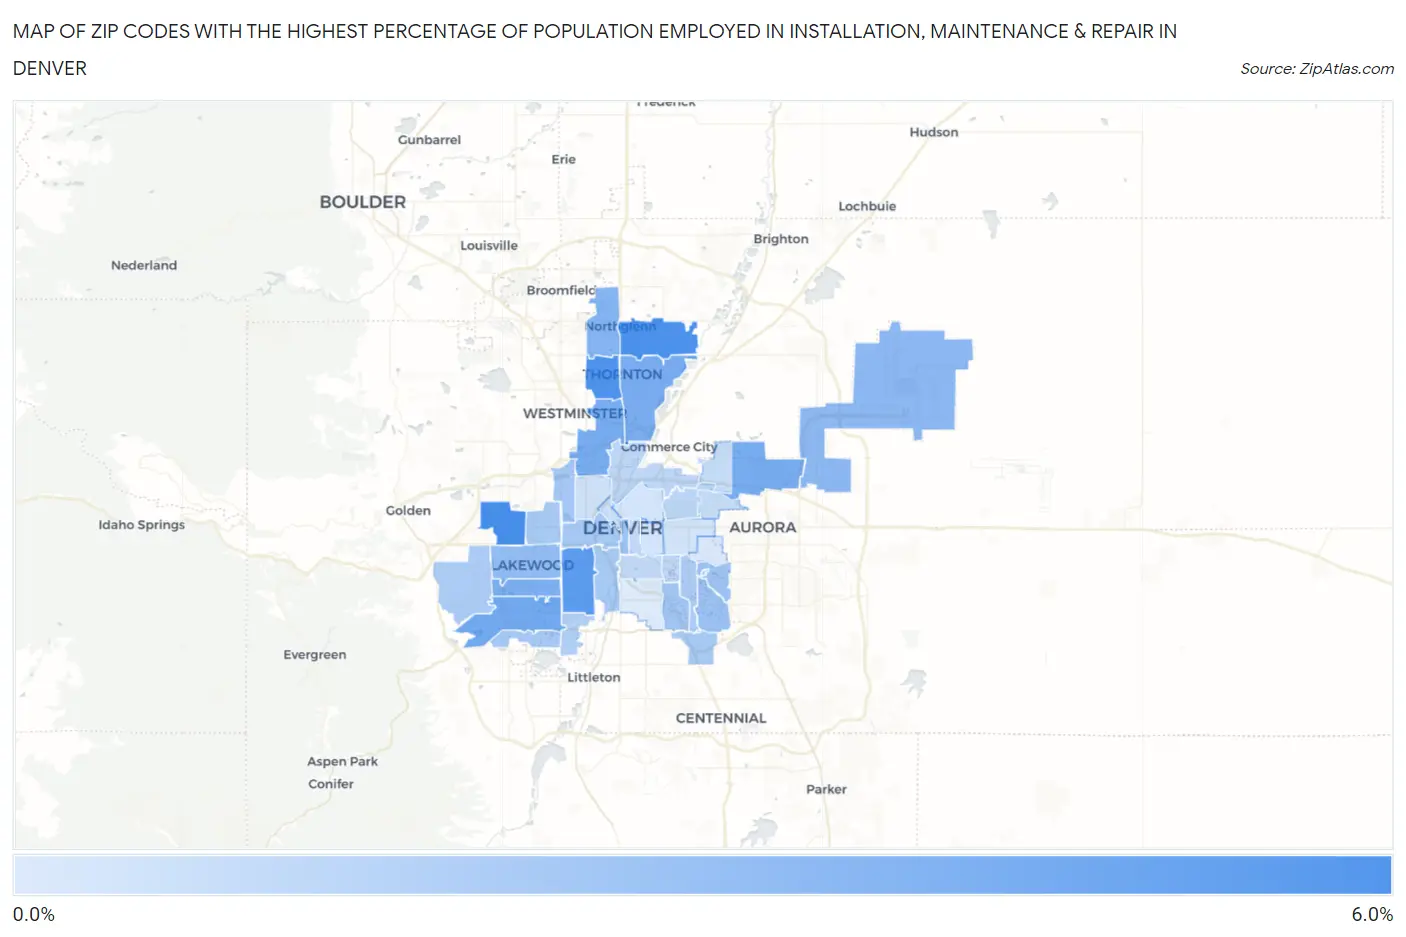
Map of Zip Codes with the Highest Percentage of Population Employed in Installation, Maintenance & Repair in Denver
0.0%
6.0%
Zip Codes with the Highest Percentage of Population Employed in Installation, Maintenance & Repair in Denver, CO
| Zip Code | % Employed | vs State | vs National | |
| 1. | 80215 | 5.4% | 2.8%(+2.60)#98 | 3.1%(+2.36)#7,473 |
| 2. | 80233 | 5.3% | 2.8%(+2.46)#103 | 3.1%(+2.21)#7,865 |
| 3. | 80260 | 5.2% | 2.8%(+2.38)#108 | 3.1%(+2.14)#8,087 |
| 4. | 80219 | 4.7% | 2.8%(+1.90)#126 | 3.1%(+1.65)#9,618 |
| 5. | 80227 | 3.9% | 2.8%(+1.11)#149 | 3.1%(+0.864)#12,661 |
| 6. | 80239 | 3.7% | 2.8%(+0.918)#162 | 3.1%(+0.672)#13,510 |
| 7. | 80221 | 3.7% | 2.8%(+0.881)#166 | 3.1%(+0.635)#13,666 |
| 8. | 80229 | 3.6% | 2.8%(+0.812)#175 | 3.1%(+0.566)#14,017 |
| 9. | 80232 | 3.6% | 2.8%(+0.772)#177 | 3.1%(+0.526)#14,181 |
| 10. | 80234 | 3.3% | 2.8%(+0.452)#204 | 3.1%(+0.206)#15,692 |
| 11. | 80249 | 3.0% | 2.8%(+0.197)#223 | 3.1%(-0.049)#16,887 |
| 12. | 80226 | 2.8% | 2.8%(-0.008)#232 | 3.1%(-0.254)#17,937 |
| 13. | 80231 | 2.5% | 2.8%(-0.307)#260 | 3.1%(-0.553)#19,476 |
| 14. | 80203 | 2.4% | 2.8%(-0.424)#271 | 3.1%(-0.670)#20,073 |
| 15. | 80247 | 2.3% | 2.8%(-0.508)#285 | 3.1%(-0.754)#20,511 |
| 16. | 80222 | 2.2% | 2.8%(-0.590)#291 | 3.1%(-0.836)#20,929 |
| 17. | 80212 | 2.2% | 2.8%(-0.645)#297 | 3.1%(-0.892)#21,193 |
| 18. | 80235 | 2.1% | 2.8%(-0.681)#299 | 3.1%(-0.927)#21,345 |
| 19. | 80214 | 2.1% | 2.8%(-0.736)#303 | 3.1%(-0.982)#21,601 |
| 20. | 80223 | 2.1% | 2.8%(-0.753)#306 | 3.1%(-0.999)#21,697 |
| 21. | 80237 | 2.1% | 2.8%(-0.757)#307 | 3.1%(-1.00)#21,713 |
| 22. | 80204 | 2.1% | 2.8%(-0.768)#308 | 3.1%(-1.01)#21,766 |
| 23. | 80228 | 1.9% | 2.8%(-0.924)#317 | 3.1%(-1.17)#22,473 |
| 24. | 80224 | 1.9% | 2.8%(-0.940)#318 | 3.1%(-1.19)#22,532 |
| 25. | 80236 | 1.6% | 2.8%(-1.17)#332 | 3.1%(-1.42)#23,564 |
| 26. | 80207 | 1.4% | 2.8%(-1.42)#350 | 3.1%(-1.66)#24,535 |
| 27. | 80216 | 1.4% | 2.8%(-1.46)#356 | 3.1%(-1.70)#24,671 |
| 28. | 80246 | 1.3% | 2.8%(-1.56)#360 | 3.1%(-1.80)#25,018 |
| 29. | 80218 | 1.3% | 2.8%(-1.57)#362 | 3.1%(-1.82)#25,076 |
| 30. | 80209 | 1.1% | 2.8%(-1.70)#371 | 3.1%(-1.95)#25,525 |
| 31. | 80238 | 1.1% | 2.8%(-1.76)#375 | 3.1%(-2.00)#25,716 |
| 32. | 80202 | 0.82% | 2.8%(-2.00)#390 | 3.1%(-2.24)#26,414 |
| 33. | 80211 | 0.72% | 2.8%(-2.10)#395 | 3.1%(-2.35)#26,727 |
| 34. | 80220 | 0.68% | 2.8%(-2.14)#397 | 3.1%(-2.39)#26,840 |
| 35. | 80206 | 0.59% | 2.8%(-2.23)#401 | 3.1%(-2.47)#27,022 |
| 36. | 80205 | 0.58% | 2.8%(-2.25)#404 | 3.1%(-2.49)#27,058 |
| 37. | 80230 | 0.43% | 2.8%(-2.39)#407 | 3.1%(-2.63)#27,329 |
| 38. | 80210 | 0.29% | 2.8%(-2.54)#408 | 3.1%(-2.78)#27,581 |
1
Common Questions
What are the Top 10 Zip Codes with the Highest Percentage of Population Employed in Installation, Maintenance & Repair in Denver, CO?
Top 10 Zip Codes with the Highest Percentage of Population Employed in Installation, Maintenance & Repair in Denver, CO are:
What zip code has the Highest Percentage of Population Employed in Installation, Maintenance & Repair in Denver, CO?
80215 has the Highest Percentage of Population Employed in Installation, Maintenance & Repair in Denver, CO with 5.4%.
What is the Percentage of Population Employed in Installation, Maintenance & Repair in Denver, CO?
Percentage of Population Employed in Installation, Maintenance & Repair in Denver is 1.9%.
What is the Percentage of Population Employed in Installation, Maintenance & Repair in Colorado?
Percentage of Population Employed in Installation, Maintenance & Repair in Colorado is 2.8%.
What is the Percentage of Population Employed in Installation, Maintenance & Repair in the United States?
Percentage of Population Employed in Installation, Maintenance & Repair in the United States is 3.1%.