Zip Codes with the Highest Percentage of Population with a Degree in Communications in Denver, CO
RELATED REPORTS & OPTIONS
Communications
Denver
Compare Zip Codes
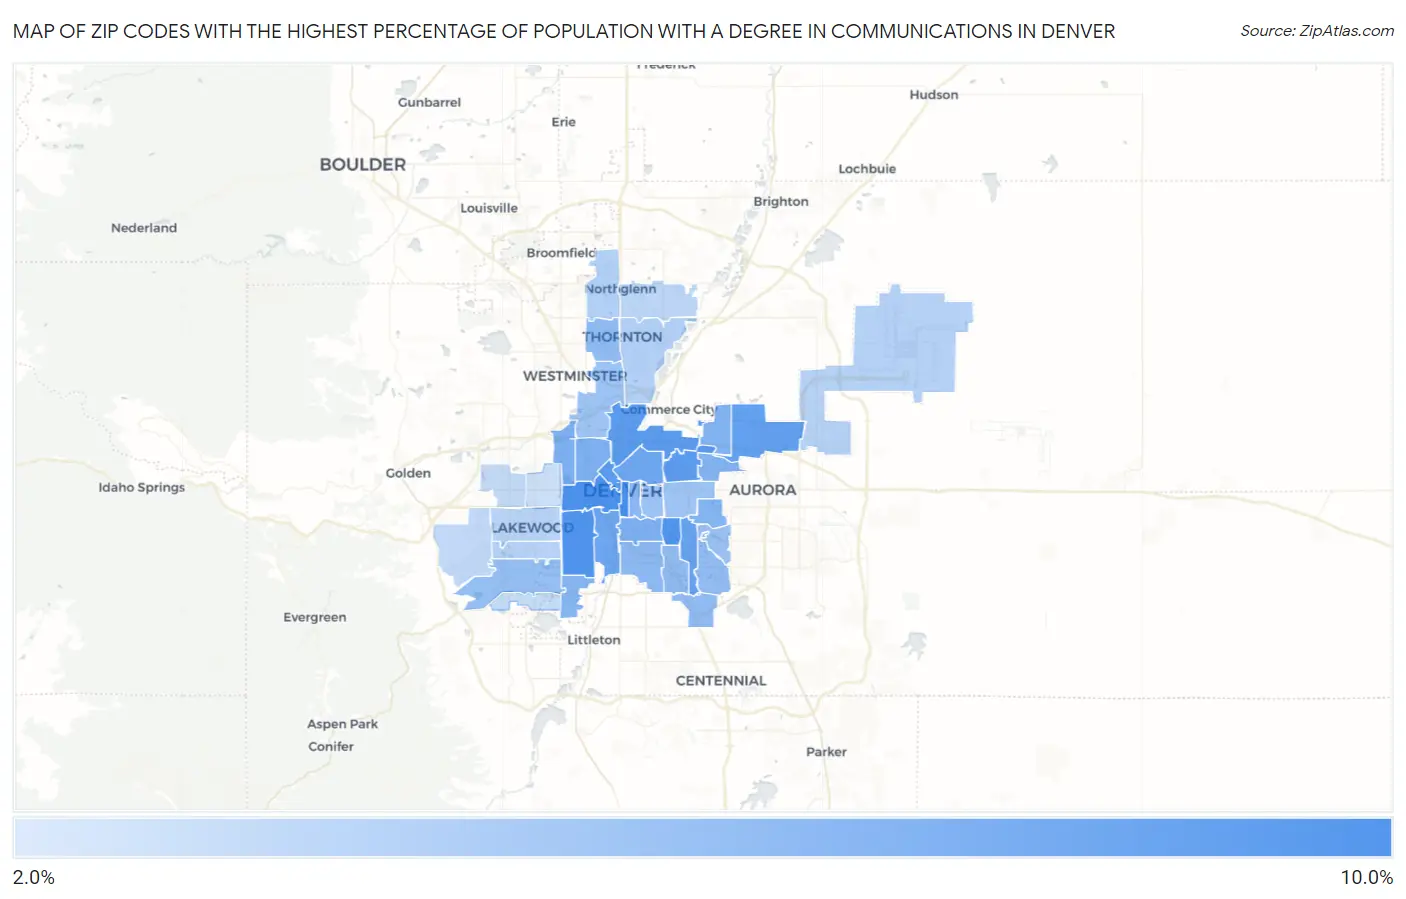
Map of Zip Codes with the Highest Percentage of Population with a Degree in Communications in Denver
0.0%
10.0%
Zip Codes with the Highest Percentage of Population with a Degree in Communications in Denver, CO
| Zip Code | % Graduates | vs State | vs National | |
| 1. | 80203 | 9.3% | 4.8%(+4.53)#24 | 4.1%(+5.17)#1,326 |
| 2. | 80204 | 9.1% | 4.8%(+4.30)#27 | 4.1%(+4.94)#1,411 |
| 3. | 80219 | 8.8% | 4.8%(+4.07)#29 | 4.1%(+4.71)#1,495 |
| 4. | 80246 | 8.7% | 4.8%(+3.96)#30 | 4.1%(+4.59)#1,531 |
| 5. | 80207 | 8.5% | 4.8%(+3.69)#32 | 4.1%(+4.33)#1,645 |
| 6. | 80202 | 8.4% | 4.8%(+3.60)#33 | 4.1%(+4.24)#1,687 |
| 7. | 80216 | 8.3% | 4.8%(+3.53)#36 | 4.1%(+4.17)#1,729 |
| 8. | 80239 | 8.1% | 4.8%(+3.29)#39 | 4.1%(+3.93)#1,843 |
| 9. | 80224 | 7.8% | 4.8%(+3.07)#45 | 4.1%(+3.71)#1,968 |
| 10. | 80223 | 7.5% | 4.8%(+2.74)#49 | 4.1%(+3.37)#2,183 |
| 11. | 80205 | 7.5% | 4.8%(+2.72)#50 | 4.1%(+3.35)#2,202 |
| 12. | 80212 | 6.8% | 4.8%(+2.01)#59 | 4.1%(+2.65)#2,805 |
| 13. | 80211 | 6.8% | 4.8%(+1.99)#61 | 4.1%(+2.63)#2,827 |
| 14. | 80209 | 6.7% | 4.8%(+1.97)#63 | 4.1%(+2.60)#2,869 |
| 15. | 80230 | 6.6% | 4.8%(+1.82)#68 | 4.1%(+2.46)#3,029 |
| 16. | 80238 | 6.5% | 4.8%(+1.75)#71 | 4.1%(+2.39)#3,104 |
| 17. | 80236 | 6.4% | 4.8%(+1.61)#75 | 4.1%(+2.24)#3,276 |
| 18. | 80218 | 6.3% | 4.8%(+1.50)#77 | 4.1%(+2.13)#3,402 |
| 19. | 80210 | 6.1% | 4.8%(+1.37)#80 | 4.1%(+2.01)#3,552 |
| 20. | 80222 | 6.0% | 4.8%(+1.20)#83 | 4.1%(+1.84)#3,824 |
| 21. | 80237 | 6.0% | 4.8%(+1.19)#84 | 4.1%(+1.83)#3,839 |
| 22. | 80260 | 5.9% | 4.8%(+1.12)#86 | 4.1%(+1.76)#3,949 |
| 23. | 80231 | 5.8% | 4.8%(+1.02)#92 | 4.1%(+1.66)#4,122 |
| 24. | 80227 | 5.7% | 4.8%(+0.970)#95 | 4.1%(+1.61)#4,192 |
| 25. | 80247 | 5.4% | 4.8%(+0.644)#105 | 4.1%(+1.28)#4,803 |
| 26. | 80206 | 5.4% | 4.8%(+0.610)#106 | 4.1%(+1.25)#4,880 |
| 27. | 80220 | 5.3% | 4.8%(+0.551)#109 | 4.1%(+1.19)#4,985 |
| 28. | 80221 | 5.3% | 4.8%(+0.504)#111 | 4.1%(+1.14)#5,081 |
| 29. | 80229 | 4.4% | 4.8%(-0.379)#154 | 4.1%(+0.259)#7,268 |
| 30. | 80234 | 4.3% | 4.8%(-0.439)#163 | 4.1%(+0.199)#7,481 |
| 31. | 80249 | 4.2% | 4.8%(-0.527)#167 | 4.1%(+0.111)#7,750 |
| 32. | 80232 | 4.2% | 4.8%(-0.561)#171 | 4.1%(+0.076)#7,857 |
| 33. | 80226 | 4.1% | 4.8%(-0.635)#174 | 4.1%(+0.003)#8,104 |
| 34. | 80233 | 3.9% | 4.8%(-0.843)#192 | 4.1%(-0.205)#8,815 |
| 35. | 80228 | 3.8% | 4.8%(-0.959)#199 | 4.1%(-0.322)#9,231 |
| 36. | 80215 | 3.7% | 4.8%(-1.07)#208 | 4.1%(-0.432)#9,618 |
| 37. | 80235 | 3.5% | 4.8%(-1.24)#219 | 4.1%(-0.605)#10,208 |
| 38. | 80214 | 3.2% | 4.8%(-1.55)#238 | 4.1%(-0.915)#11,377 |
| 39. | 80290 | 2.6% | 4.8%(-2.22)#268 | 4.1%(-1.58)#13,959 |
1
Common Questions
What are the Top 10 Zip Codes with the Highest Percentage of Population with a Degree in Communications in Denver, CO?
Top 10 Zip Codes with the Highest Percentage of Population with a Degree in Communications in Denver, CO are:
What zip code has the Highest Percentage of Population with a Degree in Communications in Denver, CO?
80203 has the Highest Percentage of Population with a Degree in Communications in Denver, CO with 9.3%.
What is the Percentage of Population with a Degree in Communications in Denver, CO?
Percentage of Population with a Degree in Communications in Denver is 6.9%.
What is the Percentage of Population with a Degree in Communications in Colorado?
Percentage of Population with a Degree in Communications in Colorado is 4.8%.
What is the Percentage of Population with a Degree in Communications in the United States?
Percentage of Population with a Degree in Communications in the United States is 4.1%.