Zip Codes with the Highest Percentage of Population Employed in Health Diagnosing & Treating in Castle Rock, CO
RELATED REPORTS & OPTIONS
Health Diagnosing & Treating
Castle Rock
Compare Zip Codes
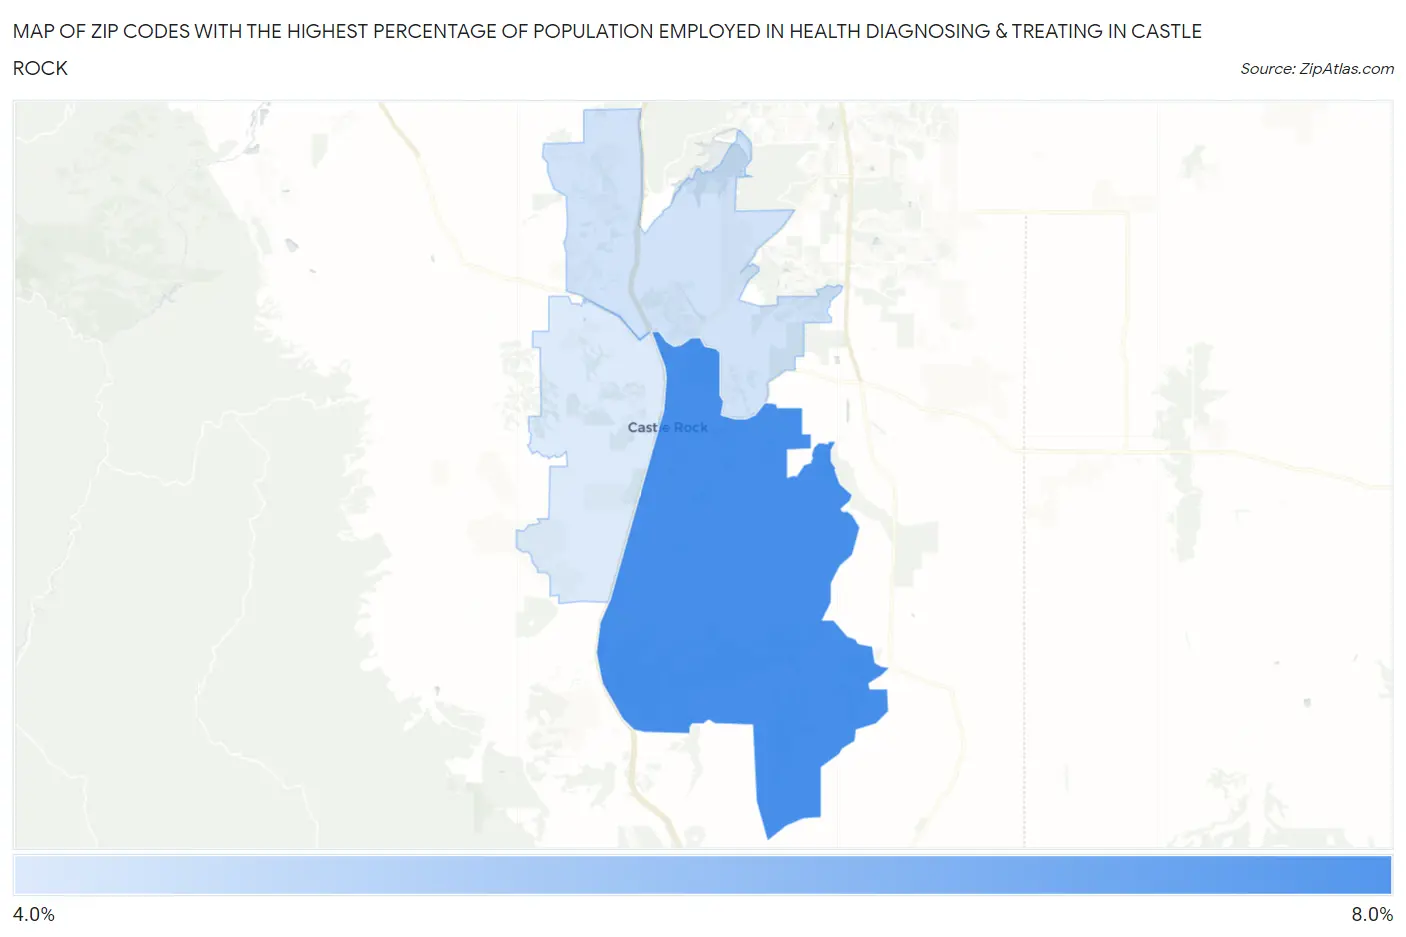
Map of Zip Codes with the Highest Percentage of Population Employed in Health Diagnosing & Treating in Castle Rock
0.0%
8.0%
Zip Codes with the Highest Percentage of Population Employed in Health Diagnosing & Treating in Castle Rock, CO
| Zip Code | % Employed | vs State | vs National | |
| 1. | 80104 | 6.4% | 5.8%(+0.594)#167 | 6.2%(+0.157)#12,376 |
| 2. | 80108 | 4.4% | 5.8%(-1.45)#287 | 6.2%(-1.89)#20,150 |
| 3. | 80109 | 4.2% | 5.8%(-1.61)#294 | 6.2%(-2.05)#20,716 |
1
Common Questions
What are the Top Zip Codes with the Highest Percentage of Population Employed in Health Diagnosing & Treating in Castle Rock, CO?
Top Zip Codes with the Highest Percentage of Population Employed in Health Diagnosing & Treating in Castle Rock, CO are:
What zip code has the Highest Percentage of Population Employed in Health Diagnosing & Treating in Castle Rock, CO?
80104 has the Highest Percentage of Population Employed in Health Diagnosing & Treating in Castle Rock, CO with 6.4%.
What is the Percentage of Population Employed in Health Diagnosing & Treating in Castle Rock, CO?
Percentage of Population Employed in Health Diagnosing & Treating in Castle Rock is 5.1%.
What is the Percentage of Population Employed in Health Diagnosing & Treating in Colorado?
Percentage of Population Employed in Health Diagnosing & Treating in Colorado is 5.8%.
What is the Percentage of Population Employed in Health Diagnosing & Treating in the United States?
Percentage of Population Employed in Health Diagnosing & Treating in the United States is 6.2%.