Zip Codes with the Highest Percentage of Population with a Degree in Engineering in Denver, CO
RELATED REPORTS & OPTIONS
Engineering
Denver
Compare Zip Codes
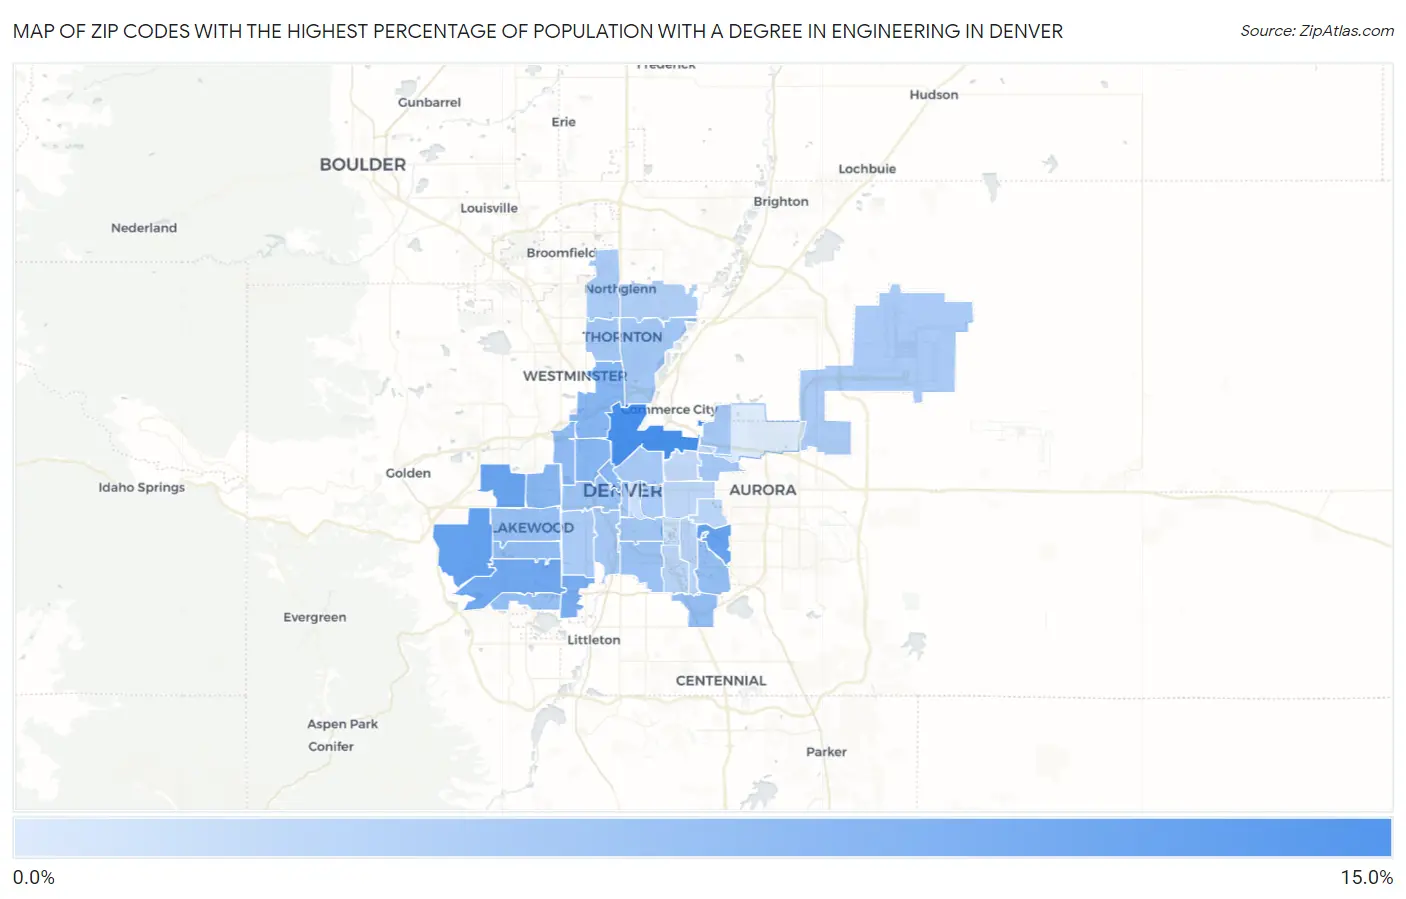
Map of Zip Codes with the Highest Percentage of Population with a Degree in Engineering in Denver
0.0%
15.0%
Zip Codes with the Highest Percentage of Population with a Degree in Engineering in Denver, CO
| Zip Code | % Graduates | vs State | vs National | |
| 1. | 80216 | 14.8% | 8.3%(+6.58)#32 | 7.6%(+7.20)#1,783 |
| 2. | 80228 | 12.1% | 8.3%(+3.85)#57 | 7.6%(+4.46)#2,840 |
| 3. | 80215 | 11.8% | 8.3%(+3.53)#63 | 7.6%(+4.15)#3,000 |
| 4. | 80247 | 11.7% | 8.3%(+3.46)#64 | 7.6%(+4.08)#3,039 |
| 5. | 80290 | 11.5% | 8.3%(+3.23)#68 | 7.6%(+3.84)#3,186 |
| 6. | 80227 | 11.1% | 8.3%(+2.88)#79 | 7.6%(+3.49)#3,436 |
| 7. | 80236 | 10.4% | 8.3%(+2.18)#97 | 7.6%(+2.79)#4,030 |
| 8. | 80214 | 9.3% | 8.3%(+1.06)#120 | 7.6%(+1.67)#5,181 |
| 9. | 80221 | 9.3% | 8.3%(+1.05)#121 | 7.6%(+1.66)#5,188 |
| 10. | 80211 | 9.2% | 8.3%(+0.925)#128 | 7.6%(+1.54)#5,334 |
| 11. | 80202 | 8.9% | 8.3%(+0.609)#138 | 7.6%(+1.22)#5,776 |
| 12. | 80212 | 8.4% | 8.3%(+0.137)#151 | 7.6%(+0.751)#6,424 |
| 13. | 80237 | 8.2% | 8.3%(-0.069)#156 | 7.6%(+0.544)#6,766 |
| 14. | 80232 | 8.2% | 8.3%(-0.077)#158 | 7.6%(+0.536)#6,785 |
| 15. | 80231 | 8.2% | 8.3%(-0.092)#159 | 7.6%(+0.521)#6,803 |
| 16. | 80235 | 8.0% | 8.3%(-0.222)#162 | 7.6%(+0.392)#7,026 |
| 17. | 80226 | 7.9% | 8.3%(-0.347)#166 | 7.6%(+0.267)#7,248 |
| 18. | 80210 | 7.8% | 8.3%(-0.498)#171 | 7.6%(+0.115)#7,506 |
| 19. | 80204 | 7.7% | 8.3%(-0.565)#174 | 7.6%(+0.048)#7,640 |
| 20. | 80229 | 7.0% | 8.3%(-1.24)#192 | 7.6%(-0.626)#8,926 |
| 21. | 80260 | 6.9% | 8.3%(-1.31)#194 | 7.6%(-0.699)#9,113 |
| 22. | 80209 | 6.9% | 8.3%(-1.41)#198 | 7.6%(-0.797)#9,300 |
| 23. | 80223 | 6.8% | 8.3%(-1.43)#200 | 7.6%(-0.819)#9,351 |
| 24. | 80203 | 6.8% | 8.3%(-1.51)#203 | 7.6%(-0.895)#9,506 |
| 25. | 80205 | 6.7% | 8.3%(-1.54)#208 | 7.6%(-0.925)#9,574 |
| 26. | 80238 | 6.7% | 8.3%(-1.61)#212 | 7.6%(-0.997)#9,725 |
| 27. | 80249 | 6.4% | 8.3%(-1.83)#218 | 7.6%(-1.21)#10,144 |
| 28. | 80219 | 6.4% | 8.3%(-1.84)#220 | 7.6%(-1.23)#10,169 |
| 29. | 80206 | 6.4% | 8.3%(-1.89)#221 | 7.6%(-1.27)#10,289 |
| 30. | 80234 | 6.4% | 8.3%(-1.91)#223 | 7.6%(-1.29)#10,333 |
| 31. | 80233 | 6.1% | 8.3%(-2.19)#231 | 7.6%(-1.58)#11,019 |
| 32. | 80224 | 5.1% | 8.3%(-3.13)#267 | 7.6%(-2.51)#13,334 |
| 33. | 80230 | 5.1% | 8.3%(-3.15)#269 | 7.6%(-2.53)#13,390 |
| 34. | 80222 | 5.0% | 8.3%(-3.21)#273 | 7.6%(-2.60)#13,550 |
| 35. | 80220 | 4.9% | 8.3%(-3.36)#282 | 7.6%(-2.74)#13,959 |
| 36. | 80207 | 4.4% | 8.3%(-3.82)#296 | 7.6%(-3.21)#15,215 |
| 37. | 80246 | 3.9% | 8.3%(-4.39)#319 | 7.6%(-3.78)#16,699 |
| 38. | 80218 | 3.6% | 8.3%(-4.65)#330 | 7.6%(-4.04)#17,379 |
| 39. | 80239 | 2.3% | 8.3%(-6.00)#372 | 7.6%(-5.38)#20,457 |
1
Common Questions
What are the Top 10 Zip Codes with the Highest Percentage of Population with a Degree in Engineering in Denver, CO?
Top 10 Zip Codes with the Highest Percentage of Population with a Degree in Engineering in Denver, CO are:
What zip code has the Highest Percentage of Population with a Degree in Engineering in Denver, CO?
80216 has the Highest Percentage of Population with a Degree in Engineering in Denver, CO with 14.8%.
What is the Percentage of Population with a Degree in Engineering in Denver, CO?
Percentage of Population with a Degree in Engineering in Denver is 6.9%.
What is the Percentage of Population with a Degree in Engineering in Colorado?
Percentage of Population with a Degree in Engineering in Colorado is 8.3%.
What is the Percentage of Population with a Degree in Engineering in the United States?
Percentage of Population with a Degree in Engineering in the United States is 7.6%.