Zip Codes with the Highest Percentage of Households with Income Above $100,000 in Denver, CO
RELATED REPORTS & OPTIONS
Household Income | $100k+
Denver
Compare Zip Codes
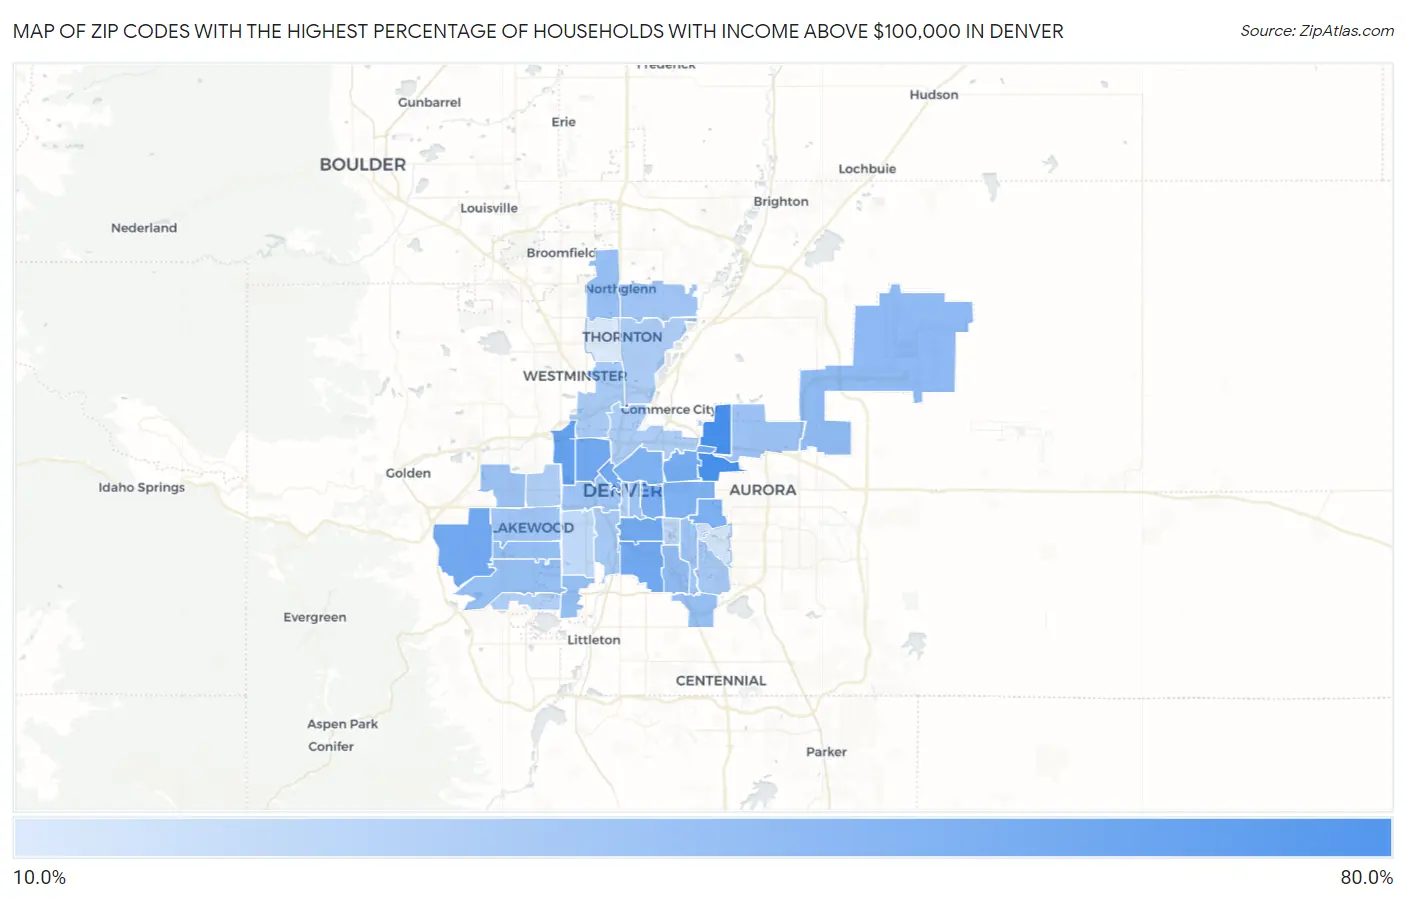
Map of Zip Codes with the Highest Percentage of Households with Income Above $100,000 in Denver
0.0%
80.0%
Zip Codes with the Highest Percentage of Households with Income Above $100,000 in Denver, CO
| Zip Code | Households with Income > $100k | vs State | vs National | |
| 1. | 80238 | 69.4% | 43.9%(+25.5)#21 | 37.3%(+32.1)#1,017 |
| 2. | 80290 | 59.3% | 43.9%(+15.4)#61 | 37.3%(+22.0)#2,513 |
| 3. | 80212 | 58.3% | 43.9%(+14.4)#63 | 37.3%(+21.0)#2,709 |
| 4. | 80210 | 54.3% | 43.9%(+10.4)#82 | 37.3%(+17.0)#3,637 |
| 5. | 80228 | 54.2% | 43.9%(+10.3)#83 | 37.3%(+16.9)#3,659 |
| 6. | 80211 | 54.0% | 43.9%(+10.1)#84 | 37.3%(+16.7)#3,709 |
| 7. | 80209 | 53.3% | 43.9%(+9.40)#89 | 37.3%(+16.0)#3,888 |
| 8. | 80202 | 52.9% | 43.9%(+9.00)#92 | 37.3%(+15.6)#3,990 |
| 9. | 80207 | 52.1% | 43.9%(+8.20)#97 | 37.3%(+14.8)#4,213 |
| 10. | 80206 | 50.4% | 43.9%(+6.50)#107 | 37.3%(+13.1)#4,711 |
| 11. | 80230 | 50.0% | 43.9%(+6.10)#113 | 37.3%(+12.7)#4,825 |
| 12. | 80220 | 48.9% | 43.9%(+5.00)#123 | 37.3%(+11.6)#5,195 |
| 13. | 80205 | 48.9% | 43.9%(+5.00)#124 | 37.3%(+11.6)#5,196 |
| 14. | 80249 | 43.4% | 43.9%(-0.500)#163 | 37.3%(+6.10)#7,240 |
| 15. | 80222 | 43.1% | 43.9%(-0.800)#164 | 37.3%(+5.80)#7,378 |
| 16. | 80237 | 41.7% | 43.9%(-2.20)#175 | 37.3%(+4.40)#8,029 |
| 17. | 80232 | 41.6% | 43.9%(-2.30)#176 | 37.3%(+4.30)#8,076 |
| 18. | 80227 | 41.5% | 43.9%(-2.40)#177 | 37.3%(+4.20)#8,106 |
| 19. | 80236 | 41.1% | 43.9%(-2.80)#184 | 37.3%(+3.80)#8,344 |
| 20. | 80234 | 41.0% | 43.9%(-2.90)#188 | 37.3%(+3.70)#8,398 |
| 21. | 80215 | 40.2% | 43.9%(-3.70)#195 | 37.3%(+2.90)#8,791 |
| 22. | 80218 | 39.2% | 43.9%(-4.70)#211 | 37.3%(+1.90)#9,321 |
| 23. | 80239 | 39.1% | 43.9%(-4.80)#213 | 37.3%(+1.80)#9,362 |
| 24. | 80204 | 38.8% | 43.9%(-5.10)#217 | 37.3%(+1.50)#9,515 |
| 25. | 80224 | 38.2% | 43.9%(-5.70)#222 | 37.3%(+0.900)#9,869 |
| 26. | 80226 | 37.7% | 43.9%(-6.20)#226 | 37.3%(+0.400)#10,138 |
| 27. | 80233 | 37.6% | 43.9%(-6.30)#228 | 37.3%(+0.300)#10,190 |
| 28. | 80231 | 36.0% | 43.9%(-7.90)#246 | 37.3%(-1.30)#11,125 |
| 29. | 80223 | 35.9% | 43.9%(-8.00)#249 | 37.3%(-1.40)#11,196 |
| 30. | 80221 | 35.7% | 43.9%(-8.20)#251 | 37.3%(-1.60)#11,317 |
| 31. | 80229 | 34.4% | 43.9%(-9.50)#264 | 37.3%(-2.90)#12,132 |
| 32. | 80216 | 34.0% | 43.9%(-9.90)#268 | 37.3%(-3.30)#12,418 |
| 33. | 80214 | 33.5% | 43.9%(-10.4)#273 | 37.3%(-3.80)#12,770 |
| 34. | 80203 | 33.1% | 43.9%(-10.8)#276 | 37.3%(-4.20)#13,028 |
| 35. | 80235 | 32.6% | 43.9%(-11.3)#281 | 37.3%(-4.70)#13,401 |
| 36. | 80246 | 29.4% | 43.9%(-14.5)#311 | 37.3%(-7.90)#15,924 |
| 37. | 80219 | 28.9% | 43.9%(-15.0)#318 | 37.3%(-8.40)#16,303 |
| 38. | 80247 | 22.8% | 43.9%(-21.1)#381 | 37.3%(-14.5)#21,732 |
| 39. | 80260 | 20.0% | 43.9%(-23.9)#407 | 37.3%(-17.3)#24,015 |
1
Common Questions
What are the Top 10 Zip Codes with the Highest Percentage of Households with Income Above $100,000 in Denver, CO?
Top 10 Zip Codes with the Highest Percentage of Households with Income Above $100,000 in Denver, CO are:
What zip code has the Highest Percentage of Households with Income Above $100,000 in Denver, CO?
80238 has the Highest Percentage of Households with Income Above $100,000 in Denver, CO with 69.4%.
What is the Percentage of Households with Income Above $100,000 in Denver, CO?
Percentage of Households with Income Above $100,000 in Denver is 43.5%.
What is the Percentage of Households with Income Above $100,000 in Colorado?
Percentage of Households with Income Above $100,000 in Colorado is 43.9%.
What is the Percentage of Households with Income Above $100,000 in the United States?
Percentage of Households with Income Above $100,000 in the United States is 37.3%.