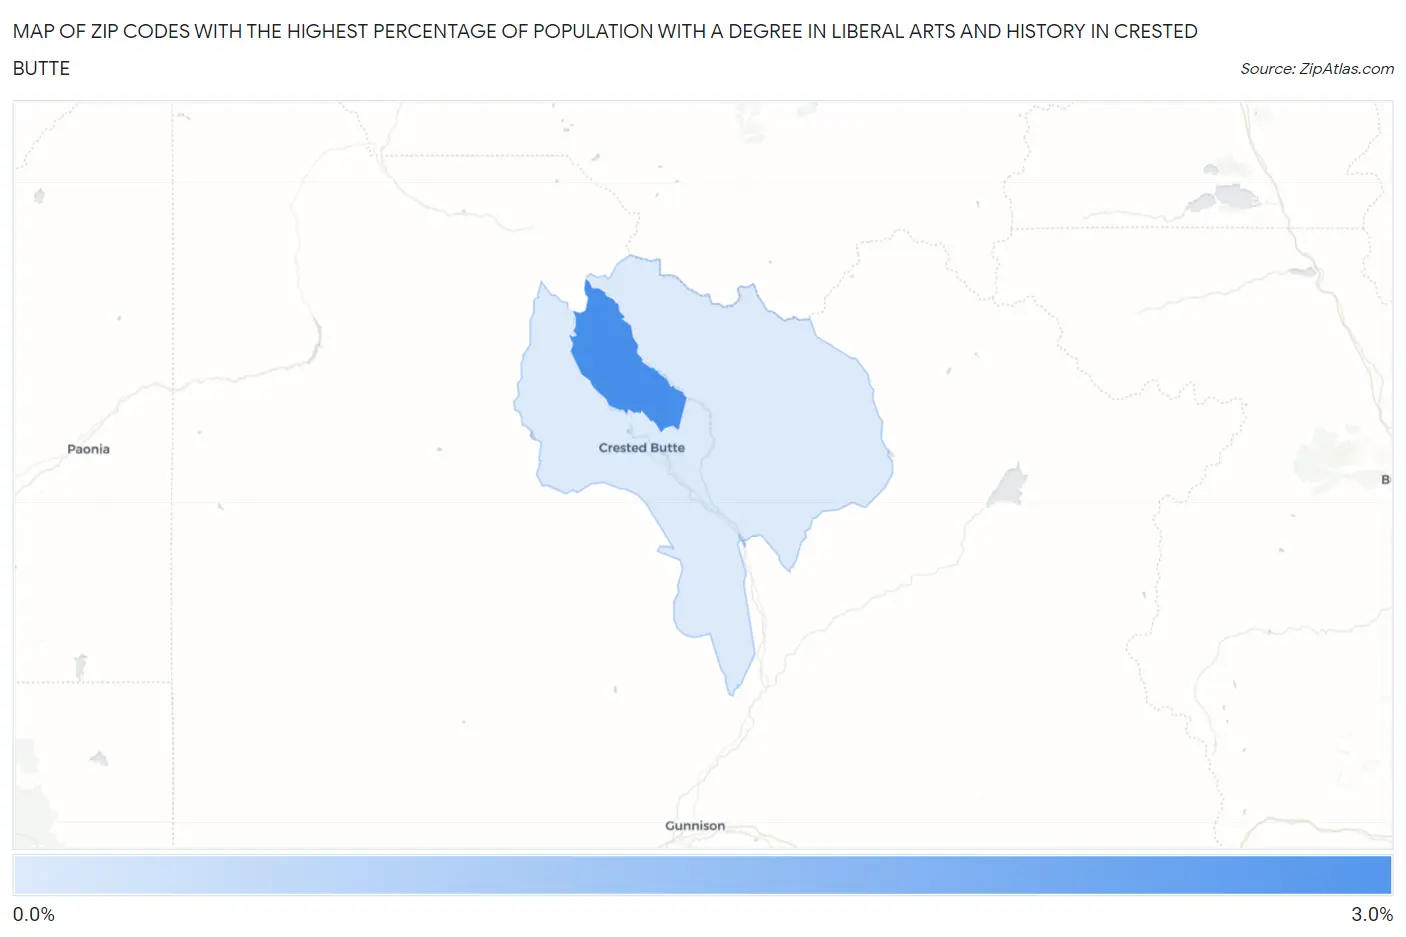
Zip Codes with the Highest Percentage of Population with a Degree in Liberal Arts and History in Crested Butte, CO
RELATED REPORTS & OPTIONS
Liberal Arts and History
Crested Butte
Compare Zip Codes
Map of Zip Codes with the Highest Percentage of Population with a Degree in Liberal Arts and History in Crested Butte
0.0%
3.0%
Zip Codes with the Highest Percentage of Population with a Degree in Liberal Arts and History in Crested Butte, CO
| Zip Code | % Graduates | vs State | vs National | |
| 1. | 81225 | 2.7% | 4.6%(-1.97)#316 | 4.9%(-2.21)#19,469 |
| 2. | 81224 | 0.92% | 4.6%(-3.71)#370 | 4.9%(-3.95)#23,515 |
1
Common Questions
What are the Top Zip Codes with the Highest Percentage of Population with a Degree in Liberal Arts and History in Crested Butte, CO?
Top Zip Codes with the Highest Percentage of Population with a Degree in Liberal Arts and History in Crested Butte, CO are:
What zip code has the Highest Percentage of Population with a Degree in Liberal Arts and History in Crested Butte, CO?
81225 has the Highest Percentage of Population with a Degree in Liberal Arts and History in Crested Butte, CO with 2.7%.
What is the Percentage of Population with a Degree in Liberal Arts and History in Colorado?
Percentage of Population with a Degree in Liberal Arts and History in Colorado is 4.6%.
What is the Percentage of Population with a Degree in Liberal Arts and History in the United States?
Percentage of Population with a Degree in Liberal Arts and History in the United States is 4.9%.