Zip Codes with the Highest Percentage of Population Employed in Arts, Entertainment & Recreation in Crested Butte, CO
RELATED REPORTS & OPTIONS
Arts, Entertainment & Recreation
Crested Butte
Compare Zip Codes
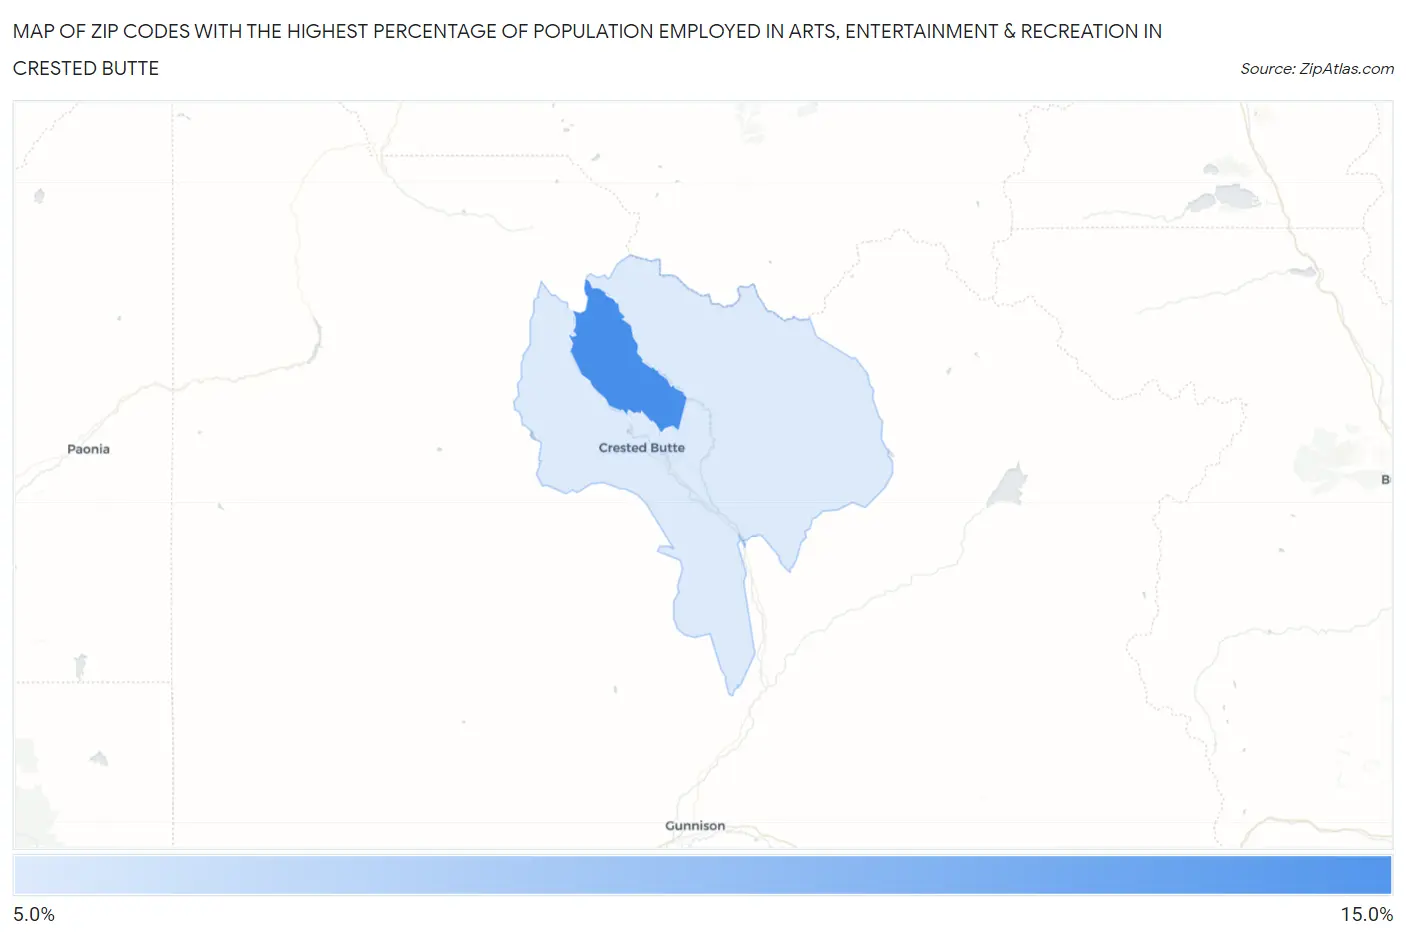
Map of Zip Codes with the Highest Percentage of Population Employed in Arts, Entertainment & Recreation in Crested Butte
0.0%
15.0%
Zip Codes with the Highest Percentage of Population Employed in Arts, Entertainment & Recreation in Crested Butte, CO
| Zip Code | % Employed | vs State | vs National | |
| 1. | 81225 | 14.3% | 2.6%(+11.7)#17 | 2.1%(+12.2)#373 |
| 2. | 81224 | 6.0% | 2.6%(+3.39)#55 | 2.1%(+3.88)#1,721 |
1
Common Questions
What are the Top Zip Codes with the Highest Percentage of Population Employed in Arts, Entertainment & Recreation in Crested Butte, CO?
Top Zip Codes with the Highest Percentage of Population Employed in Arts, Entertainment & Recreation in Crested Butte, CO are:
What zip code has the Highest Percentage of Population Employed in Arts, Entertainment & Recreation in Crested Butte, CO?
81225 has the Highest Percentage of Population Employed in Arts, Entertainment & Recreation in Crested Butte, CO with 14.3%.
What is the Percentage of Population Employed in Arts, Entertainment & Recreation in Crested Butte, CO?
Percentage of Population Employed in Arts, Entertainment & Recreation in Crested Butte is 13.8%.
What is the Percentage of Population Employed in Arts, Entertainment & Recreation in Colorado?
Percentage of Population Employed in Arts, Entertainment & Recreation in Colorado is 2.6%.
What is the Percentage of Population Employed in Arts, Entertainment & Recreation in the United States?
Percentage of Population Employed in Arts, Entertainment & Recreation in the United States is 2.1%.