Zip Codes with the Highest Percentage of Population Employed in Installation, Maintenance & Repair in Crested Butte, CO
RELATED REPORTS & OPTIONS
Installation, Maintenance & Repair
Crested Butte
Compare Zip Codes
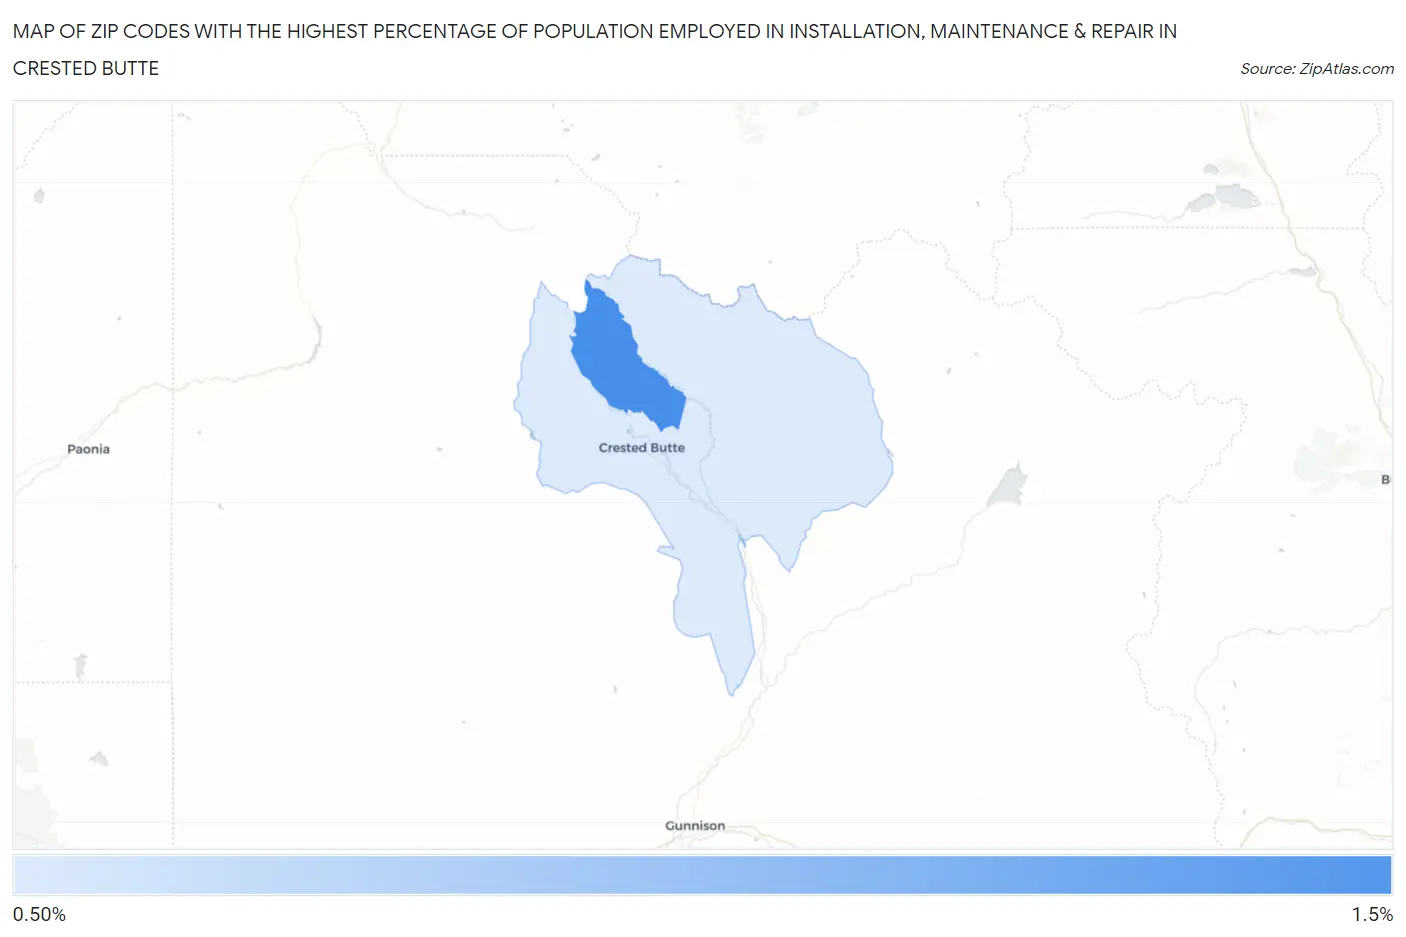
Map of Zip Codes with the Highest Percentage of Population Employed in Installation, Maintenance & Repair in Crested Butte
0.0%
1.5%
Zip Codes with the Highest Percentage of Population Employed in Installation, Maintenance & Repair in Crested Butte, CO
| Zip Code | % Employed | vs State | vs National | |
| 1. | 81225 | 1.4% | 2.8%(-1.46)#357 | 3.1%(-1.71)#24,695 |
| 2. | 81224 | 0.86% | 2.8%(-1.96)#385 | 3.1%(-2.21)#26,318 |
1
Common Questions
What are the Top Zip Codes with the Highest Percentage of Population Employed in Installation, Maintenance & Repair in Crested Butte, CO?
Top Zip Codes with the Highest Percentage of Population Employed in Installation, Maintenance & Repair in Crested Butte, CO are:
What zip code has the Highest Percentage of Population Employed in Installation, Maintenance & Repair in Crested Butte, CO?
81225 has the Highest Percentage of Population Employed in Installation, Maintenance & Repair in Crested Butte, CO with 1.4%.
What is the Percentage of Population Employed in Installation, Maintenance & Repair in Crested Butte, CO?
Percentage of Population Employed in Installation, Maintenance & Repair in Crested Butte is 0.34%.
What is the Percentage of Population Employed in Installation, Maintenance & Repair in Colorado?
Percentage of Population Employed in Installation, Maintenance & Repair in Colorado is 2.8%.
What is the Percentage of Population Employed in Installation, Maintenance & Repair in the United States?
Percentage of Population Employed in Installation, Maintenance & Repair in the United States is 3.1%.