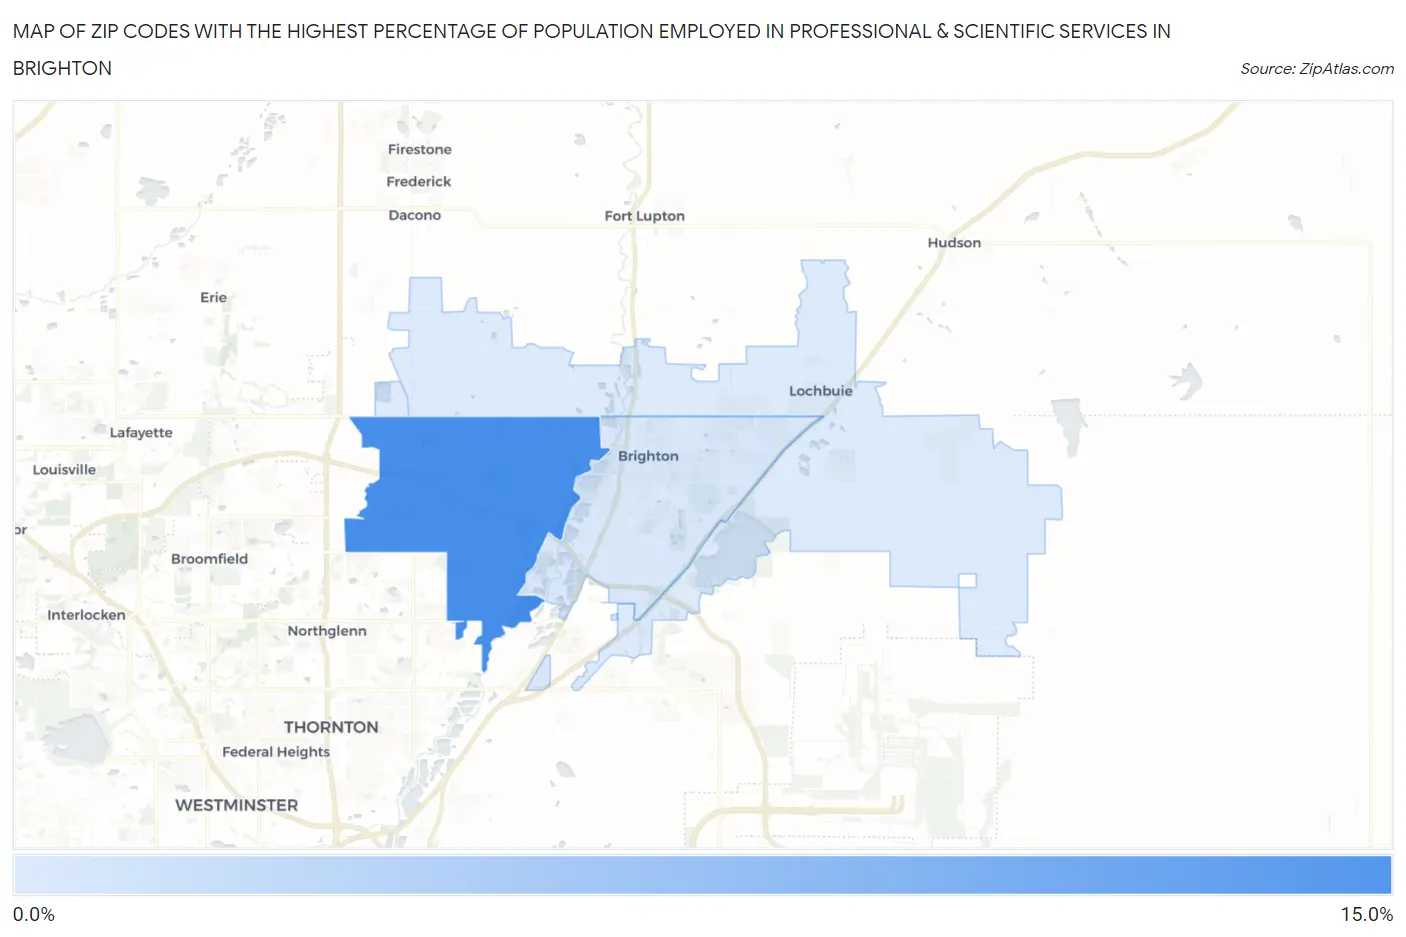
Zip Codes with the Highest Percentage of Population Employed in Professional & Scientific Services in Brighton, CO
RELATED REPORTS & OPTIONS
Professional & Scientific Services
Brighton
Compare Zip Codes
Map of Zip Codes with the Highest Percentage of Population Employed in Professional & Scientific Services in Brighton
0.0%
15.0%
Zip Codes with the Highest Percentage of Population Employed in Professional & Scientific Services in Brighton, CO
| Zip Code | % Employed | vs State | vs National | |
| 1. | 80602 | 11.0% | 10.6%(+0.354)#133 | 7.8%(+3.14)#3,851 |
| 2. | 80601 | 4.1% | 10.6%(-6.51)#319 | 7.8%(-3.73)#14,767 |
| 3. | 80603 | 4.0% | 10.6%(-6.68)#324 | 7.8%(-3.89)#15,235 |
1
Common Questions
What are the Top Zip Codes with the Highest Percentage of Population Employed in Professional & Scientific Services in Brighton, CO?
Top Zip Codes with the Highest Percentage of Population Employed in Professional & Scientific Services in Brighton, CO are:
What zip code has the Highest Percentage of Population Employed in Professional & Scientific Services in Brighton, CO?
80602 has the Highest Percentage of Population Employed in Professional & Scientific Services in Brighton, CO with 11.0%.
What is the Percentage of Population Employed in Professional & Scientific Services in Brighton, CO?
Percentage of Population Employed in Professional & Scientific Services in Brighton is 4.1%.
What is the Percentage of Population Employed in Professional & Scientific Services in Colorado?
Percentage of Population Employed in Professional & Scientific Services in Colorado is 10.6%.
What is the Percentage of Population Employed in Professional & Scientific Services in the United States?
Percentage of Population Employed in Professional & Scientific Services in the United States is 7.8%.