Zip Codes with the Highest Percentage of Population Employed in Legal Services & Support in Brighton, CO
RELATED REPORTS & OPTIONS
Legal Services & Support
Brighton
Compare Zip Codes
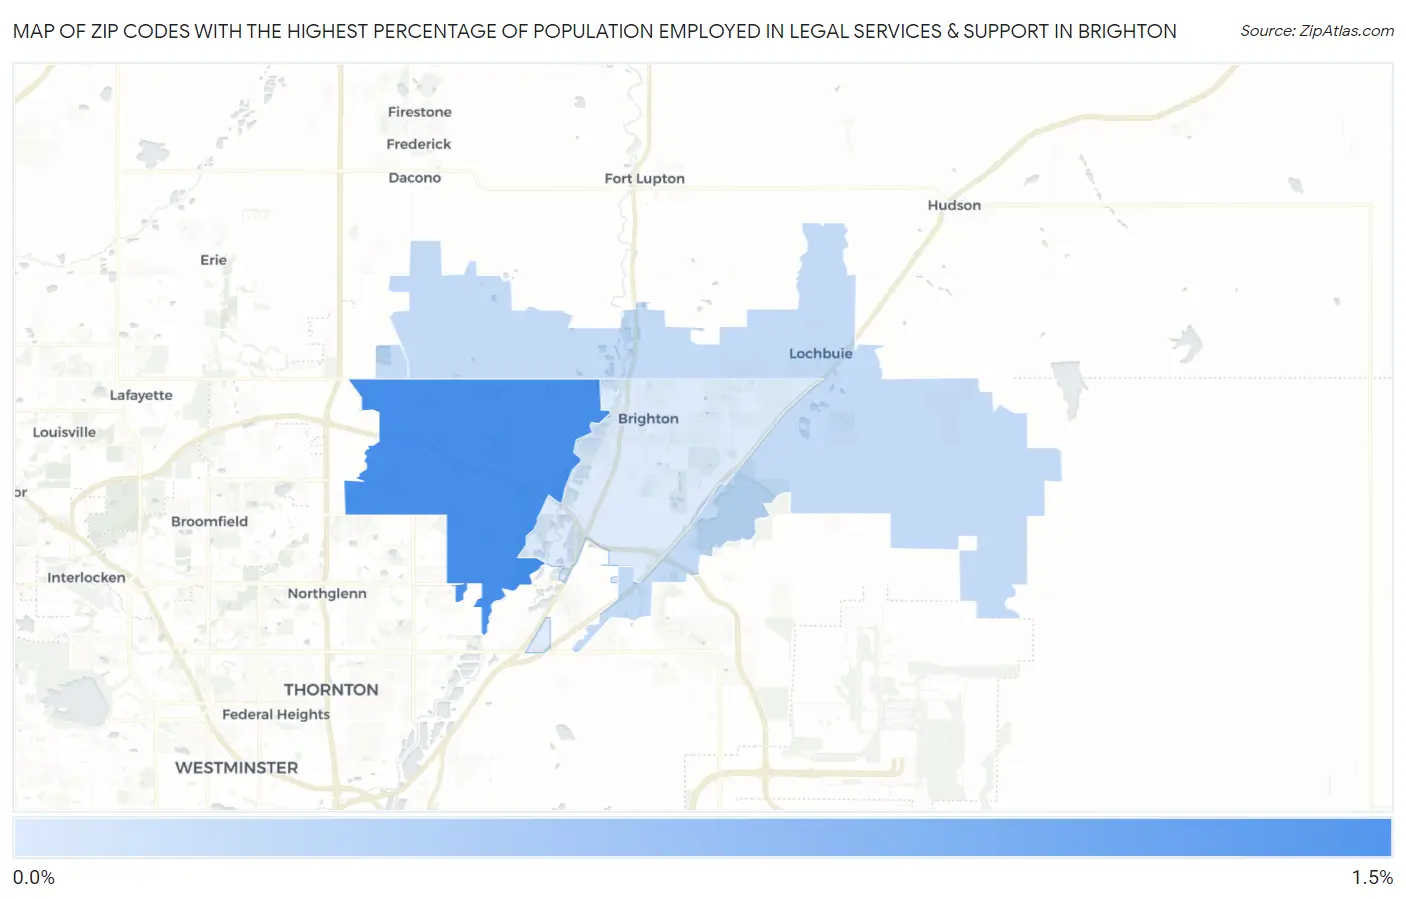
Map of Zip Codes with the Highest Percentage of Population Employed in Legal Services & Support in Brighton
0.0%
1.5%
Zip Codes with the Highest Percentage of Population Employed in Legal Services & Support in Brighton, CO
| Zip Code | % Employed | vs State | vs National | |
| 1. | 80602 | 1.4% | 1.2%(+0.237)#109 | 1.2%(+0.237)#5,369 |
| 2. | 80603 | 0.42% | 1.2%(-0.766)#241 | 1.2%(-0.766)#13,630 |
| 3. | 80601 | 0.21% | 1.2%(-0.971)#279 | 1.2%(-0.971)#16,054 |
1
Common Questions
What are the Top Zip Codes with the Highest Percentage of Population Employed in Legal Services & Support in Brighton, CO?
Top Zip Codes with the Highest Percentage of Population Employed in Legal Services & Support in Brighton, CO are:
What zip code has the Highest Percentage of Population Employed in Legal Services & Support in Brighton, CO?
80602 has the Highest Percentage of Population Employed in Legal Services & Support in Brighton, CO with 1.4%.
What is the Percentage of Population Employed in Legal Services & Support in Brighton, CO?
Percentage of Population Employed in Legal Services & Support in Brighton is 0.21%.
What is the Percentage of Population Employed in Legal Services & Support in Colorado?
Percentage of Population Employed in Legal Services & Support in Colorado is 1.2%.
What is the Percentage of Population Employed in Legal Services & Support in the United States?
Percentage of Population Employed in Legal Services & Support in the United States is 1.2%.