Zip Codes with the Highest Percentage of Families with Income Above $100,000 in Brighton, CO
RELATED REPORTS & OPTIONS
Family Income | $100k+
Brighton
Compare Zip Codes
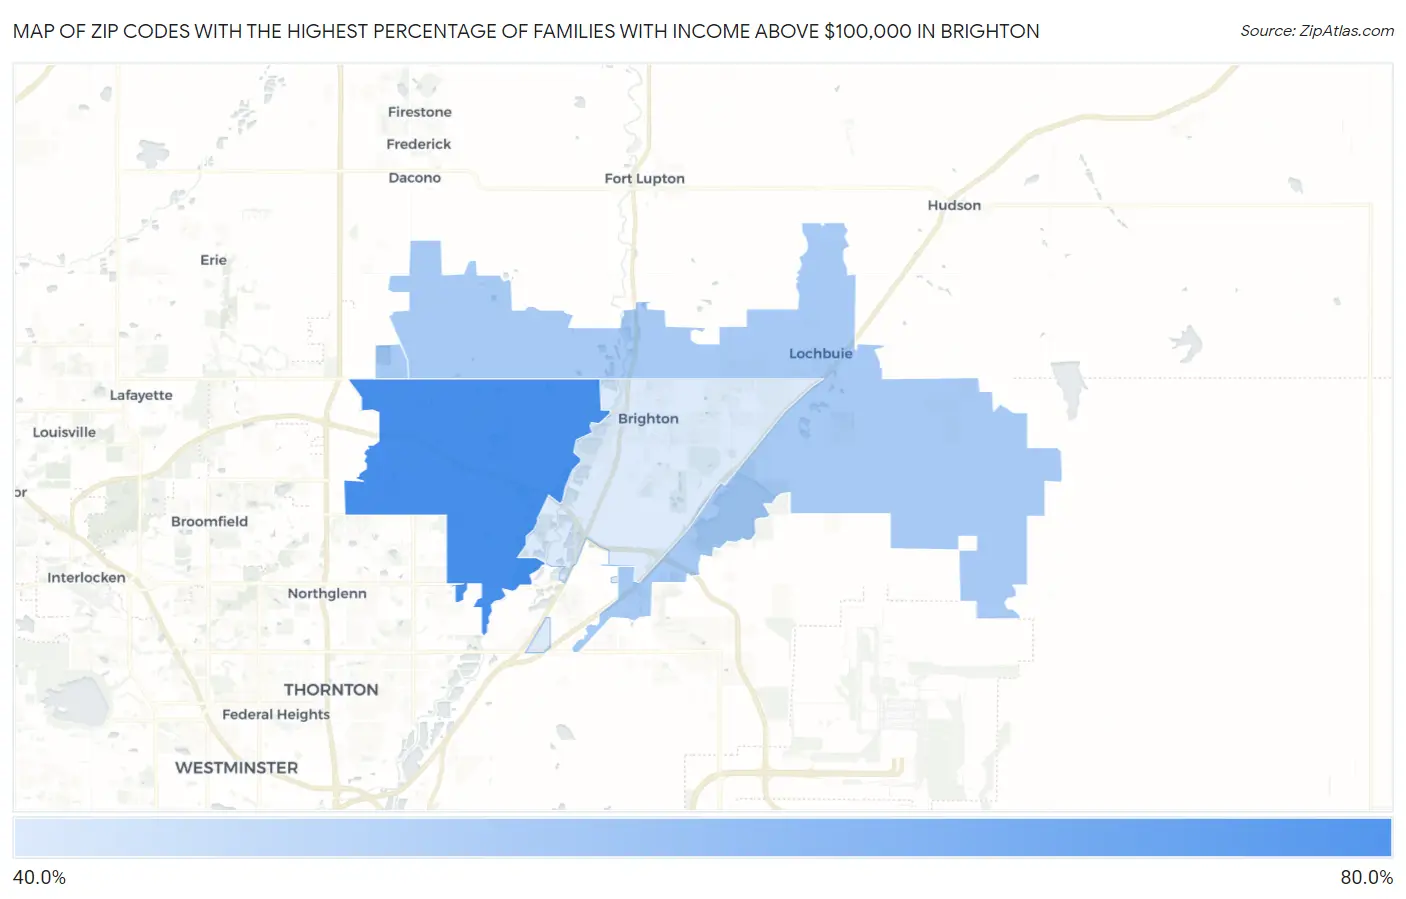
Map of Zip Codes with the Highest Percentage of Families with Income Above $100,000 in Brighton
0.0%
80.0%
Zip Codes with the Highest Percentage of Families with Income Above $100,000 in Brighton, CO
| Zip Code | Families with Income > $100k | vs State | vs National | |
| 1. | 80602 | 77.3% | 54.4%(+22.9)#26 | 46.1%(+31.2)#1,360 |
| 2. | 80603 | 58.7% | 54.4%(+4.30)#137 | 46.1%(+12.6)#5,545 |
| 3. | 80601 | 49.4% | 54.4%(-5.00)#214 | 46.1%(+3.30)#9,095 |
1
Common Questions
What are the Top Zip Codes with the Highest Percentage of Families with Income Above $100,000 in Brighton, CO?
Top Zip Codes with the Highest Percentage of Families with Income Above $100,000 in Brighton, CO are:
What zip code has the Highest Percentage of Families with Income Above $100,000 in Brighton, CO?
80602 has the Highest Percentage of Families with Income Above $100,000 in Brighton, CO with 77.3%.
What is the Percentage of Families with Income Above $100,000 in Brighton, CO?
Percentage of Families with Income Above $100,000 in Brighton is 51.1%.
What is the Percentage of Families with Income Above $100,000 in Colorado?
Percentage of Families with Income Above $100,000 in Colorado is 54.4%.
What is the Percentage of Families with Income Above $100,000 in the United States?
Percentage of Families with Income Above $100,000 in the United States is 46.1%.