Zip Codes with the Highest Percentage of Population with a Degree in Visual and Performing Arts in Turlock, CA
RELATED REPORTS & OPTIONS
Visual and Performing Arts
Turlock
Compare Zip Codes
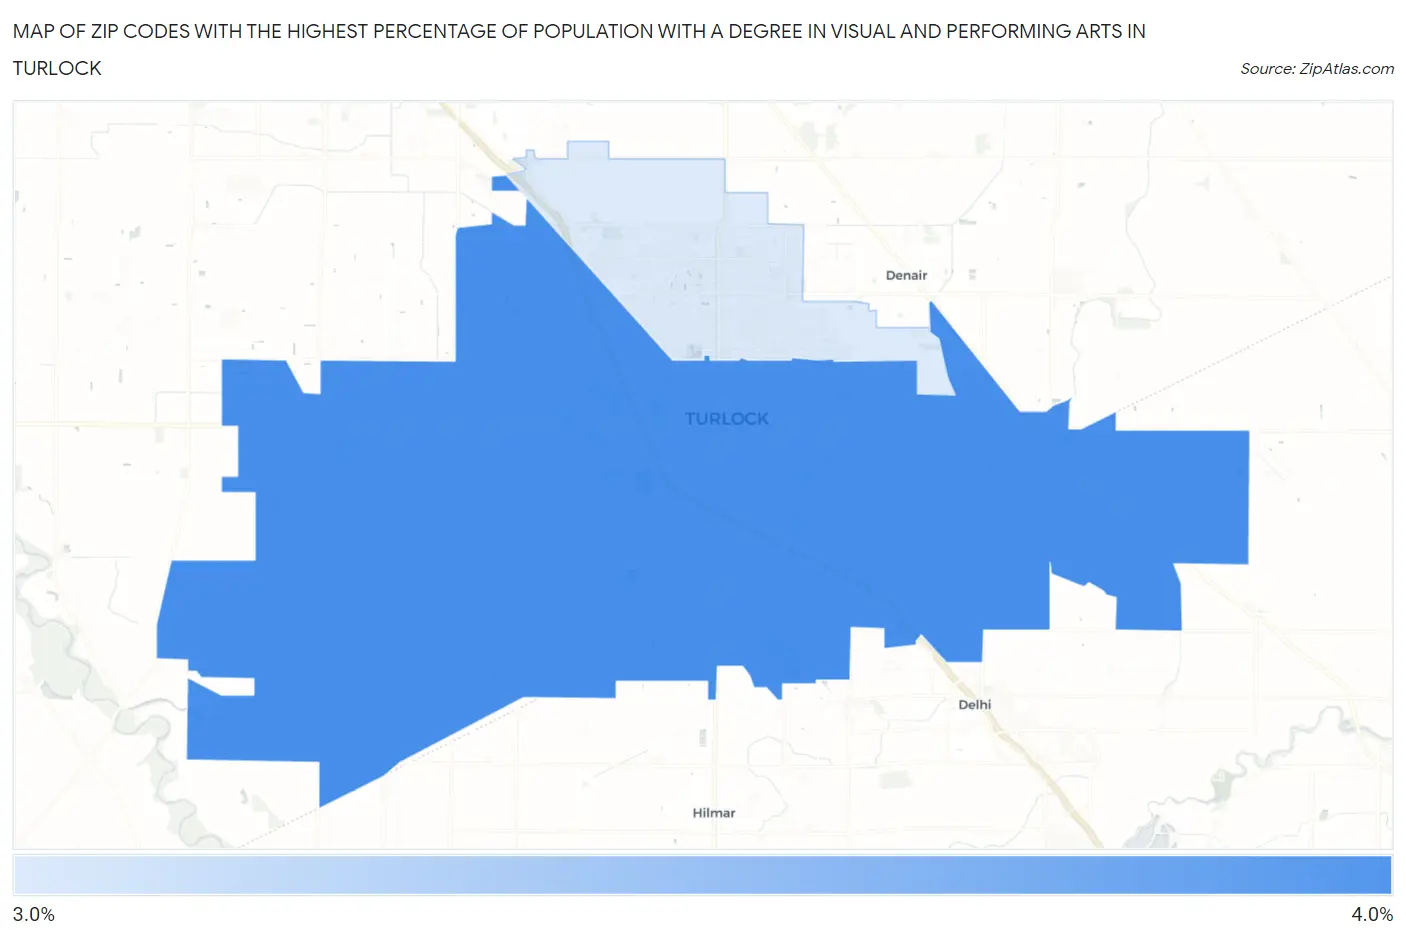
Map of Zip Codes with the Highest Percentage of Population with a Degree in Visual and Performing Arts in Turlock
0.0%
4.0%
Zip Codes with the Highest Percentage of Population with a Degree in Visual and Performing Arts in Turlock, CA
| Zip Code | % Graduates | vs State | vs National | |
| 1. | 95380 | 3.6% | 5.7%(-2.12)#970 | 4.3%(-0.633)#10,433 |
| 2. | 95382 | 3.1% | 5.7%(-2.61)#1,067 | 4.3%(-1.13)#12,242 |
1
Common Questions
What are the Top Zip Codes with the Highest Percentage of Population with a Degree in Visual and Performing Arts in Turlock, CA?
Top Zip Codes with the Highest Percentage of Population with a Degree in Visual and Performing Arts in Turlock, CA are:
What zip code has the Highest Percentage of Population with a Degree in Visual and Performing Arts in Turlock, CA?
95380 has the Highest Percentage of Population with a Degree in Visual and Performing Arts in Turlock, CA with 3.6%.
What is the Percentage of Population with a Degree in Visual and Performing Arts in Turlock, CA?
Percentage of Population with a Degree in Visual and Performing Arts in Turlock is 3.5%.
What is the Percentage of Population with a Degree in Visual and Performing Arts in California?
Percentage of Population with a Degree in Visual and Performing Arts in California is 5.7%.
What is the Percentage of Population with a Degree in Visual and Performing Arts in the United States?
Percentage of Population with a Degree in Visual and Performing Arts in the United States is 4.3%.