Zip Codes with the Highest Percentage of Population Employed in Computer, Engineering & Science in Turlock, CA
RELATED REPORTS & OPTIONS
Computer, Engineering & Science
Turlock
Compare Zip Codes
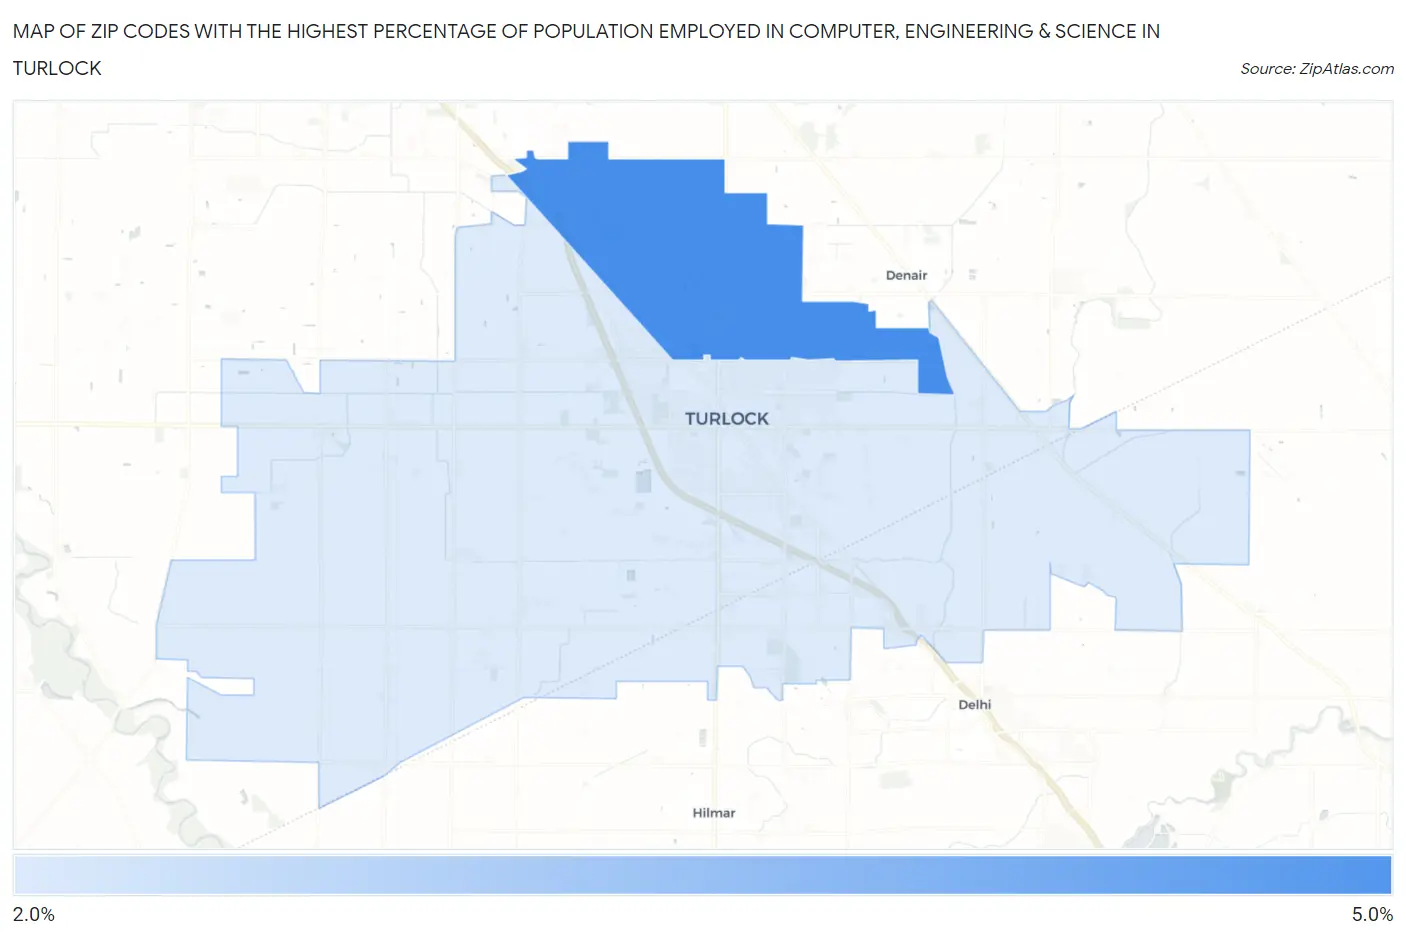
Map of Zip Codes with the Highest Percentage of Population Employed in Computer, Engineering & Science in Turlock
0.0%
5.0%
Zip Codes with the Highest Percentage of Population Employed in Computer, Engineering & Science in Turlock, CA
| Zip Code | % Employed | vs State | vs National | |
| 1. | 95382 | 4.8% | 8.0%(-3.12)#899 | 6.8%(-1.92)#11,831 |
| 2. | 95380 | 2.6% | 8.0%(-5.33)#1,244 | 6.8%(-4.13)#19,502 |
1
Common Questions
What are the Top Zip Codes with the Highest Percentage of Population Employed in Computer, Engineering & Science in Turlock, CA?
Top Zip Codes with the Highest Percentage of Population Employed in Computer, Engineering & Science in Turlock, CA are:
What zip code has the Highest Percentage of Population Employed in Computer, Engineering & Science in Turlock, CA?
95382 has the Highest Percentage of Population Employed in Computer, Engineering & Science in Turlock, CA with 4.8%.
What is the Percentage of Population Employed in Computer, Engineering & Science in Turlock, CA?
Percentage of Population Employed in Computer, Engineering & Science in Turlock is 3.9%.
What is the Percentage of Population Employed in Computer, Engineering & Science in California?
Percentage of Population Employed in Computer, Engineering & Science in California is 8.0%.
What is the Percentage of Population Employed in Computer, Engineering & Science in the United States?
Percentage of Population Employed in Computer, Engineering & Science in the United States is 6.8%.