Zip Codes with the Highest Percentage of Population with a Degree in Visual and Performing Arts in Lompoc, CA
RELATED REPORTS & OPTIONS
Visual and Performing Arts
Lompoc
Compare Zip Codes
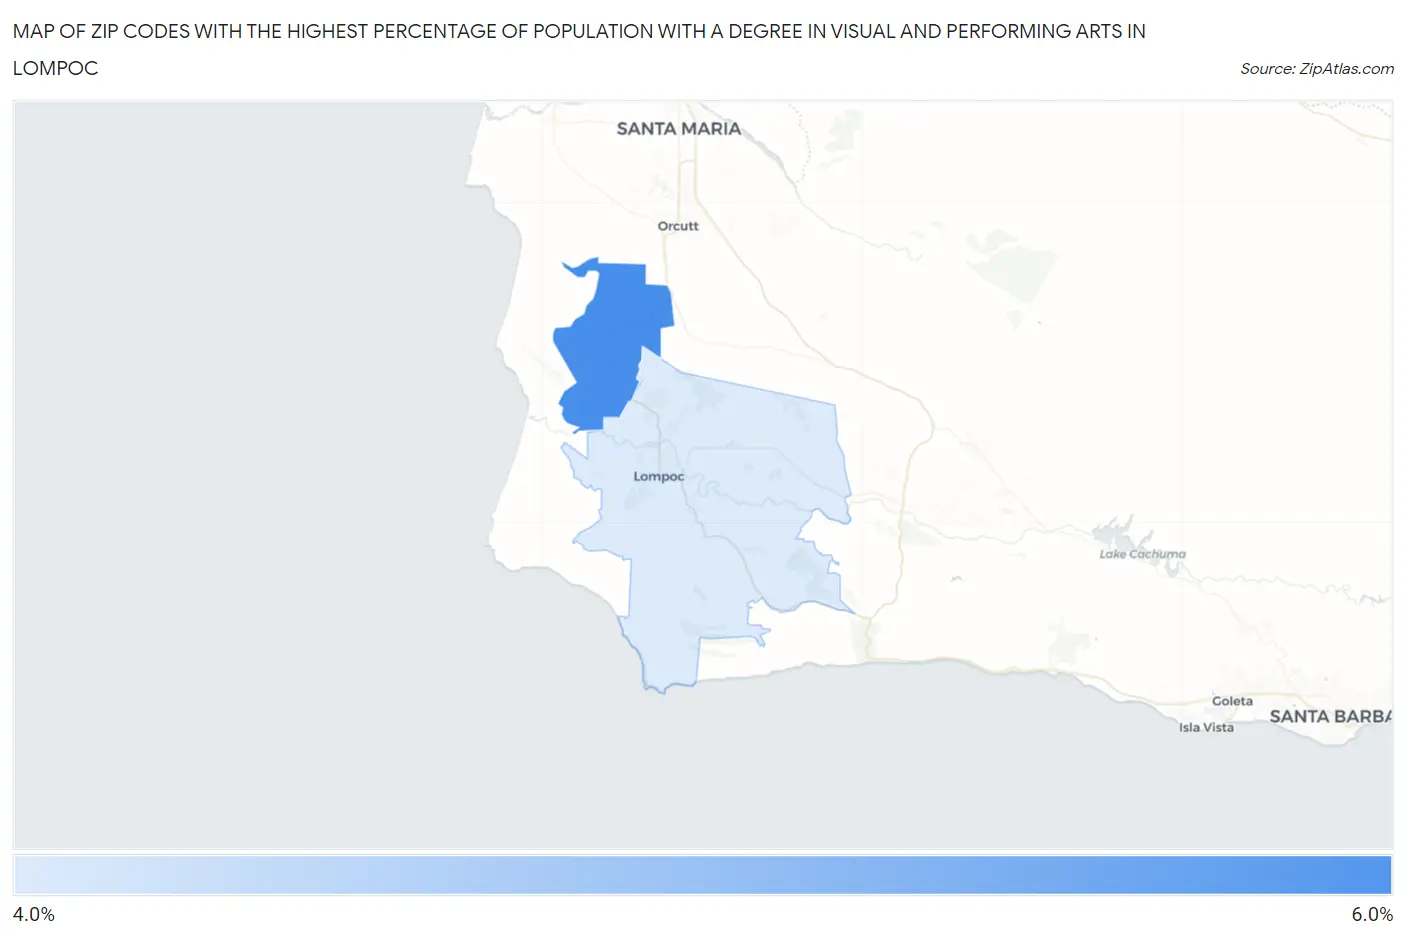
Map of Zip Codes with the Highest Percentage of Population with a Degree in Visual and Performing Arts in Lompoc
0.0%
6.0%
Zip Codes with the Highest Percentage of Population with a Degree in Visual and Performing Arts in Lompoc, CA
| Zip Code | % Graduates | vs State | vs National | |
| 1. | 93437 | 5.9% | 5.7%(+0.135)#526 | 4.3%(+1.62)#5,056 |
| 2. | 93436 | 4.6% | 5.7%(-1.12)#729 | 4.3%(+0.364)#7,512 |
1
Common Questions
What are the Top Zip Codes with the Highest Percentage of Population with a Degree in Visual and Performing Arts in Lompoc, CA?
Top Zip Codes with the Highest Percentage of Population with a Degree in Visual and Performing Arts in Lompoc, CA are:
What zip code has the Highest Percentage of Population with a Degree in Visual and Performing Arts in Lompoc, CA?
93437 has the Highest Percentage of Population with a Degree in Visual and Performing Arts in Lompoc, CA with 5.9%.
What is the Percentage of Population with a Degree in Visual and Performing Arts in Lompoc, CA?
Percentage of Population with a Degree in Visual and Performing Arts in Lompoc is 4.4%.
What is the Percentage of Population with a Degree in Visual and Performing Arts in California?
Percentage of Population with a Degree in Visual and Performing Arts in California is 5.7%.
What is the Percentage of Population with a Degree in Visual and Performing Arts in the United States?
Percentage of Population with a Degree in Visual and Performing Arts in the United States is 4.3%.