Zip Codes with the Highest Percentage of Population with a Degree in Visual and Performing Arts in Rialto, CA
RELATED REPORTS & OPTIONS
Visual and Performing Arts
Rialto
Compare Zip Codes
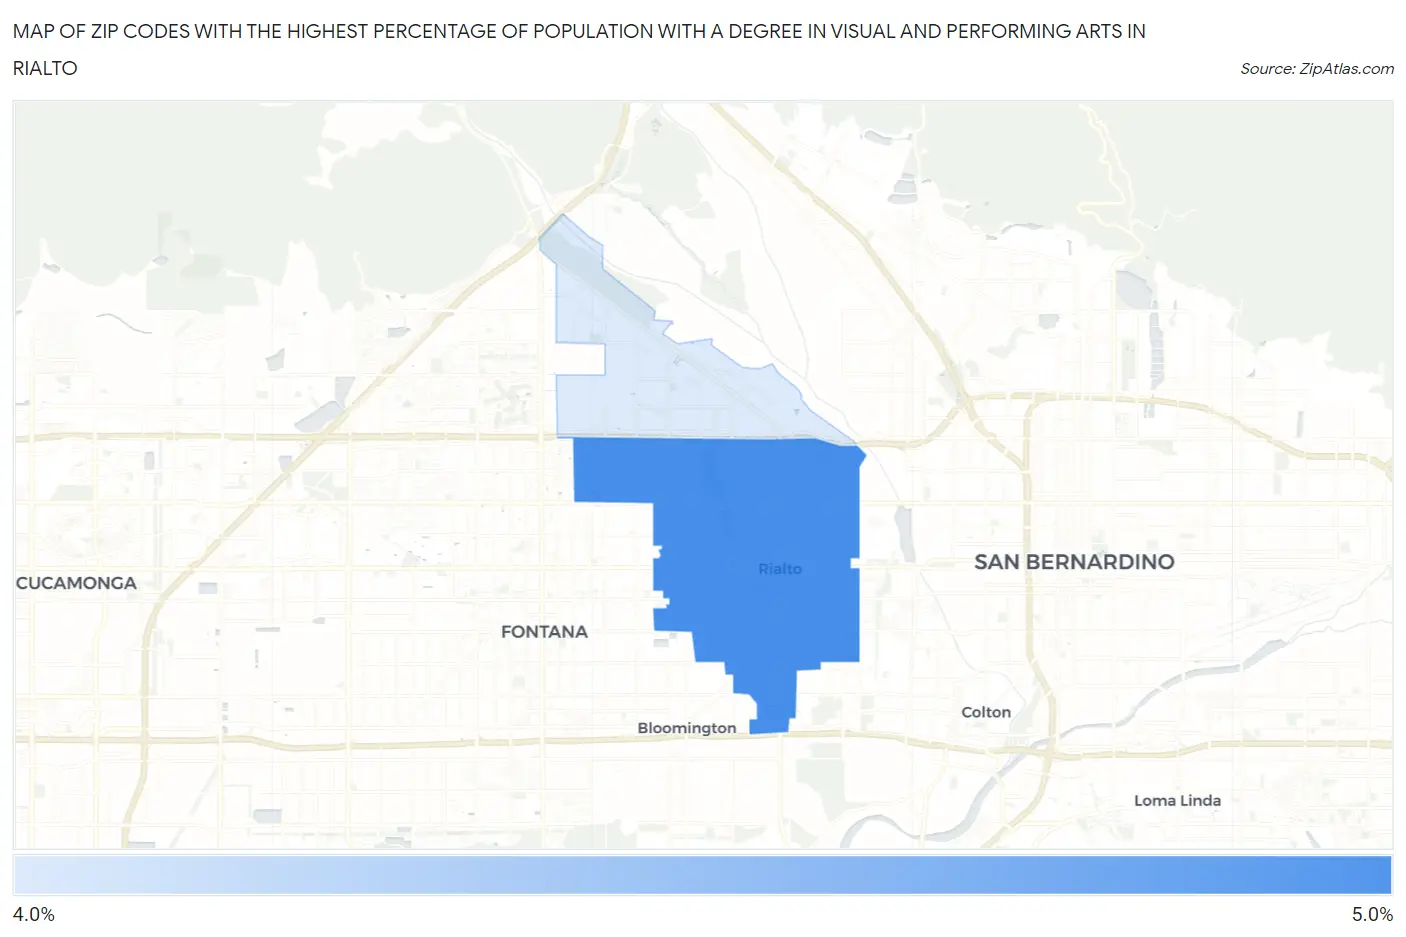
Map of Zip Codes with the Highest Percentage of Population with a Degree in Visual and Performing Arts in Rialto
0.0%
5.0%
Zip Codes with the Highest Percentage of Population with a Degree in Visual and Performing Arts in Rialto, CA
| Zip Code | % Graduates | vs State | vs National | |
| 1. | 92376 | 4.4% | 5.7%(-1.30)#769 | 4.3%(+0.192)#7,977 |
| 2. | 92377 | 4.1% | 5.7%(-1.67)#860 | 4.3%(-0.187)#9,040 |
1
Common Questions
What are the Top Zip Codes with the Highest Percentage of Population with a Degree in Visual and Performing Arts in Rialto, CA?
Top Zip Codes with the Highest Percentage of Population with a Degree in Visual and Performing Arts in Rialto, CA are:
What zip code has the Highest Percentage of Population with a Degree in Visual and Performing Arts in Rialto, CA?
92376 has the Highest Percentage of Population with a Degree in Visual and Performing Arts in Rialto, CA with 4.4%.
What is the Percentage of Population with a Degree in Visual and Performing Arts in Rialto, CA?
Percentage of Population with a Degree in Visual and Performing Arts in Rialto is 3.4%.
What is the Percentage of Population with a Degree in Visual and Performing Arts in California?
Percentage of Population with a Degree in Visual and Performing Arts in California is 5.7%.
What is the Percentage of Population with a Degree in Visual and Performing Arts in the United States?
Percentage of Population with a Degree in Visual and Performing Arts in the United States is 4.3%.