Zip Codes with the Highest Percentage of Population with a Degree in Visual and Performing Arts in Chino, CA
RELATED REPORTS & OPTIONS
Visual and Performing Arts
Chino
Compare Zip Codes
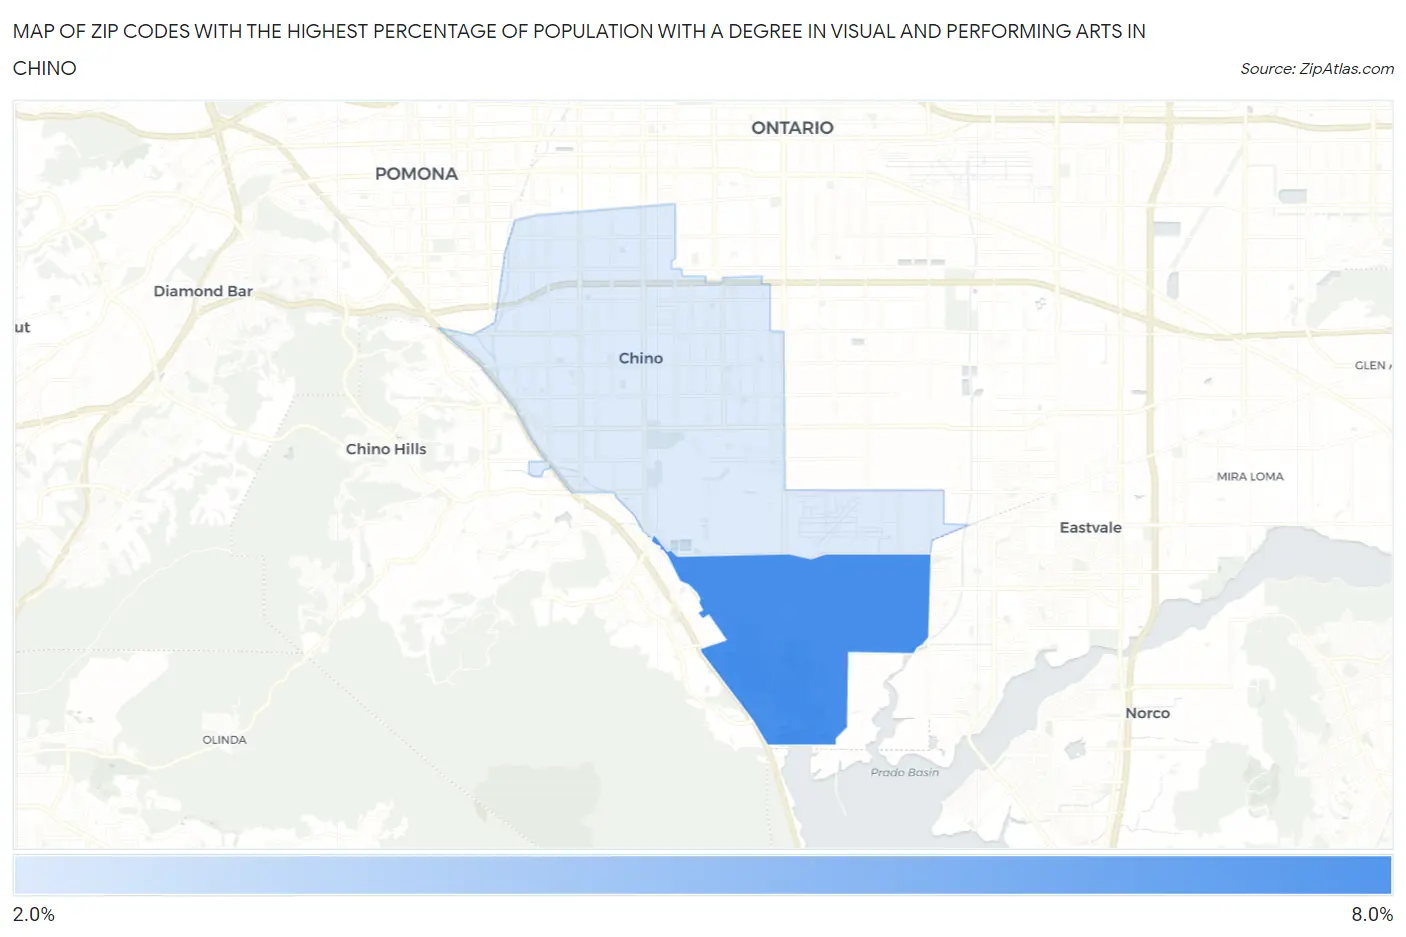
Map of Zip Codes with the Highest Percentage of Population with a Degree in Visual and Performing Arts in Chino
0.0%
8.0%
Zip Codes with the Highest Percentage of Population with a Degree in Visual and Performing Arts in Chino, CA
| Zip Code | % Graduates | vs State | vs National | |
| 1. | 91708 | 7.0% | 5.7%(+1.23)#411 | 4.3%(+2.72)#3,690 |
| 2. | 91710 | 3.0% | 5.7%(-2.76)#1,102 | 4.3%(-1.28)#12,819 |
1
Common Questions
What are the Top Zip Codes with the Highest Percentage of Population with a Degree in Visual and Performing Arts in Chino, CA?
Top Zip Codes with the Highest Percentage of Population with a Degree in Visual and Performing Arts in Chino, CA are:
What zip code has the Highest Percentage of Population with a Degree in Visual and Performing Arts in Chino, CA?
91708 has the Highest Percentage of Population with a Degree in Visual and Performing Arts in Chino, CA with 7.0%.
What is the Percentage of Population with a Degree in Visual and Performing Arts in Chino, CA?
Percentage of Population with a Degree in Visual and Performing Arts in Chino is 4.0%.
What is the Percentage of Population with a Degree in Visual and Performing Arts in California?
Percentage of Population with a Degree in Visual and Performing Arts in California is 5.7%.
What is the Percentage of Population with a Degree in Visual and Performing Arts in the United States?
Percentage of Population with a Degree in Visual and Performing Arts in the United States is 4.3%.