Zip Codes with the Highest Percentage of Population with a Degree in Visual and Performing Arts in San Bernardino, CA
RELATED REPORTS & OPTIONS
Visual and Performing Arts
San Bernardino
Compare Zip Codes
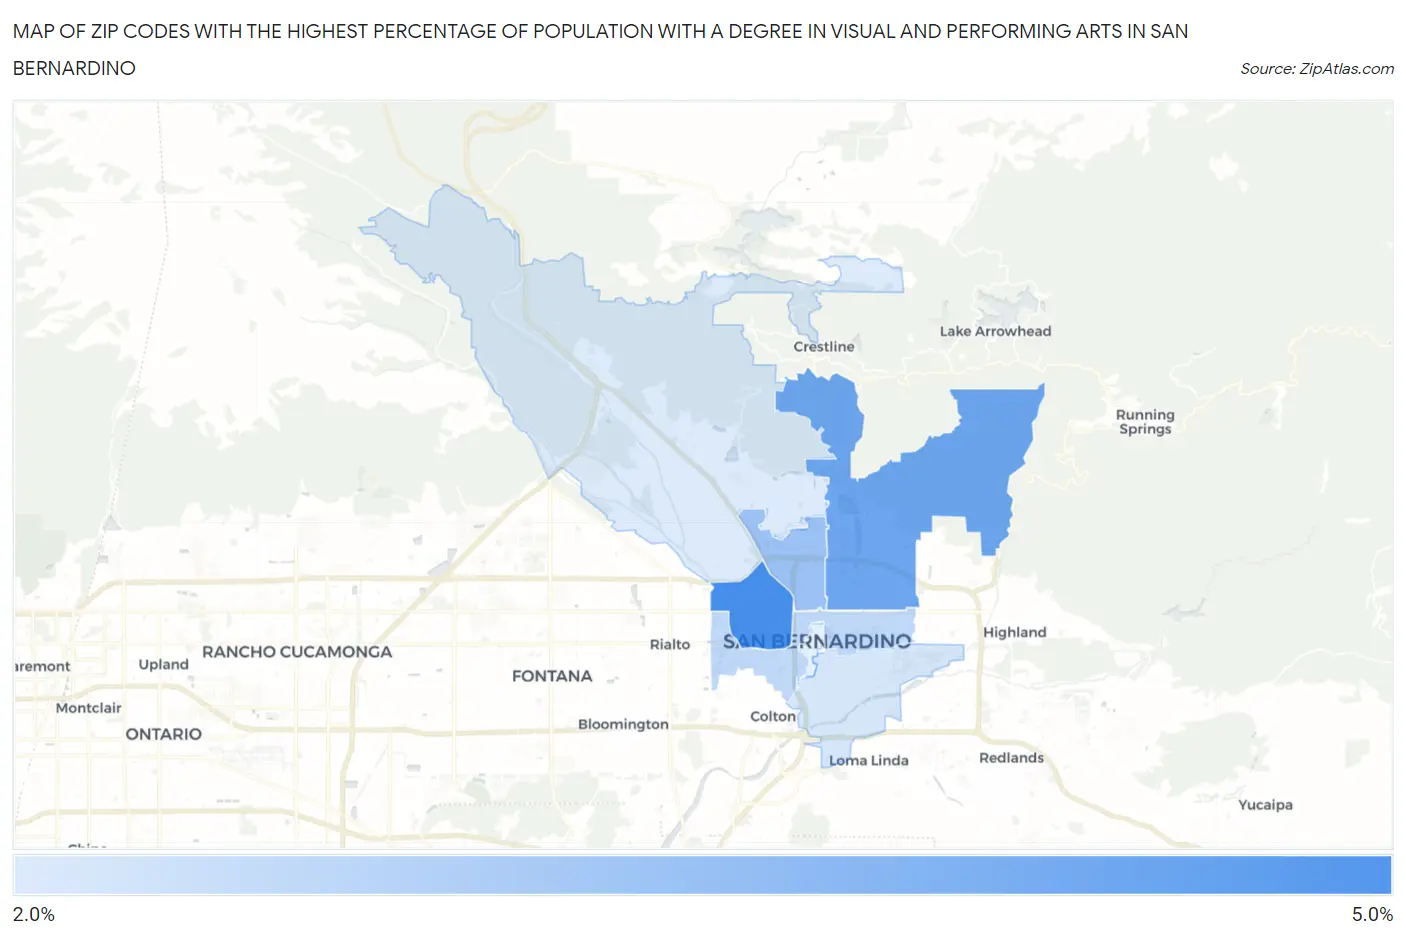
Map of Zip Codes with the Highest Percentage of Population with a Degree in Visual and Performing Arts in San Bernardino
0.0%
5.0%
Zip Codes with the Highest Percentage of Population with a Degree in Visual and Performing Arts in San Bernardino, CA
| Zip Code | % Graduates | vs State | vs National | |
| 1. | 92411 | 4.8% | 5.7%(-0.943)#697 | 4.3%(+0.544)#7,087 |
| 2. | 92404 | 4.2% | 5.7%(-1.52)#815 | 4.3%(-0.030)#8,564 |
| 3. | 92405 | 3.6% | 5.7%(-2.18)#985 | 4.3%(-0.689)#10,645 |
| 4. | 92410 | 3.0% | 5.7%(-2.72)#1,095 | 4.3%(-1.24)#12,686 |
| 5. | 92408 | 2.7% | 5.7%(-3.05)#1,161 | 4.3%(-1.56)#13,946 |
| 6. | 92407 | 2.6% | 5.7%(-3.16)#1,178 | 4.3%(-1.67)#14,318 |
1
Common Questions
What are the Top 5 Zip Codes with the Highest Percentage of Population with a Degree in Visual and Performing Arts in San Bernardino, CA?
Top 5 Zip Codes with the Highest Percentage of Population with a Degree in Visual and Performing Arts in San Bernardino, CA are:
What zip code has the Highest Percentage of Population with a Degree in Visual and Performing Arts in San Bernardino, CA?
92411 has the Highest Percentage of Population with a Degree in Visual and Performing Arts in San Bernardino, CA with 4.8%.
What is the Percentage of Population with a Degree in Visual and Performing Arts in San Bernardino, CA?
Percentage of Population with a Degree in Visual and Performing Arts in San Bernardino is 3.4%.
What is the Percentage of Population with a Degree in Visual and Performing Arts in California?
Percentage of Population with a Degree in Visual and Performing Arts in California is 5.7%.
What is the Percentage of Population with a Degree in Visual and Performing Arts in the United States?
Percentage of Population with a Degree in Visual and Performing Arts in the United States is 4.3%.