Zip Codes with the Highest Percentage of Population with a Degree in Visual and Performing Arts in Castro Valley, CA
RELATED REPORTS & OPTIONS
Visual and Performing Arts
Castro Valley
Compare Zip Codes
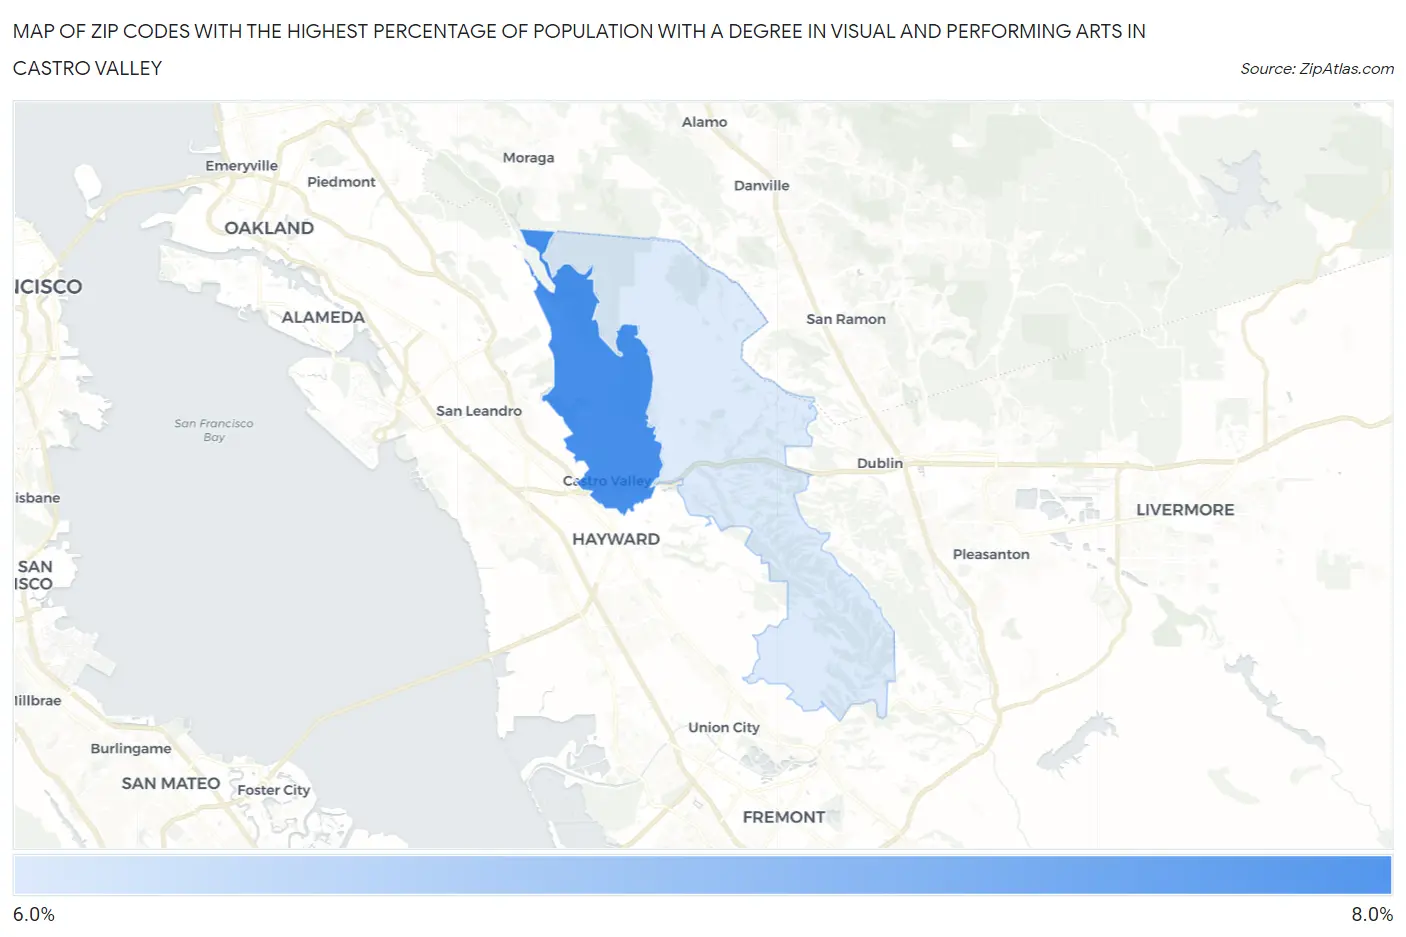
Map of Zip Codes with the Highest Percentage of Population with a Degree in Visual and Performing Arts in Castro Valley
0.0%
8.0%
Zip Codes with the Highest Percentage of Population with a Degree in Visual and Performing Arts in Castro Valley, CA
| Zip Code | % Graduates | vs State | vs National | |
| 1. | 94546 | 7.6% | 5.7%(+1.83)#356 | 4.3%(+3.32)#3,163 |
| 2. | 94552 | 6.4% | 5.7%(+0.683)#467 | 4.3%(+2.17)#4,319 |
1
Common Questions
What are the Top Zip Codes with the Highest Percentage of Population with a Degree in Visual and Performing Arts in Castro Valley, CA?
Top Zip Codes with the Highest Percentage of Population with a Degree in Visual and Performing Arts in Castro Valley, CA are:
What zip code has the Highest Percentage of Population with a Degree in Visual and Performing Arts in Castro Valley, CA?
94546 has the Highest Percentage of Population with a Degree in Visual and Performing Arts in Castro Valley, CA with 7.6%.
What is the Percentage of Population with a Degree in Visual and Performing Arts in Castro Valley, CA?
Percentage of Population with a Degree in Visual and Performing Arts in Castro Valley is 6.9%.
What is the Percentage of Population with a Degree in Visual and Performing Arts in California?
Percentage of Population with a Degree in Visual and Performing Arts in California is 5.7%.
What is the Percentage of Population with a Degree in Visual and Performing Arts in the United States?
Percentage of Population with a Degree in Visual and Performing Arts in the United States is 4.3%.