Zip Codes with the Highest Percentage of Population with a Degree in Liberal Arts and History in Yuma, AZ
RELATED REPORTS & OPTIONS
Liberal Arts and History
Yuma
Compare Zip Codes
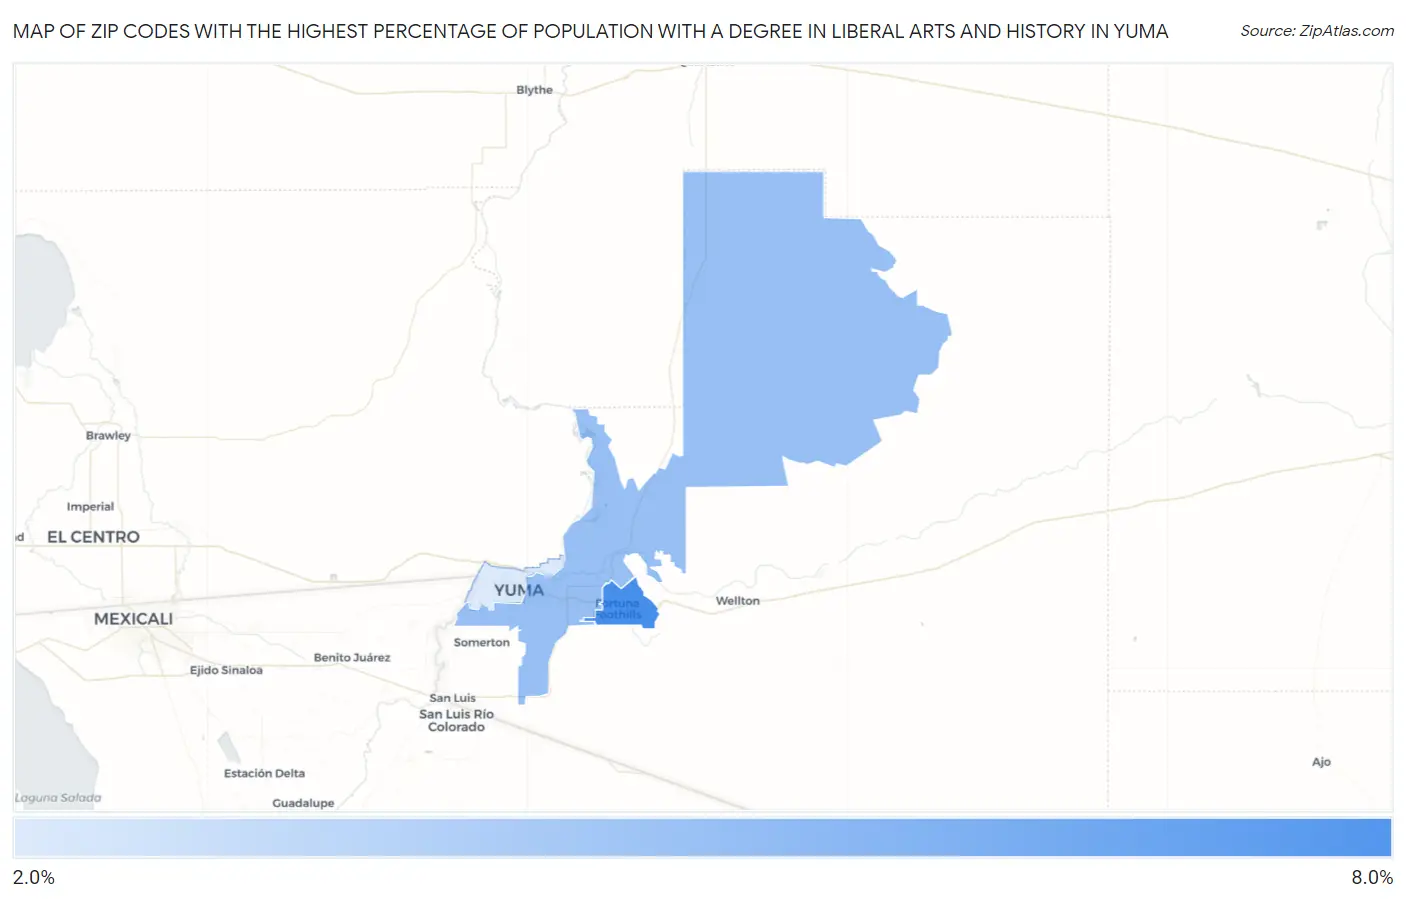
Map of Zip Codes with the Highest Percentage of Population with a Degree in Liberal Arts and History in Yuma
0.0%
8.0%
Zip Codes with the Highest Percentage of Population with a Degree in Liberal Arts and History in Yuma, AZ
| Zip Code | % Graduates | vs State | vs National | |
| 1. | 85367 | 6.3% | 4.3%(+2.00)#80 | 4.9%(+1.38)#7,882 |
| 2. | 85365 | 4.4% | 4.3%(+0.153)#154 | 4.9%(-0.466)#13,268 |
| 3. | 85364 | 2.9% | 4.3%(-1.40)#244 | 4.9%(-2.02)#18,849 |
1
Common Questions
What are the Top Zip Codes with the Highest Percentage of Population with a Degree in Liberal Arts and History in Yuma, AZ?
Top Zip Codes with the Highest Percentage of Population with a Degree in Liberal Arts and History in Yuma, AZ are:
What zip code has the Highest Percentage of Population with a Degree in Liberal Arts and History in Yuma, AZ?
85367 has the Highest Percentage of Population with a Degree in Liberal Arts and History in Yuma, AZ with 6.3%.
What is the Percentage of Population with a Degree in Liberal Arts and History in Yuma, AZ?
Percentage of Population with a Degree in Liberal Arts and History in Yuma is 3.9%.
What is the Percentage of Population with a Degree in Liberal Arts and History in Arizona?
Percentage of Population with a Degree in Liberal Arts and History in Arizona is 4.3%.
What is the Percentage of Population with a Degree in Liberal Arts and History in the United States?
Percentage of Population with a Degree in Liberal Arts and History in the United States is 4.9%.