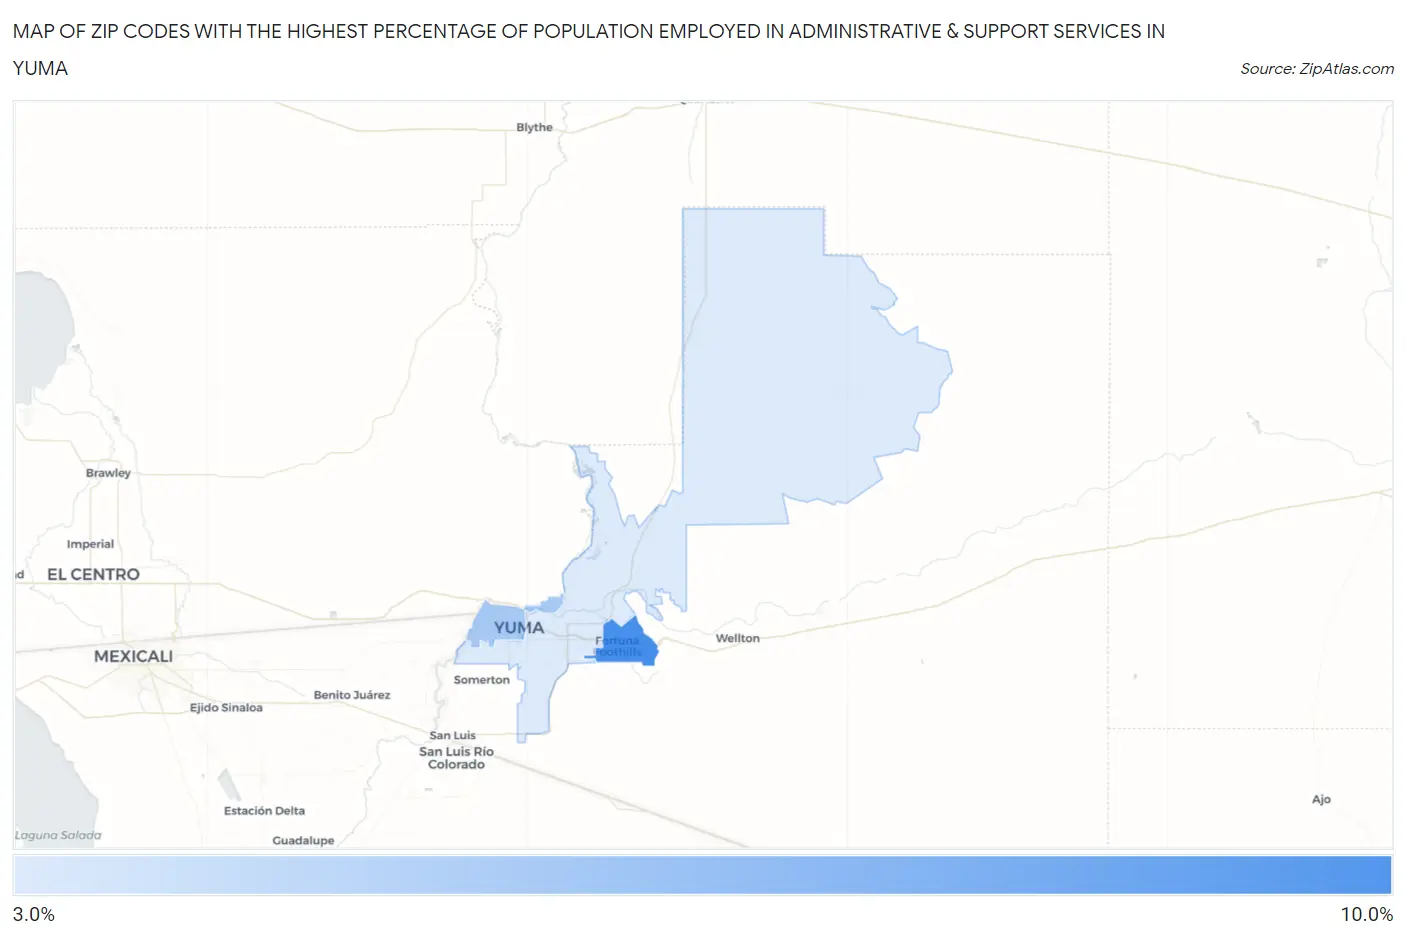
Zip Codes with the Highest Percentage of Population Employed in Administrative & Support Services in Yuma, AZ
RELATED REPORTS & OPTIONS
Administrative & Support Services
Yuma
Compare Zip Codes
Map of Zip Codes with the Highest Percentage of Population Employed in Administrative & Support Services in Yuma
0.0%
10.0%
Zip Codes with the Highest Percentage of Population Employed in Administrative & Support Services in Yuma, AZ
| Zip Code | % Employed | vs State | vs National | |
| 1. | 85367 | 8.9% | 5.4%(+3.50)#38 | 4.1%(+4.70)#1,765 |
| 2. | 85364 | 5.6% | 5.4%(+0.228)#124 | 4.1%(+1.43)#5,626 |
| 3. | 85365 | 3.8% | 5.4%(-1.53)#211 | 4.1%(-0.324)#11,422 |
1
Common Questions
What are the Top Zip Codes with the Highest Percentage of Population Employed in Administrative & Support Services in Yuma, AZ?
Top Zip Codes with the Highest Percentage of Population Employed in Administrative & Support Services in Yuma, AZ are:
What zip code has the Highest Percentage of Population Employed in Administrative & Support Services in Yuma, AZ?
85367 has the Highest Percentage of Population Employed in Administrative & Support Services in Yuma, AZ with 8.9%.
What is the Percentage of Population Employed in Administrative & Support Services in Yuma, AZ?
Percentage of Population Employed in Administrative & Support Services in Yuma is 5.1%.
What is the Percentage of Population Employed in Administrative & Support Services in Arizona?
Percentage of Population Employed in Administrative & Support Services in Arizona is 5.4%.
What is the Percentage of Population Employed in Administrative & Support Services in the United States?
Percentage of Population Employed in Administrative & Support Services in the United States is 4.1%.