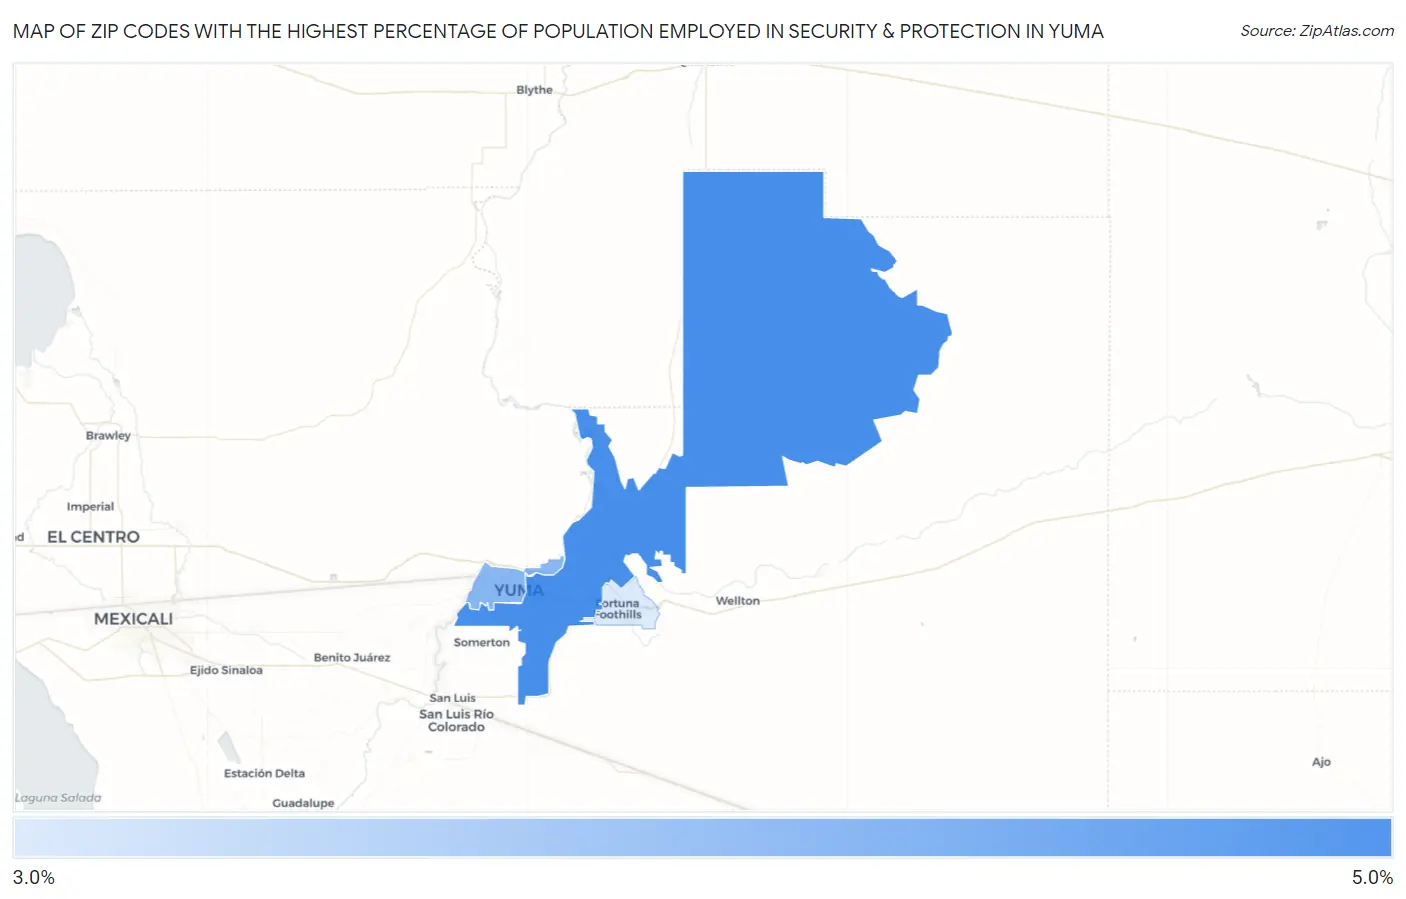
Zip Codes with the Highest Percentage of Population Employed in Security & Protection in Yuma, AZ
RELATED REPORTS & OPTIONS
Security & Protection
Yuma
Compare Zip Codes
Map of Zip Codes with the Highest Percentage of Population Employed in Security & Protection in Yuma
0.0%
5.0%
Zip Codes with the Highest Percentage of Population Employed in Security & Protection in Yuma, AZ
| Zip Code | % Employed | vs State | vs National | |
| 1. | 85365 | 4.2% | 2.5%(+1.80)#94 | 2.1%(+2.10)#4,027 |
| 2. | 85364 | 4.0% | 2.5%(+1.54)#101 | 2.1%(+1.84)#4,511 |
| 3. | 85367 | 3.7% | 2.5%(+1.21)#113 | 2.1%(+1.52)#5,229 |
1
Common Questions
What are the Top Zip Codes with the Highest Percentage of Population Employed in Security & Protection in Yuma, AZ?
Top Zip Codes with the Highest Percentage of Population Employed in Security & Protection in Yuma, AZ are:
What zip code has the Highest Percentage of Population Employed in Security & Protection in Yuma, AZ?
85365 has the Highest Percentage of Population Employed in Security & Protection in Yuma, AZ with 4.2%.
What is the Percentage of Population Employed in Security & Protection in Yuma, AZ?
Percentage of Population Employed in Security & Protection in Yuma is 4.0%.
What is the Percentage of Population Employed in Security & Protection in Arizona?
Percentage of Population Employed in Security & Protection in Arizona is 2.5%.
What is the Percentage of Population Employed in Security & Protection in the United States?
Percentage of Population Employed in Security & Protection in the United States is 2.1%.