Zip Codes with the Highest Percentage of Population Employed in Accommodation & Food Services in Yuma, AZ
RELATED REPORTS & OPTIONS
Accommodation & Food Services
Yuma
Compare Zip Codes
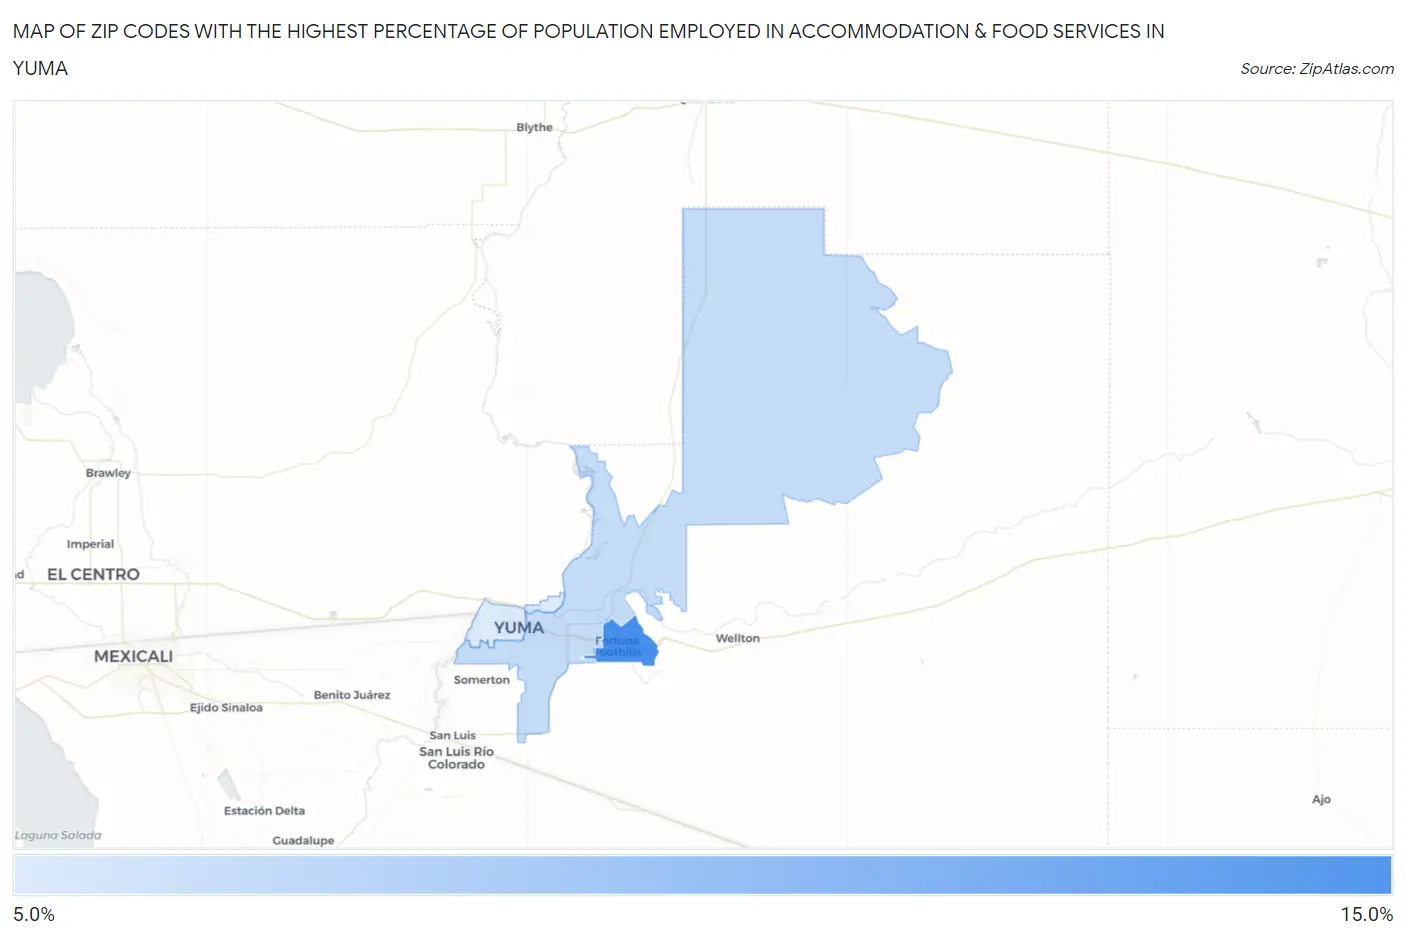
Map of Zip Codes with the Highest Percentage of Population Employed in Accommodation & Food Services in Yuma
0.0%
15.0%
Zip Codes with the Highest Percentage of Population Employed in Accommodation & Food Services in Yuma, AZ
| Zip Code | % Employed | vs State | vs National | |
| 1. | 85367 | 11.5% | 7.6%(+3.94)#79 | 6.9%(+4.61)#3,162 |
| 2. | 85365 | 9.8% | 7.6%(+2.23)#108 | 6.9%(+2.90)#4,815 |
| 3. | 85364 | 9.5% | 7.6%(+1.93)#117 | 6.9%(+2.60)#5,238 |
1
Common Questions
What are the Top Zip Codes with the Highest Percentage of Population Employed in Accommodation & Food Services in Yuma, AZ?
Top Zip Codes with the Highest Percentage of Population Employed in Accommodation & Food Services in Yuma, AZ are:
What zip code has the Highest Percentage of Population Employed in Accommodation & Food Services in Yuma, AZ?
85367 has the Highest Percentage of Population Employed in Accommodation & Food Services in Yuma, AZ with 11.5%.
What is the Percentage of Population Employed in Accommodation & Food Services in Yuma, AZ?
Percentage of Population Employed in Accommodation & Food Services in Yuma is 9.7%.
What is the Percentage of Population Employed in Accommodation & Food Services in Arizona?
Percentage of Population Employed in Accommodation & Food Services in Arizona is 7.6%.
What is the Percentage of Population Employed in Accommodation & Food Services in the United States?
Percentage of Population Employed in Accommodation & Food Services in the United States is 6.9%.