So Hi, AZ
So Hi Map
So Hi Overview
483
TOTAL POPULATION
165
MALE POPULATION
318
FEMALE POPULATION
51.89
MALES / 100 FEMALES
192.73
FEMALES / 100 MALES
54.9
MEDIAN AGE
2.3
AVG FAMILY SIZE
2.4
AVG HOUSEHOLD SIZE
$20,572
PER CAPITA INCOME
$48,592
AVG FAMILY INCOME
$48,592
AVG HOUSEHOLD INCOME
0.28
INEQUALITY / GINI INDEX
205
LABOR FORCE [ PEOPLE ]
42.4%
PERCENT IN LABOR FORCE
9.3%
UNEMPLOYMENT RATE
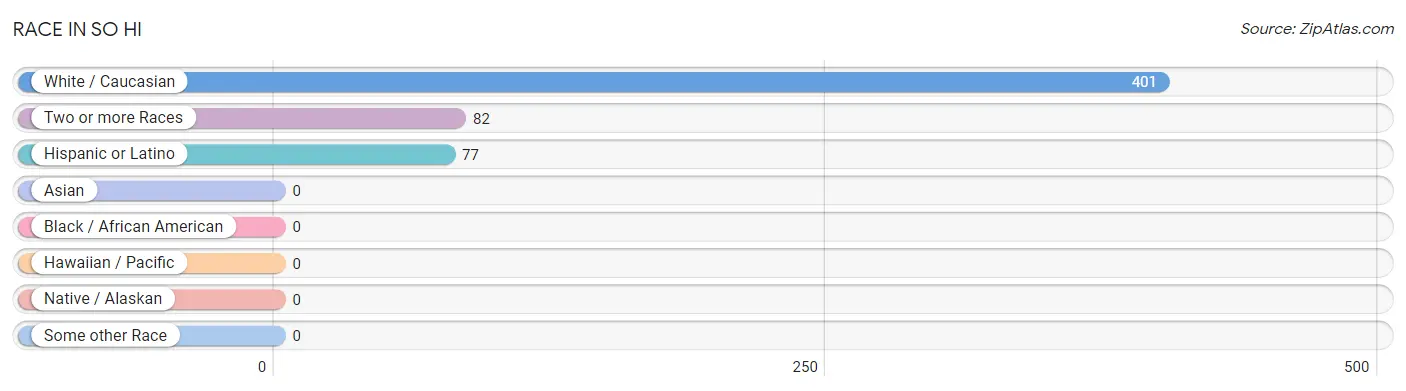
Race in So Hi
The most populous races in So Hi are White / Caucasian (401 | 83.0%), Two or more Races (82 | 17.0%), and Hispanic or Latino (77 | 15.9%).
| Race | # Population | % Population |
| Asian | 0 | 0.0% |
| Black / African American | 0 | 0.0% |
| Hawaiian / Pacific | 0 | 0.0% |
| Hispanic or Latino | 77 | 15.9% |
| Native / Alaskan | 0 | 0.0% |
| White / Caucasian | 401 | 83.0% |
| Two or more Races | 82 | 17.0% |
| Some other Race | 0 | 0.0% |
| Total | 483 | 100.0% |
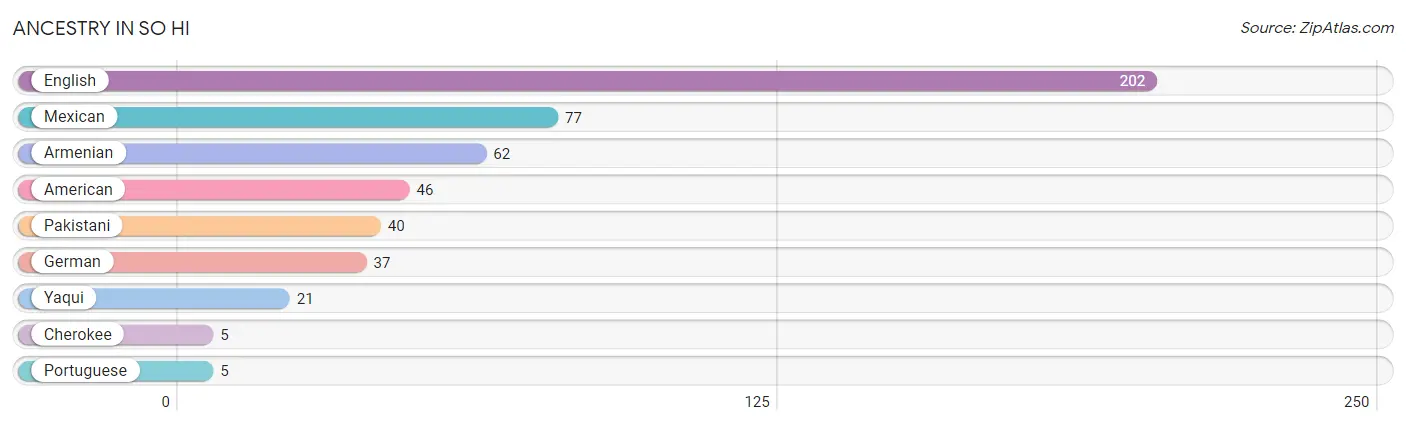
Ancestry in So Hi
The most populous ancestries reported in So Hi are English (202 | 41.8%), Mexican (77 | 15.9%), Armenian (62 | 12.8%), American (46 | 9.5%), and Pakistani (40 | 8.3%), together accounting for 88.4% of all So Hi residents.
| Ancestry | # Population | % Population |
| American | 46 | 9.5% |
| Armenian | 62 | 12.8% |
| Cherokee | 5 | 1.0% |
| English | 202 | 41.8% |
| German | 37 | 7.7% |
| Mexican | 77 | 15.9% |
| Pakistani | 40 | 8.3% |
| Portuguese | 5 | 1.0% |
| Yaqui | 21 | 4.3% | View All 9 Rows |
Immigrants in So Hi

| Immigration Origin | # Population | % Population | View All 0 Rows |
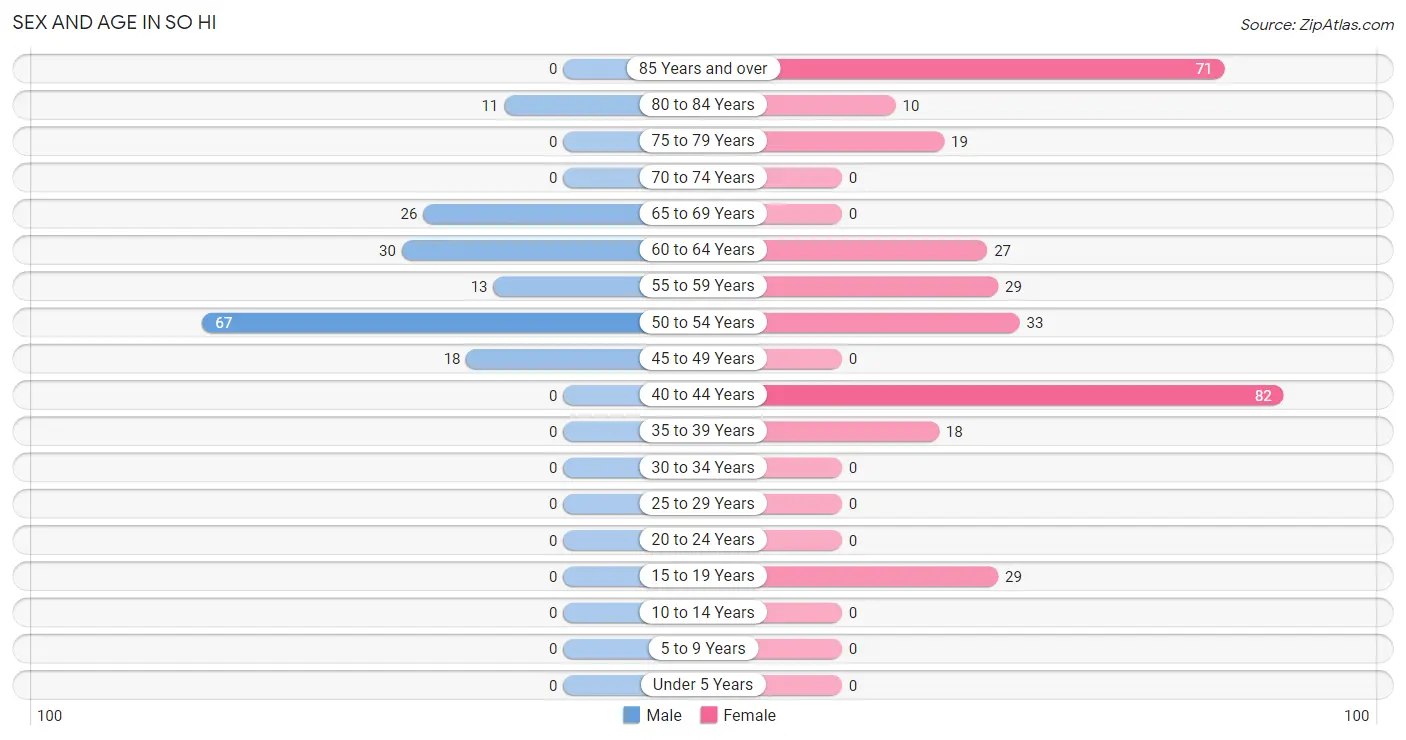
Sex and Age in So Hi
Sex and Age in So Hi
The most populous age groups in So Hi are 50 to 54 Years (67 | 40.6%) for men and 40 to 44 Years (82 | 25.8%) for women.
| Age Bracket | Male | Female |
| Under 5 Years | 0 (0.0%) | 0 (0.0%) |
| 5 to 9 Years | 0 (0.0%) | 0 (0.0%) |
| 10 to 14 Years | 0 (0.0%) | 0 (0.0%) |
| 15 to 19 Years | 0 (0.0%) | 29 (9.1%) |
| 20 to 24 Years | 0 (0.0%) | 0 (0.0%) |
| 25 to 29 Years | 0 (0.0%) | 0 (0.0%) |
| 30 to 34 Years | 0 (0.0%) | 0 (0.0%) |
| 35 to 39 Years | 0 (0.0%) | 18 (5.7%) |
| 40 to 44 Years | 0 (0.0%) | 82 (25.8%) |
| 45 to 49 Years | 18 (10.9%) | 0 (0.0%) |
| 50 to 54 Years | 67 (40.6%) | 33 (10.4%) |
| 55 to 59 Years | 13 (7.9%) | 29 (9.1%) |
| 60 to 64 Years | 30 (18.2%) | 27 (8.5%) |
| 65 to 69 Years | 26 (15.8%) | 0 (0.0%) |
| 70 to 74 Years | 0 (0.0%) | 0 (0.0%) |
| 75 to 79 Years | 0 (0.0%) | 19 (6.0%) |
| 80 to 84 Years | 11 (6.7%) | 10 (3.1%) |
| 85 Years and over | 0 (0.0%) | 71 (22.3%) |
| Total | 165 (100.0%) | 318 (100.0%) |
Families and Households in So Hi
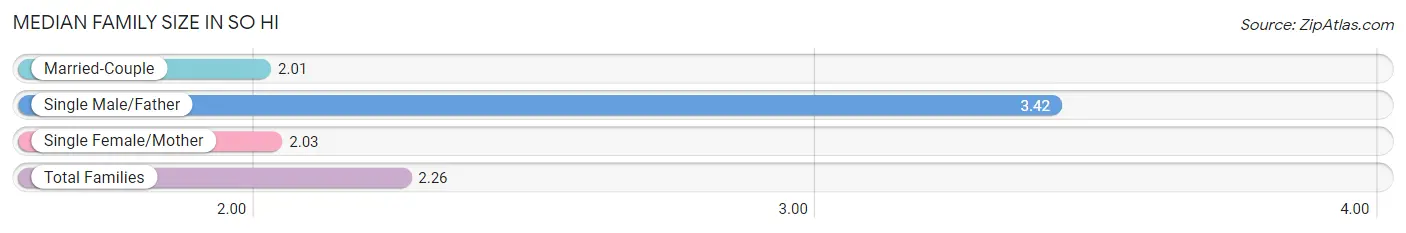
Median Family Size in So Hi
The median family size in So Hi is 2.26 persons per family, with single male/father families (36 | 17.6%) accounting for the largest median family size of 3.42 persons per family. On the other hand, married-couple families (97 | 47.5%) represent the smallest median family size with 2.01 persons per family.
| Family Type | # Families | Family Size |
| Married-Couple | 97 (47.5%) | 2.01 |
| Single Male/Father | 36 (17.6%) | 3.42 |
| Single Female/Mother | 71 (34.8%) | 2.03 |
| Total Families | 204 (100.0%) | 2.26 |
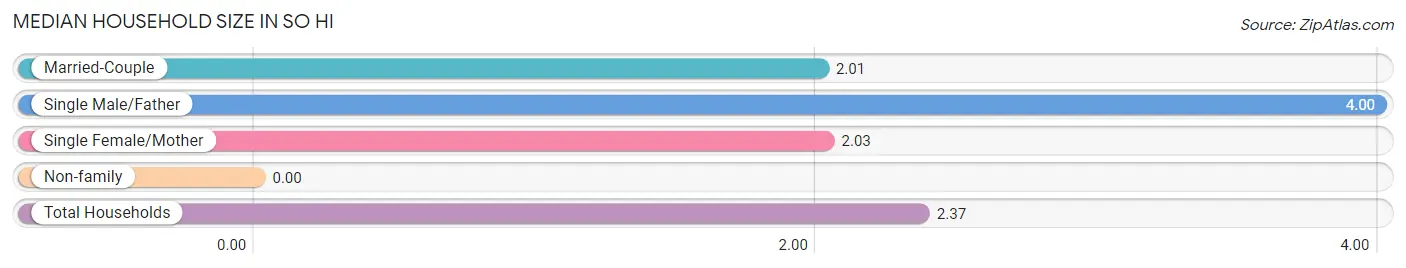
Median Household Size in So Hi
| Household Type | # Households | Household Size |
| Married-Couple | 97 (47.5%) | 2.01 |
| Single Male/Father | 36 (17.6%) | 4.00 |
| Single Female/Mother | 71 (34.8%) | 2.03 |
| Non-family | 0 (0.0%) | - |
| Total Households | 204 (100.0%) | 2.37 |
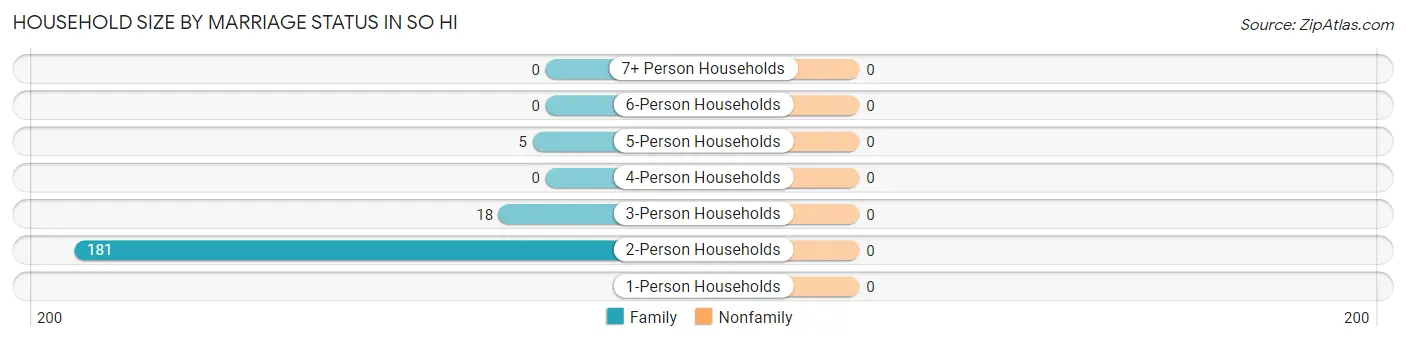
Household Size by Marriage Status in So Hi
| Household Size | Family Households | Nonfamily Households |
| 1-Person Households | - | 0 (0.0%) |
| 2-Person Households | 181 (88.7%) | 0 (0.0%) |
| 3-Person Households | 18 (8.8%) | 0 (0.0%) |
| 4-Person Households | 0 (0.0%) | 0 (0.0%) |
| 5-Person Households | 5 (2.5%) | 0 (0.0%) |
| 6-Person Households | 0 (0.0%) | 0 (0.0%) |
| 7+ Person Households | 0 (0.0%) | 0 (0.0%) |
| Total | 204 (100.0%) | 0 (0.0%) |
Female Fertility in So Hi
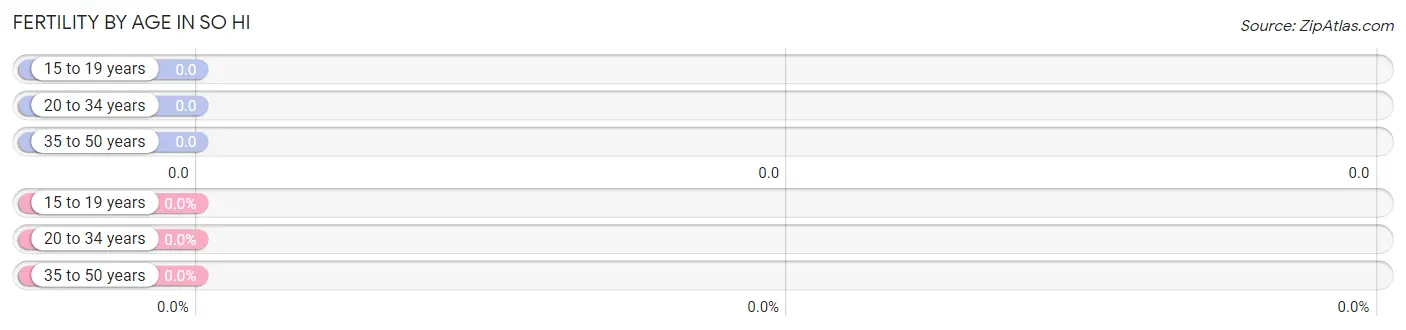
Fertility by Age in So Hi
| Age Bracket | Women with Births | Births / 1,000 Women |
| 15 to 19 years | 0 (0.0%) | 0.0 |
| 20 to 34 years | 0 (0.0%) | 0.0 |
| 35 to 50 years | 0 (0.0%) | 0.0 |
| Total | 0 (0.0%) | 0.0 |
Fertility by Age by Marriage Status in So Hi
| Age Bracket | Married | Unmarried |
| 15 to 19 years | 0 (0.0%) | 0 (0.0%) |
| 20 to 34 years | 0 (0.0%) | 0 (0.0%) |
| 35 to 50 years | 0 (0.0%) | 0 (0.0%) |
| Total | 0 (0.0%) | 0 (0.0%) |
Fertility by Education in So Hi
| Educational Attainment | Women with Births | Births / 1,000 Women |
| Less than High School | 0 (0.0%) | 0.0 |
| High School Diploma | 0 (0.0%) | 0.0 |
| College or Associate's Degree | 0 (0.0%) | 0.0 |
| Bachelor's Degree | 0 (0.0%) | 0.0 |
| Graduate Degree | 0 (0.0%) | 0.0 |
| Total | 0 (0.0%) | 0.0 |
Fertility by Education by Marriage Status in So Hi
| Educational Attainment | Married | Unmarried |
| Less than High School | 0 (0.0%) | 0 (0.0%) |
| High School Diploma | 0 (0.0%) | 0 (0.0%) |
| College or Associate's Degree | 0 (0.0%) | 0 (0.0%) |
| Bachelor's Degree | 0 (0.0%) | 0 (0.0%) |
| Graduate Degree | 0 (0.0%) | 0 (0.0%) |
| Total | 0 (0.0%) | 0 (0.0%) |
Income in So Hi
Income Overview in So Hi
Per Capita Income in So Hi is $20,572, while median incomes of families and households are $48,592 and $48,592 respectively.
| Characteristic | Number | Measure |
| Per Capita Income | 483 | $20,572 |
| Median Family Income | 204 | $48,592 |
| Mean Family Income | 204 | $45,719 |
| Median Household Income | 204 | $48,592 |
| Mean Household Income | 204 | $45,719 |
| Income Deficit | 204 | $0 |
| Wage / Income Gap (%) | 483 | 0.00% |
| Wage / Income Gap ($) | 483 | 100.00¢ per $1 |
| Gini / Inequality Index | 483 | 0.28 |
Earnings by Sex in So Hi
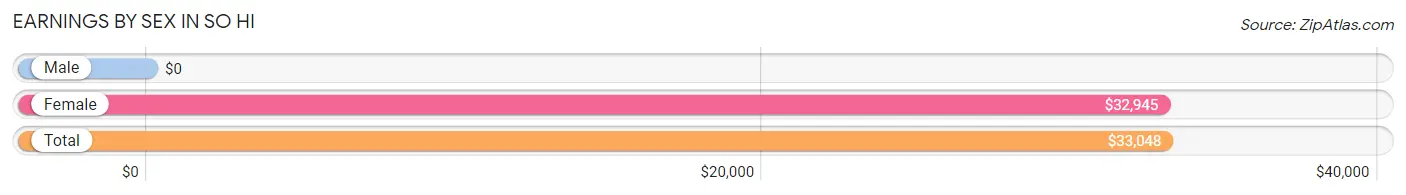
| Sex | Number | Average Earnings |
| Male | 66 (35.5%) | $0 |
| Female | 120 (64.5%) | $32,945 |
| Total | 186 (100.0%) | $33,048 |
Earnings by Sex by Income Bracket in So Hi
The most common earnings brackets in So Hi are $65,000 to $74,999 for men (31 | 47.0%) and $30,000 to $34,999 for women (73 | 60.8%).
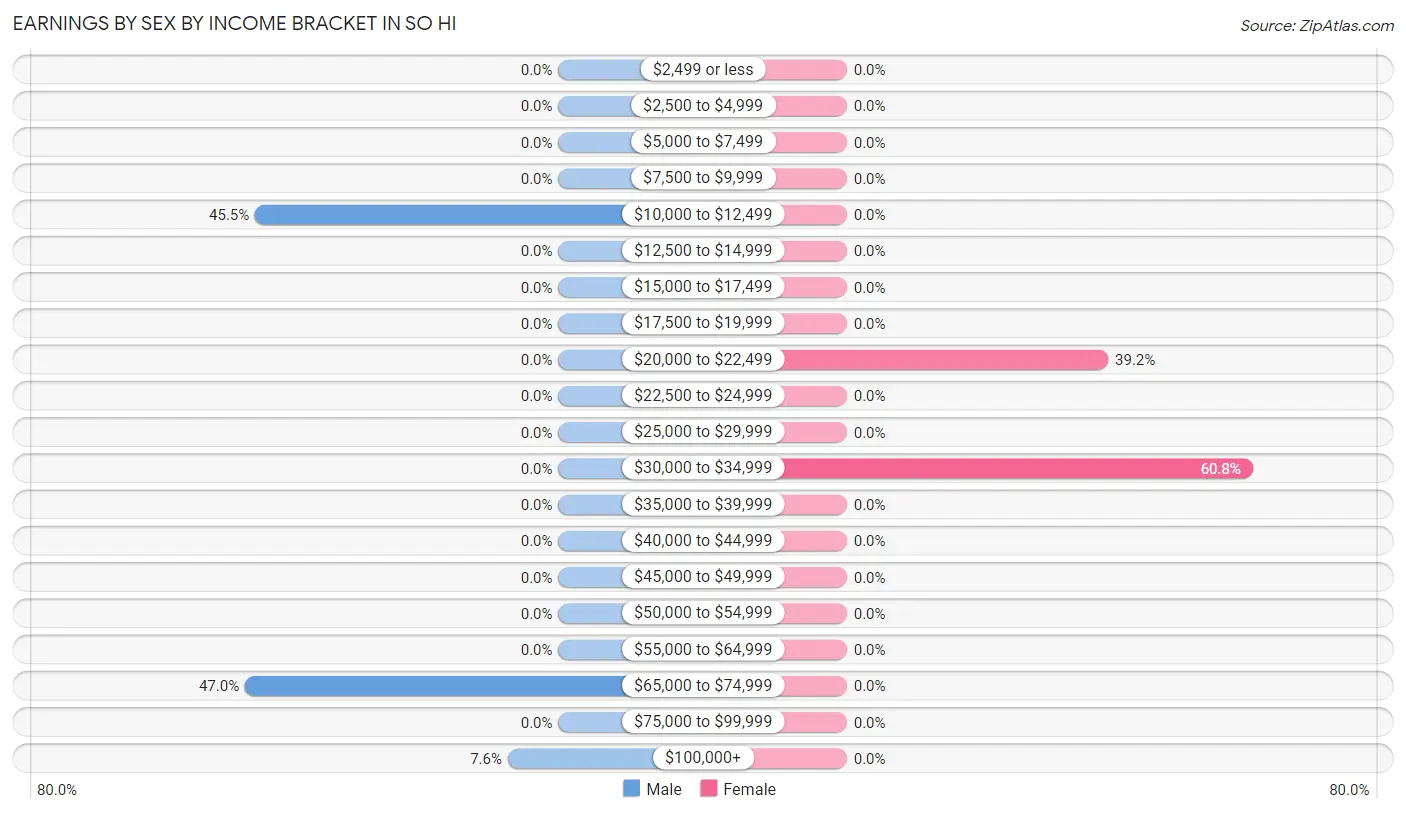
| Income | Male | Female |
| $2,499 or less | 0 (0.0%) | 0 (0.0%) |
| $2,500 to $4,999 | 0 (0.0%) | 0 (0.0%) |
| $5,000 to $7,499 | 0 (0.0%) | 0 (0.0%) |
| $7,500 to $9,999 | 0 (0.0%) | 0 (0.0%) |
| $10,000 to $12,499 | 30 (45.5%) | 0 (0.0%) |
| $12,500 to $14,999 | 0 (0.0%) | 0 (0.0%) |
| $15,000 to $17,499 | 0 (0.0%) | 0 (0.0%) |
| $17,500 to $19,999 | 0 (0.0%) | 0 (0.0%) |
| $20,000 to $22,499 | 0 (0.0%) | 47 (39.2%) |
| $22,500 to $24,999 | 0 (0.0%) | 0 (0.0%) |
| $25,000 to $29,999 | 0 (0.0%) | 0 (0.0%) |
| $30,000 to $34,999 | 0 (0.0%) | 73 (60.8%) |
| $35,000 to $39,999 | 0 (0.0%) | 0 (0.0%) |
| $40,000 to $44,999 | 0 (0.0%) | 0 (0.0%) |
| $45,000 to $49,999 | 0 (0.0%) | 0 (0.0%) |
| $50,000 to $54,999 | 0 (0.0%) | 0 (0.0%) |
| $55,000 to $64,999 | 0 (0.0%) | 0 (0.0%) |
| $65,000 to $74,999 | 31 (47.0%) | 0 (0.0%) |
| $75,000 to $99,999 | 0 (0.0%) | 0 (0.0%) |
| $100,000+ | 5 (7.6%) | 0 (0.0%) |
| Total | 66 (100.0%) | 120 (100.0%) |
Earnings by Sex by Educational Attainment in So Hi
| Educational Attainment | Male Income | Female Income |
| Less than High School | - | - |
| High School Diploma | - | - |
| College or Associate's Degree | - | - |
| Bachelor's Degree | - | - |
| Graduate Degree | - | - |
| Total | - | - |
Family Income in So Hi
Family Income Brackets in So Hi
According to the So Hi family income data, there are 71 families falling into the $35,000 to $49,999 income range, which is the most common income bracket and makes up 34.8% of all families.
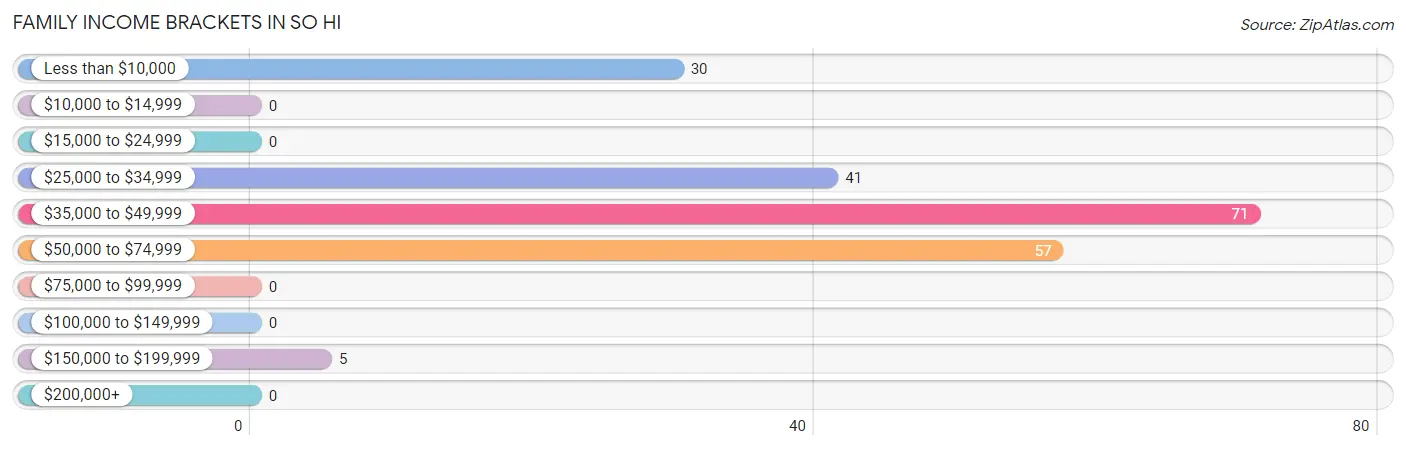
| Income Bracket | # Families | % Families |
| Less than $10,000 | 30 | 14.7% |
| $10,000 to $14,999 | 0 | 0.0% |
| $15,000 to $24,999 | 0 | 0.0% |
| $25,000 to $34,999 | 41 | 20.1% |
| $35,000 to $49,999 | 71 | 34.8% |
| $50,000 to $74,999 | 57 | 27.9% |
| $75,000 to $99,999 | 0 | 0.0% |
| $100,000 to $149,999 | 0 | 0.0% |
| $150,000 to $199,999 | 5 | 2.5% |
| $200,000+ | 0 | 0.0% |
Family Income by Famaliy Size in So Hi
2-person families (181 | 88.7%) account for the highest median family income in So Hi with $48,820 per family, while 2-person families (181 | 88.7%) have the highest median income of $24,410 per family member.
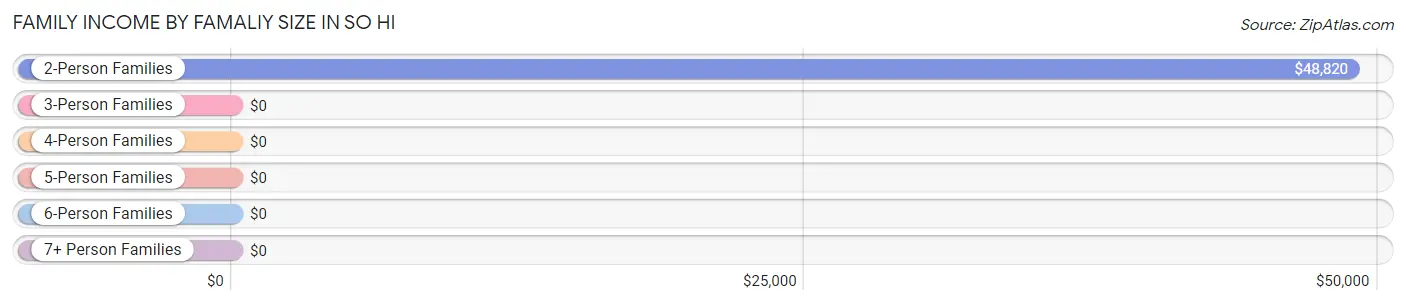
| Income Bracket | # Families | Median Income |
| 2-Person Families | 181 (88.7%) | $48,820 |
| 3-Person Families | 18 (8.8%) | $0 |
| 4-Person Families | 5 (2.5%) | $0 |
| 5-Person Families | 0 (0.0%) | $0 |
| 6-Person Families | 0 (0.0%) | $0 |
| 7+ Person Families | 0 (0.0%) | $0 |
| Total | 204 (100.0%) | $48,592 |
Family Income by Number of Earners in So Hi
| Number of Earners | # Families | Median Income |
| No Earners | 67 (32.8%) | $0 |
| 1 Earner | 102 (50.0%) | $0 |
| 2 Earners | 35 (17.2%) | $0 |
| 3+ Earners | 0 (0.0%) | $0 |
| Total | 204 (100.0%) | $48,592 |
Household Income in So Hi
Household Income Brackets in So Hi
With 71 households falling in the category, the $35,000 to $49,999 income range is the most frequent in So Hi, accounting for 34.8% of all households.
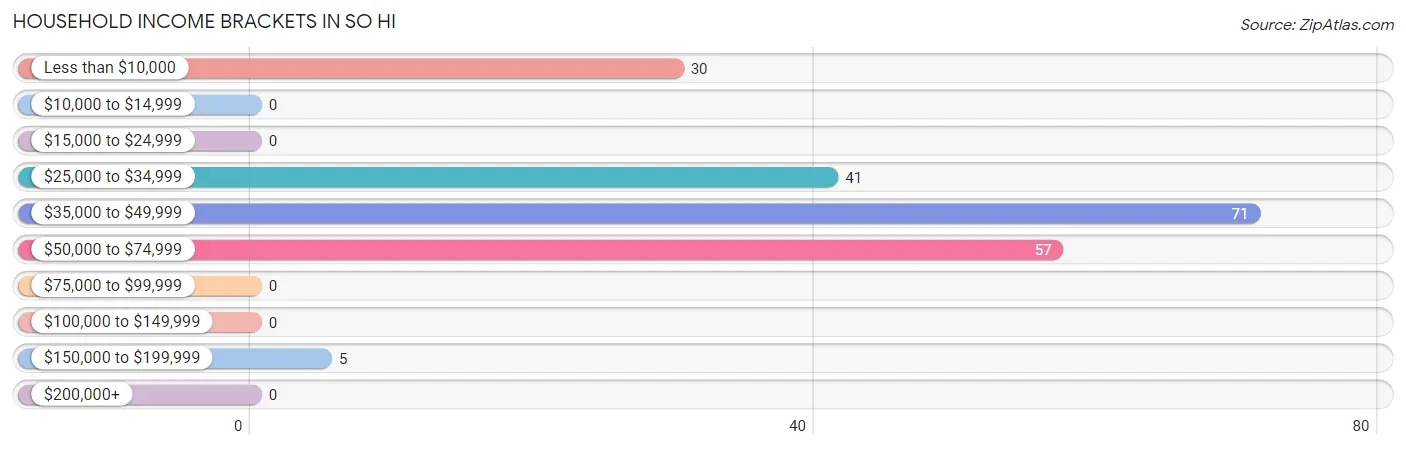
| Income Bracket | # Households | % Households |
| Less than $10,000 | 30 | 14.7% |
| $10,000 to $14,999 | 0 | 0.0% |
| $15,000 to $24,999 | 0 | 0.0% |
| $25,000 to $34,999 | 41 | 20.1% |
| $35,000 to $49,999 | 71 | 34.8% |
| $50,000 to $74,999 | 57 | 27.9% |
| $75,000 to $99,999 | 0 | 0.0% |
| $100,000 to $149,999 | 0 | 0.0% |
| $150,000 to $199,999 | 5 | 2.5% |
| $200,000+ | 0 | 0.0% |
Household Income by Householder Age in So Hi
The median household income in So Hi is $48,592, with the highest median household income of $49,014 found in the 65+ years age bracket for the primary householder. A total of 108 households (52.9%) fall into this category.
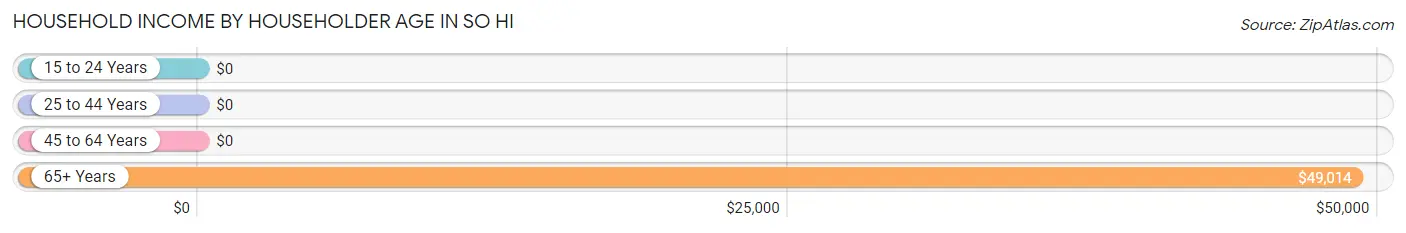
| Income Bracket | # Households | Median Income |
| 15 to 24 Years | 0 (0.0%) | $0 |
| 25 to 44 Years | 0 (0.0%) | $0 |
| 45 to 64 Years | 96 (47.1%) | $0 |
| 65+ Years | 108 (52.9%) | $49,014 |
| Total | 204 (100.0%) | $48,592 |
Poverty in So Hi
Income Below Poverty by Sex and Age in So Hi
With 18.8% poverty level for males and 16.4% for females among the residents of So Hi, 55 to 64 year old males and 45 to 54 year old females are the most vulnerable to poverty, with 13 males (30.2%) and 33 females (100.0%) in their respective age groups living below the poverty level.
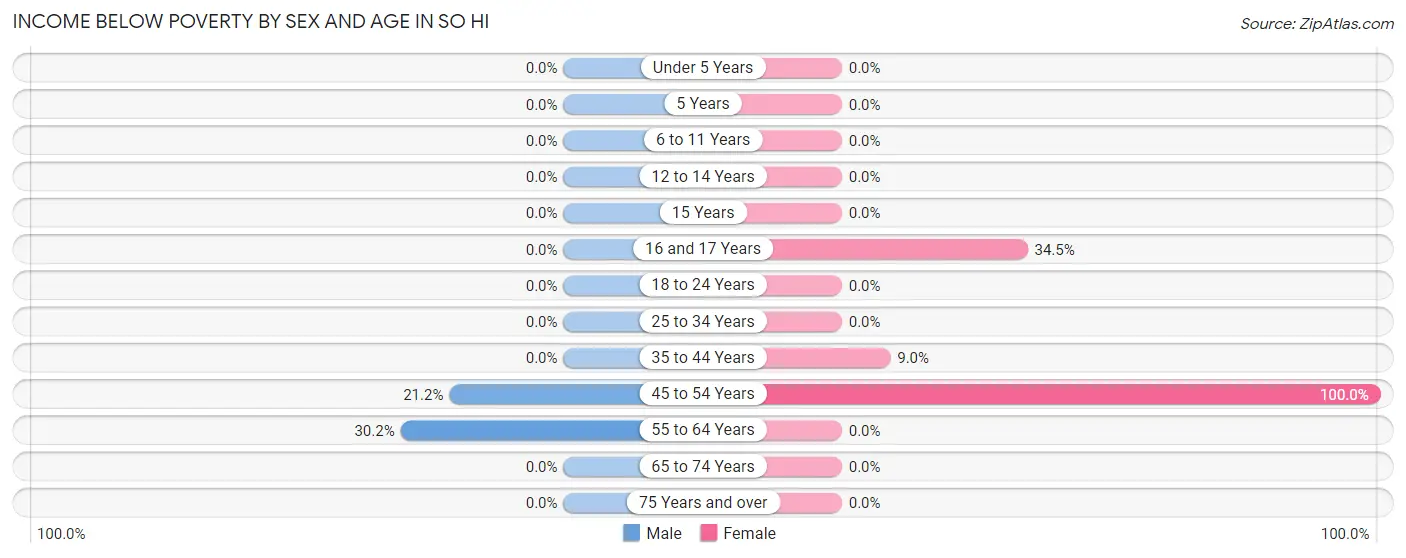
| Age Bracket | Male | Female |
| Under 5 Years | 0 (0.0%) | 0 (0.0%) |
| 5 Years | 0 (0.0%) | 0 (0.0%) |
| 6 to 11 Years | 0 (0.0%) | 0 (0.0%) |
| 12 to 14 Years | 0 (0.0%) | 0 (0.0%) |
| 15 Years | 0 (0.0%) | 0 (0.0%) |
| 16 and 17 Years | 0 (0.0%) | 10 (34.5%) |
| 18 to 24 Years | 0 (0.0%) | 0 (0.0%) |
| 25 to 34 Years | 0 (0.0%) | 0 (0.0%) |
| 35 to 44 Years | 0 (0.0%) | 9 (9.0%) |
| 45 to 54 Years | 18 (21.2%) | 33 (100.0%) |
| 55 to 64 Years | 13 (30.2%) | 0 (0.0%) |
| 65 to 74 Years | 0 (0.0%) | 0 (0.0%) |
| 75 Years and over | 0 (0.0%) | 0 (0.0%) |
| Total | 31 (18.8%) | 52 (16.4%) |
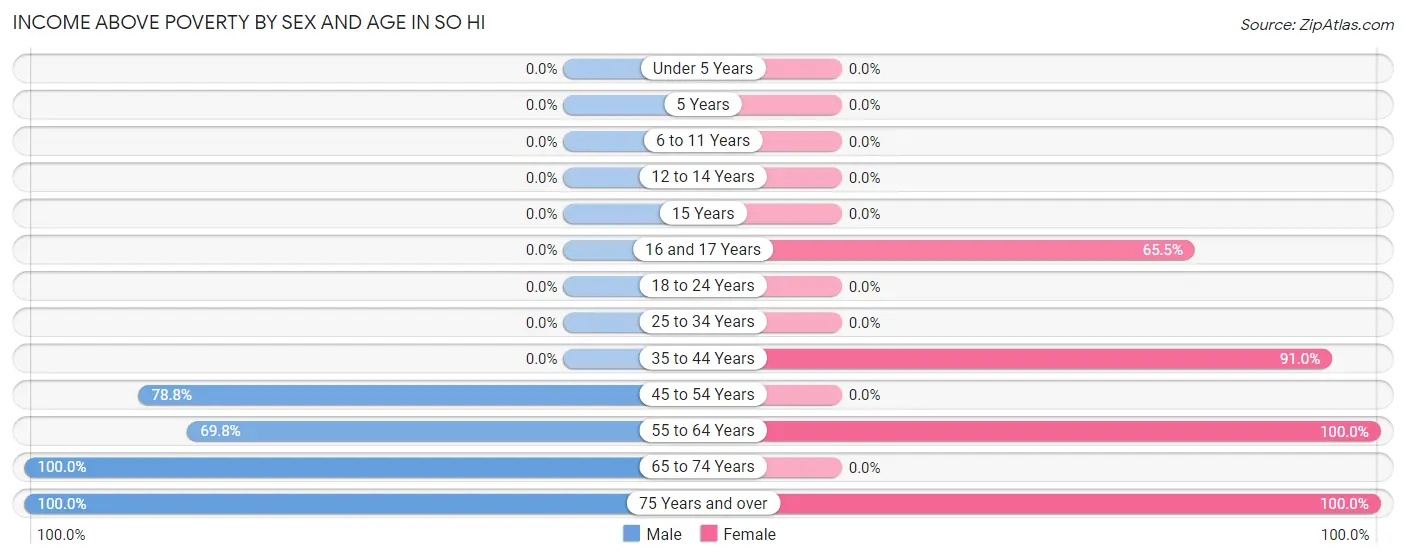
Income Above Poverty by Sex and Age in So Hi
According to the poverty statistics in So Hi, males aged 65 to 74 years and females aged 55 to 64 years are the age groups that are most secure financially, with 100.0% of males and 100.0% of females in these age groups living above the poverty line.
| Age Bracket | Male | Female |
| Under 5 Years | 0 (0.0%) | 0 (0.0%) |
| 5 Years | 0 (0.0%) | 0 (0.0%) |
| 6 to 11 Years | 0 (0.0%) | 0 (0.0%) |
| 12 to 14 Years | 0 (0.0%) | 0 (0.0%) |
| 15 Years | 0 (0.0%) | 0 (0.0%) |
| 16 and 17 Years | 0 (0.0%) | 19 (65.5%) |
| 18 to 24 Years | 0 (0.0%) | 0 (0.0%) |
| 25 to 34 Years | 0 (0.0%) | 0 (0.0%) |
| 35 to 44 Years | 0 (0.0%) | 91 (91.0%) |
| 45 to 54 Years | 67 (78.8%) | 0 (0.0%) |
| 55 to 64 Years | 30 (69.8%) | 56 (100.0%) |
| 65 to 74 Years | 26 (100.0%) | 0 (0.0%) |
| 75 Years and over | 11 (100.0%) | 100 (100.0%) |
| Total | 134 (81.2%) | 266 (83.7%) |
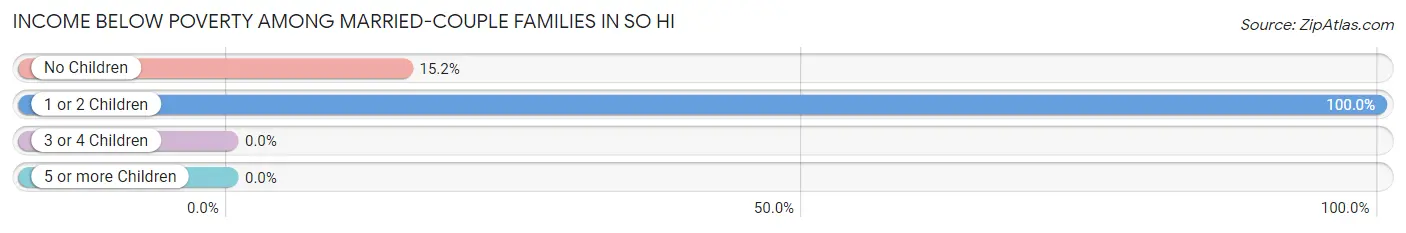
Income Below Poverty Among Married-Couple Families in So Hi
The poverty statistics for married-couple families in So Hi show that 30.9% or 30 of the total 97 families live below the poverty line. Families with 1 or 2 children have the highest poverty rate of 100.0%, comprising of 18 families. On the other hand, families with no children have the lowest poverty rate of 15.2%, which includes 12 families.
| Children | Above Poverty | Below Poverty |
| No Children | 67 (84.8%) | 12 (15.2%) |
| 1 or 2 Children | 0 (0.0%) | 18 (100.0%) |
| 3 or 4 Children | 0 (0.0%) | 0 (0.0%) |
| 5 or more Children | 0 (0.0%) | 0 (0.0%) |
| Total | 67 (69.1%) | 30 (30.9%) |
Income Below Poverty Among Single-Parent Households in So Hi
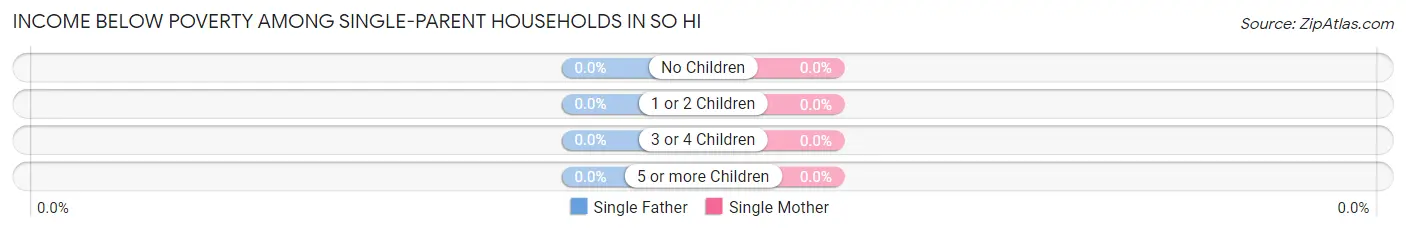
| Children | Single Father | Single Mother |
| No Children | 0 (0.0%) | 0 (0.0%) |
| 1 or 2 Children | 0 (0.0%) | 0 (0.0%) |
| 3 or 4 Children | 0 (0.0%) | 0 (0.0%) |
| 5 or more Children | 0 (0.0%) | 0 (0.0%) |
| Total | 0 (0.0%) | 0 (0.0%) |
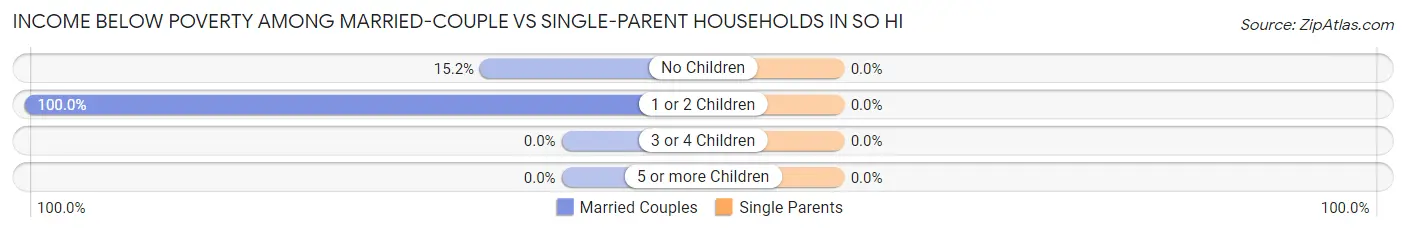
Income Below Poverty Among Married-Couple vs Single-Parent Households in So Hi
| Children | Married-Couple Families | Single-Parent Households |
| No Children | 12 (15.2%) | 0 (0.0%) |
| 1 or 2 Children | 18 (100.0%) | 0 (0.0%) |
| 3 or 4 Children | 0 (0.0%) | 0 (0.0%) |
| 5 or more Children | 0 (0.0%) | 0 (0.0%) |
| Total | 30 (30.9%) | 0 (0.0%) |
Employment Characteristics in So Hi
Employment by Class of Employer in So Hi
Among the 113 employed individuals in So Hi, private company employees (53 | 46.9%), self-employed (incorporated) (31 | 27.4%), and local government employees (29 | 25.7%) make up the most common classes of employment.
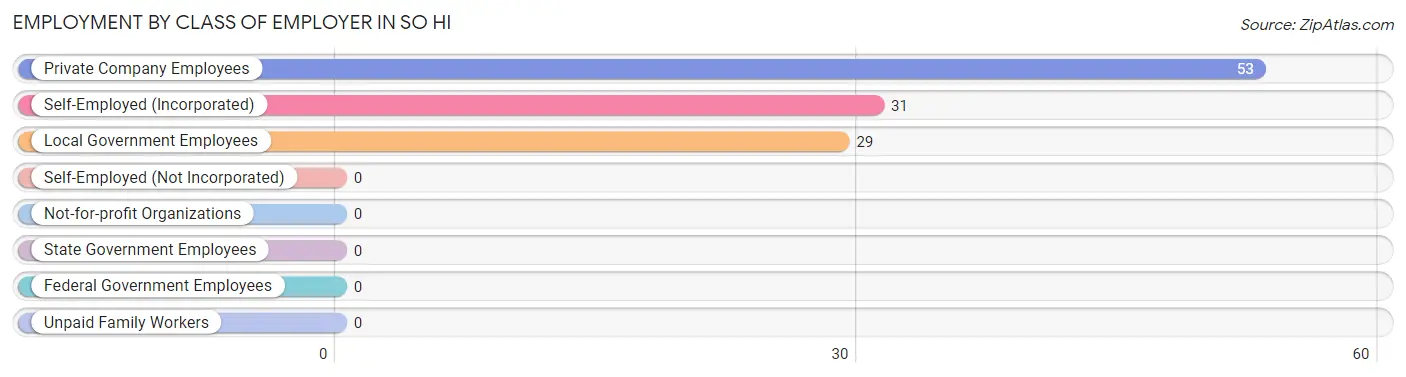
| Employer Class | # Employees | % Employees |
| Private Company Employees | 53 | 46.9% |
| Self-Employed (Incorporated) | 31 | 27.4% |
| Self-Employed (Not Incorporated) | 0 | 0.0% |
| Not-for-profit Organizations | 0 | 0.0% |
| Local Government Employees | 29 | 25.7% |
| State Government Employees | 0 | 0.0% |
| Federal Government Employees | 0 | 0.0% |
| Unpaid Family Workers | 0 | 0.0% |
| Total | 113 | 100.0% |
Employment Status by Age in So Hi
According to the labor force statistics for So Hi, out of the total population over 16 years of age (483), 42.4% or 205 individuals are in the labor force, with 9.3% or 19 of them unemployed. The age group with the highest labor force participation rate is 35 to 44 years, with 91.0% or 91 individuals in the labor force. Within the labor force, the 16 to 19 years age range has the highest percentage of unemployed individuals, with 100.0% or 19 of them being unemployed.
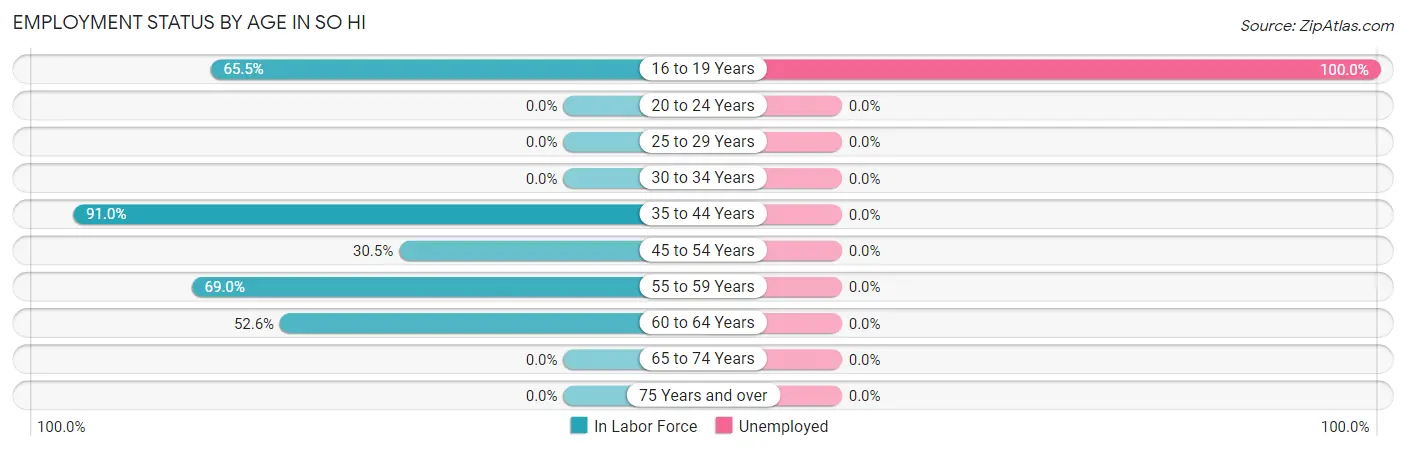
| Age Bracket | In Labor Force | Unemployed |
| 16 to 19 Years | 19 (65.5%) | 19 (100.0%) |
| 20 to 24 Years | 0 (0.0%) | 0 (0.0%) |
| 25 to 29 Years | 0 (0.0%) | 0 (0.0%) |
| 30 to 34 Years | 0 (0.0%) | 0 (0.0%) |
| 35 to 44 Years | 91 (91.0%) | 0 (0.0%) |
| 45 to 54 Years | 36 (30.5%) | 0 (0.0%) |
| 55 to 59 Years | 29 (69.0%) | 0 (0.0%) |
| 60 to 64 Years | 30 (52.6%) | 0 (0.0%) |
| 65 to 74 Years | 0 (0.0%) | 0 (0.0%) |
| 75 Years and over | 0 (0.0%) | 0 (0.0%) |
| Total | 205 (42.4%) | 19 (9.3%) |
Employment Status by Educational Attainment in So Hi
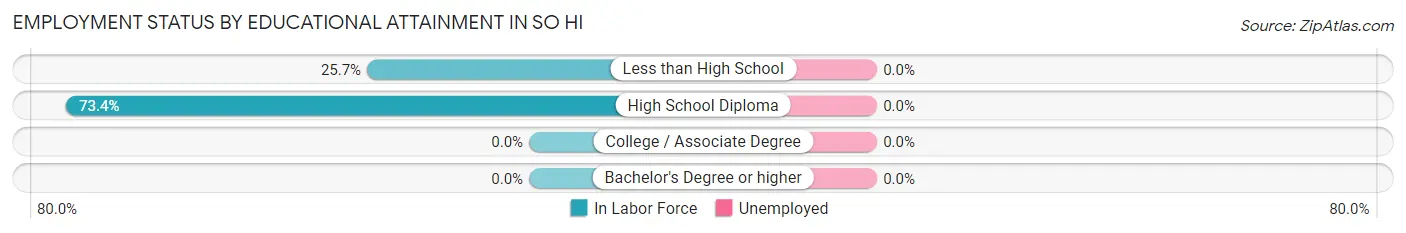
| Educational Attainment | In Labor Force | Unemployed |
| Less than High School | 18 (25.7%) | 0 (0.0%) |
| High School Diploma | 168 (73.4%) | 0 (0.0%) |
| College / Associate Degree | 0 (0.0%) | 0 (0.0%) |
| Bachelor's Degree or higher | 0 (0.0%) | 0 (0.0%) |
| Total | 186 (58.7%) | 0 (0.0%) |
Employment Occupations by Sex in So Hi
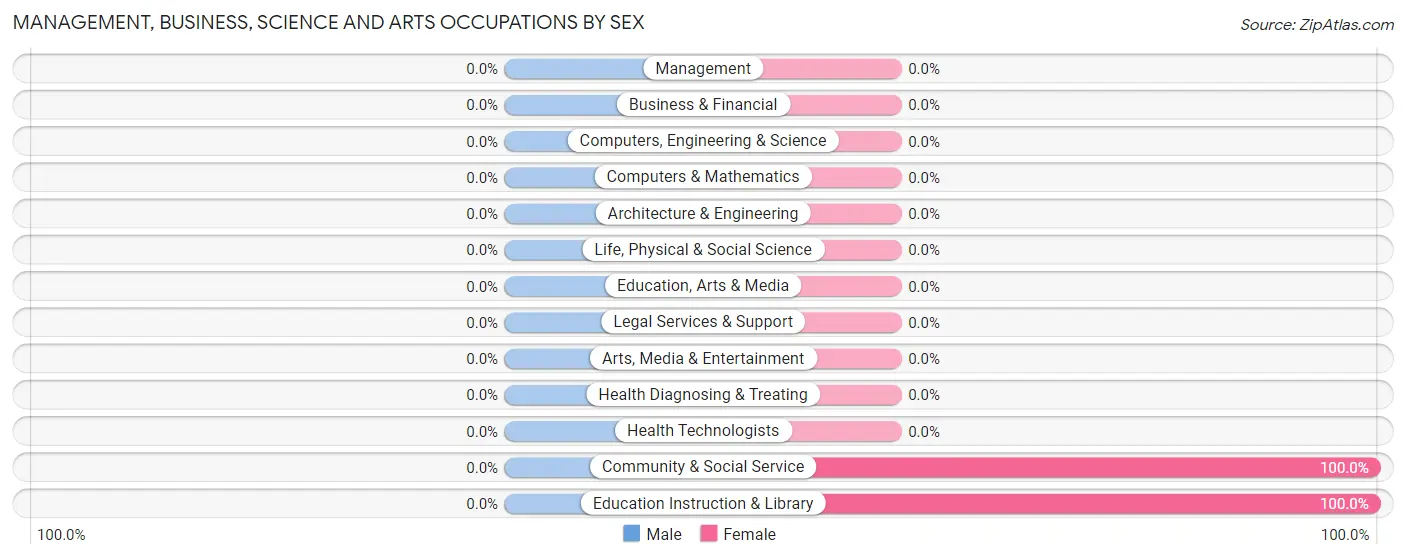
Management, Business, Science and Arts Occupations
The most common Management, Business, Science and Arts occupations in So Hi are Community & Social Service (29 | 15.6%), and Education Instruction & Library (29 | 15.6%).
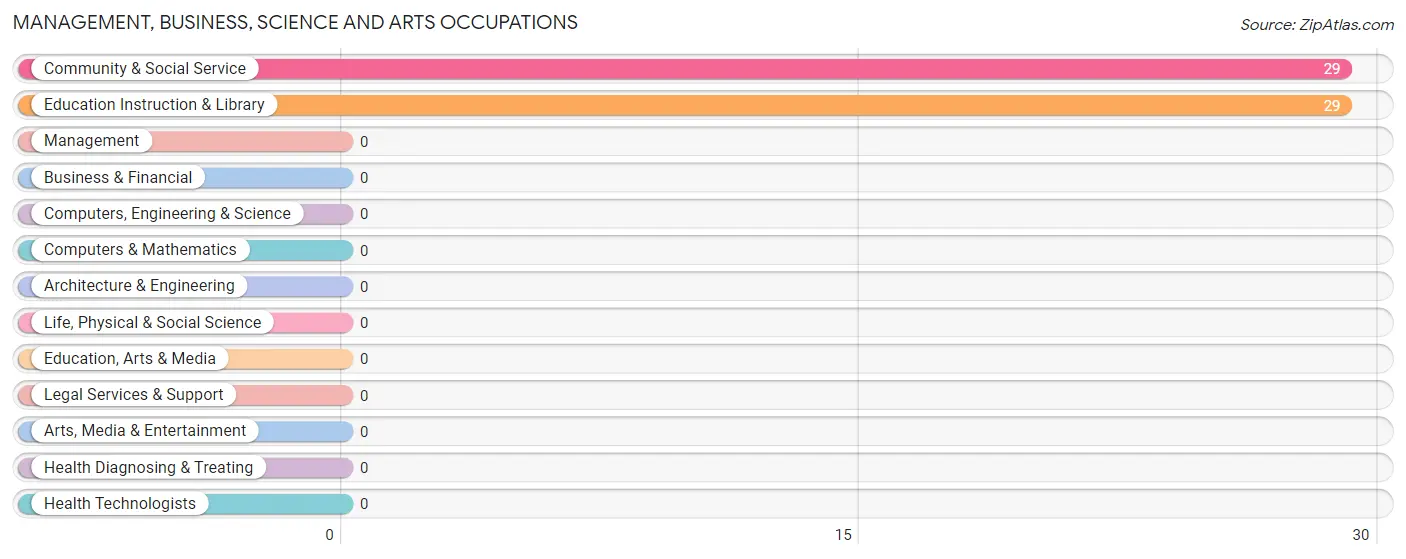
Management, Business, Science and Arts Occupations by Sex
| Occupation | Male | Female |
| Management | 0 (0.0%) | 0 (0.0%) |
| Business & Financial | 0 (0.0%) | 0 (0.0%) |
| Computers, Engineering & Science | 0 (0.0%) | 0 (0.0%) |
| Computers & Mathematics | 0 (0.0%) | 0 (0.0%) |
| Architecture & Engineering | 0 (0.0%) | 0 (0.0%) |
| Life, Physical & Social Science | 0 (0.0%) | 0 (0.0%) |
| Community & Social Service | 0 (0.0%) | 29 (100.0%) |
| Education, Arts & Media | 0 (0.0%) | 0 (0.0%) |
| Legal Services & Support | 0 (0.0%) | 0 (0.0%) |
| Education Instruction & Library | 0 (0.0%) | 29 (100.0%) |
| Arts, Media & Entertainment | 0 (0.0%) | 0 (0.0%) |
| Health Diagnosing & Treating | 0 (0.0%) | 0 (0.0%) |
| Health Technologists | 0 (0.0%) | 0 (0.0%) |
| Total (Category) | 0 (0.0%) | 29 (100.0%) |
| Total (Overall) | 66 (35.5%) | 120 (64.5%) |
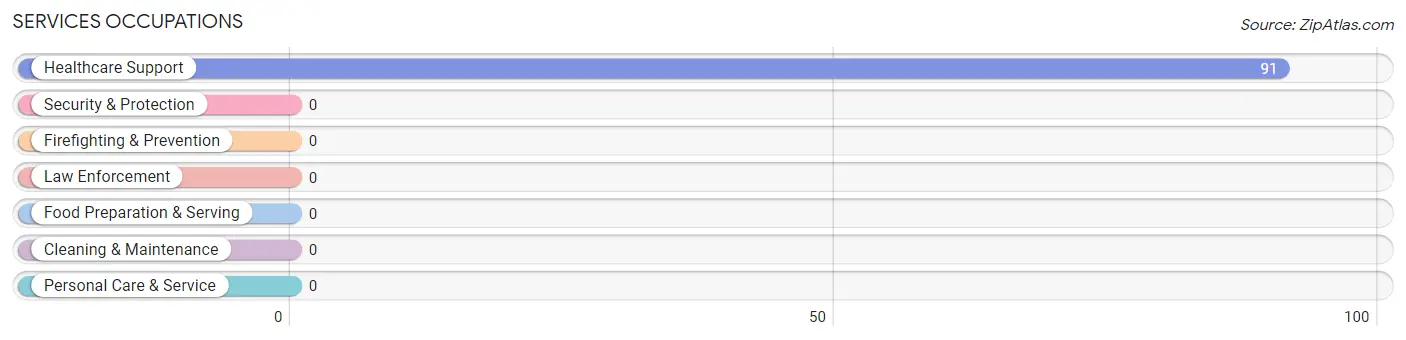
Services Occupations
The most common Services occupations in So Hi are , and Healthcare Support (91 | 48.9%).
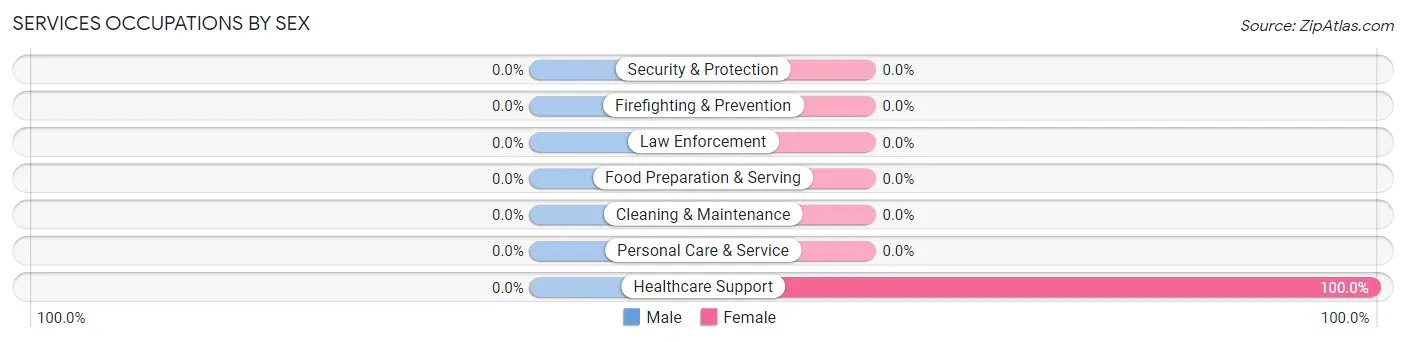
Services Occupations by Sex
| Occupation | Male | Female |
| Healthcare Support | 0 (0.0%) | 91 (100.0%) |
| Security & Protection | 0 (0.0%) | 0 (0.0%) |
| Firefighting & Prevention | 0 (0.0%) | 0 (0.0%) |
| Law Enforcement | 0 (0.0%) | 0 (0.0%) |
| Food Preparation & Serving | 0 (0.0%) | 0 (0.0%) |
| Cleaning & Maintenance | 0 (0.0%) | 0 (0.0%) |
| Personal Care & Service | 0 (0.0%) | 0 (0.0%) |
| Total (Category) | 0 (0.0%) | 91 (100.0%) |
| Total (Overall) | 66 (35.5%) | 120 (64.5%) |
Sales and Office Occupations
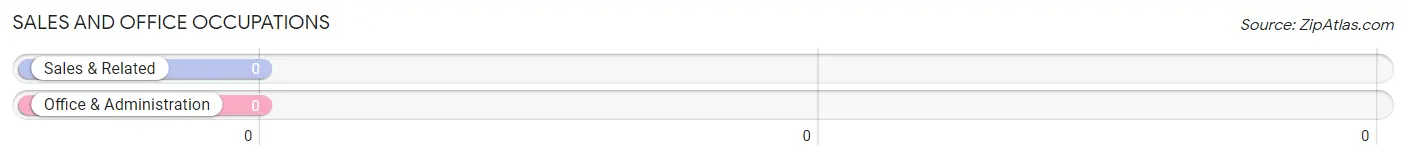
Sales and Office Occupations by Sex
| Occupation | Male | Female |
| Sales & Related | 0 (0.0%) | 0 (0.0%) |
| Office & Administration | 0 (0.0%) | 0 (0.0%) |
| Total (Category) | 0 (0.0%) | 0 (0.0%) |
| Total (Overall) | 66 (35.5%) | 120 (64.5%) |
Natural Resources, Construction and Maintenance Occupations
Natural Resources, Construction and Maintenance Occupations by Sex
| Occupation | Male | Female |
| Farming, Fishing & Forestry | 0 (0.0%) | 0 (0.0%) |
| Construction & Extraction | 0 (0.0%) | 0 (0.0%) |
| Installation, Maintenance & Repair | 0 (0.0%) | 0 (0.0%) |
| Total (Category) | 0 (0.0%) | 0 (0.0%) |
| Total (Overall) | 66 (35.5%) | 120 (64.5%) |
Production, Transportation and Moving Occupations
The most common Production, Transportation and Moving occupations in So Hi are Transportation (36 | 19.4%), and Material Moving (30 | 16.1%).
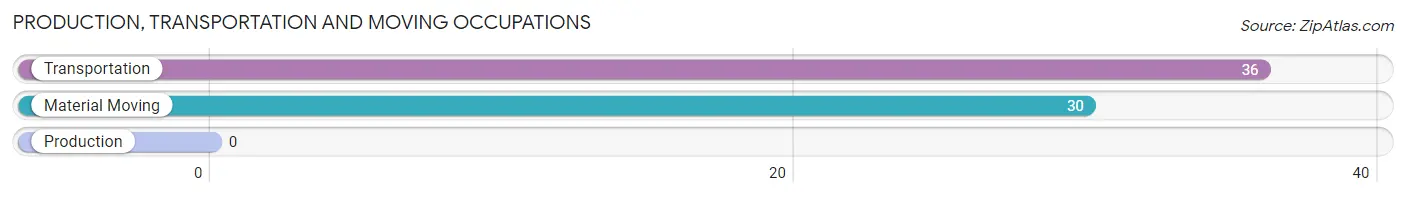
Production, Transportation and Moving Occupations by Sex
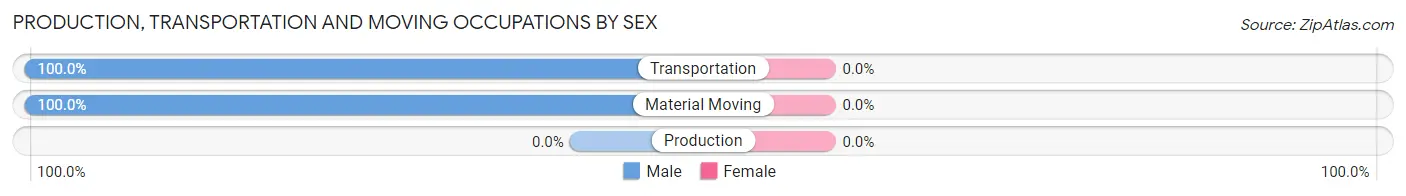
| Occupation | Male | Female |
| Production | 0 (0.0%) | 0 (0.0%) |
| Transportation | 36 (100.0%) | 0 (0.0%) |
| Material Moving | 30 (100.0%) | 0 (0.0%) |
| Total (Category) | 66 (100.0%) | 0 (0.0%) |
| Total (Overall) | 66 (35.5%) | 120 (64.5%) |
Employment Industries by Sex in So Hi
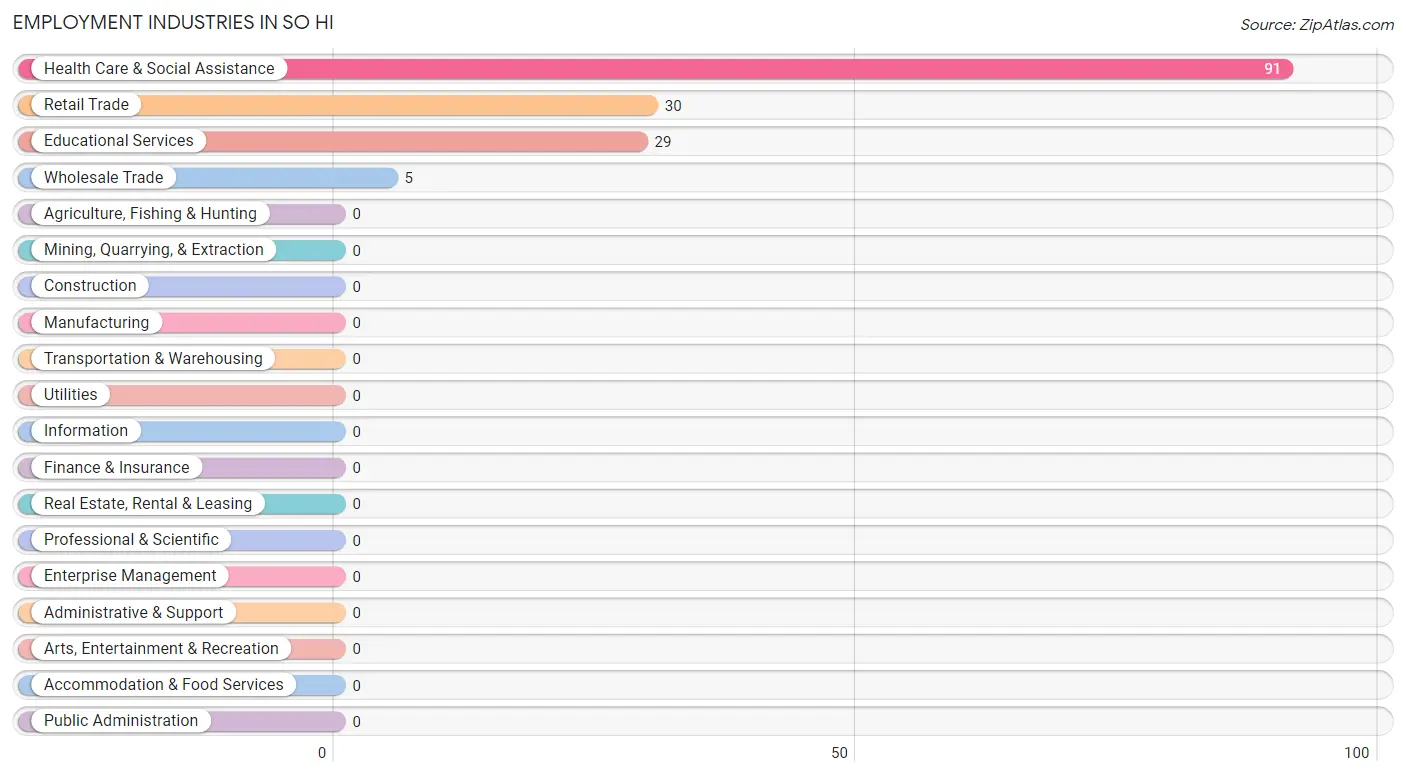
Employment Industries in So Hi
The major employment industries in So Hi include Health Care & Social Assistance (91 | 48.9%), Retail Trade (30 | 16.1%), Educational Services (29 | 15.6%), and Wholesale Trade (5 | 2.7%).
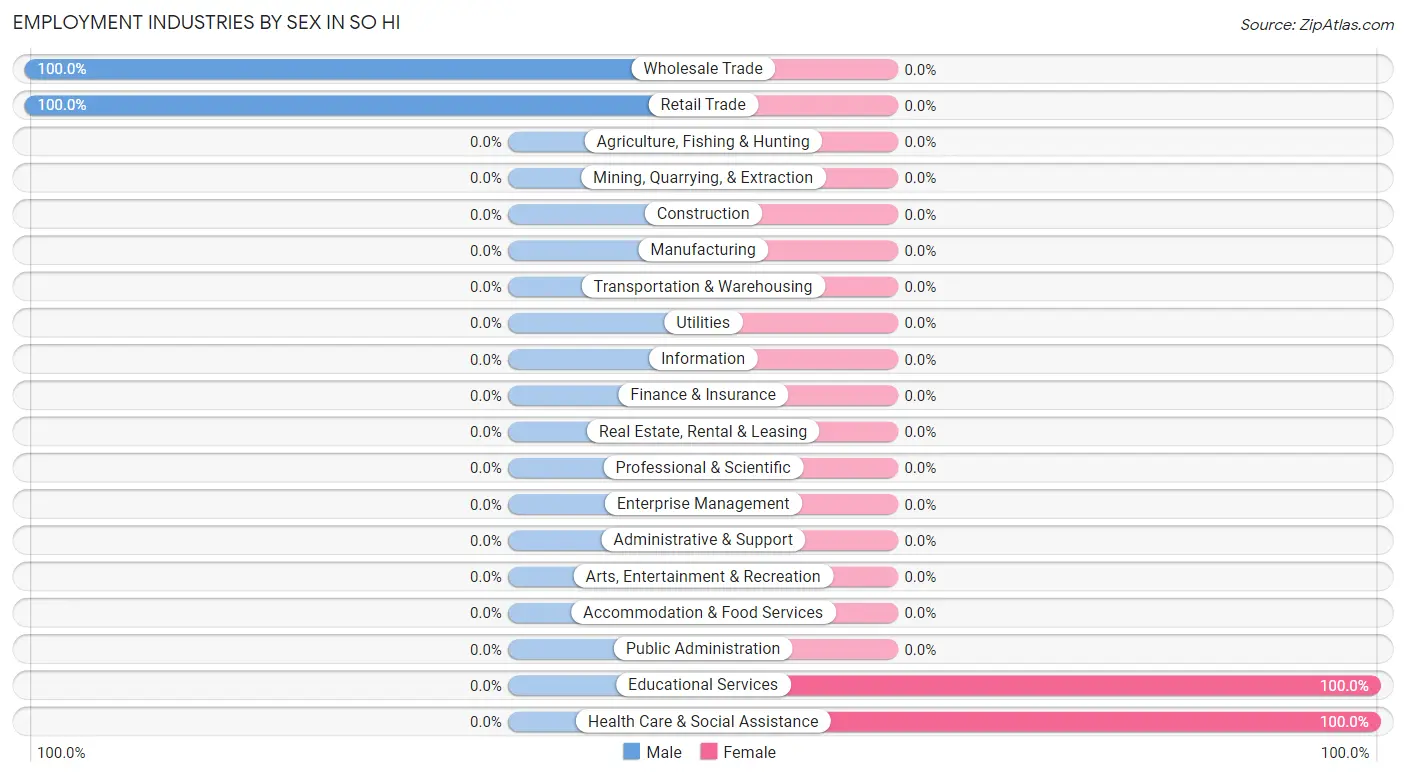
Employment Industries by Sex in So Hi
The So Hi industries that see more men than women are Wholesale Trade (100.0%), and Retail Trade (100.0%), whereas the industries that tend to have a higher number of women are Educational Services (100.0%), and Health Care & Social Assistance (100.0%).
| Industry | Male | Female |
| Agriculture, Fishing & Hunting | 0 (0.0%) | 0 (0.0%) |
| Mining, Quarrying, & Extraction | 0 (0.0%) | 0 (0.0%) |
| Construction | 0 (0.0%) | 0 (0.0%) |
| Manufacturing | 0 (0.0%) | 0 (0.0%) |
| Wholesale Trade | 5 (100.0%) | 0 (0.0%) |
| Retail Trade | 30 (100.0%) | 0 (0.0%) |
| Transportation & Warehousing | 0 (0.0%) | 0 (0.0%) |
| Utilities | 0 (0.0%) | 0 (0.0%) |
| Information | 0 (0.0%) | 0 (0.0%) |
| Finance & Insurance | 0 (0.0%) | 0 (0.0%) |
| Real Estate, Rental & Leasing | 0 (0.0%) | 0 (0.0%) |
| Professional & Scientific | 0 (0.0%) | 0 (0.0%) |
| Enterprise Management | 0 (0.0%) | 0 (0.0%) |
| Administrative & Support | 0 (0.0%) | 0 (0.0%) |
| Educational Services | 0 (0.0%) | 29 (100.0%) |
| Health Care & Social Assistance | 0 (0.0%) | 91 (100.0%) |
| Arts, Entertainment & Recreation | 0 (0.0%) | 0 (0.0%) |
| Accommodation & Food Services | 0 (0.0%) | 0 (0.0%) |
| Public Administration | 0 (0.0%) | 0 (0.0%) |
| Total | 66 (35.5%) | 120 (64.5%) |
Education in So Hi
School Enrollment in So Hi
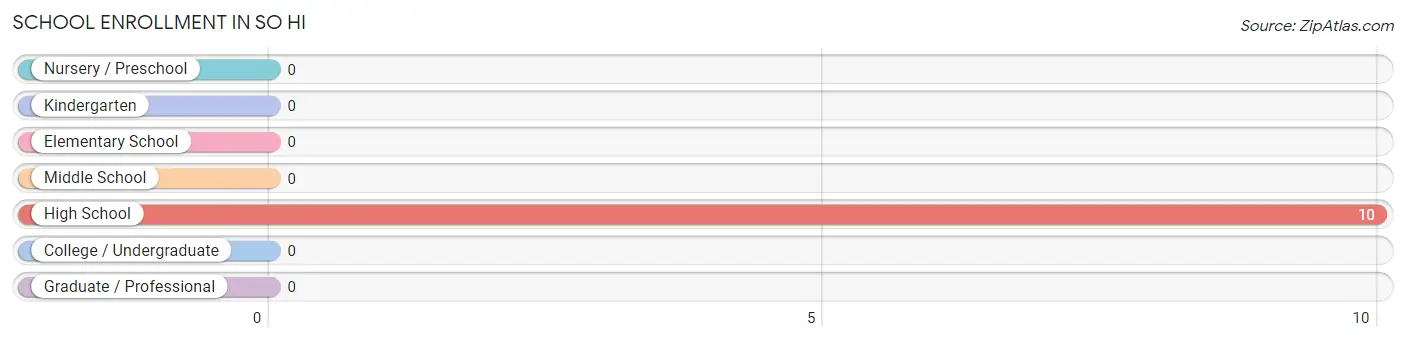
| School Level | # Students | % Students |
| Nursery / Preschool | 0 | 0.0% |
| Kindergarten | 0 | 0.0% |
| Elementary School | 0 | 0.0% |
| Middle School | 0 | 0.0% |
| High School | 10 | 100.0% |
| College / Undergraduate | 0 | 0.0% |
| Graduate / Professional | 0 | 0.0% |
| Total | 10 | 100.0% |
School Enrollment by Age by Funding Source in So Hi
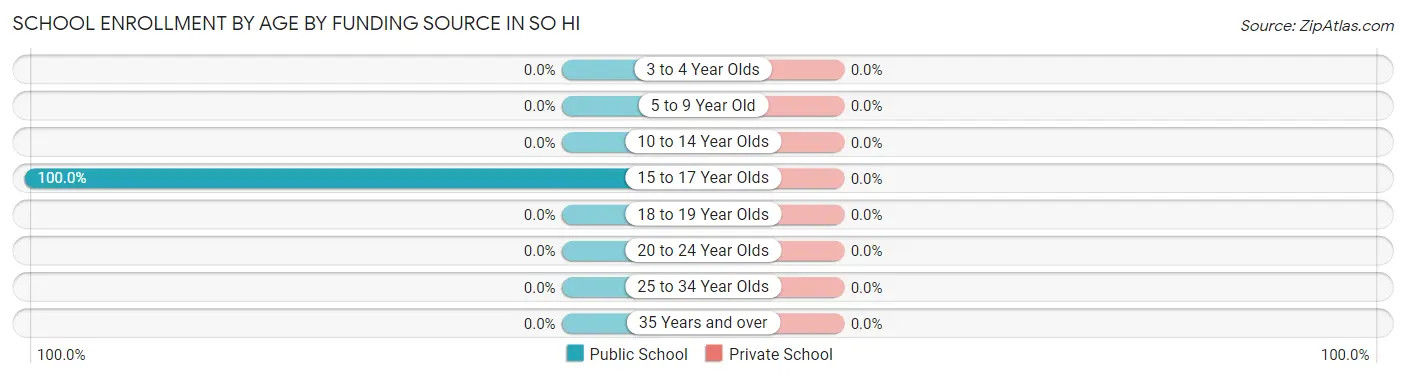
| Age Bracket | Public School | Private School |
| 3 to 4 Year Olds | 0 (0.0%) | 0 (0.0%) |
| 5 to 9 Year Old | 0 (0.0%) | 0 (0.0%) |
| 10 to 14 Year Olds | 0 (0.0%) | 0 (0.0%) |
| 15 to 17 Year Olds | 10 (100.0%) | 0 (0.0%) |
| 18 to 19 Year Olds | 0 (0.0%) | 0 (0.0%) |
| 20 to 24 Year Olds | 0 (0.0%) | 0 (0.0%) |
| 25 to 34 Year Olds | 0 (0.0%) | 0 (0.0%) |
| 35 Years and over | 0 (0.0%) | 0 (0.0%) |
| Total | 10 (100.0%) | 0 (0.0%) |
Educational Attainment by Field of Study in So Hi
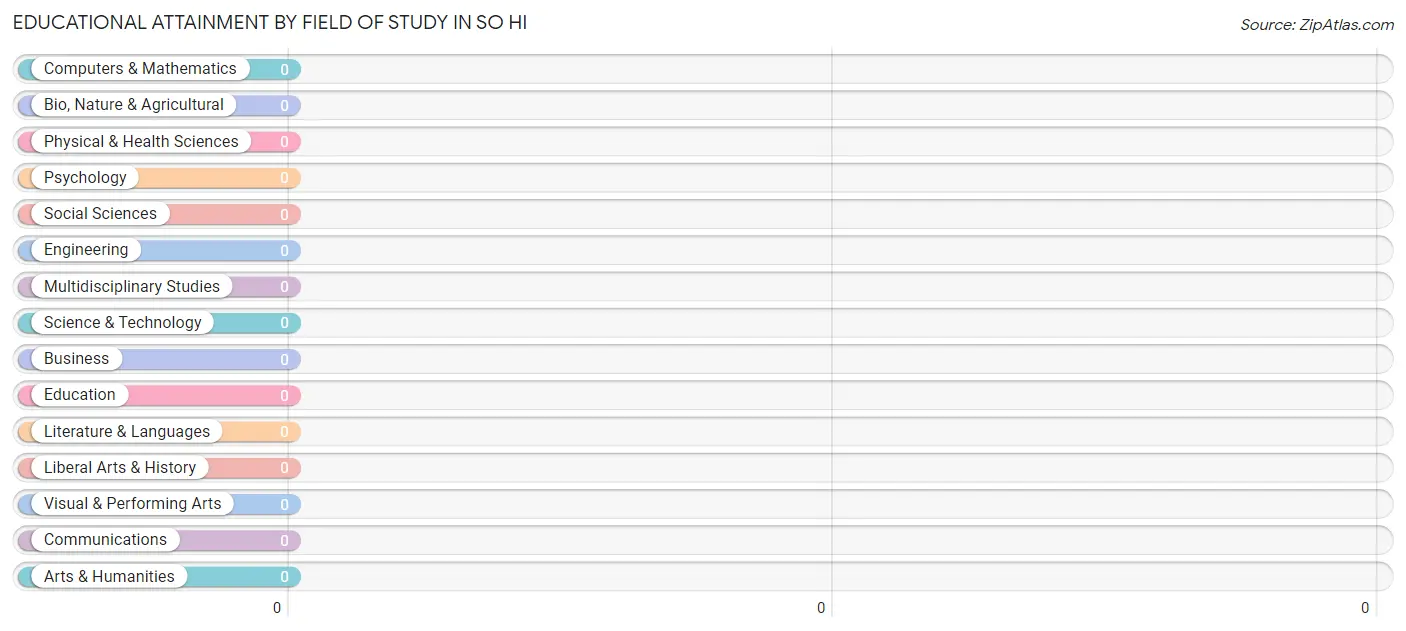
| Field of Study | # Graduates | % Graduates |
| Computers & Mathematics | 0 | 0.0% |
| Bio, Nature & Agricultural | 0 | 0.0% |
| Physical & Health Sciences | 0 | 0.0% |
| Psychology | 0 | 0.0% |
| Social Sciences | 0 | 0.0% |
| Engineering | 0 | 0.0% |
| Multidisciplinary Studies | 0 | 0.0% |
| Science & Technology | 0 | 0.0% |
| Business | 0 | 0.0% |
| Education | 0 | 0.0% |
| Literature & Languages | 0 | 0.0% |
| Liberal Arts & History | 0 | 0.0% |
| Visual & Performing Arts | 0 | 0.0% |
| Communications | 0 | 0.0% |
| Arts & Humanities | 0 | 0.0% |
| Total | 0 | 0.0% |
Transportation & Commute in So Hi
Vehicle Availability by Sex in So Hi
The most prevalent vehicle ownership categories in So Hi are males with 4 vehicles (31, accounting for 47.0%) and females with 4 vehicles (0, making up 66.0%).
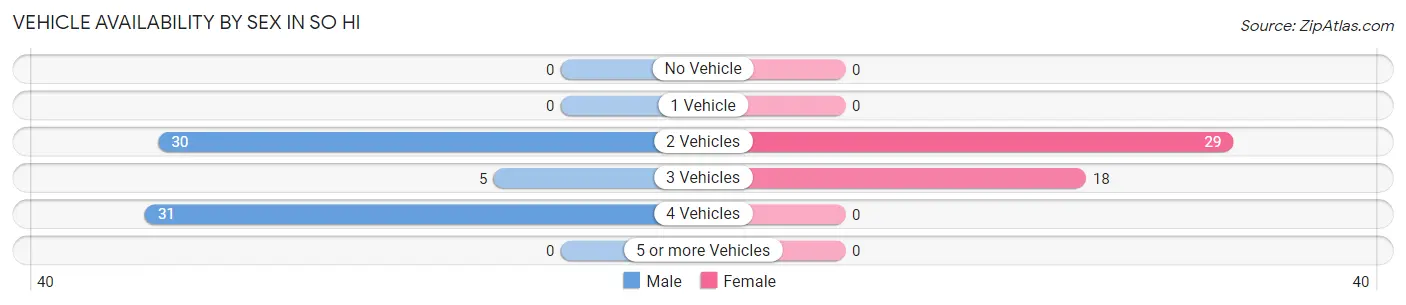
| Vehicles Available | Male | Female |
| No Vehicle | 0 (0.0%) | 0 (0.0%) |
| 1 Vehicle | 0 (0.0%) | 0 (0.0%) |
| 2 Vehicles | 30 (45.5%) | 29 (61.7%) |
| 3 Vehicles | 5 (7.6%) | 18 (38.3%) |
| 4 Vehicles | 31 (47.0%) | 0 (0.0%) |
| 5 or more Vehicles | 0 (0.0%) | 0 (0.0%) |
| Total | 66 (100.0%) | 47 (100.0%) |
Commute Time in So Hi
The most frequently occuring commute durations in So Hi are 20 to 24 minutes (78 commuters, 69.0%), 25 to 29 minutes (30 commuters, 26.6%), and 15 to 19 minutes (5 commuters, 4.4%).
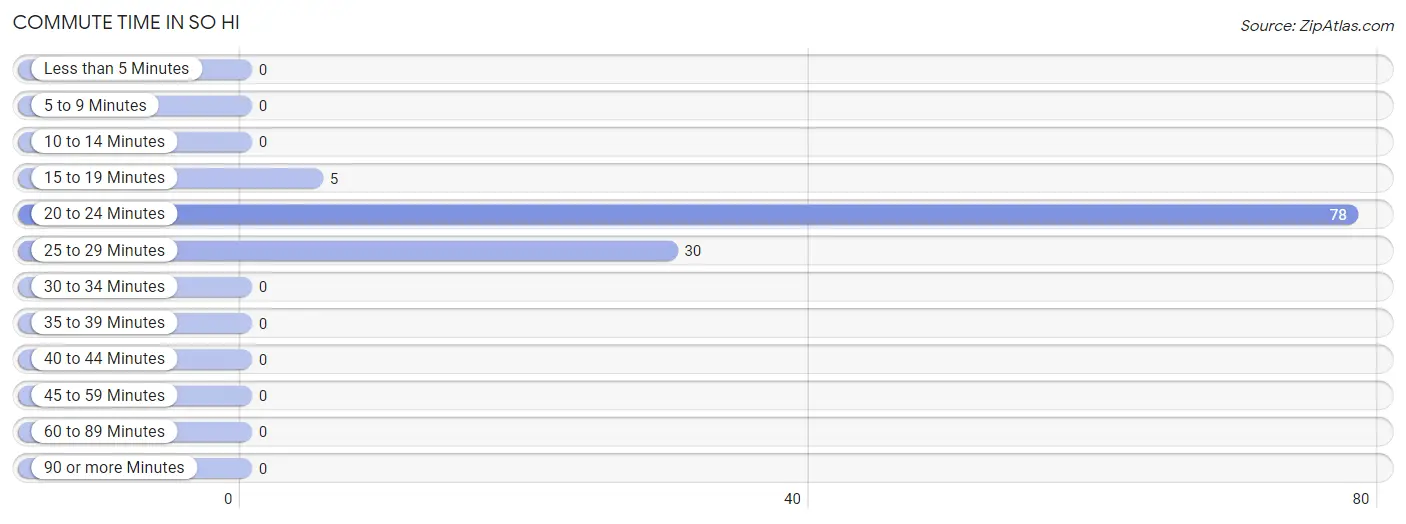
| Commute Time | # Commuters | % Commuters |
| Less than 5 Minutes | 0 | 0.0% |
| 5 to 9 Minutes | 0 | 0.0% |
| 10 to 14 Minutes | 0 | 0.0% |
| 15 to 19 Minutes | 5 | 4.4% |
| 20 to 24 Minutes | 78 | 69.0% |
| 25 to 29 Minutes | 30 | 26.6% |
| 30 to 34 Minutes | 0 | 0.0% |
| 35 to 39 Minutes | 0 | 0.0% |
| 40 to 44 Minutes | 0 | 0.0% |
| 45 to 59 Minutes | 0 | 0.0% |
| 60 to 89 Minutes | 0 | 0.0% |
| 90 or more Minutes | 0 | 0.0% |
Commute Time by Sex in So Hi
The most common commute times in So Hi are 20 to 24 minutes (31 commuters, 47.0%) for males and 20 to 24 minutes (47 commuters, 100.0%) for females.
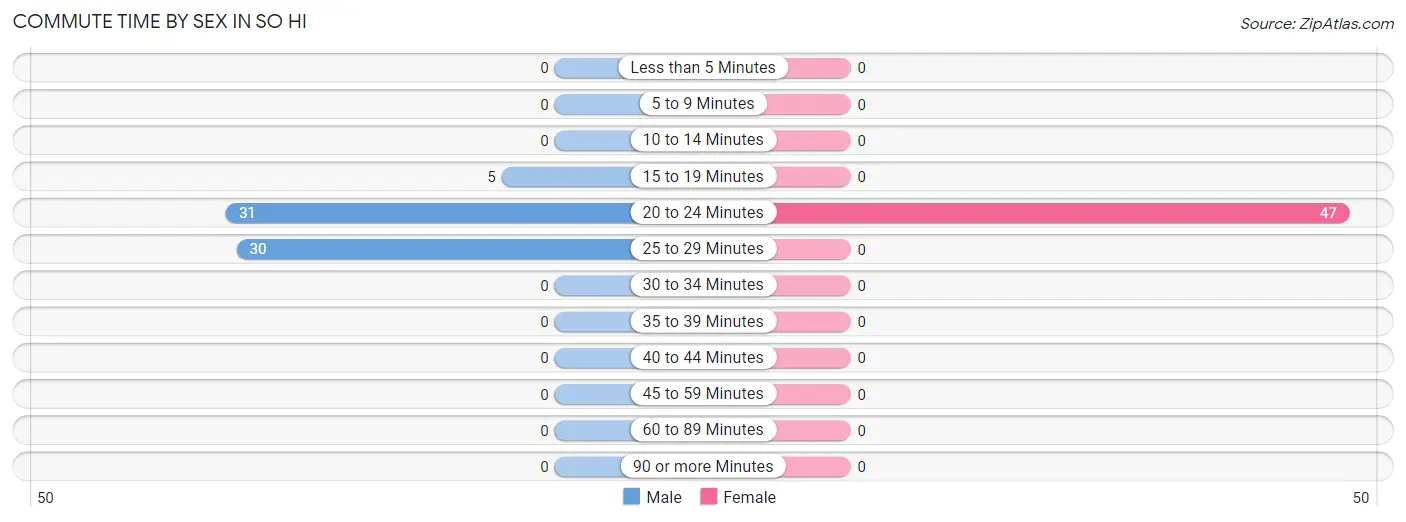
| Commute Time | Male | Female |
| Less than 5 Minutes | 0 (0.0%) | 0 (0.0%) |
| 5 to 9 Minutes | 0 (0.0%) | 0 (0.0%) |
| 10 to 14 Minutes | 0 (0.0%) | 0 (0.0%) |
| 15 to 19 Minutes | 5 (7.6%) | 0 (0.0%) |
| 20 to 24 Minutes | 31 (47.0%) | 47 (100.0%) |
| 25 to 29 Minutes | 30 (45.5%) | 0 (0.0%) |
| 30 to 34 Minutes | 0 (0.0%) | 0 (0.0%) |
| 35 to 39 Minutes | 0 (0.0%) | 0 (0.0%) |
| 40 to 44 Minutes | 0 (0.0%) | 0 (0.0%) |
| 45 to 59 Minutes | 0 (0.0%) | 0 (0.0%) |
| 60 to 89 Minutes | 0 (0.0%) | 0 (0.0%) |
| 90 or more Minutes | 0 (0.0%) | 0 (0.0%) |
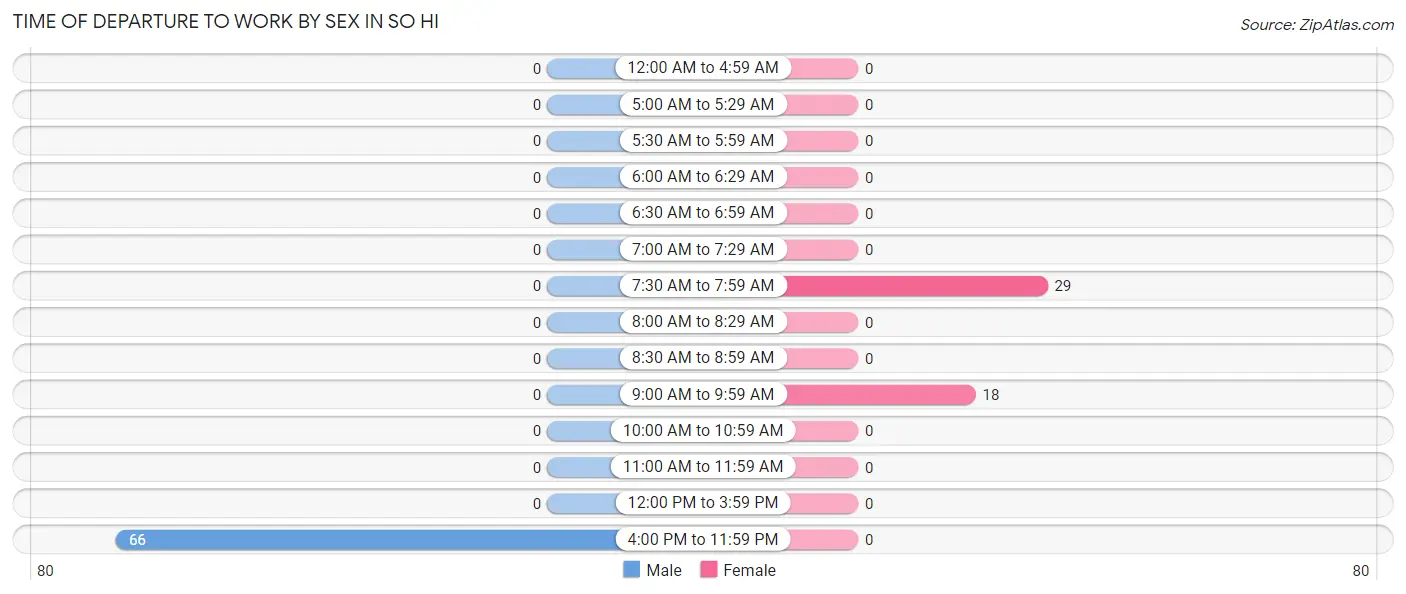
Time of Departure to Work by Sex in So Hi
The most frequent times of departure to work in So Hi are 4:00 PM to 11:59 PM (66, 100.0%) for males and 7:30 AM to 7:59 AM (29, 61.7%) for females.
| Time of Departure | Male | Female |
| 12:00 AM to 4:59 AM | 0 (0.0%) | 0 (0.0%) |
| 5:00 AM to 5:29 AM | 0 (0.0%) | 0 (0.0%) |
| 5:30 AM to 5:59 AM | 0 (0.0%) | 0 (0.0%) |
| 6:00 AM to 6:29 AM | 0 (0.0%) | 0 (0.0%) |
| 6:30 AM to 6:59 AM | 0 (0.0%) | 0 (0.0%) |
| 7:00 AM to 7:29 AM | 0 (0.0%) | 0 (0.0%) |
| 7:30 AM to 7:59 AM | 0 (0.0%) | 29 (61.7%) |
| 8:00 AM to 8:29 AM | 0 (0.0%) | 0 (0.0%) |
| 8:30 AM to 8:59 AM | 0 (0.0%) | 0 (0.0%) |
| 9:00 AM to 9:59 AM | 0 (0.0%) | 18 (38.3%) |
| 10:00 AM to 10:59 AM | 0 (0.0%) | 0 (0.0%) |
| 11:00 AM to 11:59 AM | 0 (0.0%) | 0 (0.0%) |
| 12:00 PM to 3:59 PM | 0 (0.0%) | 0 (0.0%) |
| 4:00 PM to 11:59 PM | 66 (100.0%) | 0 (0.0%) |
| Total | 66 (100.0%) | 47 (100.0%) |
Housing Occupancy in So Hi
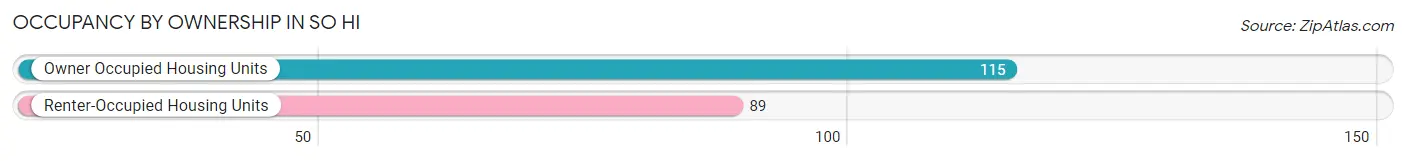
Occupancy by Ownership in So Hi
Of the total 204 dwellings in So Hi, owner-occupied units account for 115 (56.4%), while renter-occupied units make up 89 (43.6%).
| Occupancy | # Housing Units | % Housing Units |
| Owner Occupied Housing Units | 115 | 56.4% |
| Renter-Occupied Housing Units | 89 | 43.6% |
| Total Occupied Housing Units | 204 | 100.0% |
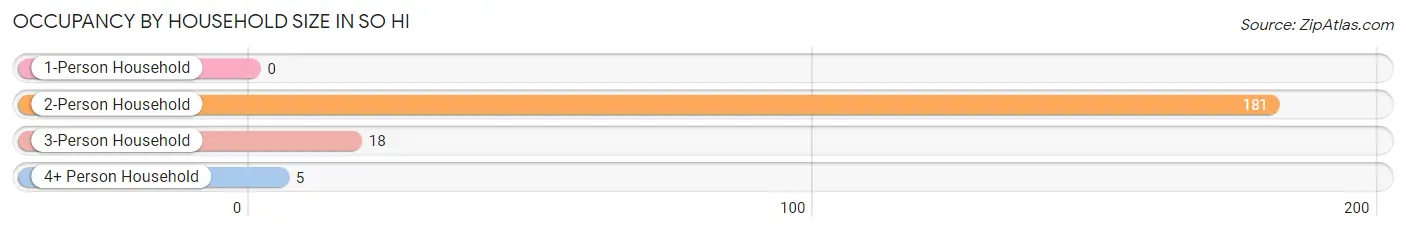
Occupancy by Household Size in So Hi
| Household Size | # Housing Units | % Housing Units |
| 1-Person Household | 0 | 0.0% |
| 2-Person Household | 181 | 88.7% |
| 3-Person Household | 18 | 8.8% |
| 4+ Person Household | 5 | 2.5% |
| Total Housing Units | 204 | 100.0% |
Occupancy by Ownership by Household Size in So Hi
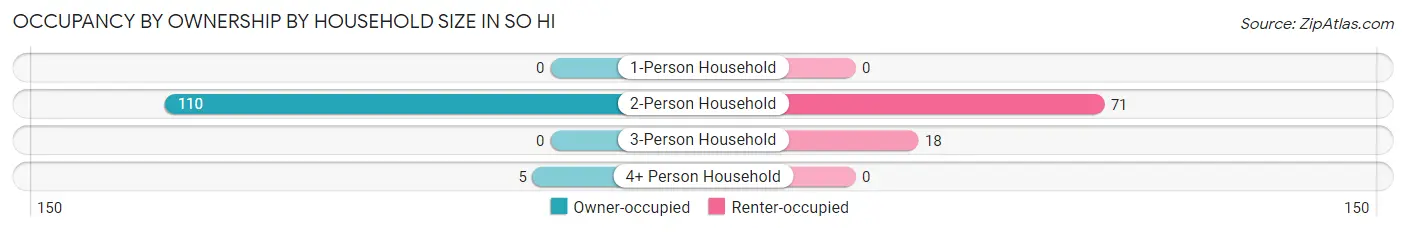
| Household Size | Owner-occupied | Renter-occupied |
| 1-Person Household | 0 (0.0%) | 0 (0.0%) |
| 2-Person Household | 110 (60.8%) | 71 (39.2%) |
| 3-Person Household | 0 (0.0%) | 18 (100.0%) |
| 4+ Person Household | 5 (100.0%) | 0 (0.0%) |
| Total Housing Units | 115 (56.4%) | 89 (43.6%) |
Occupancy by Educational Attainment in So Hi
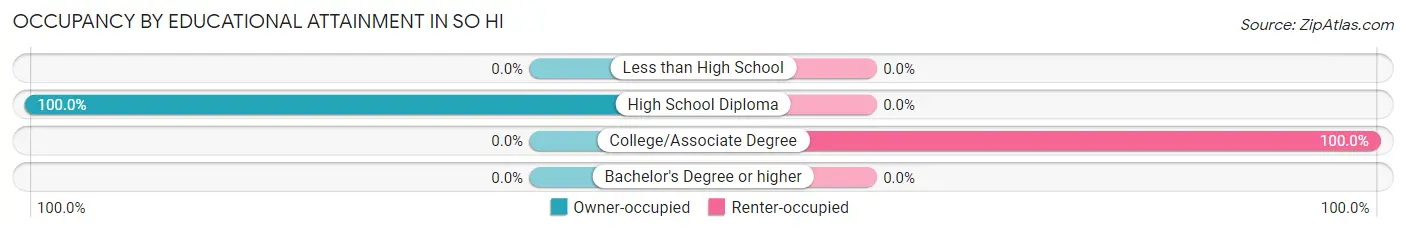
| Household Size | Owner-occupied | Renter-occupied |
| Less than High School | 0 (0.0%) | 0 (0.0%) |
| High School Diploma | 115 (100.0%) | 0 (0.0%) |
| College/Associate Degree | 0 (0.0%) | 89 (100.0%) |
| Bachelor's Degree or higher | 0 (0.0%) | 0 (0.0%) |
Occupancy by Age of Householder in So Hi
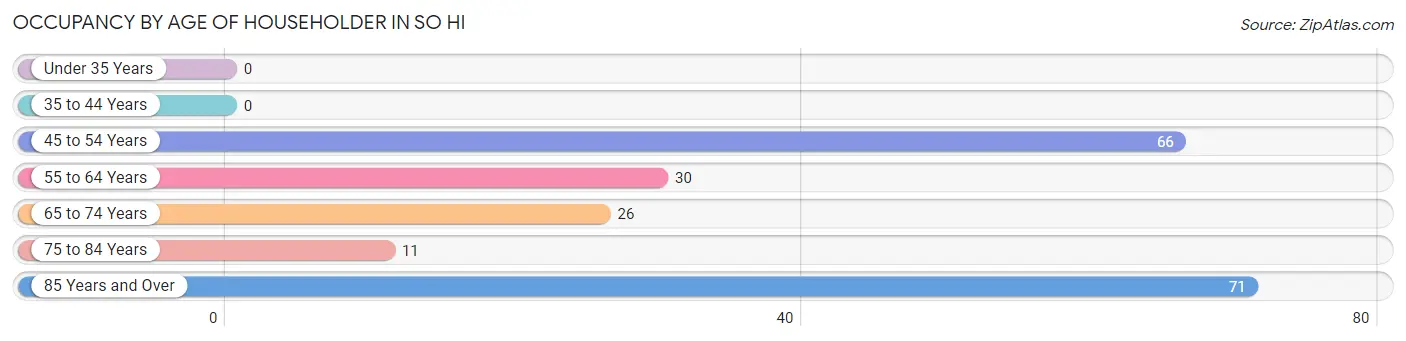
| Age Bracket | # Households | % Households |
| Under 35 Years | 0 | 0.0% |
| 35 to 44 Years | 0 | 0.0% |
| 45 to 54 Years | 66 | 32.4% |
| 55 to 64 Years | 30 | 14.7% |
| 65 to 74 Years | 26 | 12.8% |
| 75 to 84 Years | 11 | 5.4% |
| 85 Years and Over | 71 | 34.8% |
| Total | 204 | 100.0% |
Housing Finances in So Hi
Median Income by Occupancy in So Hi
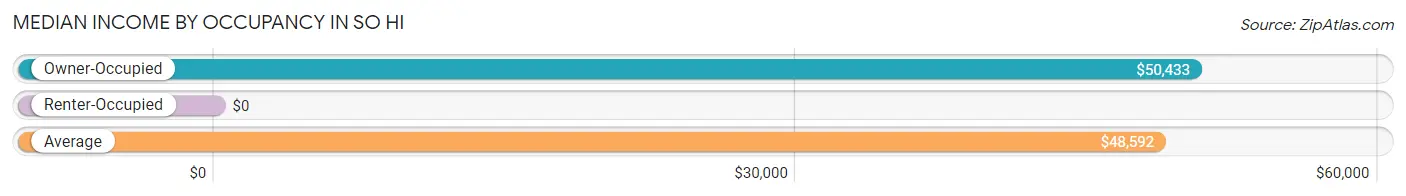
| Occupancy Type | # Households | Median Income |
| Owner-Occupied | 115 (56.4%) | $50,433 |
| Renter-Occupied | 89 (43.6%) | $0 |
| Average | 204 (100.0%) | $48,592 |
Occupancy by Householder Income Bracket in So Hi
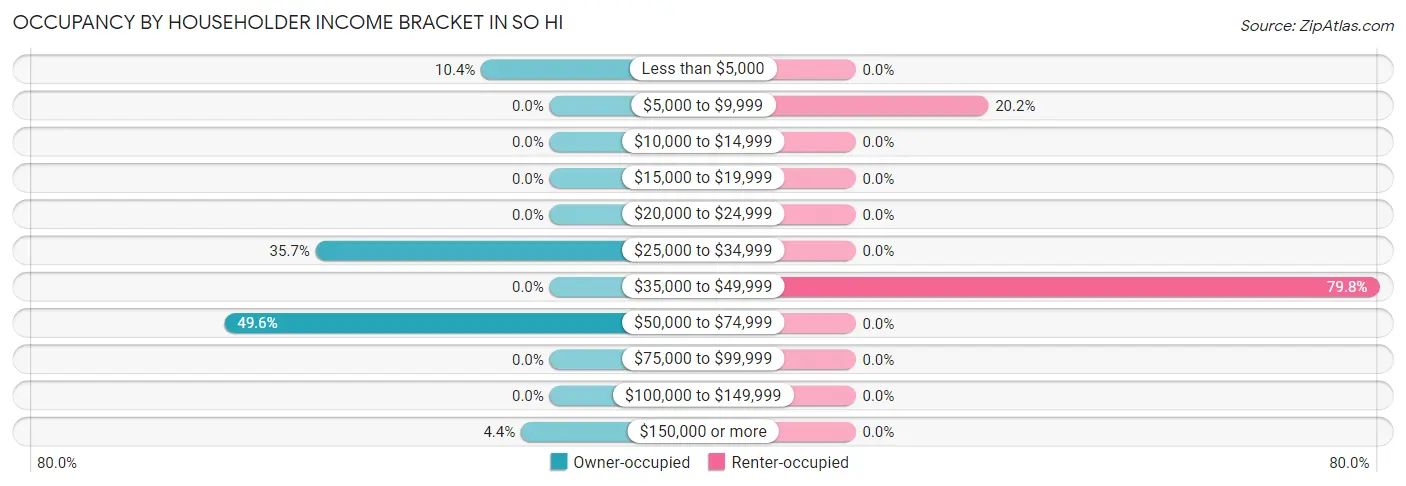
| Income Bracket | Owner-occupied | Renter-occupied |
| Less than $5,000 | 12 (10.4%) | 0 (0.0%) |
| $5,000 to $9,999 | 0 (0.0%) | 18 (20.2%) |
| $10,000 to $14,999 | 0 (0.0%) | 0 (0.0%) |
| $15,000 to $19,999 | 0 (0.0%) | 0 (0.0%) |
| $20,000 to $24,999 | 0 (0.0%) | 0 (0.0%) |
| $25,000 to $34,999 | 41 (35.6%) | 0 (0.0%) |
| $35,000 to $49,999 | 0 (0.0%) | 71 (79.8%) |
| $50,000 to $74,999 | 57 (49.6%) | 0 (0.0%) |
| $75,000 to $99,999 | 0 (0.0%) | 0 (0.0%) |
| $100,000 to $149,999 | 0 (0.0%) | 0 (0.0%) |
| $150,000 or more | 5 (4.3%) | 0 (0.0%) |
| Total | 115 (100.0%) | 89 (100.0%) |
Monthly Housing Cost Tiers in So Hi
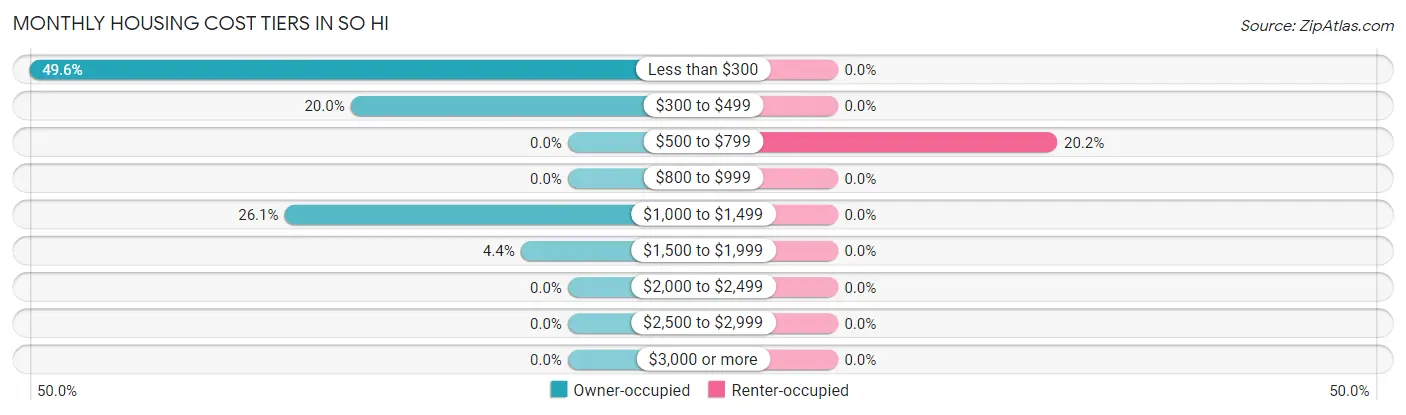
| Monthly Cost | Owner-occupied | Renter-occupied |
| Less than $300 | 57 (49.6%) | 0 (0.0%) |
| $300 to $499 | 23 (20.0%) | 0 (0.0%) |
| $500 to $799 | 0 (0.0%) | 18 (20.2%) |
| $800 to $999 | 0 (0.0%) | 0 (0.0%) |
| $1,000 to $1,499 | 30 (26.1%) | 0 (0.0%) |
| $1,500 to $1,999 | 5 (4.3%) | 0 (0.0%) |
| $2,000 to $2,499 | 0 (0.0%) | 0 (0.0%) |
| $2,500 to $2,999 | 0 (0.0%) | 0 (0.0%) |
| $3,000 or more | 0 (0.0%) | 0 (0.0%) |
| Total | 115 (100.0%) | 89 (100.0%) |
Physical Housing Characteristics in So Hi
Housing Structures in So Hi
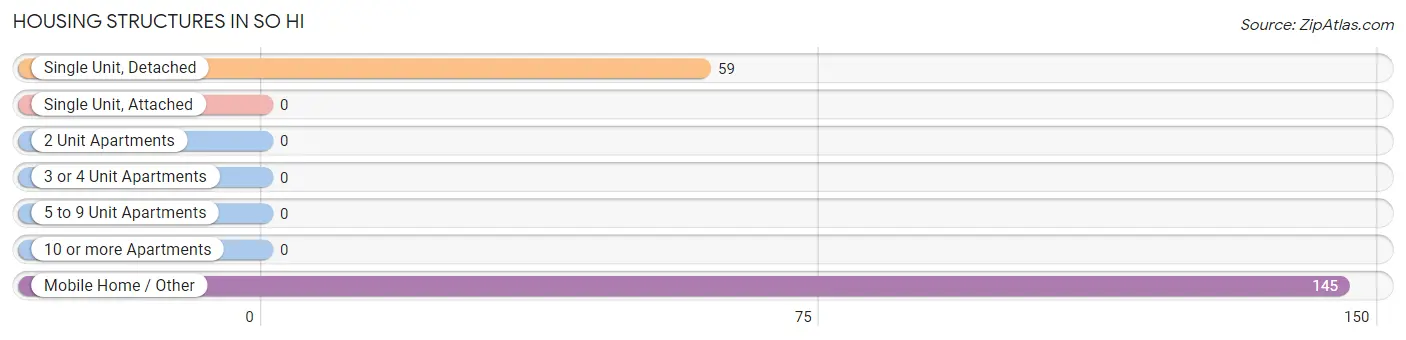
| Structure Type | # Housing Units | % Housing Units |
| Single Unit, Detached | 59 | 28.9% |
| Single Unit, Attached | 0 | 0.0% |
| 2 Unit Apartments | 0 | 0.0% |
| 3 or 4 Unit Apartments | 0 | 0.0% |
| 5 to 9 Unit Apartments | 0 | 0.0% |
| 10 or more Apartments | 0 | 0.0% |
| Mobile Home / Other | 145 | 71.1% |
| Total | 204 | 100.0% |
Housing Structures by Occupancy in So Hi
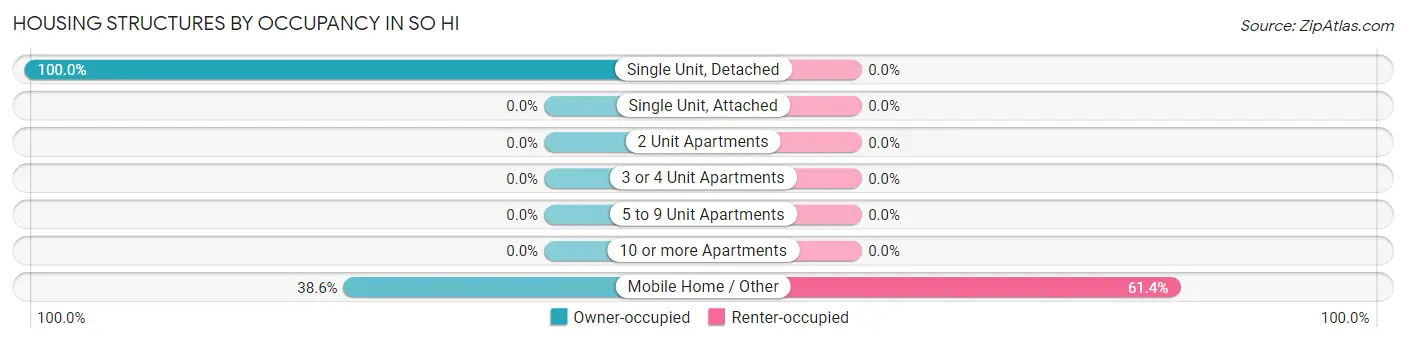
| Structure Type | Owner-occupied | Renter-occupied |
| Single Unit, Detached | 59 (100.0%) | 0 (0.0%) |
| Single Unit, Attached | 0 (0.0%) | 0 (0.0%) |
| 2 Unit Apartments | 0 (0.0%) | 0 (0.0%) |
| 3 or 4 Unit Apartments | 0 (0.0%) | 0 (0.0%) |
| 5 to 9 Unit Apartments | 0 (0.0%) | 0 (0.0%) |
| 10 or more Apartments | 0 (0.0%) | 0 (0.0%) |
| Mobile Home / Other | 56 (38.6%) | 89 (61.4%) |
| Total | 115 (56.4%) | 89 (43.6%) |
Housing Structures by Number of Rooms in So Hi
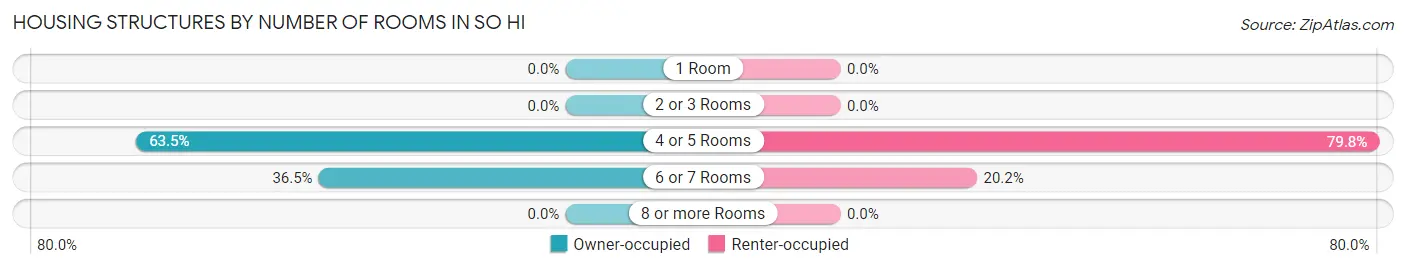
| Number of Rooms | Owner-occupied | Renter-occupied |
| 1 Room | 0 (0.0%) | 0 (0.0%) |
| 2 or 3 Rooms | 0 (0.0%) | 0 (0.0%) |
| 4 or 5 Rooms | 73 (63.5%) | 71 (79.8%) |
| 6 or 7 Rooms | 42 (36.5%) | 18 (20.2%) |
| 8 or more Rooms | 0 (0.0%) | 0 (0.0%) |
| Total | 115 (100.0%) | 89 (100.0%) |
Housing Structure by Heating Type in So Hi
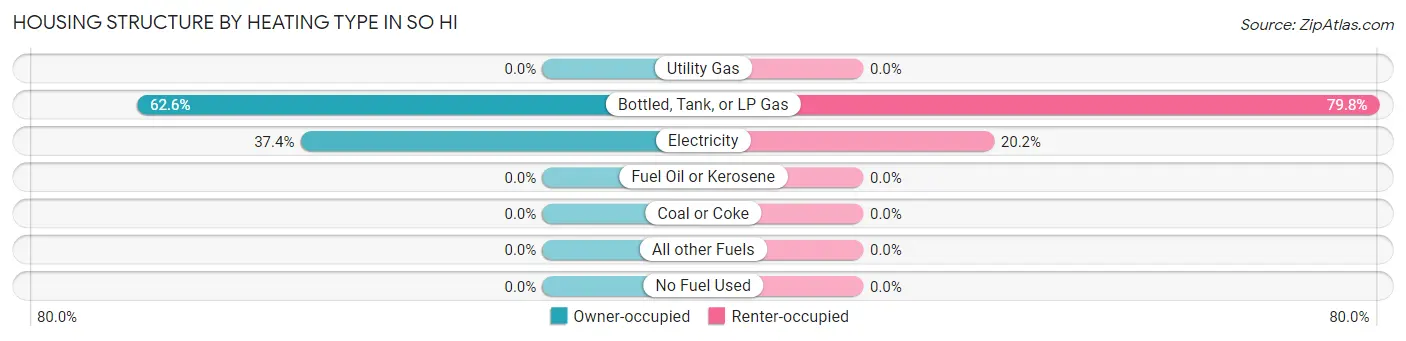
| Heating Type | Owner-occupied | Renter-occupied |
| Utility Gas | 0 (0.0%) | 0 (0.0%) |
| Bottled, Tank, or LP Gas | 72 (62.6%) | 71 (79.8%) |
| Electricity | 43 (37.4%) | 18 (20.2%) |
| Fuel Oil or Kerosene | 0 (0.0%) | 0 (0.0%) |
| Coal or Coke | 0 (0.0%) | 0 (0.0%) |
| All other Fuels | 0 (0.0%) | 0 (0.0%) |
| No Fuel Used | 0 (0.0%) | 0 (0.0%) |
| Total | 115 (100.0%) | 89 (100.0%) |
Household Vehicle Usage in So Hi
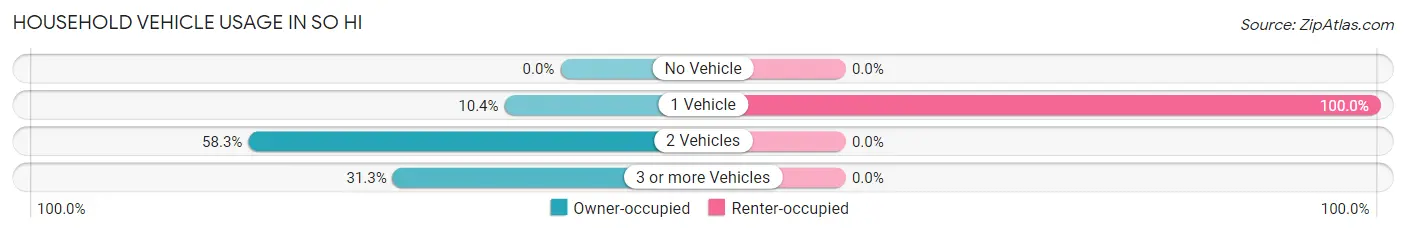
| Vehicles per Household | Owner-occupied | Renter-occupied |
| No Vehicle | 0 (0.0%) | 0 (0.0%) |
| 1 Vehicle | 12 (10.4%) | 89 (100.0%) |
| 2 Vehicles | 67 (58.3%) | 0 (0.0%) |
| 3 or more Vehicles | 36 (31.3%) | 0 (0.0%) |
| Total | 115 (100.0%) | 89 (100.0%) |
Real Estate & Mortgages in So Hi
Real Estate and Mortgage Overview in So Hi
| Characteristic | Without Mortgage | With Mortgage |
| Housing Units | 80 | 35 |
| Median Property Value | $123,800 | $0 |
| Median Household Income | $51,635 | $5 |
| Monthly Housing Costs | $235 | $0 |
| Real Estate Taxes | $1,024 | $0 |
Property Value by Mortgage Status in So Hi
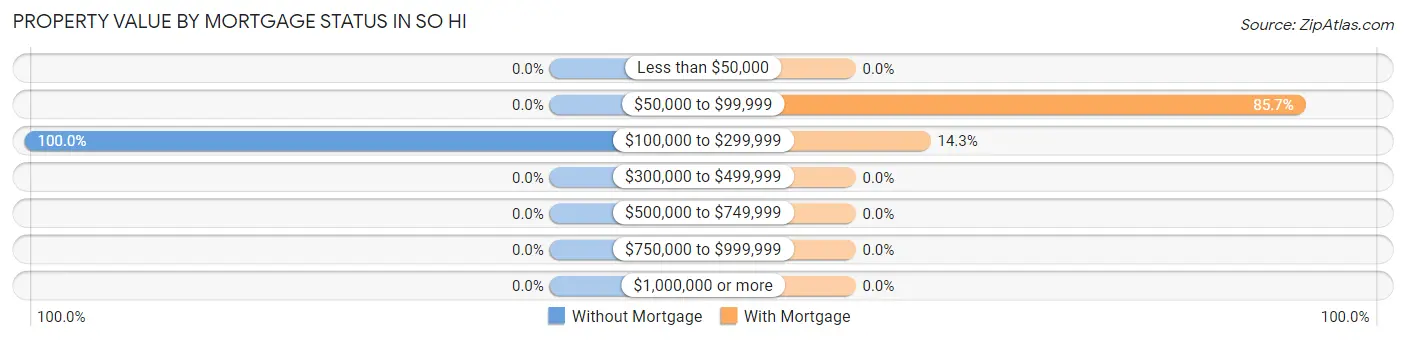
| Property Value | Without Mortgage | With Mortgage |
| Less than $50,000 | 0 (0.0%) | 0 (0.0%) |
| $50,000 to $99,999 | 0 (0.0%) | 30 (85.7%) |
| $100,000 to $299,999 | 80 (100.0%) | 5 (14.3%) |
| $300,000 to $499,999 | 0 (0.0%) | 0 (0.0%) |
| $500,000 to $749,999 | 0 (0.0%) | 0 (0.0%) |
| $750,000 to $999,999 | 0 (0.0%) | 0 (0.0%) |
| $1,000,000 or more | 0 (0.0%) | 0 (0.0%) |
| Total | 80 (100.0%) | 35 (100.0%) |
Household Income by Mortgage Status in So Hi
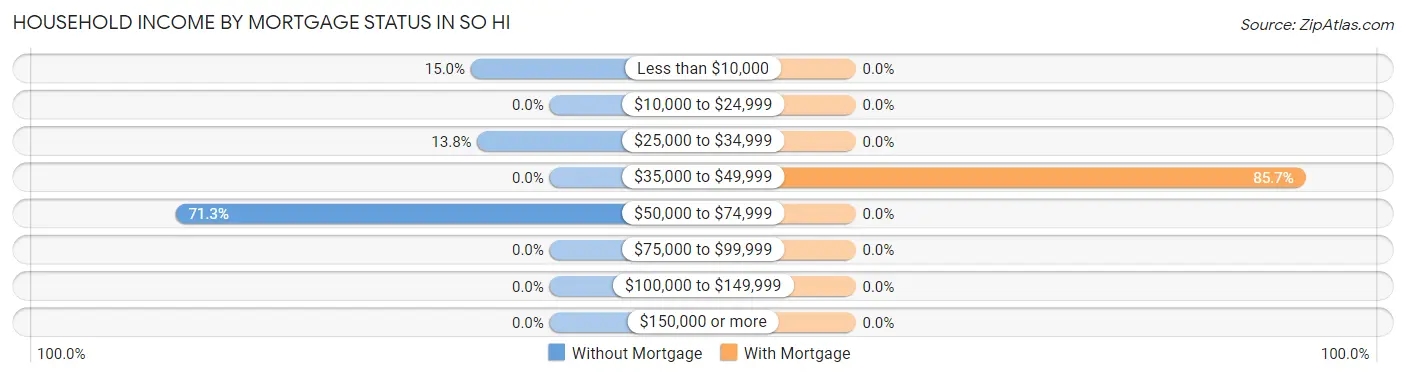
| Household Income | Without Mortgage | With Mortgage |
| Less than $10,000 | 12 (15.0%) | 0 (0.0%) |
| $10,000 to $24,999 | 0 (0.0%) | 0 (0.0%) |
| $25,000 to $34,999 | 11 (13.8%) | 0 (0.0%) |
| $35,000 to $49,999 | 0 (0.0%) | 30 (85.7%) |
| $50,000 to $74,999 | 57 (71.3%) | 0 (0.0%) |
| $75,000 to $99,999 | 0 (0.0%) | 0 (0.0%) |
| $100,000 to $149,999 | 0 (0.0%) | 0 (0.0%) |
| $150,000 or more | 0 (0.0%) | 0 (0.0%) |
| Total | 80 (100.0%) | 35 (100.0%) |
Property Value to Household Income Ratio in So Hi
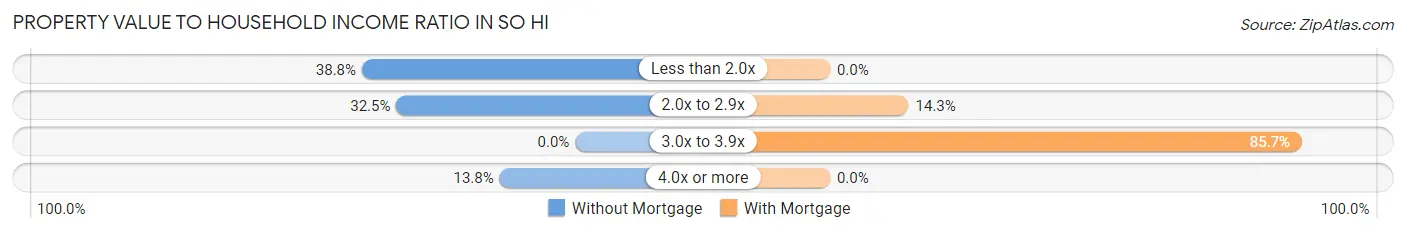
| Value-to-Income Ratio | Without Mortgage | With Mortgage |
| Less than 2.0x | 31 (38.8%) | 0 (0.0%) |
| 2.0x to 2.9x | 26 (32.5%) | 5 (14.3%) |
| 3.0x to 3.9x | 0 (0.0%) | 30 (85.7%) |
| 4.0x or more | 11 (13.8%) | 0 (0.0%) |
| Total | 80 (100.0%) | 35 (100.0%) |
Real Estate Taxes by Mortgage Status in So Hi
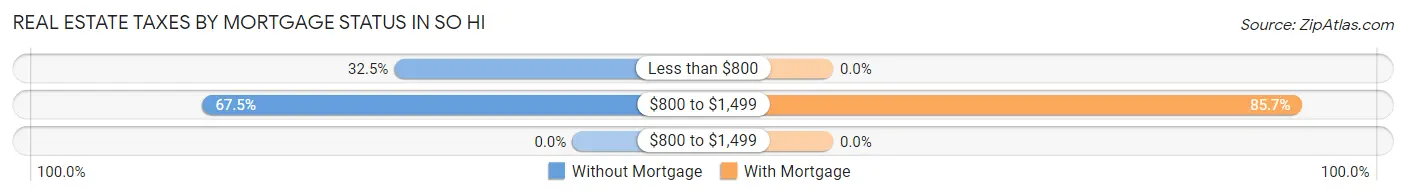
| Property Taxes | Without Mortgage | With Mortgage |
| Less than $800 | 26 (32.5%) | 0 (0.0%) |
| $800 to $1,499 | 54 (67.5%) | 30 (85.7%) |
| $800 to $1,499 | 0 (0.0%) | 0 (0.0%) |
| Total | 80 (100.0%) | 35 (100.0%) |
Health & Disability in So Hi
Health Insurance Coverage by Age in So Hi
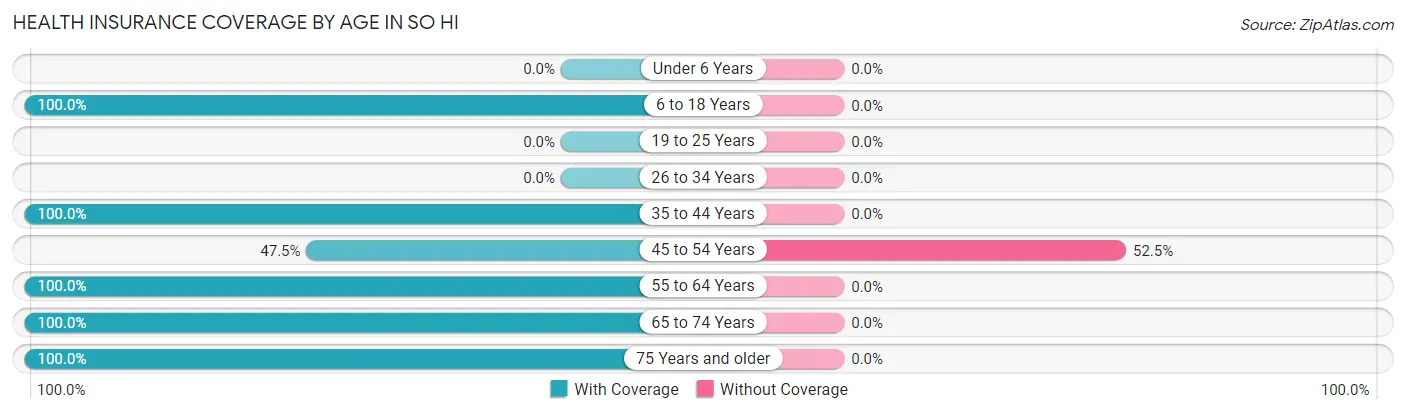
| Age Bracket | With Coverage | Without Coverage |
| Under 6 Years | 0 (0.0%) | 0 (0.0%) |
| 6 to 18 Years | 29 (100.0%) | 0 (0.0%) |
| 19 to 25 Years | 0 (0.0%) | 0 (0.0%) |
| 26 to 34 Years | 0 (0.0%) | 0 (0.0%) |
| 35 to 44 Years | 100 (100.0%) | 0 (0.0%) |
| 45 to 54 Years | 56 (47.5%) | 62 (52.5%) |
| 55 to 64 Years | 99 (100.0%) | 0 (0.0%) |
| 65 to 74 Years | 26 (100.0%) | 0 (0.0%) |
| 75 Years and older | 111 (100.0%) | 0 (0.0%) |
| Total | 421 (87.2%) | 62 (12.8%) |
Health Insurance Coverage by Citizenship Status in So Hi
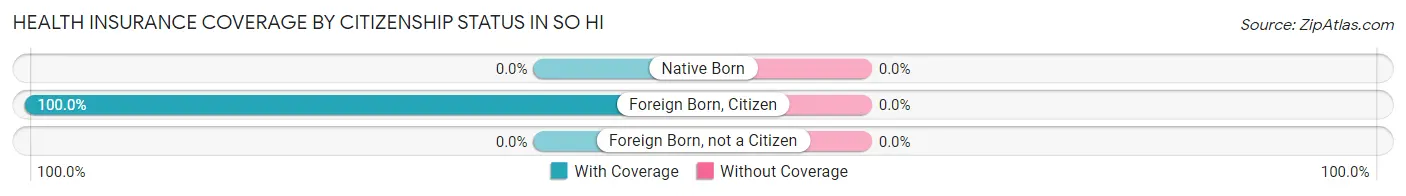
| Citizenship Status | With Coverage | Without Coverage |
| Native Born | 0 (0.0%) | 0 (0.0%) |
| Foreign Born, Citizen | 29 (100.0%) | 0 (0.0%) |
| Foreign Born, not a Citizen | 0 (0.0%) | 0 (0.0%) |
Health Insurance Coverage by Household Income in So Hi
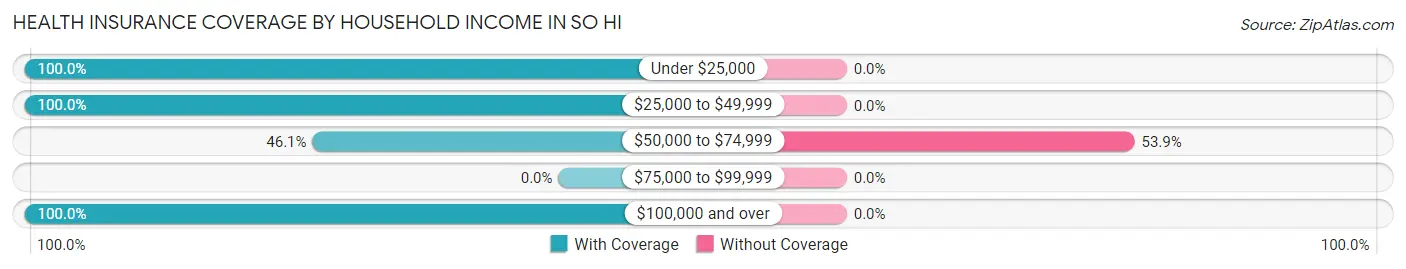
| Household Income | With Coverage | Without Coverage |
| Under $25,000 | 62 (100.0%) | 0 (0.0%) |
| $25,000 to $49,999 | 224 (100.0%) | 0 (0.0%) |
| $50,000 to $74,999 | 53 (46.1%) | 62 (53.9%) |
| $75,000 to $99,999 | 0 (0.0%) | 0 (0.0%) |
| $100,000 and over | 82 (100.0%) | 0 (0.0%) |
Public vs Private Health Insurance Coverage by Age in So Hi
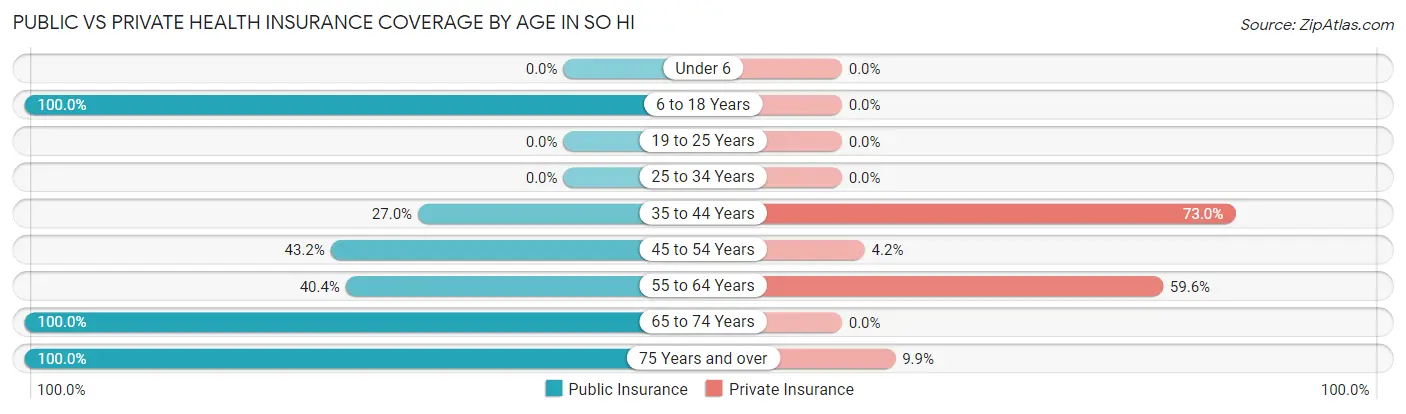
| Age Bracket | Public Insurance | Private Insurance |
| Under 6 | 0 (0.0%) | 0 (0.0%) |
| 6 to 18 Years | 29 (100.0%) | 0 (0.0%) |
| 19 to 25 Years | 0 (0.0%) | 0 (0.0%) |
| 25 to 34 Years | 0 (0.0%) | 0 (0.0%) |
| 35 to 44 Years | 27 (27.0%) | 73 (73.0%) |
| 45 to 54 Years | 51 (43.2%) | 5 (4.2%) |
| 55 to 64 Years | 40 (40.4%) | 59 (59.6%) |
| 65 to 74 Years | 26 (100.0%) | 0 (0.0%) |
| 75 Years and over | 111 (100.0%) | 11 (9.9%) |
| Total | 284 (58.8%) | 148 (30.6%) |
Disability Status by Sex by Age in So Hi
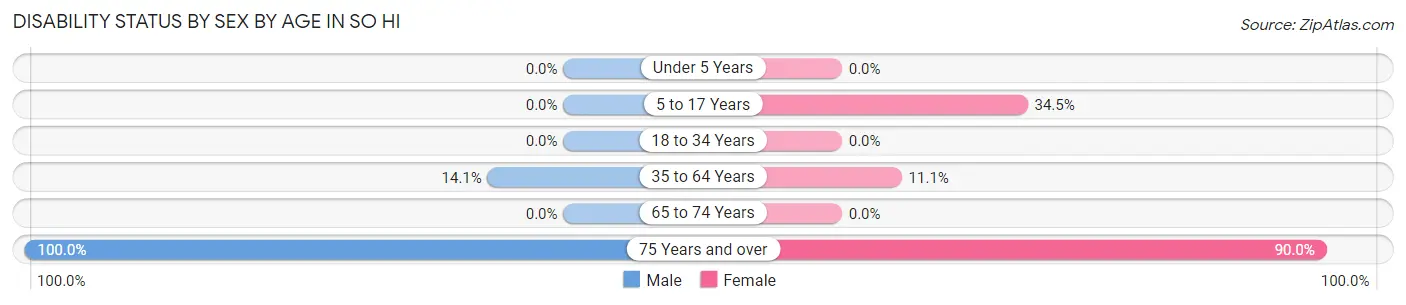
| Age Bracket | Male | Female |
| Under 5 Years | 0 (0.0%) | 0 (0.0%) |
| 5 to 17 Years | 0 (0.0%) | 10 (34.5%) |
| 18 to 34 Years | 0 (0.0%) | 0 (0.0%) |
| 35 to 64 Years | 18 (14.1%) | 21 (11.1%) |
| 65 to 74 Years | 0 (0.0%) | 0 (0.0%) |
| 75 Years and over | 11 (100.0%) | 90 (90.0%) |
Disability Class by Sex by Age in So Hi
Disability Class: Hearing Difficulty
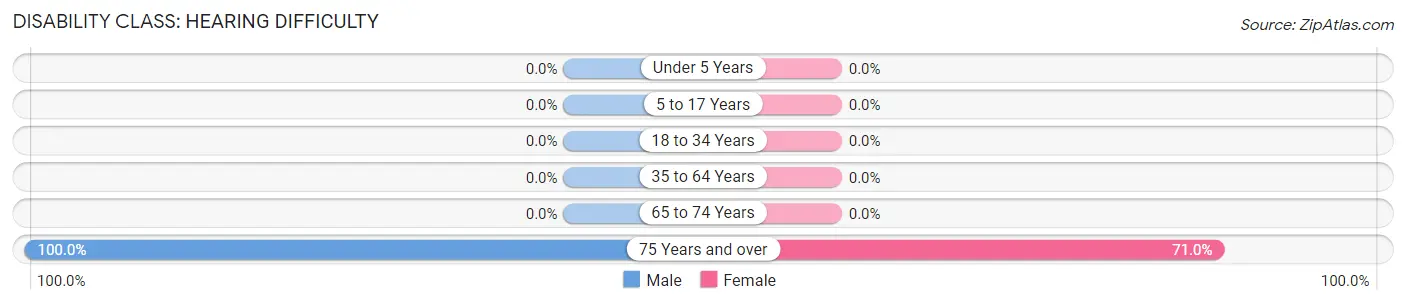
| Age Bracket | Male | Female |
| Under 5 Years | 0 (0.0%) | 0 (0.0%) |
| 5 to 17 Years | 0 (0.0%) | 0 (0.0%) |
| 18 to 34 Years | 0 (0.0%) | 0 (0.0%) |
| 35 to 64 Years | 0 (0.0%) | 0 (0.0%) |
| 65 to 74 Years | 0 (0.0%) | 0 (0.0%) |
| 75 Years and over | 11 (100.0%) | 71 (71.0%) |
Disability Class: Vision Difficulty
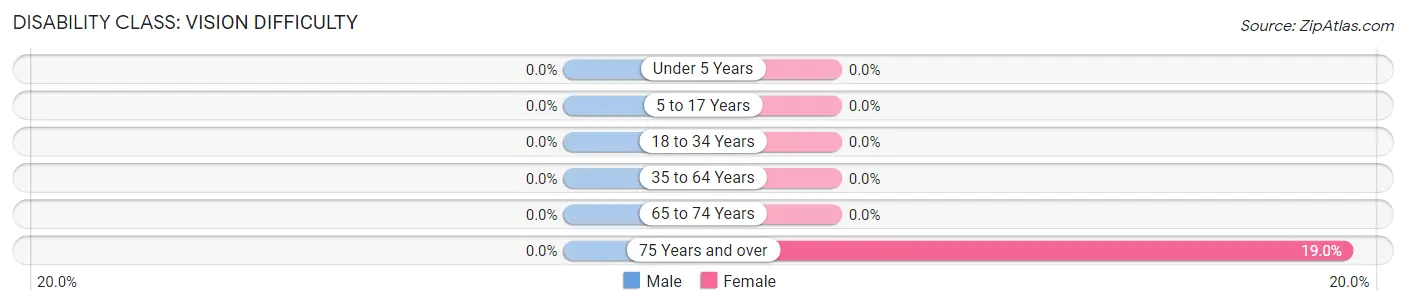
| Age Bracket | Male | Female |
| Under 5 Years | 0 (0.0%) | 0 (0.0%) |
| 5 to 17 Years | 0 (0.0%) | 0 (0.0%) |
| 18 to 34 Years | 0 (0.0%) | 0 (0.0%) |
| 35 to 64 Years | 0 (0.0%) | 0 (0.0%) |
| 65 to 74 Years | 0 (0.0%) | 0 (0.0%) |
| 75 Years and over | 0 (0.0%) | 19 (19.0%) |
Disability Class: Cognitive Difficulty
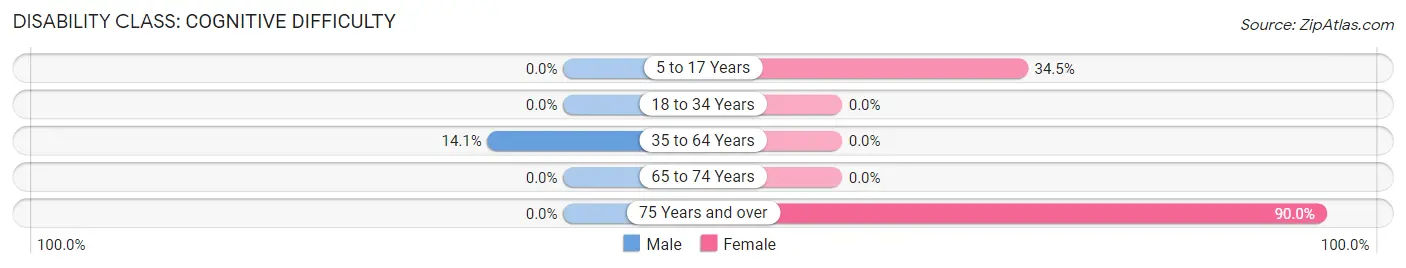
| Age Bracket | Male | Female |
| 5 to 17 Years | 0 (0.0%) | 10 (34.5%) |
| 18 to 34 Years | 0 (0.0%) | 0 (0.0%) |
| 35 to 64 Years | 18 (14.1%) | 0 (0.0%) |
| 65 to 74 Years | 0 (0.0%) | 0 (0.0%) |
| 75 Years and over | 0 (0.0%) | 90 (90.0%) |
Disability Class: Ambulatory Difficulty
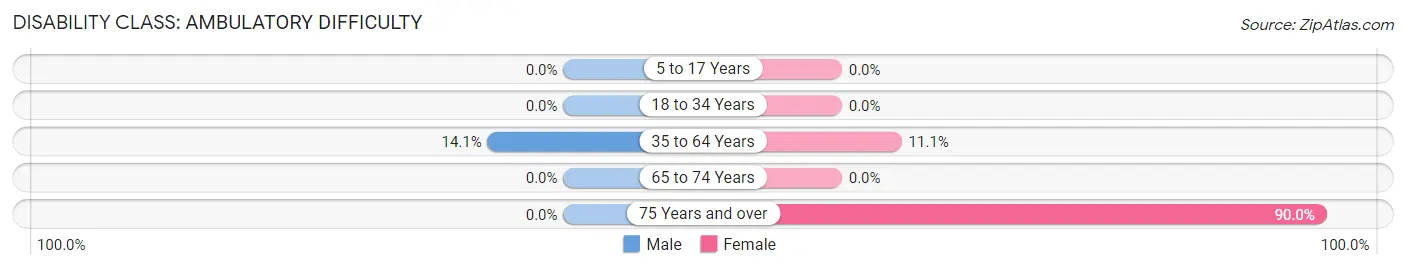
| Age Bracket | Male | Female |
| 5 to 17 Years | 0 (0.0%) | 0 (0.0%) |
| 18 to 34 Years | 0 (0.0%) | 0 (0.0%) |
| 35 to 64 Years | 18 (14.1%) | 21 (11.1%) |
| 65 to 74 Years | 0 (0.0%) | 0 (0.0%) |
| 75 Years and over | 0 (0.0%) | 90 (90.0%) |
Disability Class: Self-Care Difficulty
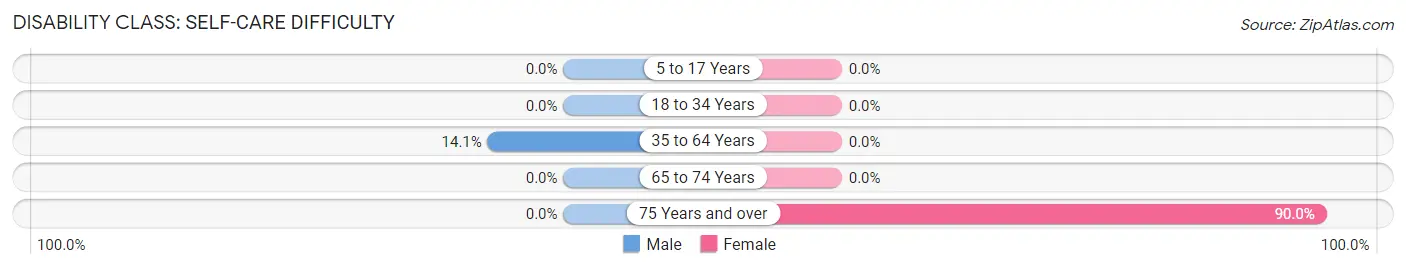
| Age Bracket | Male | Female |
| 5 to 17 Years | 0 (0.0%) | 0 (0.0%) |
| 18 to 34 Years | 0 (0.0%) | 0 (0.0%) |
| 35 to 64 Years | 18 (14.1%) | 0 (0.0%) |
| 65 to 74 Years | 0 (0.0%) | 0 (0.0%) |
| 75 Years and over | 0 (0.0%) | 90 (90.0%) |
Technology Access in So Hi
Computing Device Access in So Hi
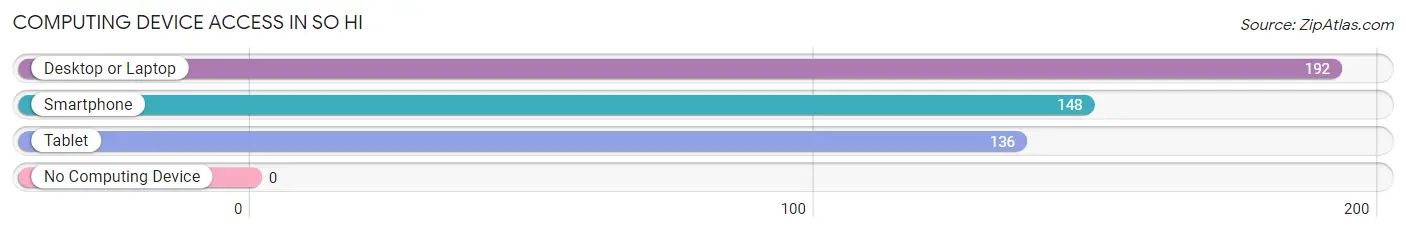
| Device Type | # Households | % Households |
| Desktop or Laptop | 192 | 94.1% |
| Smartphone | 148 | 72.6% |
| Tablet | 136 | 66.7% |
| No Computing Device | 0 | 0.0% |
| Total | 204 | 100.0% |
Internet Access in So Hi
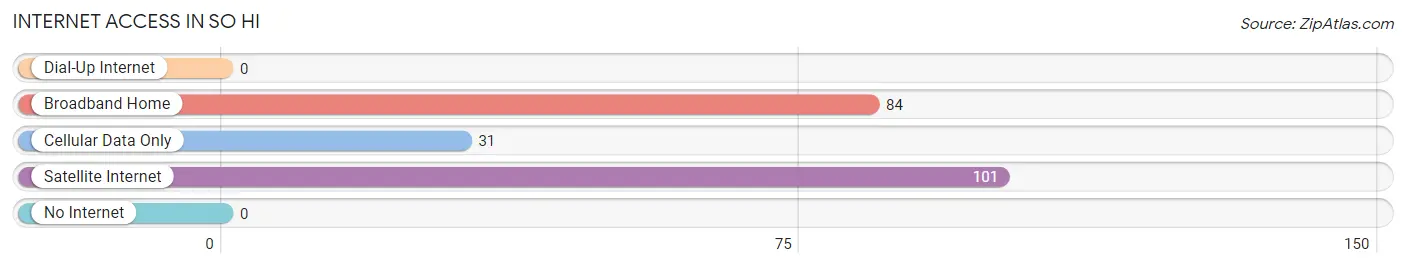
| Internet Type | # Households | % Households |
| Dial-Up Internet | 0 | 0.0% |
| Broadband Home | 84 | 41.2% |
| Cellular Data Only | 31 | 15.2% |
| Satellite Internet | 101 | 49.5% |
| No Internet | 0 | 0.0% |
| Total | 204 | 100.0% |
So Hi Summary
Arizona is a state located in the southwestern region of the United States. It is the sixth largest state in the country and is bordered by California, Nevada, Utah, New Mexico, and Mexico. Arizona is known for its desert climate, its diverse geography, and its rich history.
Geography
Arizona is a land of diverse geography, ranging from the Sonoran Desert in the south to the high plateaus of the Colorado Plateau in the north. The state is divided into two distinct regions: the Colorado Plateau and the Basin and Range Province. The Colorado Plateau is characterized by its high elevation, deep canyons, and numerous plateaus. The Basin and Range Province is characterized by its low elevation, flat terrain, and numerous mountain ranges.
The state is home to several national parks, including Grand Canyon National Park, Saguaro National Park, and Petrified Forest National Park. Arizona is also home to the world’s largest stand of Ponderosa pine trees, located in the Coconino National Forest.
History
Arizona has a long and rich history, beginning with the first inhabitants of the region, the Hohokam people. The Hohokam were a Native American tribe that lived in the area from around 300 BCE to 1450 CE. They were known for their sophisticated irrigation systems and their extensive trade networks.
The first Europeans to explore the area were Spanish explorers in the 16th century. The area was later claimed by Mexico in 1821, and became part of the United States in 1848 as part of the Mexican Cession. Arizona became a U.S. territory in 1863, and was admitted to the Union as the 48th state in 1912.
Economy
Arizona’s economy is largely based on tourism, agriculture, and technology. The state is home to several major corporations, including Intel, Honeywell, and US Airways. Tourism is a major industry in Arizona, with visitors drawn to the state’s natural beauty and its numerous attractions, such as the Grand Canyon, Monument Valley, and the Petrified Forest.
Agriculture is also an important part of the state’s economy, with cotton, hay, and dairy products being the main crops. Arizona is also home to several copper mines, which are a major source of revenue for the state.
Demographics
As of 2020, the population of Arizona was estimated to be 7.3 million. The state is home to a diverse population, with the largest ethnic groups being White (63.7%), Hispanic or Latino (30.2%), and Native American (4.9%). The state’s largest cities are Phoenix, Tucson, Mesa, and Glendale.
Arizona is also home to a large number of immigrants, with the largest groups being from Mexico (44.3%), India (3.2%), and China (2.7%). The state’s population is also growing rapidly, with the population increasing by 1.7% between 2019 and 2020.
Conclusion
Arizona is a state with a rich history, diverse geography, and a vibrant economy. It is home to a diverse population, with the largest ethnic groups being White, Hispanic or Latino, and Native American. The state’s economy is largely based on tourism, agriculture, and technology, and it is home to several major corporations. Arizona is also home to a large number of immigrants, with the largest groups being from Mexico, India, and China.
Common Questions
What is the Total Population of So Hi?
Total Population of So Hi is 483.
What is the Total Male Population of So Hi?
Total Male Population of So Hi is 165.
What is the Total Female Population of So Hi?
Total Female Population of So Hi is 318.
What is the Ratio of Males per 100 Females in So Hi?
There are 51.89 Males per 100 Females in So Hi.
What is the Ratio of Females per 100 Males in So Hi?
There are 192.73 Females per 100 Males in So Hi.
What is the Median Population Age in So Hi?
Median Population Age in So Hi is 54.9 Years.
What is the Average Family Size in So Hi
Average Family Size in So Hi is 2.3 People.
What is the Average Household Size in So Hi
Average Household Size in So Hi is 2.4 People.
What is Per Capita Income in So Hi?
Per Capita income in So Hi is $20,572.
What is the Median Family Income in So Hi?
Median Family Income in So Hi is $48,592.
What is the Median Household income in So Hi?
Median Household Income in So Hi is $48,592.
What is Inequality or Gini Index in So Hi?
Inequality or Gini Index in So Hi is 0.28.
How Large is the Labor Force in So Hi?
There are 205 People in the Labor Forcein in So Hi.
What is the Percentage of People in the Labor Force in So Hi?
42.4% of People are in the Labor Force in So Hi.
What is the Unemployment Rate in So Hi?
Unemployment Rate in So Hi is 9.3%.