Parker Strip, AZ
Parker Strip Map
Parker Strip Overview
814
TOTAL POPULATION
360
MALE POPULATION
454
FEMALE POPULATION
79.30
MALES / 100 FEMALES
126.11
FEMALES / 100 MALES
72.1
MEDIAN AGE
2.1
AVG FAMILY SIZE
1.7
AVG HOUSEHOLD SIZE
$52,814
PER CAPITA INCOME
$58,393
AVG FAMILY INCOME
$48,333
AVG HOUSEHOLD INCOME
$6,823
FAMILY INCOME DEFICIT
0.58
INEQUALITY / GINI INDEX
213
LABOR FORCE [ PEOPLE ]
28.2%
PERCENT IN LABOR FORCE
12.2%
UNEMPLOYMENT RATE
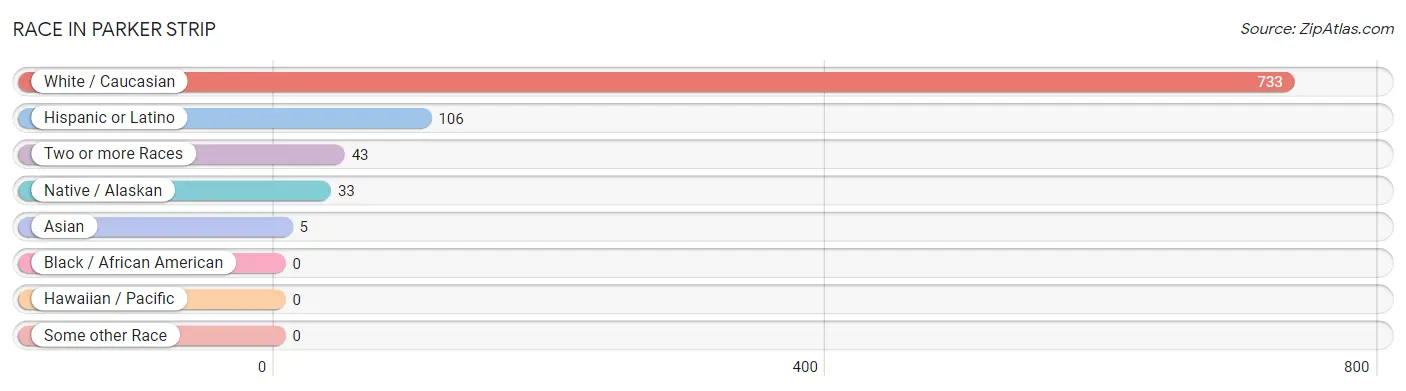
Race in Parker Strip
The most populous races in Parker Strip are White / Caucasian (733 | 90.0%), Hispanic or Latino (106 | 13.0%), and Two or more Races (43 | 5.3%).
| Race | # Population | % Population |
| Asian | 5 | 0.6% |
| Black / African American | 0 | 0.0% |
| Hawaiian / Pacific | 0 | 0.0% |
| Hispanic or Latino | 106 | 13.0% |
| Native / Alaskan | 33 | 4.1% |
| White / Caucasian | 733 | 90.0% |
| Two or more Races | 43 | 5.3% |
| Some other Race | 0 | 0.0% |
| Total | 814 | 100.0% |
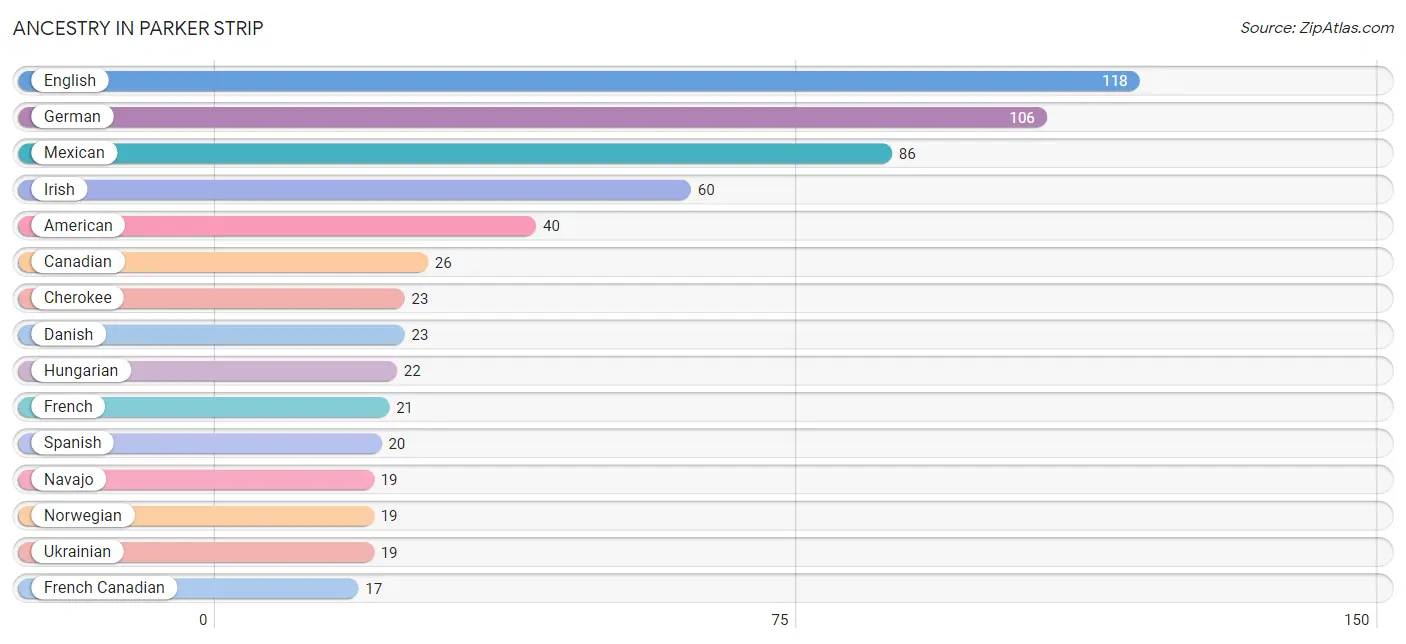
Ancestry in Parker Strip
The most populous ancestries reported in Parker Strip are English (118 | 14.5%), German (106 | 13.0%), Mexican (86 | 10.6%), Irish (60 | 7.4%), and American (40 | 4.9%), together accounting for 50.4% of all Parker Strip residents.
| Ancestry | # Population | % Population |
| American | 40 | 4.9% |
| Bhutanese | 5 | 0.6% |
| Canadian | 26 | 3.2% |
| Cherokee | 23 | 2.8% |
| Czech | 10 | 1.2% |
| Czechoslovakian | 2 | 0.3% |
| Danish | 23 | 2.8% |
| Dutch | 9 | 1.1% |
| English | 118 | 14.5% |
| European | 10 | 1.2% |
| French | 21 | 2.6% |
| French Canadian | 17 | 2.1% |
| German | 106 | 13.0% |
| Hungarian | 22 | 2.7% |
| Irish | 60 | 7.4% |
| Italian | 16 | 2.0% |
| Mexican | 86 | 10.6% |
| Navajo | 19 | 2.3% |
| Norwegian | 19 | 2.3% |
| Polish | 14 | 1.7% |
| Russian | 16 | 2.0% |
| Scandinavian | 4 | 0.5% |
| Scotch-Irish | 8 | 1.0% |
| Scottish | 7 | 0.9% |
| Spanish | 20 | 2.5% |
| Swedish | 12 | 1.5% |
| Swiss | 5 | 0.6% |
| Ukrainian | 19 | 2.3% |
| Welsh | 6 | 0.7% | View All 29 Rows |
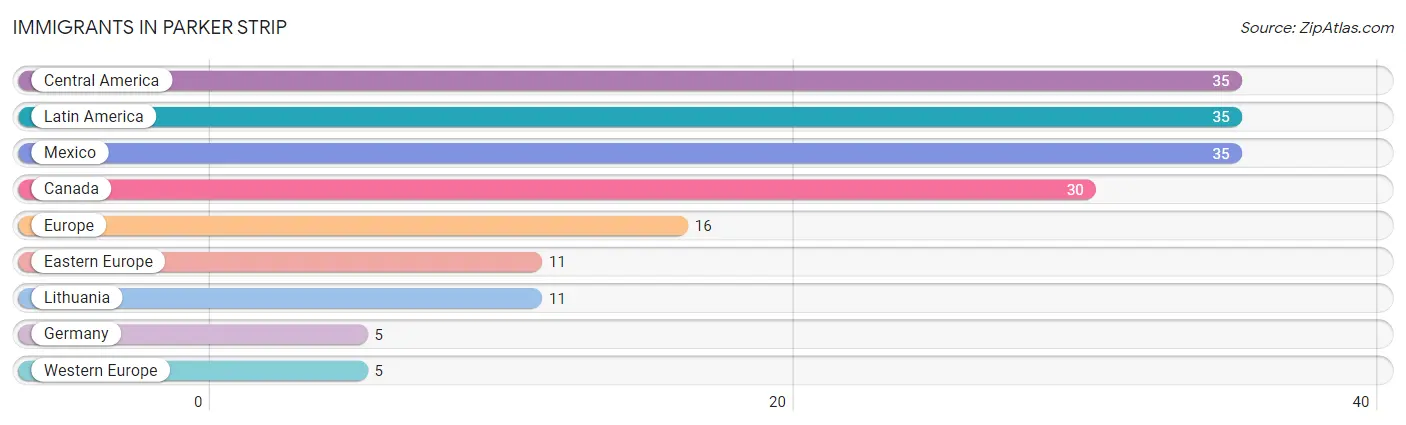
Immigrants in Parker Strip
The most numerous immigrant groups reported in Parker Strip came from Central America (35 | 4.3%), Latin America (35 | 4.3%), Mexico (35 | 4.3%), Canada (30 | 3.7%), and Europe (16 | 2.0%), together accounting for 18.6% of all Parker Strip residents.
| Immigration Origin | # Population | % Population |
| Canada | 30 | 3.7% |
| Central America | 35 | 4.3% |
| Eastern Europe | 11 | 1.3% |
| Europe | 16 | 2.0% |
| Germany | 5 | 0.6% |
| Latin America | 35 | 4.3% |
| Lithuania | 11 | 1.3% |
| Mexico | 35 | 4.3% |
| Western Europe | 5 | 0.6% | View All 9 Rows |
Sex and Age in Parker Strip
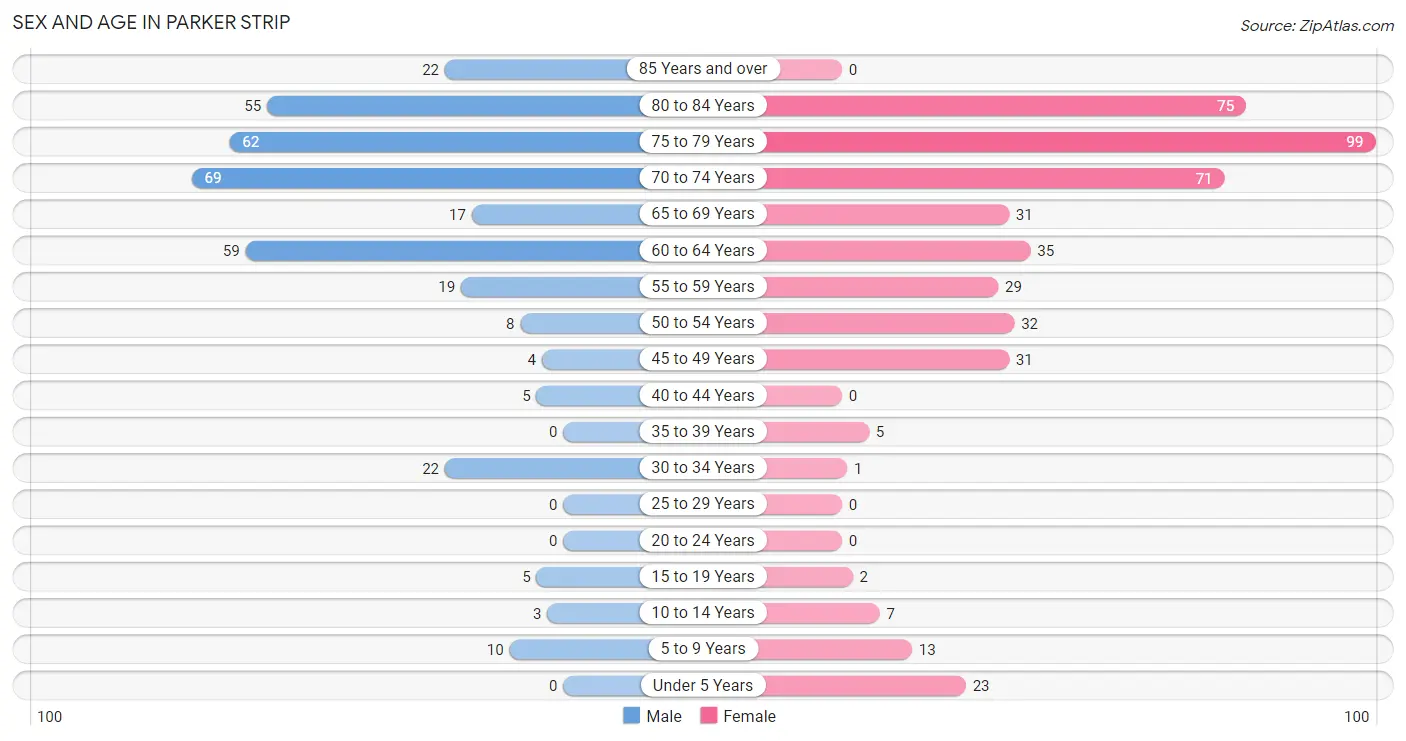
Sex and Age in Parker Strip
The most populous age groups in Parker Strip are 70 to 74 Years (69 | 19.2%) for men and 75 to 79 Years (99 | 21.8%) for women.
| Age Bracket | Male | Female |
| Under 5 Years | 0 (0.0%) | 23 (5.1%) |
| 5 to 9 Years | 10 (2.8%) | 13 (2.9%) |
| 10 to 14 Years | 3 (0.8%) | 7 (1.5%) |
| 15 to 19 Years | 5 (1.4%) | 2 (0.4%) |
| 20 to 24 Years | 0 (0.0%) | 0 (0.0%) |
| 25 to 29 Years | 0 (0.0%) | 0 (0.0%) |
| 30 to 34 Years | 22 (6.1%) | 1 (0.2%) |
| 35 to 39 Years | 0 (0.0%) | 5 (1.1%) |
| 40 to 44 Years | 5 (1.4%) | 0 (0.0%) |
| 45 to 49 Years | 4 (1.1%) | 31 (6.8%) |
| 50 to 54 Years | 8 (2.2%) | 32 (7.0%) |
| 55 to 59 Years | 19 (5.3%) | 29 (6.4%) |
| 60 to 64 Years | 59 (16.4%) | 35 (7.7%) |
| 65 to 69 Years | 17 (4.7%) | 31 (6.8%) |
| 70 to 74 Years | 69 (19.2%) | 71 (15.6%) |
| 75 to 79 Years | 62 (17.2%) | 99 (21.8%) |
| 80 to 84 Years | 55 (15.3%) | 75 (16.5%) |
| 85 Years and over | 22 (6.1%) | 0 (0.0%) |
| Total | 360 (100.0%) | 454 (100.0%) |
Families and Households in Parker Strip
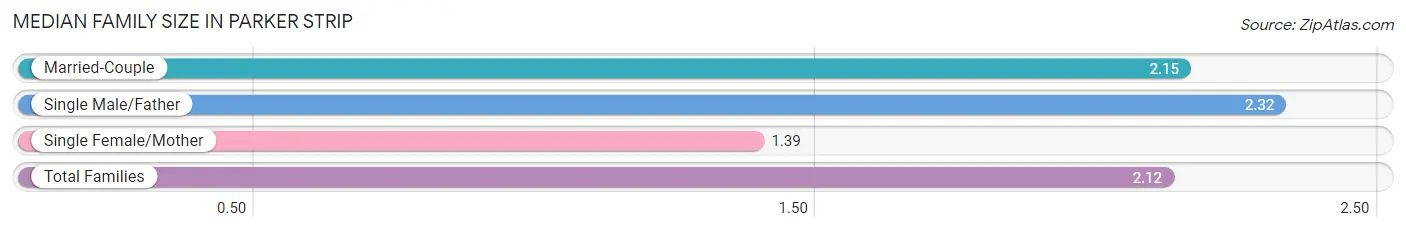
Median Family Size in Parker Strip
The median family size in Parker Strip is 2.12 persons per family, with single male/father families (37 | 12.5%) accounting for the largest median family size of 2.32 persons per family. On the other hand, single female/mother families (23 | 7.8%) represent the smallest median family size with 1.39 persons per family.
| Family Type | # Families | Family Size |
| Married-Couple | 235 (79.7%) | 2.15 |
| Single Male/Father | 37 (12.5%) | 2.32 |
| Single Female/Mother | 23 (7.8%) | 1.39 |
| Total Families | 295 (100.0%) | 2.12 |
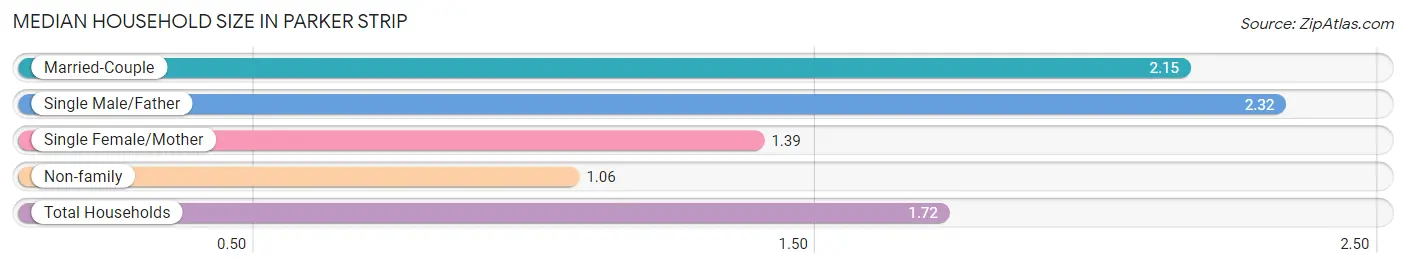
Median Household Size in Parker Strip
The median household size in Parker Strip is 1.72 persons per household, with single male/father households (37 | 7.8%) accounting for the largest median household size of 2.32 persons per household. non-family households (179 | 37.8%) represent the smallest median household size with 1.06 persons per household.
| Household Type | # Households | Household Size |
| Married-Couple | 235 (49.6%) | 2.15 |
| Single Male/Father | 37 (7.8%) | 2.32 |
| Single Female/Mother | 23 (4.9%) | 1.39 |
| Non-family | 179 (37.8%) | 1.06 |
| Total Households | 474 (100.0%) | 1.72 |
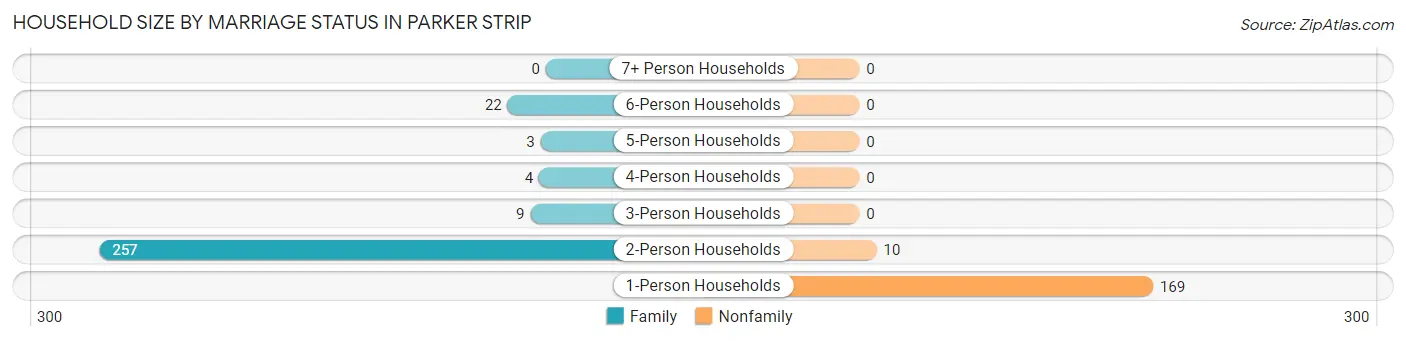
Household Size by Marriage Status in Parker Strip
Out of a total of 474 households in Parker Strip, 295 (62.2%) are family households, while 179 (37.8%) are nonfamily households. The most numerous type of family households are 2-person households, comprising 257, and the most common type of nonfamily households are 1-person households, comprising 169.
| Household Size | Family Households | Nonfamily Households |
| 1-Person Households | - | 169 (35.6%) |
| 2-Person Households | 257 (54.2%) | 10 (2.1%) |
| 3-Person Households | 9 (1.9%) | 0 (0.0%) |
| 4-Person Households | 4 (0.8%) | 0 (0.0%) |
| 5-Person Households | 3 (0.6%) | 0 (0.0%) |
| 6-Person Households | 22 (4.6%) | 0 (0.0%) |
| 7+ Person Households | 0 (0.0%) | 0 (0.0%) |
| Total | 295 (62.2%) | 179 (37.8%) |
Female Fertility in Parker Strip
Fertility by Age in Parker Strip
| Age Bracket | Women with Births | Births / 1,000 Women |
| 15 to 19 years | 0 (0.0%) | 0.0 |
| 20 to 34 years | 0 (0.0%) | 0.0 |
| 35 to 50 years | 0 (0.0%) | 0.0 |
| Total | 0 (0.0%) | 0.0 |
Fertility by Age by Marriage Status in Parker Strip
| Age Bracket | Married | Unmarried |
| 15 to 19 years | 0 (0.0%) | 0 (0.0%) |
| 20 to 34 years | 0 (0.0%) | 0 (0.0%) |
| 35 to 50 years | 0 (0.0%) | 0 (0.0%) |
| Total | 0 (0.0%) | 0 (0.0%) |
Fertility by Education in Parker Strip
| Educational Attainment | Women with Births | Births / 1,000 Women |
| Less than High School | 0 (0.0%) | 0.0 |
| High School Diploma | 0 (0.0%) | 0.0 |
| College or Associate's Degree | 0 (0.0%) | 0.0 |
| Bachelor's Degree | 0 (0.0%) | 0.0 |
| Graduate Degree | 0 (0.0%) | 0.0 |
| Total | 0 (0.0%) | 0.0 |
Fertility by Education by Marriage Status in Parker Strip
| Educational Attainment | Married | Unmarried |
| Less than High School | 0 (0.0%) | 0 (0.0%) |
| High School Diploma | 0 (0.0%) | 0 (0.0%) |
| College or Associate's Degree | 0 (0.0%) | 0 (0.0%) |
| Bachelor's Degree | 0 (0.0%) | 0 (0.0%) |
| Graduate Degree | 0 (0.0%) | 0 (0.0%) |
| Total | 0 (0.0%) | 0 (0.0%) |
Income in Parker Strip
Income Overview in Parker Strip
Per Capita Income in Parker Strip is $52,814, while median incomes of families and households are $58,393 and $48,333 respectively.
| Characteristic | Number | Measure |
| Per Capita Income | 814 | $52,814 |
| Median Family Income | 295 | $58,393 |
| Mean Family Income | 295 | $88,549 |
| Median Household Income | 474 | $48,333 |
| Mean Household Income | 474 | $91,072 |
| Income Deficit | 295 | $6,823 |
| Wage / Income Gap (%) | 814 | 0.00% |
| Wage / Income Gap ($) | 814 | 100.00¢ per $1 |
| Gini / Inequality Index | 814 | 0.58 |
Earnings by Sex in Parker Strip
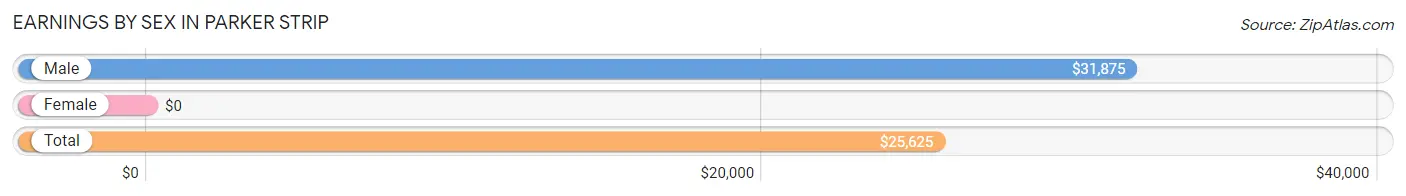
| Sex | Number | Average Earnings |
| Male | 161 (59.6%) | $31,875 |
| Female | 109 (40.4%) | $0 |
| Total | 270 (100.0%) | $25,625 |
Earnings by Sex by Income Bracket in Parker Strip
The most common earnings brackets in Parker Strip are $55,000 to $64,999 for men (32 | 19.9%) and $2,500 to $4,999 for women (36 | 33.0%).
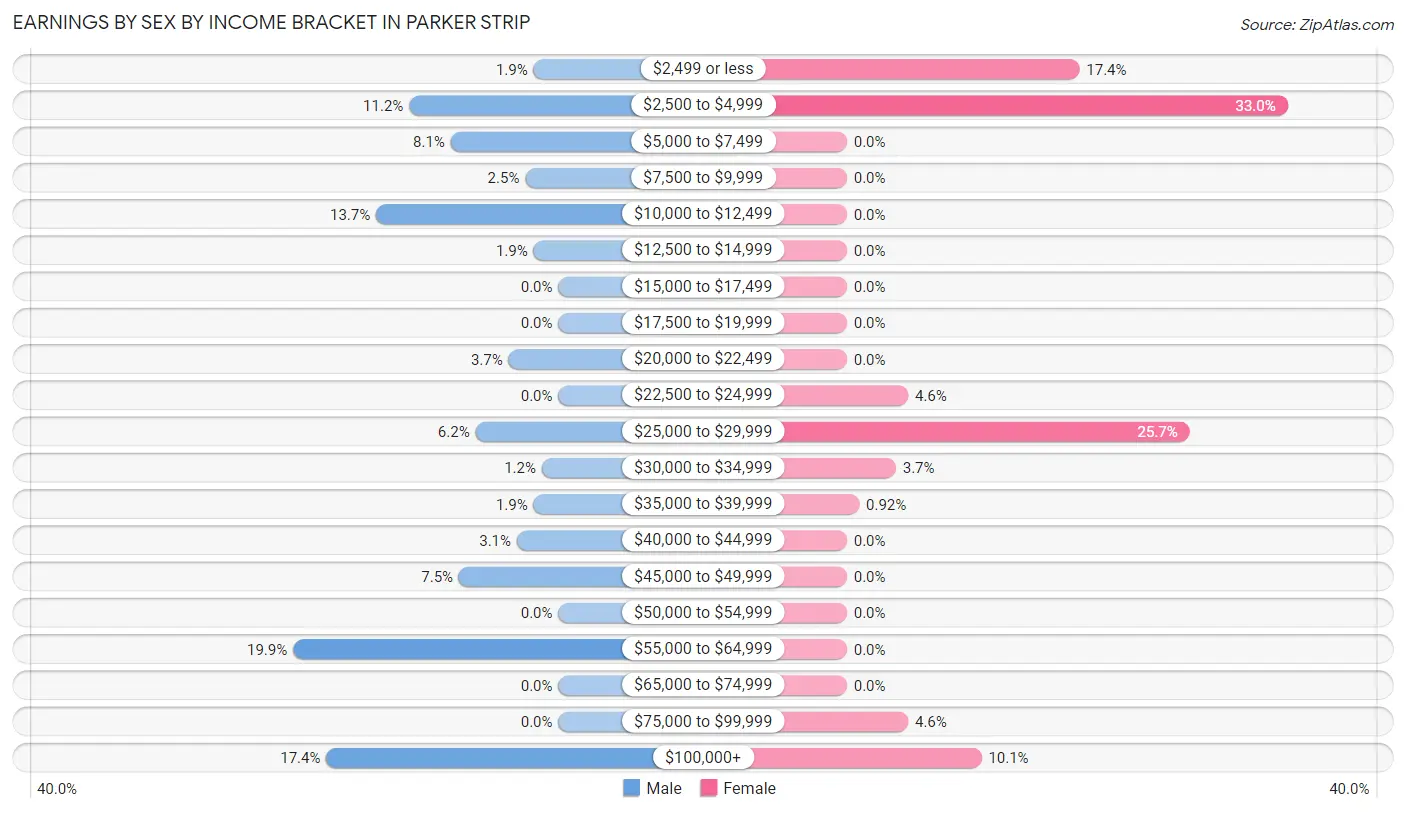
| Income | Male | Female |
| $2,499 or less | 3 (1.9%) | 19 (17.4%) |
| $2,500 to $4,999 | 18 (11.2%) | 36 (33.0%) |
| $5,000 to $7,499 | 13 (8.1%) | 0 (0.0%) |
| $7,500 to $9,999 | 4 (2.5%) | 0 (0.0%) |
| $10,000 to $12,499 | 22 (13.7%) | 0 (0.0%) |
| $12,500 to $14,999 | 3 (1.9%) | 0 (0.0%) |
| $15,000 to $17,499 | 0 (0.0%) | 0 (0.0%) |
| $17,500 to $19,999 | 0 (0.0%) | 0 (0.0%) |
| $20,000 to $22,499 | 6 (3.7%) | 0 (0.0%) |
| $22,500 to $24,999 | 0 (0.0%) | 5 (4.6%) |
| $25,000 to $29,999 | 10 (6.2%) | 28 (25.7%) |
| $30,000 to $34,999 | 2 (1.2%) | 4 (3.7%) |
| $35,000 to $39,999 | 3 (1.9%) | 1 (0.9%) |
| $40,000 to $44,999 | 5 (3.1%) | 0 (0.0%) |
| $45,000 to $49,999 | 12 (7.4%) | 0 (0.0%) |
| $50,000 to $54,999 | 0 (0.0%) | 0 (0.0%) |
| $55,000 to $64,999 | 32 (19.9%) | 0 (0.0%) |
| $65,000 to $74,999 | 0 (0.0%) | 0 (0.0%) |
| $75,000 to $99,999 | 0 (0.0%) | 5 (4.6%) |
| $100,000+ | 28 (17.4%) | 11 (10.1%) |
| Total | 161 (100.0%) | 109 (100.0%) |
Earnings by Sex by Educational Attainment in Parker Strip
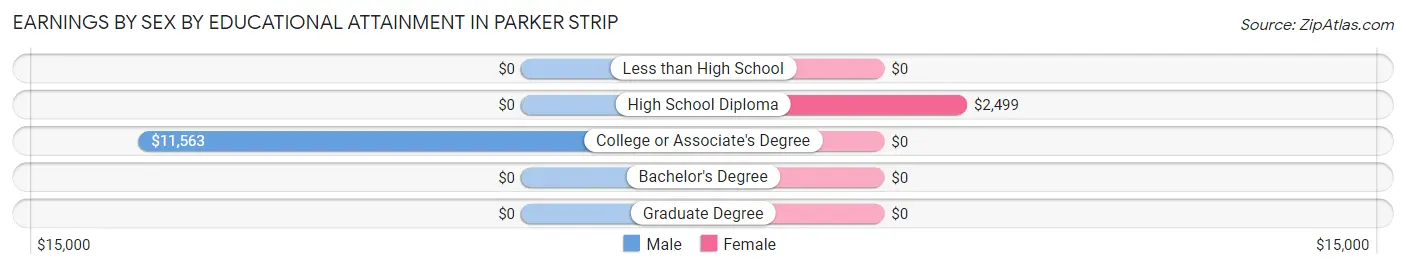
| Educational Attainment | Male Income | Female Income |
| Less than High School | - | - |
| High School Diploma | - | - |
| College or Associate's Degree | $11,563 | $0 |
| Bachelor's Degree | - | - |
| Graduate Degree | - | - |
| Total | $35,833 | $0 |
Family Income in Parker Strip
Family Income Brackets in Parker Strip
According to the Parker Strip family income data, there are 66 families falling into the $35,000 to $49,999 income range, which is the most common income bracket and makes up 22.4% of all families. Conversely, the $150,000 to $199,999 income bracket is the least frequent group with only 5 families (1.7%) belonging to this category.
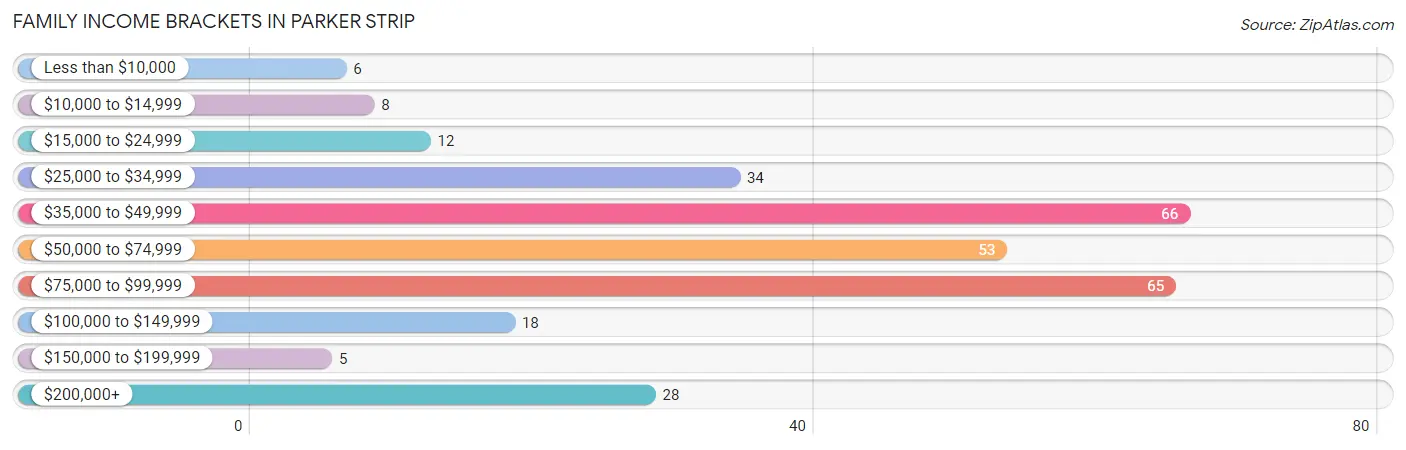
| Income Bracket | # Families | % Families |
| Less than $10,000 | 6 | 2.0% |
| $10,000 to $14,999 | 8 | 2.7% |
| $15,000 to $24,999 | 12 | 4.1% |
| $25,000 to $34,999 | 34 | 11.5% |
| $35,000 to $49,999 | 66 | 22.4% |
| $50,000 to $74,999 | 53 | 18.0% |
| $75,000 to $99,999 | 65 | 22.0% |
| $100,000 to $149,999 | 18 | 6.1% |
| $150,000 to $199,999 | 5 | 1.7% |
| $200,000+ | 28 | 9.5% |
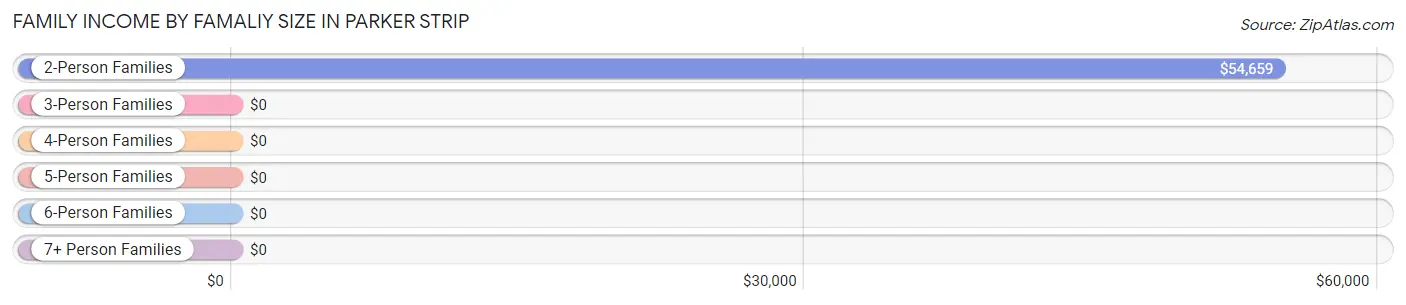
Family Income by Famaliy Size in Parker Strip
2-person families (257 | 87.1%) account for the highest median family income in Parker Strip with $54,659 per family, while 2-person families (257 | 87.1%) have the highest median income of $27,330 per family member.
| Income Bracket | # Families | Median Income |
| 2-Person Families | 257 (87.1%) | $54,659 |
| 3-Person Families | 9 (3.0%) | $0 |
| 4-Person Families | 4 (1.4%) | $0 |
| 5-Person Families | 3 (1.0%) | $0 |
| 6-Person Families | 22 (7.5%) | $0 |
| 7+ Person Families | 0 (0.0%) | $0 |
| Total | 295 (100.0%) | $58,393 |
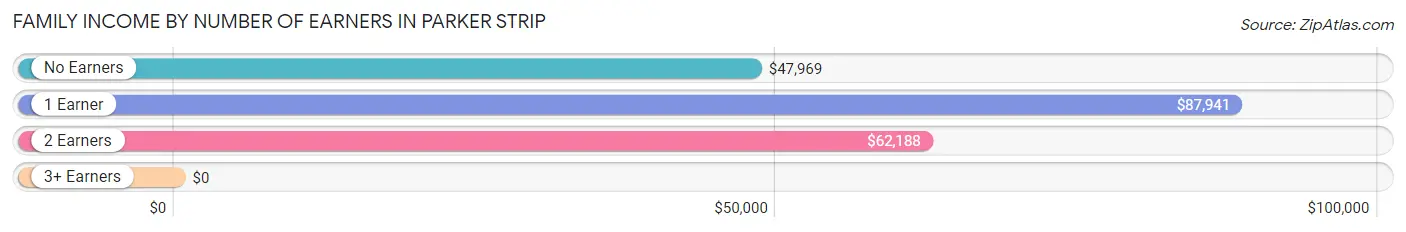
Family Income by Number of Earners in Parker Strip
| Number of Earners | # Families | Median Income |
| No Earners | 146 (49.5%) | $47,969 |
| 1 Earner | 72 (24.4%) | $87,941 |
| 2 Earners | 73 (24.7%) | $62,188 |
| 3+ Earners | 4 (1.4%) | $0 |
| Total | 295 (100.0%) | $58,393 |
Household Income in Parker Strip
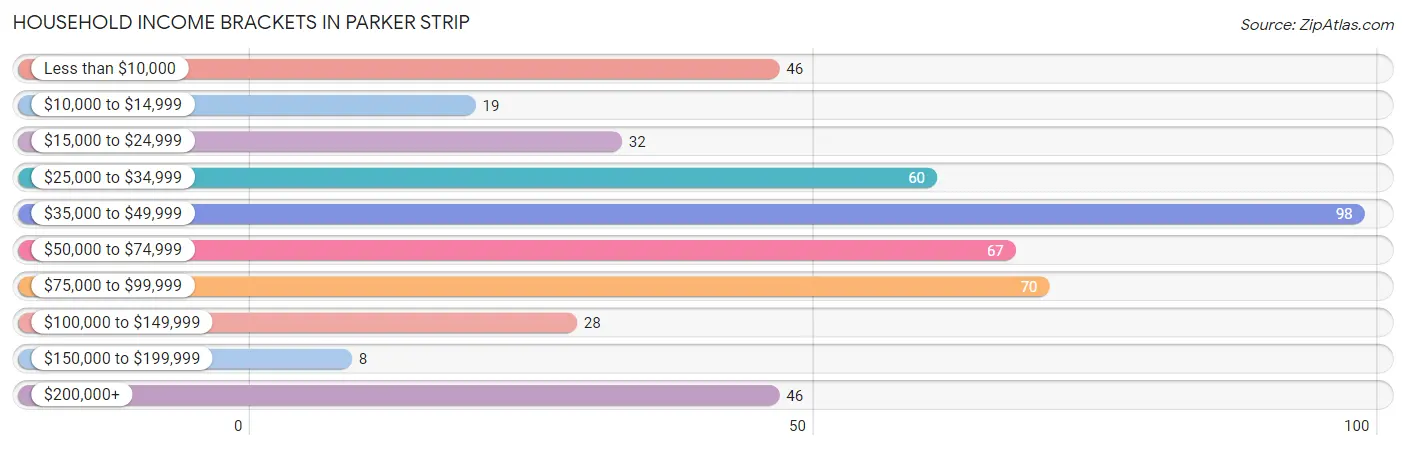
Household Income Brackets in Parker Strip
With 98 households falling in the category, the $35,000 to $49,999 income range is the most frequent in Parker Strip, accounting for 20.7% of all households. In contrast, only 8 households (1.7%) fall into the $150,000 to $199,999 income bracket, making it the least populous group.
| Income Bracket | # Households | % Households |
| Less than $10,000 | 46 | 9.7% |
| $10,000 to $14,999 | 19 | 4.0% |
| $15,000 to $24,999 | 32 | 6.8% |
| $25,000 to $34,999 | 60 | 12.7% |
| $35,000 to $49,999 | 98 | 20.7% |
| $50,000 to $74,999 | 67 | 14.1% |
| $75,000 to $99,999 | 70 | 14.8% |
| $100,000 to $149,999 | 28 | 5.9% |
| $150,000 to $199,999 | 8 | 1.7% |
| $200,000+ | 46 | 9.7% |
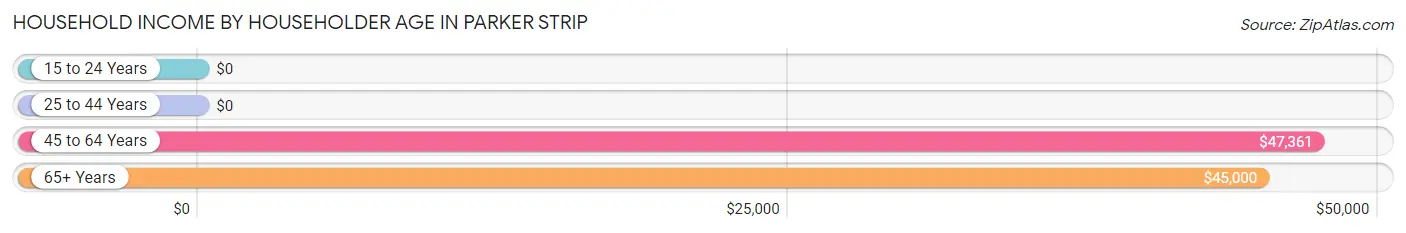
Household Income by Householder Age in Parker Strip
The median household income in Parker Strip is $48,333, with the highest median household income of $47,361 found in the 45 to 64 years age bracket for the primary householder. A total of 127 households (26.8%) fall into this category.
| Income Bracket | # Households | Median Income |
| 15 to 24 Years | 0 (0.0%) | $0 |
| 25 to 44 Years | 27 (5.7%) | $0 |
| 45 to 64 Years | 127 (26.8%) | $47,361 |
| 65+ Years | 320 (67.5%) | $45,000 |
| Total | 474 (100.0%) | $48,333 |
Poverty in Parker Strip
Income Below Poverty by Sex and Age in Parker Strip
With 10.6% poverty level for males and 12.1% for females among the residents of Parker Strip, 45 to 54 year old males and 45 to 54 year old females are the most vulnerable to poverty, with 4 males (33.3%) and 20 females (31.8%) in their respective age groups living below the poverty level.
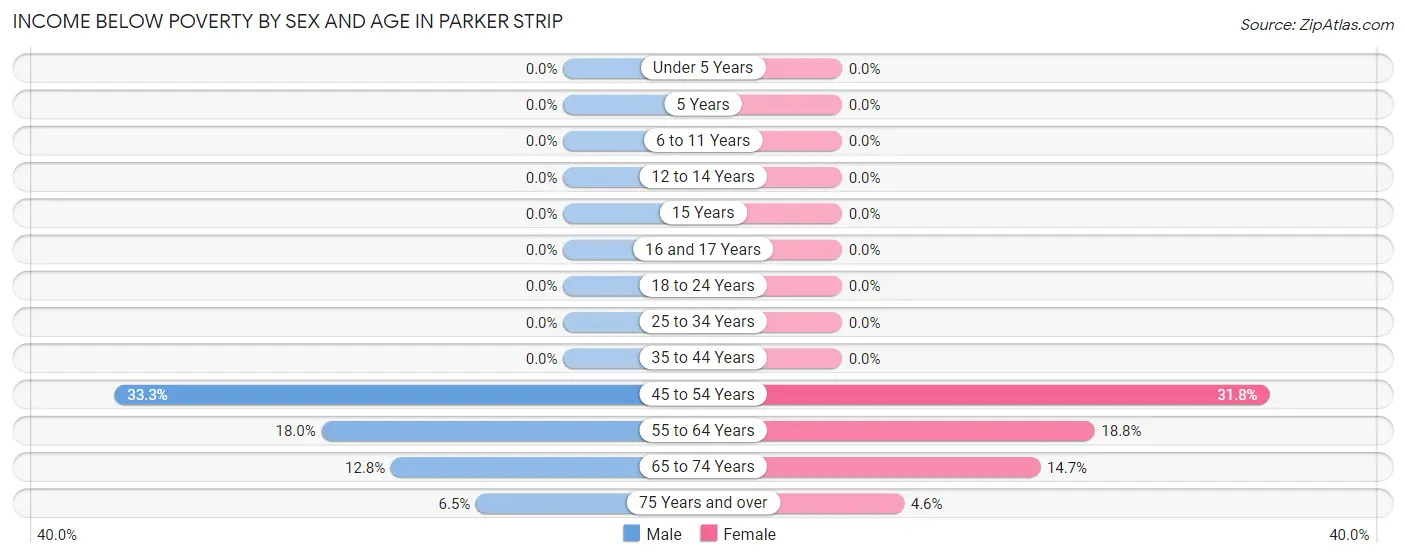
| Age Bracket | Male | Female |
| Under 5 Years | 0 (0.0%) | 0 (0.0%) |
| 5 Years | 0 (0.0%) | 0 (0.0%) |
| 6 to 11 Years | 0 (0.0%) | 0 (0.0%) |
| 12 to 14 Years | 0 (0.0%) | 0 (0.0%) |
| 15 Years | 0 (0.0%) | 0 (0.0%) |
| 16 and 17 Years | 0 (0.0%) | 0 (0.0%) |
| 18 to 24 Years | 0 (0.0%) | 0 (0.0%) |
| 25 to 34 Years | 0 (0.0%) | 0 (0.0%) |
| 35 to 44 Years | 0 (0.0%) | 0 (0.0%) |
| 45 to 54 Years | 4 (33.3%) | 20 (31.8%) |
| 55 to 64 Years | 14 (17.9%) | 12 (18.8%) |
| 65 to 74 Years | 11 (12.8%) | 15 (14.7%) |
| 75 Years and over | 9 (6.5%) | 8 (4.6%) |
| Total | 38 (10.6%) | 55 (12.1%) |
Income Above Poverty by Sex and Age in Parker Strip
According to the poverty statistics in Parker Strip, males aged 6 to 11 years and females aged under 5 years are the age groups that are most secure financially, with 100.0% of males and 100.0% of females in these age groups living above the poverty line.
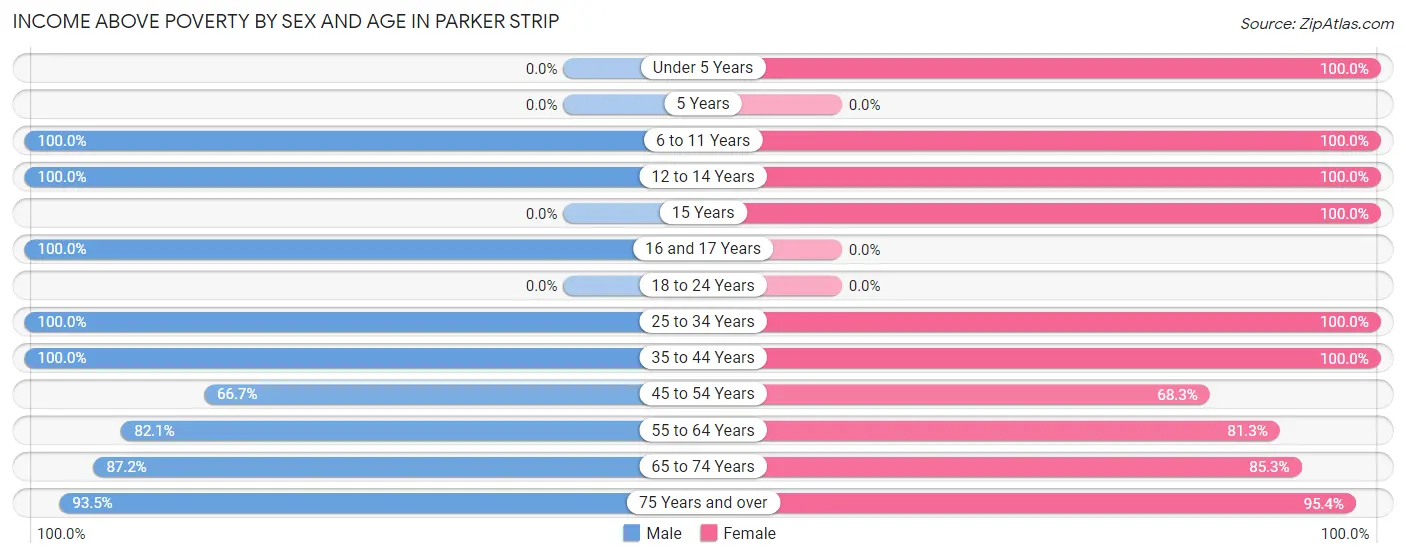
| Age Bracket | Male | Female |
| Under 5 Years | 0 (0.0%) | 23 (100.0%) |
| 5 Years | 0 (0.0%) | 0 (0.0%) |
| 6 to 11 Years | 10 (100.0%) | 15 (100.0%) |
| 12 to 14 Years | 3 (100.0%) | 5 (100.0%) |
| 15 Years | 0 (0.0%) | 2 (100.0%) |
| 16 and 17 Years | 5 (100.0%) | 0 (0.0%) |
| 18 to 24 Years | 0 (0.0%) | 0 (0.0%) |
| 25 to 34 Years | 22 (100.0%) | 1 (100.0%) |
| 35 to 44 Years | 5 (100.0%) | 5 (100.0%) |
| 45 to 54 Years | 8 (66.7%) | 43 (68.2%) |
| 55 to 64 Years | 64 (82.1%) | 52 (81.2%) |
| 65 to 74 Years | 75 (87.2%) | 87 (85.3%) |
| 75 Years and over | 130 (93.5%) | 166 (95.4%) |
| Total | 322 (89.4%) | 399 (87.9%) |
Income Below Poverty Among Married-Couple Families in Parker Strip
The poverty statistics for married-couple families in Parker Strip show that 9.4% or 22 of the total 235 families live below the poverty line. Families with no children have the highest poverty rate of 9.9%, comprising of 22 families. On the other hand, families with 1 or 2 children have the lowest poverty rate of 0.0%, which includes 0 families.
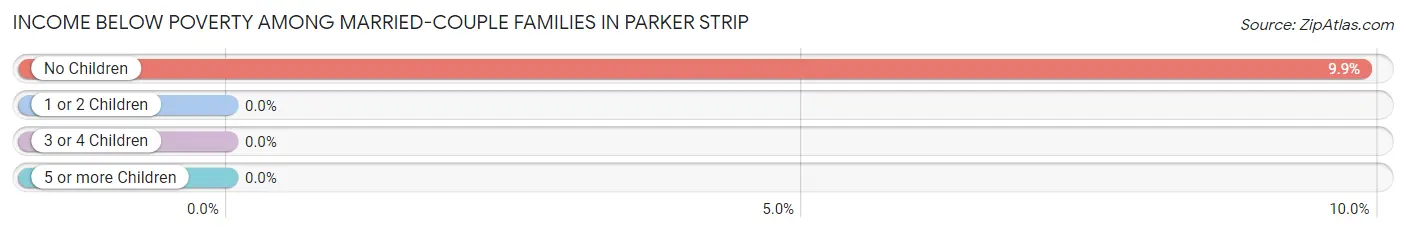
| Children | Above Poverty | Below Poverty |
| No Children | 201 (90.1%) | 22 (9.9%) |
| 1 or 2 Children | 9 (100.0%) | 0 (0.0%) |
| 3 or 4 Children | 3 (100.0%) | 0 (0.0%) |
| 5 or more Children | 0 (0.0%) | 0 (0.0%) |
| Total | 213 (90.6%) | 22 (9.4%) |
Income Below Poverty Among Single-Parent Households in Parker Strip
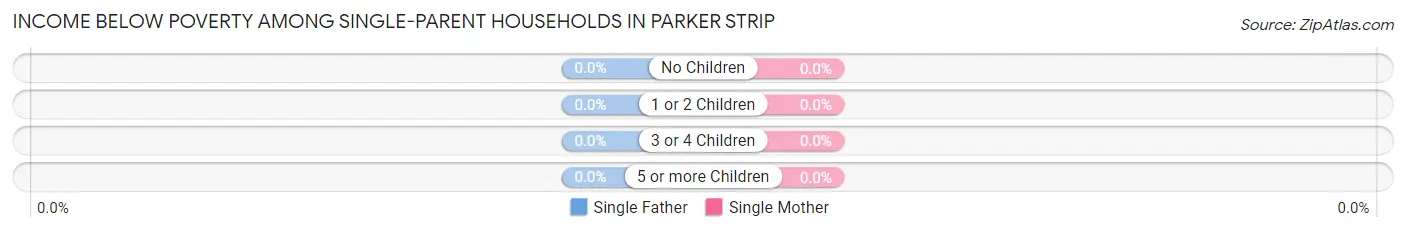
| Children | Single Father | Single Mother |
| No Children | 0 (0.0%) | 0 (0.0%) |
| 1 or 2 Children | 0 (0.0%) | 0 (0.0%) |
| 3 or 4 Children | 0 (0.0%) | 0 (0.0%) |
| 5 or more Children | 0 (0.0%) | 0 (0.0%) |
| Total | 0 (0.0%) | 0 (0.0%) |
Income Below Poverty Among Married-Couple vs Single-Parent Households in Parker Strip
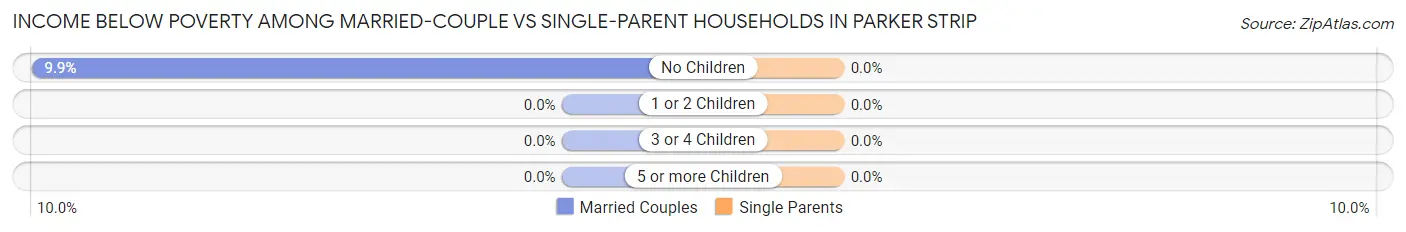
| Children | Married-Couple Families | Single-Parent Households |
| No Children | 22 (9.9%) | 0 (0.0%) |
| 1 or 2 Children | 0 (0.0%) | 0 (0.0%) |
| 3 or 4 Children | 0 (0.0%) | 0 (0.0%) |
| 5 or more Children | 0 (0.0%) | 0 (0.0%) |
| Total | 22 (9.4%) | 0 (0.0%) |
Employment Characteristics in Parker Strip
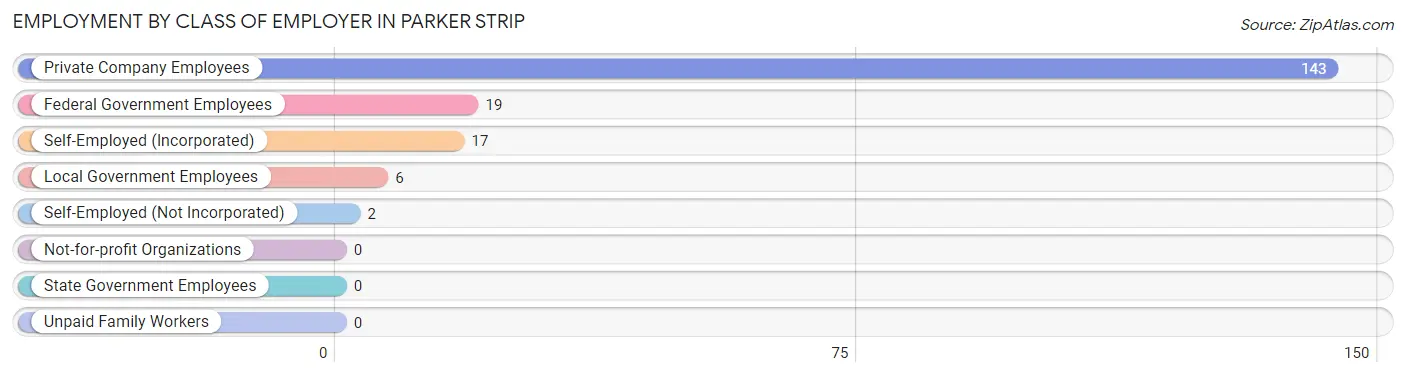
Employment by Class of Employer in Parker Strip
Among the 187 employed individuals in Parker Strip, private company employees (143 | 76.5%), federal government employees (19 | 10.2%), and self-employed (incorporated) (17 | 9.1%) make up the most common classes of employment.
| Employer Class | # Employees | % Employees |
| Private Company Employees | 143 | 76.5% |
| Self-Employed (Incorporated) | 17 | 9.1% |
| Self-Employed (Not Incorporated) | 2 | 1.1% |
| Not-for-profit Organizations | 0 | 0.0% |
| Local Government Employees | 6 | 3.2% |
| State Government Employees | 0 | 0.0% |
| Federal Government Employees | 19 | 10.2% |
| Unpaid Family Workers | 0 | 0.0% |
| Total | 187 | 100.0% |
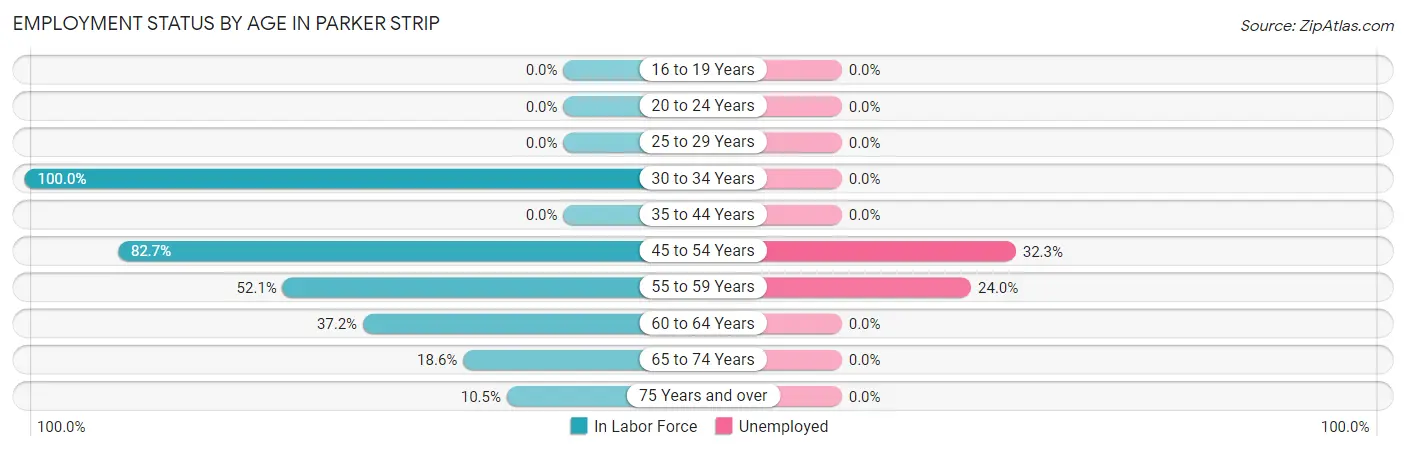
Employment Status by Age in Parker Strip
According to the labor force statistics for Parker Strip, out of the total population over 16 years of age (756), 28.2% or 213 individuals are in the labor force, with 12.2% or 26 of them unemployed. The age group with the highest labor force participation rate is 30 to 34 years, with 100.0% or 23 individuals in the labor force. Within the labor force, the 45 to 54 years age range has the highest percentage of unemployed individuals, with 32.3% or 20 of them being unemployed.
| Age Bracket | In Labor Force | Unemployed |
| 16 to 19 Years | 0 (0.0%) | 0 (0.0%) |
| 20 to 24 Years | 0 (0.0%) | 0 (0.0%) |
| 25 to 29 Years | 0 (0.0%) | 0 (0.0%) |
| 30 to 34 Years | 23 (100.0%) | 0 (0.0%) |
| 35 to 44 Years | 0 (0.0%) | 0 (0.0%) |
| 45 to 54 Years | 62 (82.7%) | 20 (32.3%) |
| 55 to 59 Years | 25 (52.1%) | 6 (24.0%) |
| 60 to 64 Years | 35 (37.2%) | 0 (0.0%) |
| 65 to 74 Years | 35 (18.6%) | 0 (0.0%) |
| 75 Years and over | 33 (10.5%) | 0 (0.0%) |
| Total | 213 (28.2%) | 26 (12.2%) |
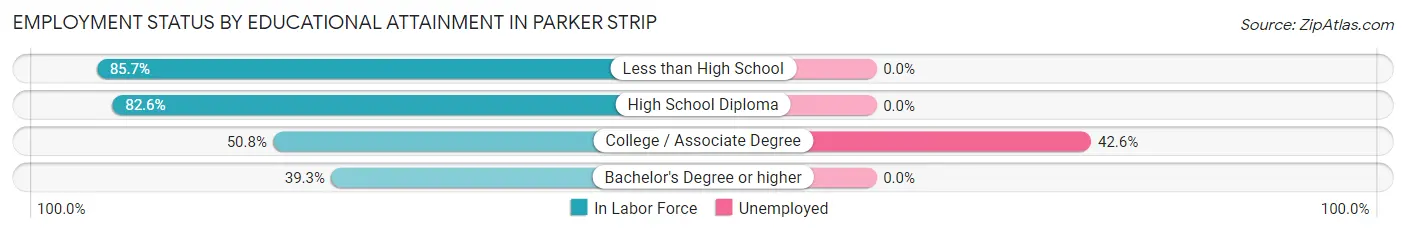
Employment Status by Educational Attainment in Parker Strip
According to labor force statistics for Parker Strip, 58.0% of individuals (145) out of the total population between 25 and 64 years of age (250) are in the labor force, with 17.9% or 26 of them being unemployed. The group with the highest labor force participation rate are those with the educational attainment of less than high school, with 85.7% or 24 individuals in the labor force. Within the labor force, individuals with college / associate degree education have the highest percentage of unemployment, with 42.6% or 26 of them being unemployed.
| Educational Attainment | In Labor Force | Unemployed |
| Less than High School | 24 (85.7%) | 0 (0.0%) |
| High School Diploma | 38 (82.6%) | 0 (0.0%) |
| College / Associate Degree | 61 (50.8%) | 51 (42.6%) |
| Bachelor's Degree or higher | 22 (39.3%) | 0 (0.0%) |
| Total | 145 (58.0%) | 45 (17.9%) |
Employment Occupations by Sex in Parker Strip
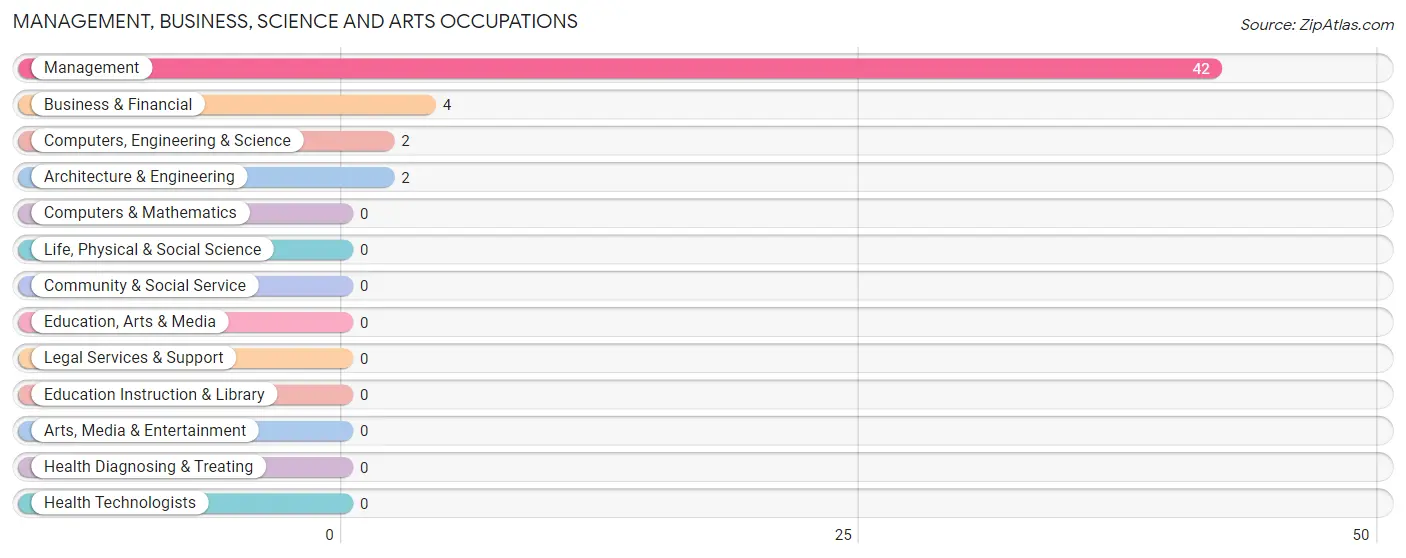
Management, Business, Science and Arts Occupations
The most common Management, Business, Science and Arts occupations in Parker Strip are Management (42 | 22.5%), Business & Financial (4 | 2.1%), Computers, Engineering & Science (2 | 1.1%), and Architecture & Engineering (2 | 1.1%).
Management, Business, Science and Arts Occupations by Sex
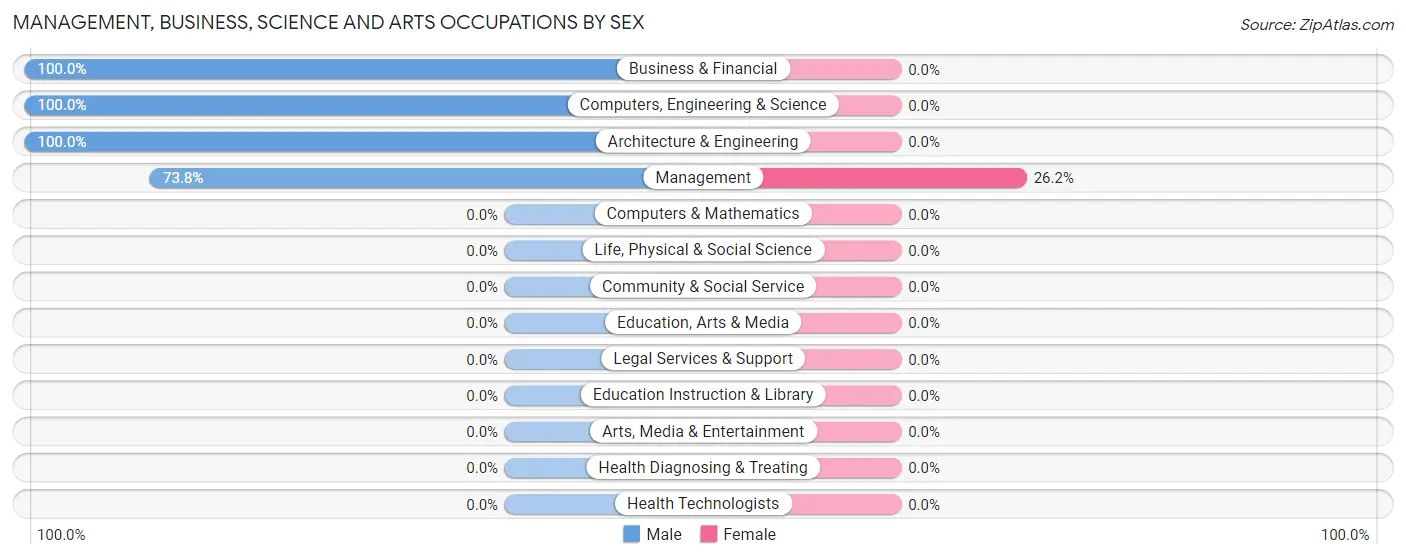
| Occupation | Male | Female |
| Management | 31 (73.8%) | 11 (26.2%) |
| Business & Financial | 4 (100.0%) | 0 (0.0%) |
| Computers, Engineering & Science | 2 (100.0%) | 0 (0.0%) |
| Computers & Mathematics | 0 (0.0%) | 0 (0.0%) |
| Architecture & Engineering | 2 (100.0%) | 0 (0.0%) |
| Life, Physical & Social Science | 0 (0.0%) | 0 (0.0%) |
| Community & Social Service | 0 (0.0%) | 0 (0.0%) |
| Education, Arts & Media | 0 (0.0%) | 0 (0.0%) |
| Legal Services & Support | 0 (0.0%) | 0 (0.0%) |
| Education Instruction & Library | 0 (0.0%) | 0 (0.0%) |
| Arts, Media & Entertainment | 0 (0.0%) | 0 (0.0%) |
| Health Diagnosing & Treating | 0 (0.0%) | 0 (0.0%) |
| Health Technologists | 0 (0.0%) | 0 (0.0%) |
| Total (Category) | 37 (77.1%) | 11 (22.9%) |
| Total (Overall) | 122 (65.2%) | 65 (34.8%) |
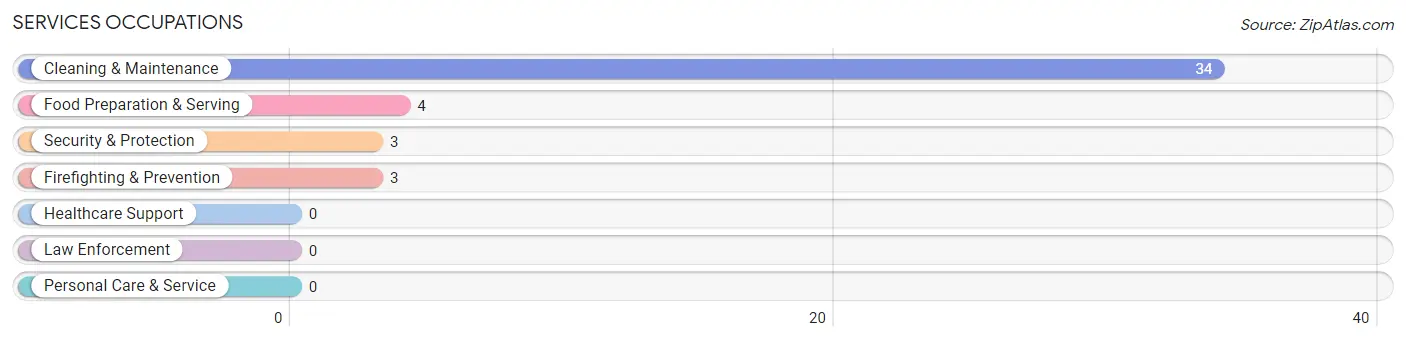
Services Occupations
The most common Services occupations in Parker Strip are Cleaning & Maintenance (34 | 18.2%), Food Preparation & Serving (4 | 2.1%), Security & Protection (3 | 1.6%), and Firefighting & Prevention (3 | 1.6%).
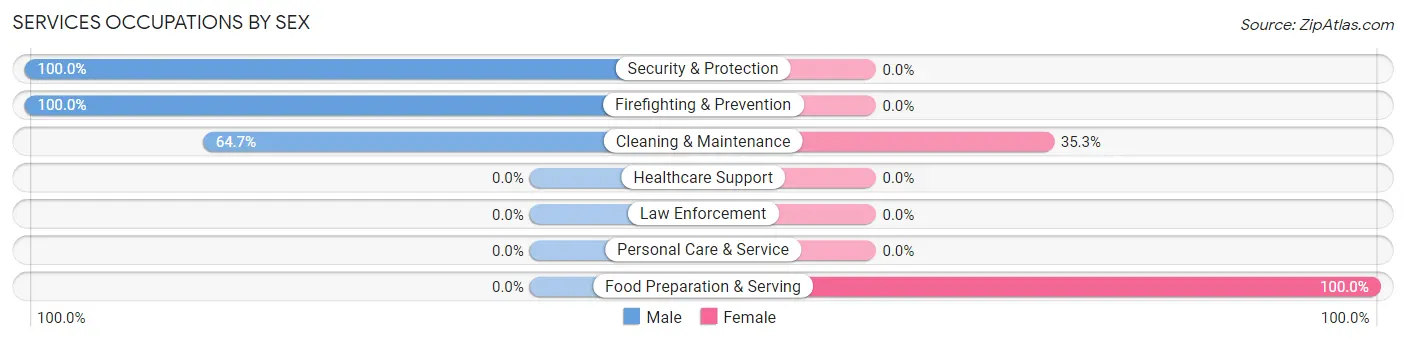
Services Occupations by Sex
Within the Services occupations in Parker Strip, the most male-oriented occupations are Security & Protection (100.0%), Firefighting & Prevention (100.0%), and Cleaning & Maintenance (64.7%), while the most female-oriented occupations are Food Preparation & Serving (100.0%), and Cleaning & Maintenance (35.3%).
| Occupation | Male | Female |
| Healthcare Support | 0 (0.0%) | 0 (0.0%) |
| Security & Protection | 3 (100.0%) | 0 (0.0%) |
| Firefighting & Prevention | 3 (100.0%) | 0 (0.0%) |
| Law Enforcement | 0 (0.0%) | 0 (0.0%) |
| Food Preparation & Serving | 0 (0.0%) | 4 (100.0%) |
| Cleaning & Maintenance | 22 (64.7%) | 12 (35.3%) |
| Personal Care & Service | 0 (0.0%) | 0 (0.0%) |
| Total (Category) | 25 (61.0%) | 16 (39.0%) |
| Total (Overall) | 122 (65.2%) | 65 (34.8%) |
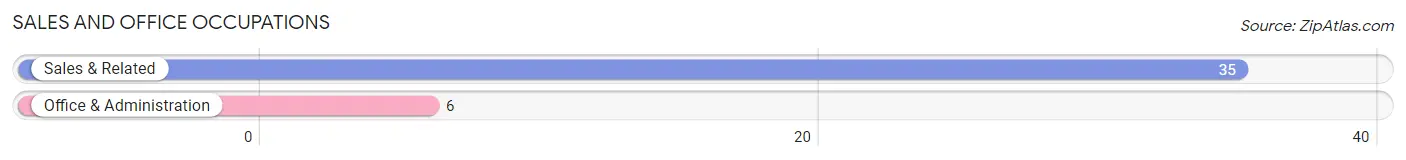
Sales and Office Occupations
The most common Sales and Office occupations in Parker Strip are Sales & Related (35 | 18.7%), and Office & Administration (6 | 3.2%).
Sales and Office Occupations by Sex
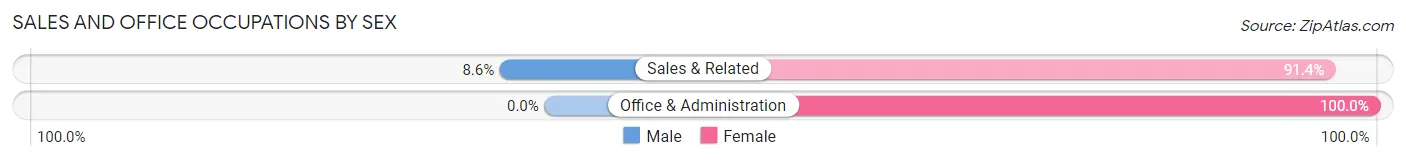
| Occupation | Male | Female |
| Sales & Related | 3 (8.6%) | 32 (91.4%) |
| Office & Administration | 0 (0.0%) | 6 (100.0%) |
| Total (Category) | 3 (7.3%) | 38 (92.7%) |
| Total (Overall) | 122 (65.2%) | 65 (34.8%) |
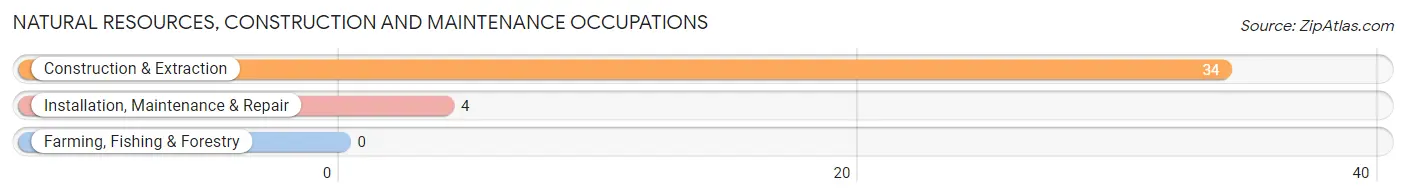
Natural Resources, Construction and Maintenance Occupations
The most common Natural Resources, Construction and Maintenance occupations in Parker Strip are Construction & Extraction (34 | 18.2%), and Installation, Maintenance & Repair (4 | 2.1%).
Natural Resources, Construction and Maintenance Occupations by Sex
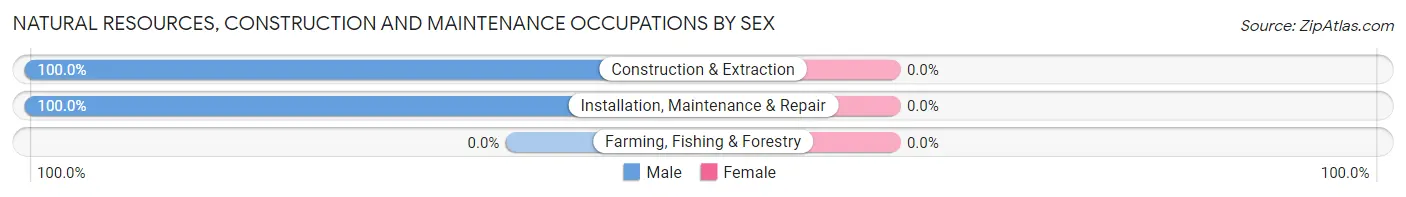
| Occupation | Male | Female |
| Farming, Fishing & Forestry | 0 (0.0%) | 0 (0.0%) |
| Construction & Extraction | 34 (100.0%) | 0 (0.0%) |
| Installation, Maintenance & Repair | 4 (100.0%) | 0 (0.0%) |
| Total (Category) | 38 (100.0%) | 0 (0.0%) |
| Total (Overall) | 122 (65.2%) | 65 (34.8%) |
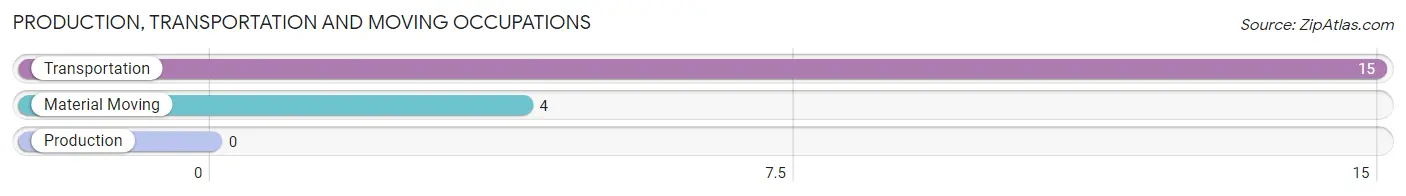
Production, Transportation and Moving Occupations
The most common Production, Transportation and Moving occupations in Parker Strip are Transportation (15 | 8.0%), and Material Moving (4 | 2.1%).
Production, Transportation and Moving Occupations by Sex
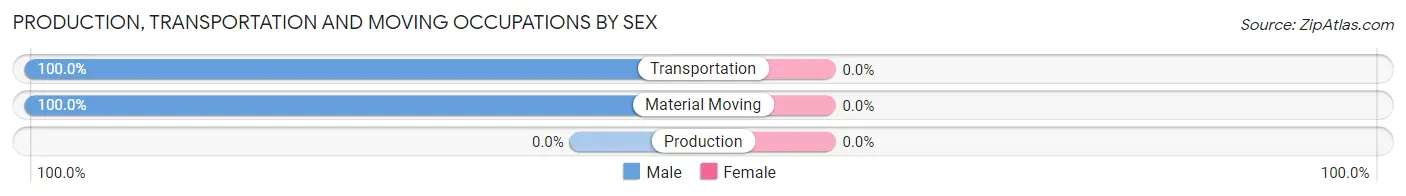
| Occupation | Male | Female |
| Production | 0 (0.0%) | 0 (0.0%) |
| Transportation | 15 (100.0%) | 0 (0.0%) |
| Material Moving | 4 (100.0%) | 0 (0.0%) |
| Total (Category) | 19 (100.0%) | 0 (0.0%) |
| Total (Overall) | 122 (65.2%) | 65 (34.8%) |
Employment Industries by Sex in Parker Strip
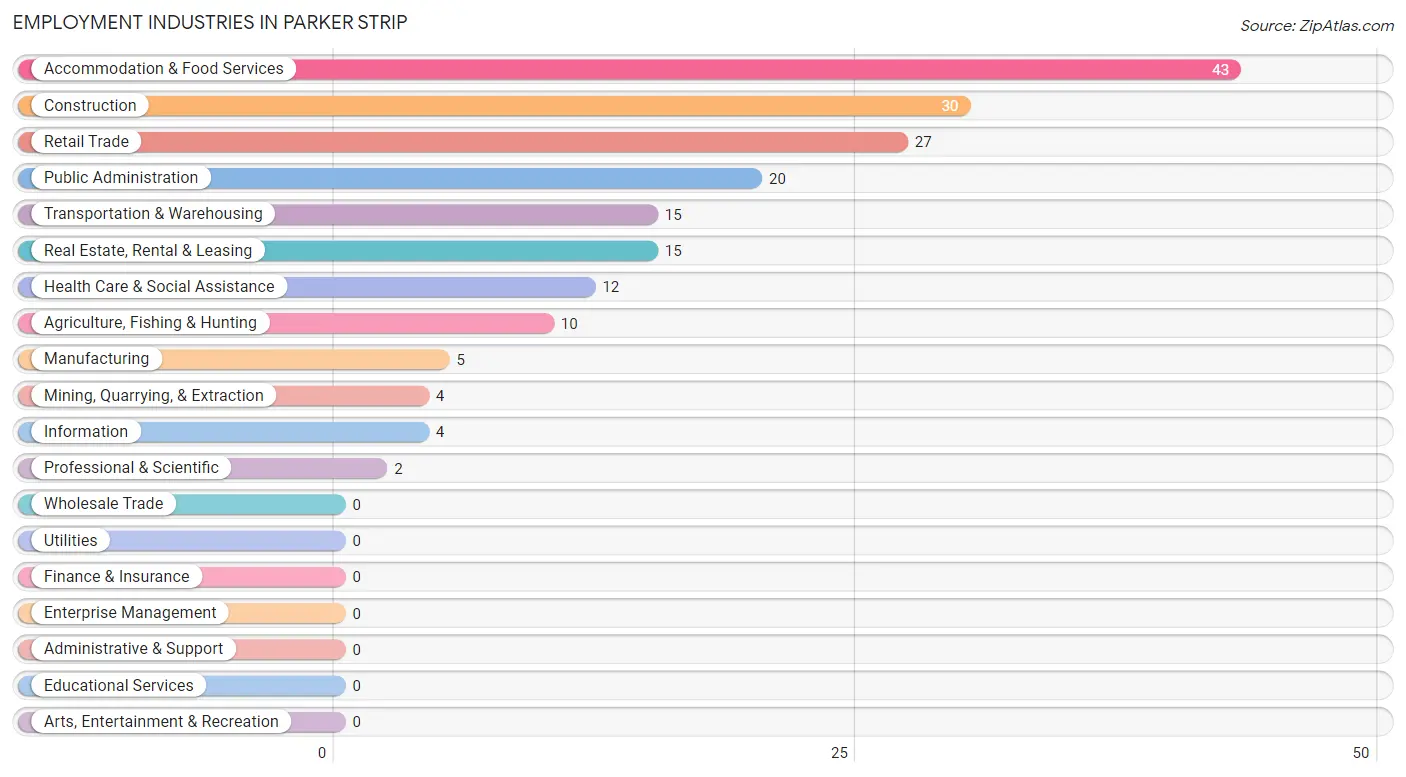
Employment Industries in Parker Strip
The major employment industries in Parker Strip include Accommodation & Food Services (43 | 23.0%), Construction (30 | 16.0%), Retail Trade (27 | 14.4%), Public Administration (20 | 10.7%), and Transportation & Warehousing (15 | 8.0%).
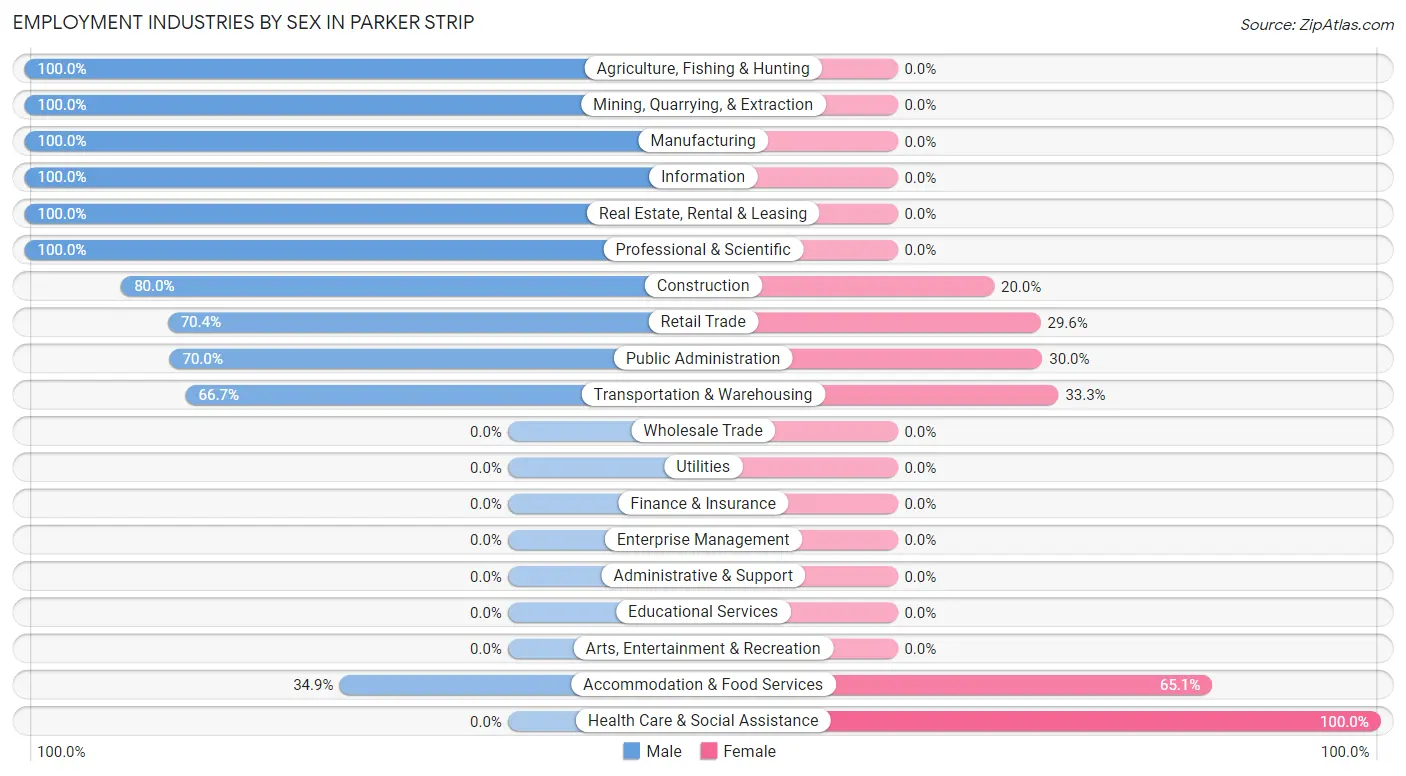
Employment Industries by Sex in Parker Strip
The Parker Strip industries that see more men than women are Agriculture, Fishing & Hunting (100.0%), Mining, Quarrying, & Extraction (100.0%), and Manufacturing (100.0%), whereas the industries that tend to have a higher number of women are Health Care & Social Assistance (100.0%), Accommodation & Food Services (65.1%), and Transportation & Warehousing (33.3%).
| Industry | Male | Female |
| Agriculture, Fishing & Hunting | 10 (100.0%) | 0 (0.0%) |
| Mining, Quarrying, & Extraction | 4 (100.0%) | 0 (0.0%) |
| Construction | 24 (80.0%) | 6 (20.0%) |
| Manufacturing | 5 (100.0%) | 0 (0.0%) |
| Wholesale Trade | 0 (0.0%) | 0 (0.0%) |
| Retail Trade | 19 (70.4%) | 8 (29.6%) |
| Transportation & Warehousing | 10 (66.7%) | 5 (33.3%) |
| Utilities | 0 (0.0%) | 0 (0.0%) |
| Information | 4 (100.0%) | 0 (0.0%) |
| Finance & Insurance | 0 (0.0%) | 0 (0.0%) |
| Real Estate, Rental & Leasing | 15 (100.0%) | 0 (0.0%) |
| Professional & Scientific | 2 (100.0%) | 0 (0.0%) |
| Enterprise Management | 0 (0.0%) | 0 (0.0%) |
| Administrative & Support | 0 (0.0%) | 0 (0.0%) |
| Educational Services | 0 (0.0%) | 0 (0.0%) |
| Health Care & Social Assistance | 0 (0.0%) | 12 (100.0%) |
| Arts, Entertainment & Recreation | 0 (0.0%) | 0 (0.0%) |
| Accommodation & Food Services | 15 (34.9%) | 28 (65.1%) |
| Public Administration | 14 (70.0%) | 6 (30.0%) |
| Total | 122 (65.2%) | 65 (34.8%) |
Education in Parker Strip
School Enrollment in Parker Strip
The most common levels of schooling among the 40 students in Parker Strip are elementary school (23 | 57.5%), middle school (10 | 25.0%), and high school (7 | 17.5%).
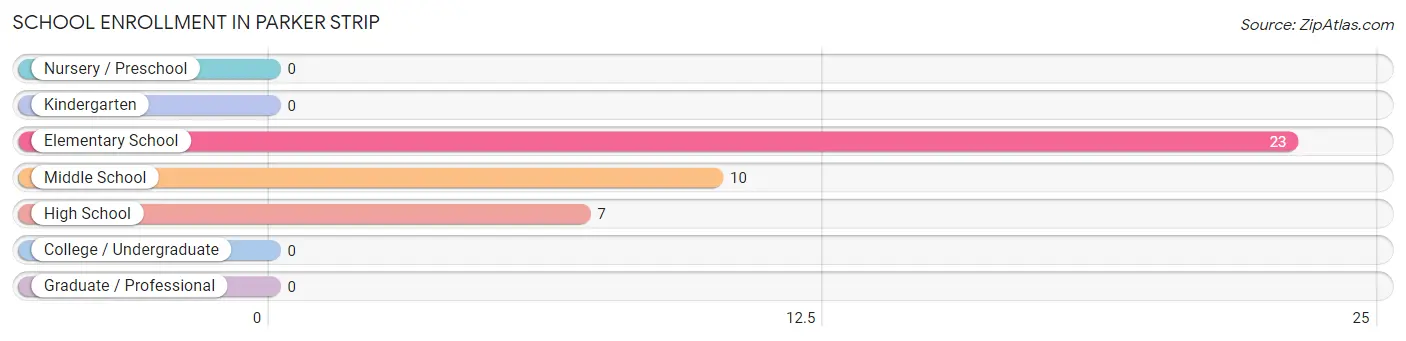
| School Level | # Students | % Students |
| Nursery / Preschool | 0 | 0.0% |
| Kindergarten | 0 | 0.0% |
| Elementary School | 23 | 57.5% |
| Middle School | 10 | 25.0% |
| High School | 7 | 17.5% |
| College / Undergraduate | 0 | 0.0% |
| Graduate / Professional | 0 | 0.0% |
| Total | 40 | 100.0% |
School Enrollment by Age by Funding Source in Parker Strip
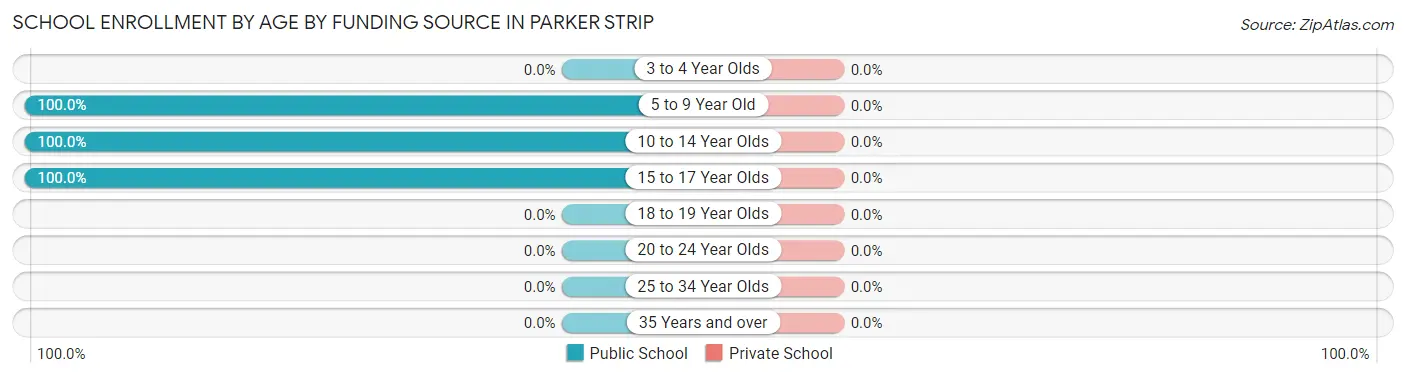
| Age Bracket | Public School | Private School |
| 3 to 4 Year Olds | 0 (0.0%) | 0 (0.0%) |
| 5 to 9 Year Old | 23 (100.0%) | 0 (0.0%) |
| 10 to 14 Year Olds | 10 (100.0%) | 0 (0.0%) |
| 15 to 17 Year Olds | 7 (100.0%) | 0 (0.0%) |
| 18 to 19 Year Olds | 0 (0.0%) | 0 (0.0%) |
| 20 to 24 Year Olds | 0 (0.0%) | 0 (0.0%) |
| 25 to 34 Year Olds | 0 (0.0%) | 0 (0.0%) |
| 35 Years and over | 0 (0.0%) | 0 (0.0%) |
| Total | 40 (100.0%) | 0 (0.0%) |
Educational Attainment by Field of Study in Parker Strip
Education (51 | 33.6%), business (34 | 22.4%), liberal arts & history (14 | 9.2%), engineering (11 | 7.2%), and social sciences (10 | 6.6%) are the most common fields of study among 152 individuals in Parker Strip who have obtained a bachelor's degree or higher.
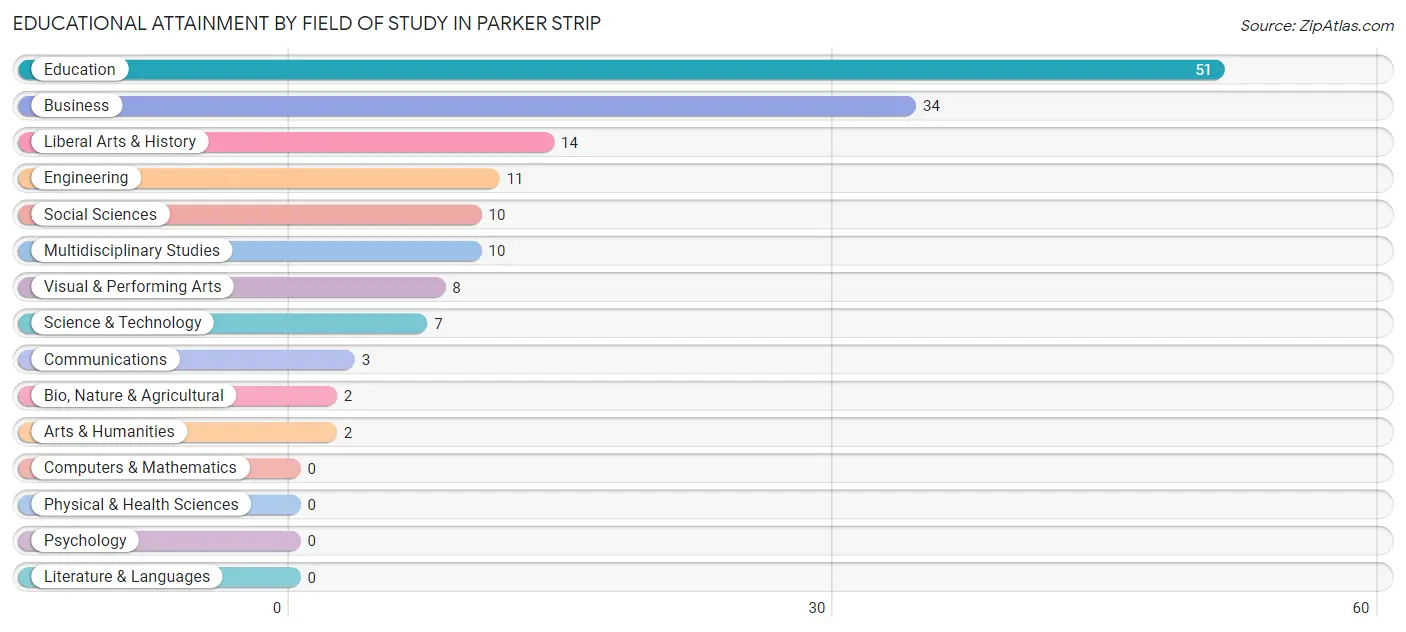
| Field of Study | # Graduates | % Graduates |
| Computers & Mathematics | 0 | 0.0% |
| Bio, Nature & Agricultural | 2 | 1.3% |
| Physical & Health Sciences | 0 | 0.0% |
| Psychology | 0 | 0.0% |
| Social Sciences | 10 | 6.6% |
| Engineering | 11 | 7.2% |
| Multidisciplinary Studies | 10 | 6.6% |
| Science & Technology | 7 | 4.6% |
| Business | 34 | 22.4% |
| Education | 51 | 33.6% |
| Literature & Languages | 0 | 0.0% |
| Liberal Arts & History | 14 | 9.2% |
| Visual & Performing Arts | 8 | 5.3% |
| Communications | 3 | 2.0% |
| Arts & Humanities | 2 | 1.3% |
| Total | 152 | 100.0% |
Transportation & Commute in Parker Strip
Vehicle Availability by Sex in Parker Strip
The most prevalent vehicle ownership categories in Parker Strip are males with 2 vehicles (62, accounting for 50.8%) and females with 2 vehicles (34, making up 95.4%).
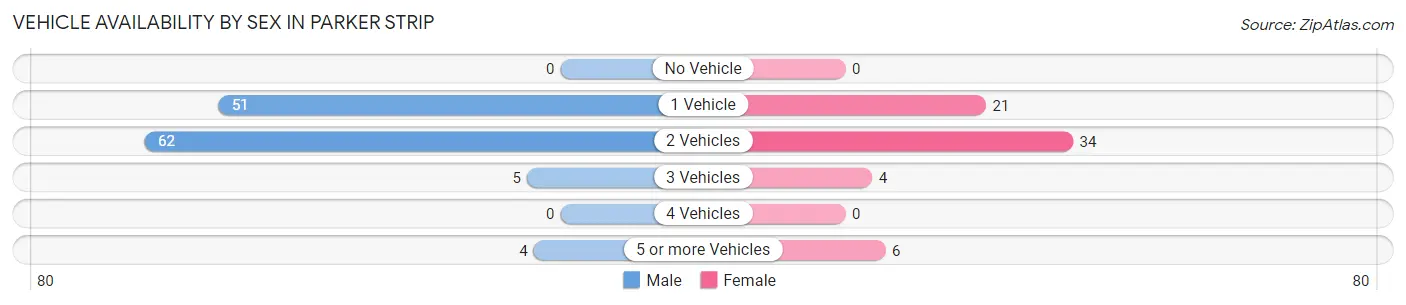
| Vehicles Available | Male | Female |
| No Vehicle | 0 (0.0%) | 0 (0.0%) |
| 1 Vehicle | 51 (41.8%) | 21 (32.3%) |
| 2 Vehicles | 62 (50.8%) | 34 (52.3%) |
| 3 Vehicles | 5 (4.1%) | 4 (6.1%) |
| 4 Vehicles | 0 (0.0%) | 0 (0.0%) |
| 5 or more Vehicles | 4 (3.3%) | 6 (9.2%) |
| Total | 122 (100.0%) | 65 (100.0%) |
Commute Time in Parker Strip
The most frequently occuring commute durations in Parker Strip are 20 to 24 minutes (34 commuters, 21.1%), 30 to 34 minutes (34 commuters, 21.1%), and 10 to 14 minutes (30 commuters, 18.6%).
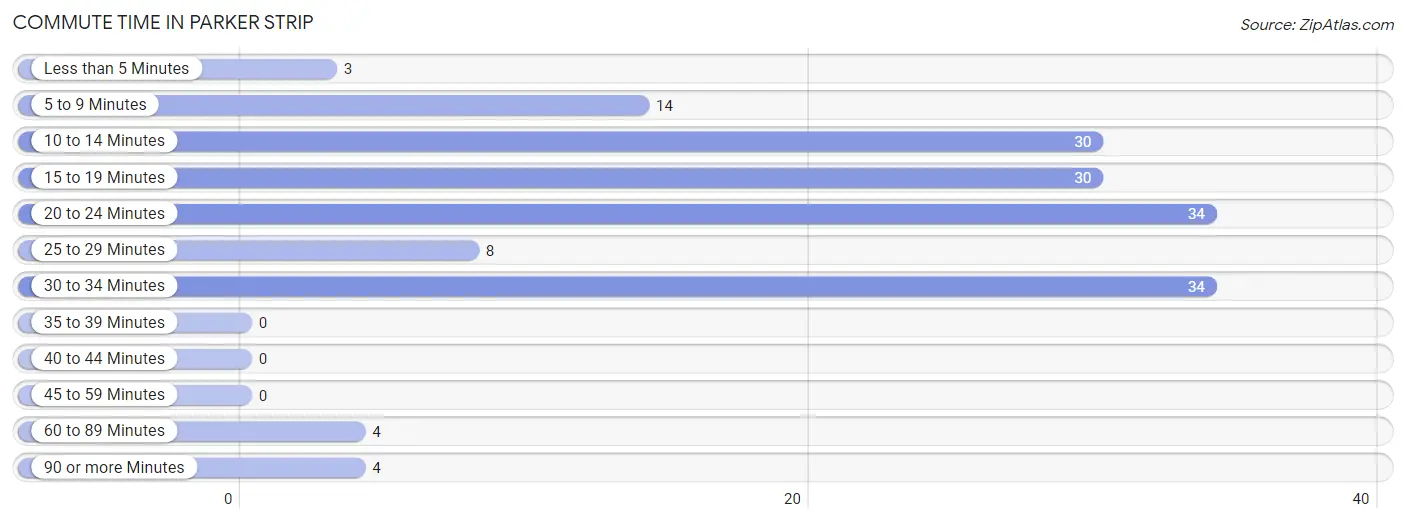
| Commute Time | # Commuters | % Commuters |
| Less than 5 Minutes | 3 | 1.9% |
| 5 to 9 Minutes | 14 | 8.7% |
| 10 to 14 Minutes | 30 | 18.6% |
| 15 to 19 Minutes | 30 | 18.6% |
| 20 to 24 Minutes | 34 | 21.1% |
| 25 to 29 Minutes | 8 | 5.0% |
| 30 to 34 Minutes | 34 | 21.1% |
| 35 to 39 Minutes | 0 | 0.0% |
| 40 to 44 Minutes | 0 | 0.0% |
| 45 to 59 Minutes | 0 | 0.0% |
| 60 to 89 Minutes | 4 | 2.5% |
| 90 or more Minutes | 4 | 2.5% |
Commute Time by Sex in Parker Strip
The most common commute times in Parker Strip are 30 to 34 minutes (29 commuters, 26.9%) for males and 20 to 24 minutes (34 commuters, 64.1%) for females.
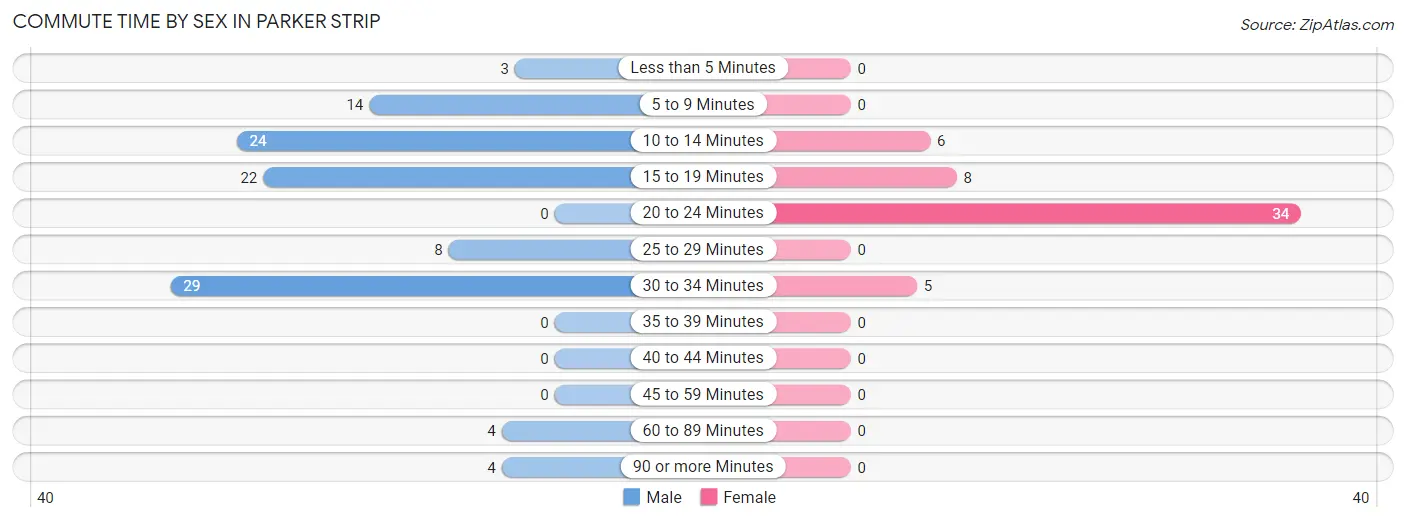
| Commute Time | Male | Female |
| Less than 5 Minutes | 3 (2.8%) | 0 (0.0%) |
| 5 to 9 Minutes | 14 (13.0%) | 0 (0.0%) |
| 10 to 14 Minutes | 24 (22.2%) | 6 (11.3%) |
| 15 to 19 Minutes | 22 (20.4%) | 8 (15.1%) |
| 20 to 24 Minutes | 0 (0.0%) | 34 (64.1%) |
| 25 to 29 Minutes | 8 (7.4%) | 0 (0.0%) |
| 30 to 34 Minutes | 29 (26.9%) | 5 (9.4%) |
| 35 to 39 Minutes | 0 (0.0%) | 0 (0.0%) |
| 40 to 44 Minutes | 0 (0.0%) | 0 (0.0%) |
| 45 to 59 Minutes | 0 (0.0%) | 0 (0.0%) |
| 60 to 89 Minutes | 4 (3.7%) | 0 (0.0%) |
| 90 or more Minutes | 4 (3.7%) | 0 (0.0%) |
Time of Departure to Work by Sex in Parker Strip
The most frequent times of departure to work in Parker Strip are 12:00 AM to 4:59 AM (30, 27.8%) for males and 7:00 AM to 7:29 AM (24, 45.3%) for females.
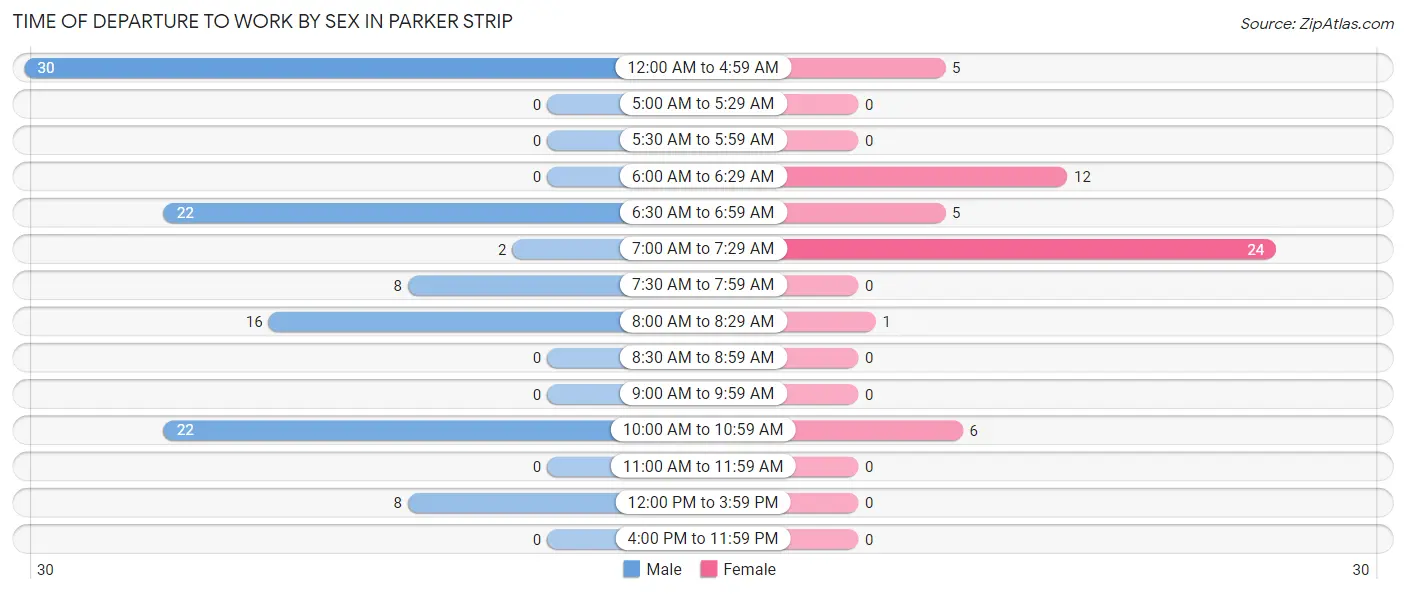
| Time of Departure | Male | Female |
| 12:00 AM to 4:59 AM | 30 (27.8%) | 5 (9.4%) |
| 5:00 AM to 5:29 AM | 0 (0.0%) | 0 (0.0%) |
| 5:30 AM to 5:59 AM | 0 (0.0%) | 0 (0.0%) |
| 6:00 AM to 6:29 AM | 0 (0.0%) | 12 (22.6%) |
| 6:30 AM to 6:59 AM | 22 (20.4%) | 5 (9.4%) |
| 7:00 AM to 7:29 AM | 2 (1.8%) | 24 (45.3%) |
| 7:30 AM to 7:59 AM | 8 (7.4%) | 0 (0.0%) |
| 8:00 AM to 8:29 AM | 16 (14.8%) | 1 (1.9%) |
| 8:30 AM to 8:59 AM | 0 (0.0%) | 0 (0.0%) |
| 9:00 AM to 9:59 AM | 0 (0.0%) | 0 (0.0%) |
| 10:00 AM to 10:59 AM | 22 (20.4%) | 6 (11.3%) |
| 11:00 AM to 11:59 AM | 0 (0.0%) | 0 (0.0%) |
| 12:00 PM to 3:59 PM | 8 (7.4%) | 0 (0.0%) |
| 4:00 PM to 11:59 PM | 0 (0.0%) | 0 (0.0%) |
| Total | 108 (100.0%) | 53 (100.0%) |
Housing Occupancy in Parker Strip
Occupancy by Ownership in Parker Strip
Of the total 474 dwellings in Parker Strip, owner-occupied units account for 429 (90.5%), while renter-occupied units make up 45 (9.5%).
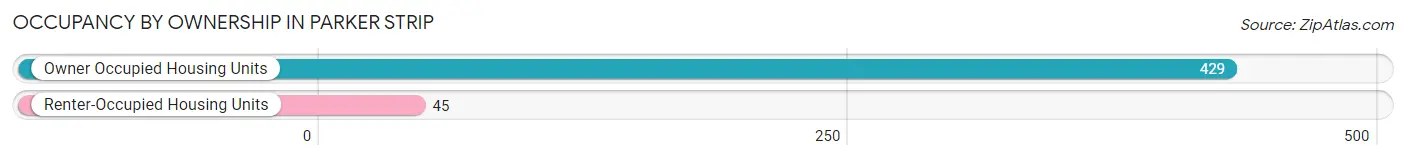
| Occupancy | # Housing Units | % Housing Units |
| Owner Occupied Housing Units | 429 | 90.5% |
| Renter-Occupied Housing Units | 45 | 9.5% |
| Total Occupied Housing Units | 474 | 100.0% |
Occupancy by Household Size in Parker Strip
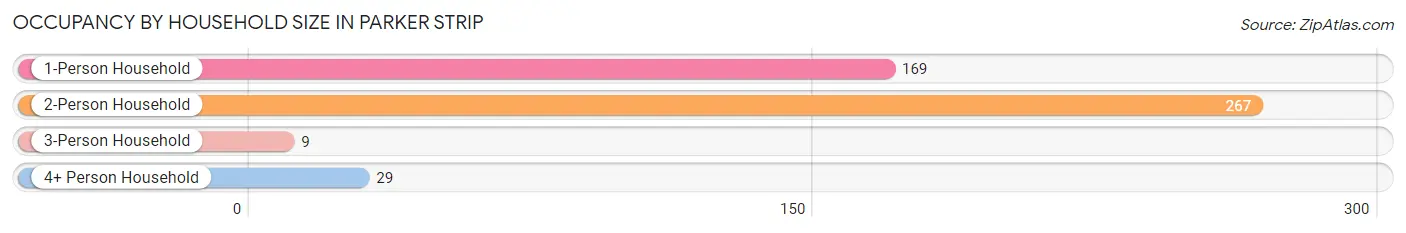
| Household Size | # Housing Units | % Housing Units |
| 1-Person Household | 169 | 35.6% |
| 2-Person Household | 267 | 56.3% |
| 3-Person Household | 9 | 1.9% |
| 4+ Person Household | 29 | 6.1% |
| Total Housing Units | 474 | 100.0% |
Occupancy by Ownership by Household Size in Parker Strip
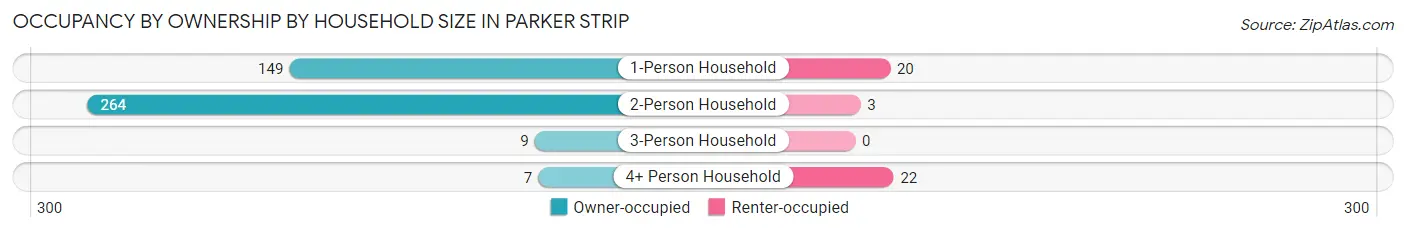
| Household Size | Owner-occupied | Renter-occupied |
| 1-Person Household | 149 (88.2%) | 20 (11.8%) |
| 2-Person Household | 264 (98.9%) | 3 (1.1%) |
| 3-Person Household | 9 (100.0%) | 0 (0.0%) |
| 4+ Person Household | 7 (24.1%) | 22 (75.9%) |
| Total Housing Units | 429 (90.5%) | 45 (9.5%) |
Occupancy by Educational Attainment in Parker Strip
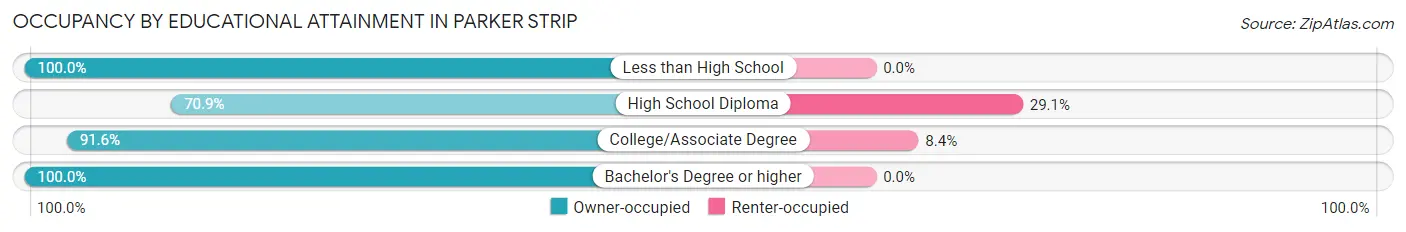
| Household Size | Owner-occupied | Renter-occupied |
| Less than High School | 47 (100.0%) | 0 (0.0%) |
| High School Diploma | 61 (70.9%) | 25 (29.1%) |
| College/Associate Degree | 219 (91.6%) | 20 (8.4%) |
| Bachelor's Degree or higher | 102 (100.0%) | 0 (0.0%) |
Occupancy by Age of Householder in Parker Strip
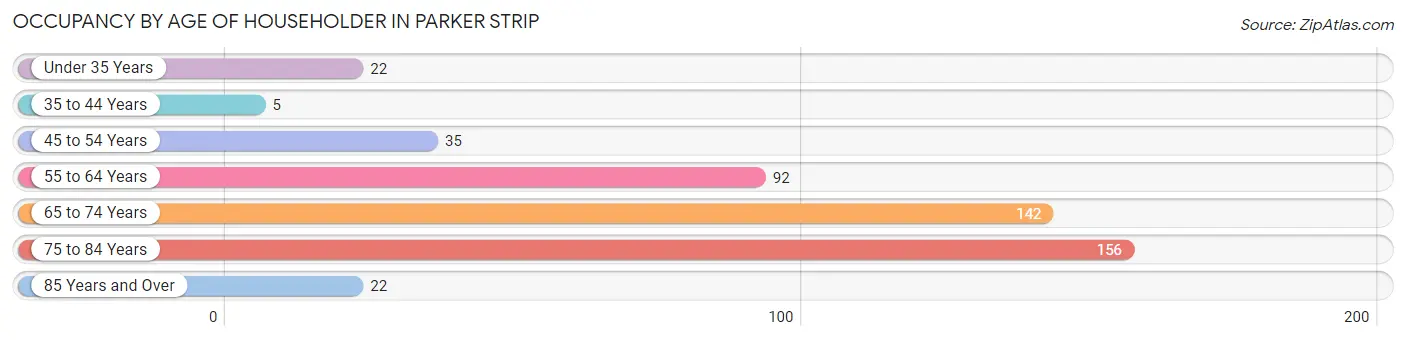
| Age Bracket | # Households | % Households |
| Under 35 Years | 22 | 4.6% |
| 35 to 44 Years | 5 | 1.1% |
| 45 to 54 Years | 35 | 7.4% |
| 55 to 64 Years | 92 | 19.4% |
| 65 to 74 Years | 142 | 30.0% |
| 75 to 84 Years | 156 | 32.9% |
| 85 Years and Over | 22 | 4.6% |
| Total | 474 | 100.0% |
Housing Finances in Parker Strip
Median Income by Occupancy in Parker Strip

| Occupancy Type | # Households | Median Income |
| Owner-Occupied | 429 (90.5%) | $48,380 |
| Renter-Occupied | 45 (9.5%) | $0 |
| Average | 474 (100.0%) | $48,333 |
Occupancy by Householder Income Bracket in Parker Strip
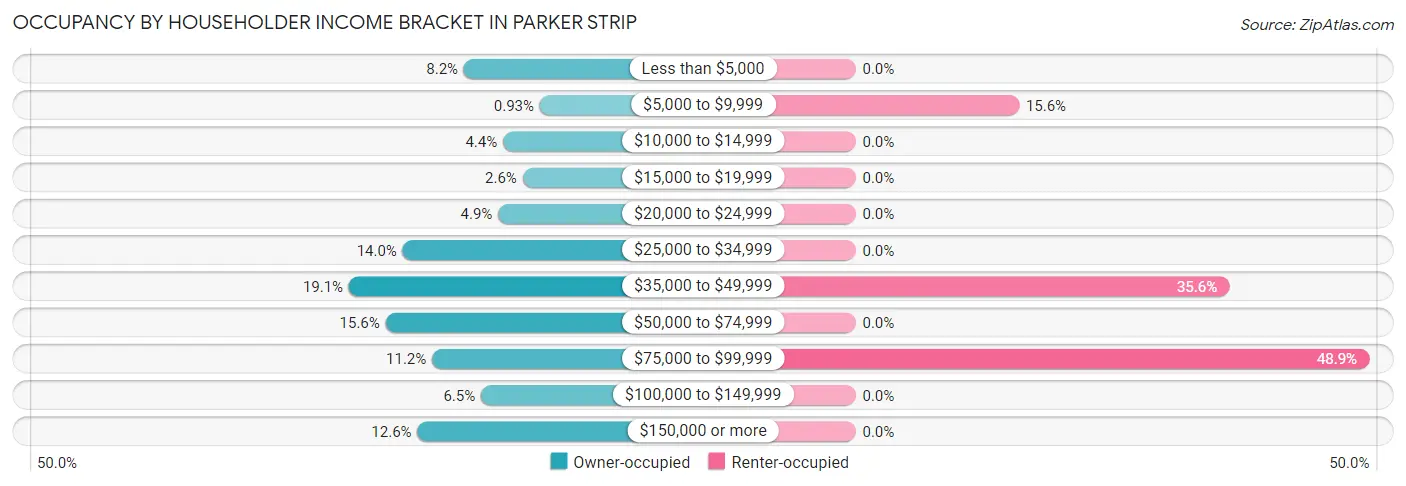
| Income Bracket | Owner-occupied | Renter-occupied |
| Less than $5,000 | 35 (8.2%) | 0 (0.0%) |
| $5,000 to $9,999 | 4 (0.9%) | 7 (15.6%) |
| $10,000 to $14,999 | 19 (4.4%) | 0 (0.0%) |
| $15,000 to $19,999 | 11 (2.6%) | 0 (0.0%) |
| $20,000 to $24,999 | 21 (4.9%) | 0 (0.0%) |
| $25,000 to $34,999 | 60 (14.0%) | 0 (0.0%) |
| $35,000 to $49,999 | 82 (19.1%) | 16 (35.6%) |
| $50,000 to $74,999 | 67 (15.6%) | 0 (0.0%) |
| $75,000 to $99,999 | 48 (11.2%) | 22 (48.9%) |
| $100,000 to $149,999 | 28 (6.5%) | 0 (0.0%) |
| $150,000 or more | 54 (12.6%) | 0 (0.0%) |
| Total | 429 (100.0%) | 45 (100.0%) |
Monthly Housing Cost Tiers in Parker Strip
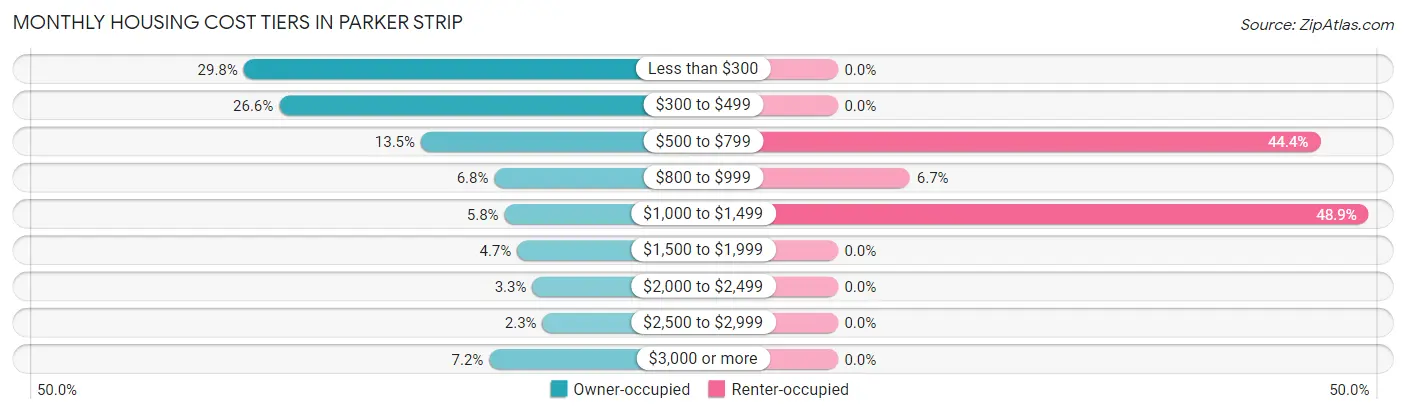
| Monthly Cost | Owner-occupied | Renter-occupied |
| Less than $300 | 128 (29.8%) | 0 (0.0%) |
| $300 to $499 | 114 (26.6%) | 0 (0.0%) |
| $500 to $799 | 58 (13.5%) | 20 (44.4%) |
| $800 to $999 | 29 (6.8%) | 3 (6.7%) |
| $1,000 to $1,499 | 25 (5.8%) | 22 (48.9%) |
| $1,500 to $1,999 | 20 (4.7%) | 0 (0.0%) |
| $2,000 to $2,499 | 14 (3.3%) | 0 (0.0%) |
| $2,500 to $2,999 | 10 (2.3%) | 0 (0.0%) |
| $3,000 or more | 31 (7.2%) | 0 (0.0%) |
| Total | 429 (100.0%) | 45 (100.0%) |
Physical Housing Characteristics in Parker Strip
Housing Structures in Parker Strip
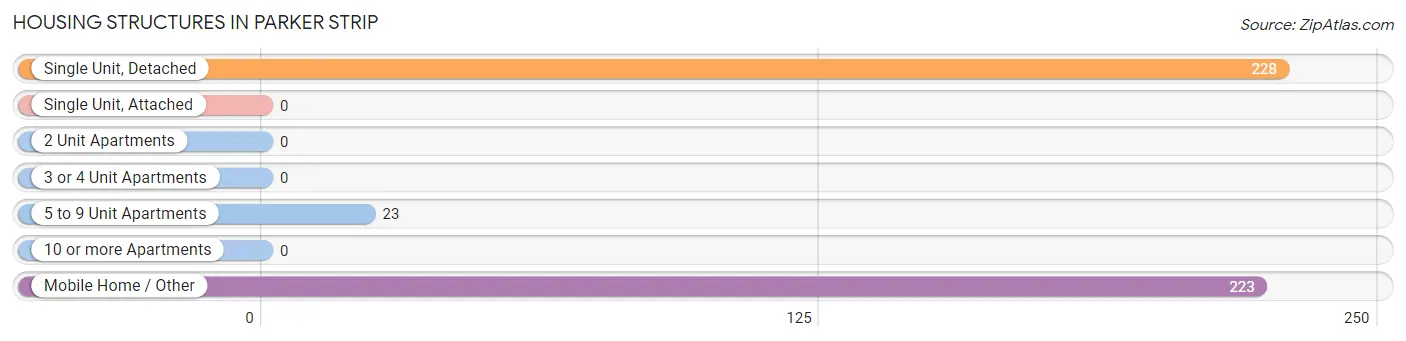
| Structure Type | # Housing Units | % Housing Units |
| Single Unit, Detached | 228 | 48.1% |
| Single Unit, Attached | 0 | 0.0% |
| 2 Unit Apartments | 0 | 0.0% |
| 3 or 4 Unit Apartments | 0 | 0.0% |
| 5 to 9 Unit Apartments | 23 | 4.9% |
| 10 or more Apartments | 0 | 0.0% |
| Mobile Home / Other | 223 | 47.0% |
| Total | 474 | 100.0% |
Housing Structures by Occupancy in Parker Strip
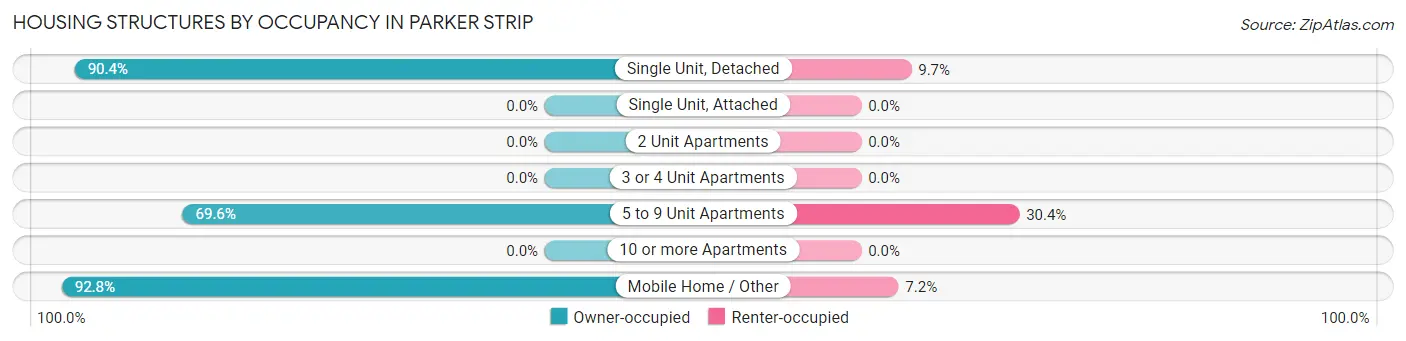
| Structure Type | Owner-occupied | Renter-occupied |
| Single Unit, Detached | 206 (90.3%) | 22 (9.7%) |
| Single Unit, Attached | 0 (0.0%) | 0 (0.0%) |
| 2 Unit Apartments | 0 (0.0%) | 0 (0.0%) |
| 3 or 4 Unit Apartments | 0 (0.0%) | 0 (0.0%) |
| 5 to 9 Unit Apartments | 16 (69.6%) | 7 (30.4%) |
| 10 or more Apartments | 0 (0.0%) | 0 (0.0%) |
| Mobile Home / Other | 207 (92.8%) | 16 (7.2%) |
| Total | 429 (90.5%) | 45 (9.5%) |
Housing Structures by Number of Rooms in Parker Strip
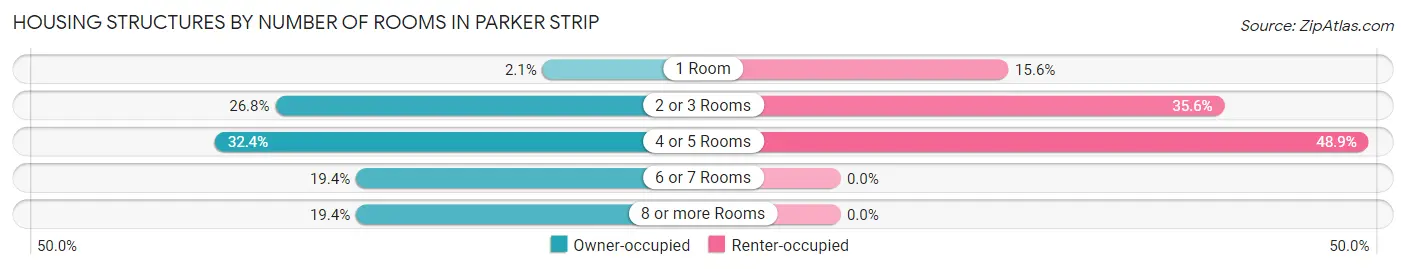
| Number of Rooms | Owner-occupied | Renter-occupied |
| 1 Room | 9 (2.1%) | 7 (15.6%) |
| 2 or 3 Rooms | 115 (26.8%) | 16 (35.6%) |
| 4 or 5 Rooms | 139 (32.4%) | 22 (48.9%) |
| 6 or 7 Rooms | 83 (19.4%) | 0 (0.0%) |
| 8 or more Rooms | 83 (19.4%) | 0 (0.0%) |
| Total | 429 (100.0%) | 45 (100.0%) |
Housing Structure by Heating Type in Parker Strip
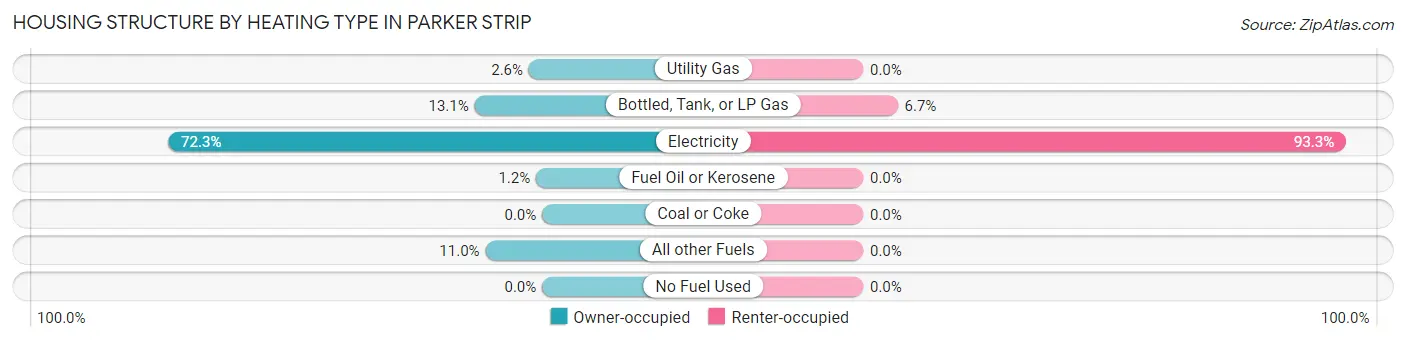
| Heating Type | Owner-occupied | Renter-occupied |
| Utility Gas | 11 (2.6%) | 0 (0.0%) |
| Bottled, Tank, or LP Gas | 56 (13.1%) | 3 (6.7%) |
| Electricity | 310 (72.3%) | 42 (93.3%) |
| Fuel Oil or Kerosene | 5 (1.2%) | 0 (0.0%) |
| Coal or Coke | 0 (0.0%) | 0 (0.0%) |
| All other Fuels | 47 (11.0%) | 0 (0.0%) |
| No Fuel Used | 0 (0.0%) | 0 (0.0%) |
| Total | 429 (100.0%) | 45 (100.0%) |
Household Vehicle Usage in Parker Strip
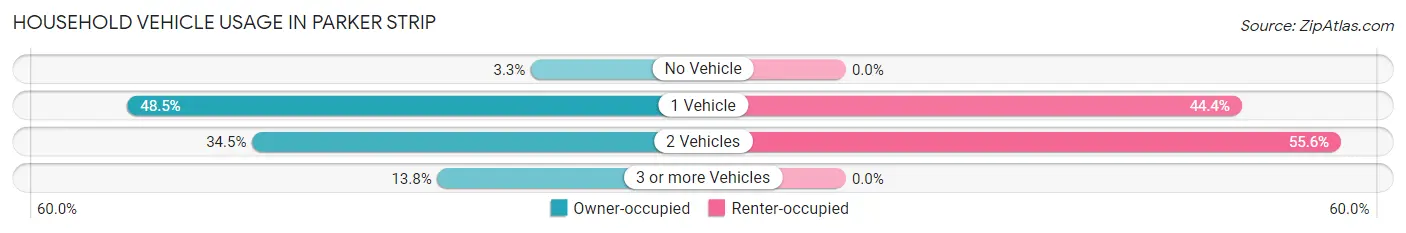
| Vehicles per Household | Owner-occupied | Renter-occupied |
| No Vehicle | 14 (3.3%) | 0 (0.0%) |
| 1 Vehicle | 208 (48.5%) | 20 (44.4%) |
| 2 Vehicles | 148 (34.5%) | 25 (55.6%) |
| 3 or more Vehicles | 59 (13.8%) | 0 (0.0%) |
| Total | 429 (100.0%) | 45 (100.0%) |
Real Estate & Mortgages in Parker Strip
Real Estate and Mortgage Overview in Parker Strip
| Characteristic | Without Mortgage | With Mortgage |
| Housing Units | 349 | 80 |
| Median Property Value | $170,100 | $468,400 |
| Median Household Income | $47,404 | $28 |
| Monthly Housing Costs | $339 | $31 |
| Real Estate Taxes | $559 | $0 |
Property Value by Mortgage Status in Parker Strip
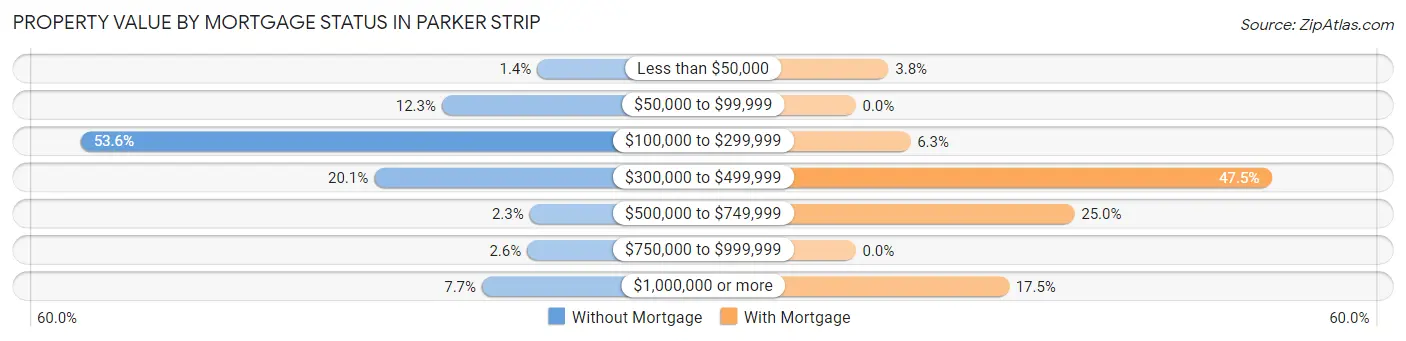
| Property Value | Without Mortgage | With Mortgage |
| Less than $50,000 | 5 (1.4%) | 3 (3.7%) |
| $50,000 to $99,999 | 43 (12.3%) | 0 (0.0%) |
| $100,000 to $299,999 | 187 (53.6%) | 5 (6.2%) |
| $300,000 to $499,999 | 70 (20.1%) | 38 (47.5%) |
| $500,000 to $749,999 | 8 (2.3%) | 20 (25.0%) |
| $750,000 to $999,999 | 9 (2.6%) | 0 (0.0%) |
| $1,000,000 or more | 27 (7.7%) | 14 (17.5%) |
| Total | 349 (100.0%) | 80 (100.0%) |
Household Income by Mortgage Status in Parker Strip
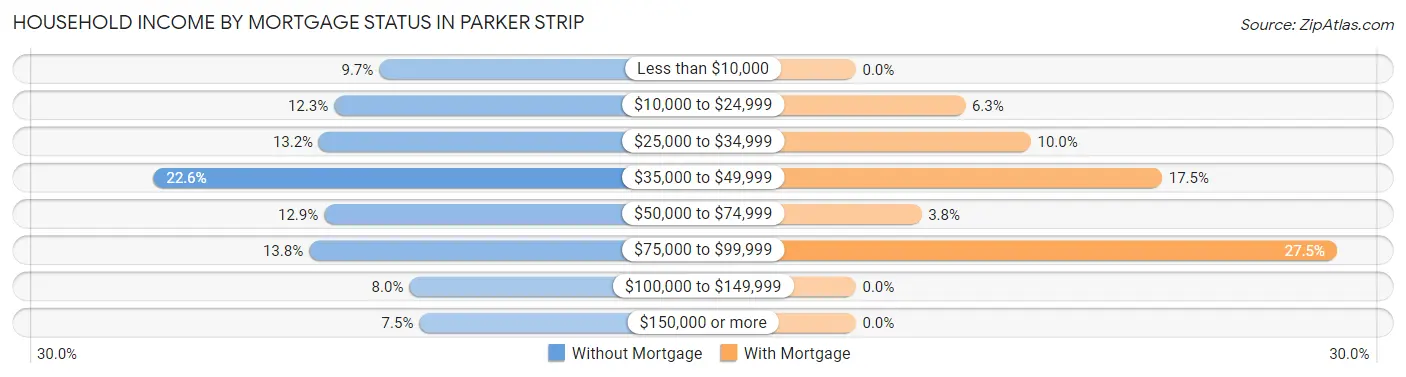
| Household Income | Without Mortgage | With Mortgage |
| Less than $10,000 | 34 (9.7%) | 0 (0.0%) |
| $10,000 to $24,999 | 43 (12.3%) | 5 (6.2%) |
| $25,000 to $34,999 | 46 (13.2%) | 8 (10.0%) |
| $35,000 to $49,999 | 79 (22.6%) | 14 (17.5%) |
| $50,000 to $74,999 | 45 (12.9%) | 3 (3.7%) |
| $75,000 to $99,999 | 48 (13.8%) | 22 (27.5%) |
| $100,000 to $149,999 | 28 (8.0%) | 0 (0.0%) |
| $150,000 or more | 26 (7.4%) | 0 (0.0%) |
| Total | 349 (100.0%) | 80 (100.0%) |
Property Value to Household Income Ratio in Parker Strip
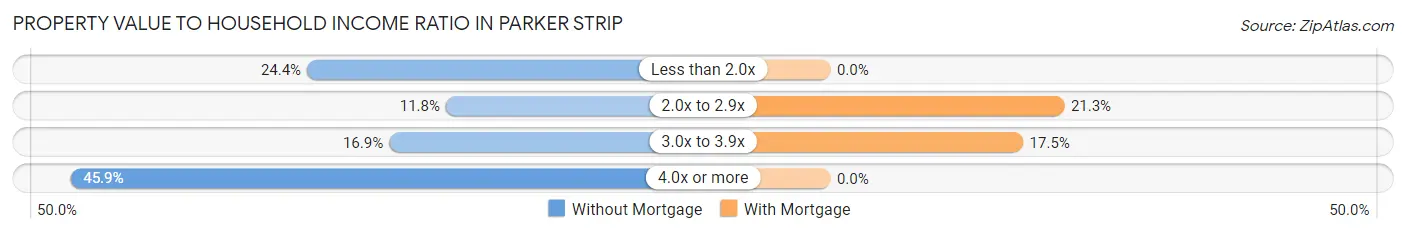
| Value-to-Income Ratio | Without Mortgage | With Mortgage |
| Less than 2.0x | 85 (24.4%) | 0 (0.0%) |
| 2.0x to 2.9x | 41 (11.7%) | 17 (21.2%) |
| 3.0x to 3.9x | 59 (16.9%) | 14 (17.5%) |
| 4.0x or more | 160 (45.9%) | 0 (0.0%) |
| Total | 349 (100.0%) | 80 (100.0%) |
Real Estate Taxes by Mortgage Status in Parker Strip
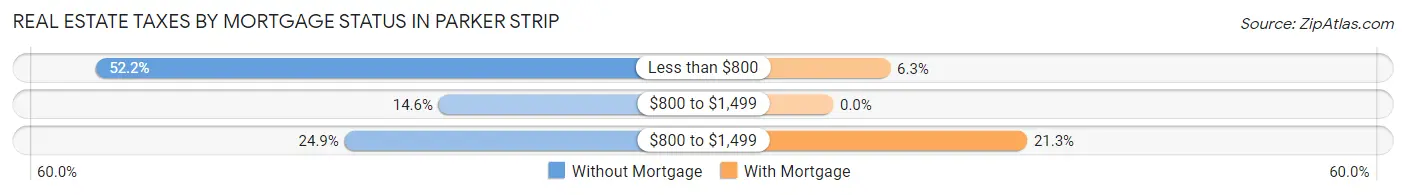
| Property Taxes | Without Mortgage | With Mortgage |
| Less than $800 | 182 (52.1%) | 5 (6.2%) |
| $800 to $1,499 | 51 (14.6%) | 0 (0.0%) |
| $800 to $1,499 | 87 (24.9%) | 17 (21.2%) |
| Total | 349 (100.0%) | 80 (100.0%) |
Health & Disability in Parker Strip
Health Insurance Coverage by Age in Parker Strip
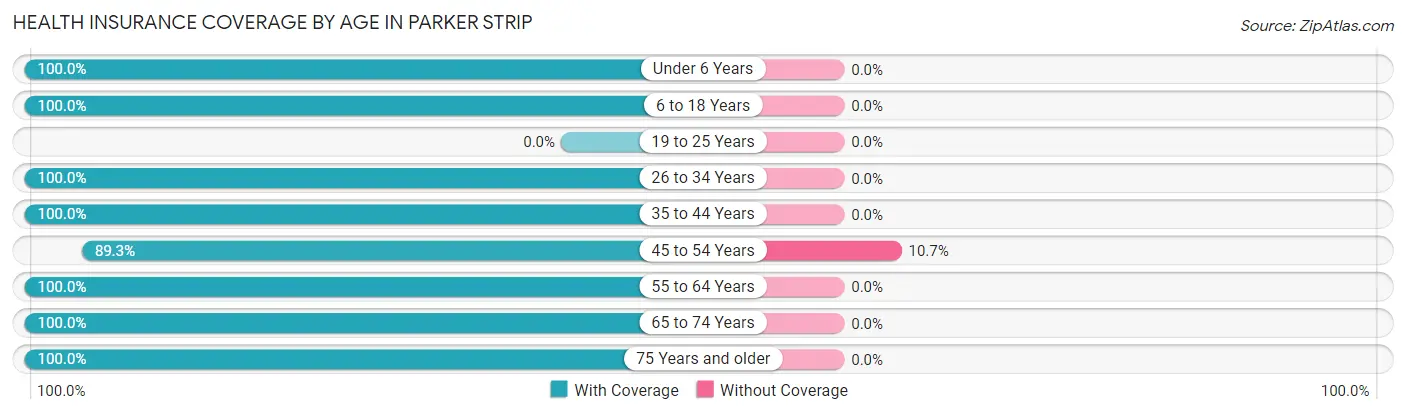
| Age Bracket | With Coverage | Without Coverage |
| Under 6 Years | 23 (100.0%) | 0 (0.0%) |
| 6 to 18 Years | 40 (100.0%) | 0 (0.0%) |
| 19 to 25 Years | 0 (0.0%) | 0 (0.0%) |
| 26 to 34 Years | 23 (100.0%) | 0 (0.0%) |
| 35 to 44 Years | 10 (100.0%) | 0 (0.0%) |
| 45 to 54 Years | 67 (89.3%) | 8 (10.7%) |
| 55 to 64 Years | 142 (100.0%) | 0 (0.0%) |
| 65 to 74 Years | 188 (100.0%) | 0 (0.0%) |
| 75 Years and older | 313 (100.0%) | 0 (0.0%) |
| Total | 806 (99.0%) | 8 (1.0%) |
Health Insurance Coverage by Citizenship Status in Parker Strip
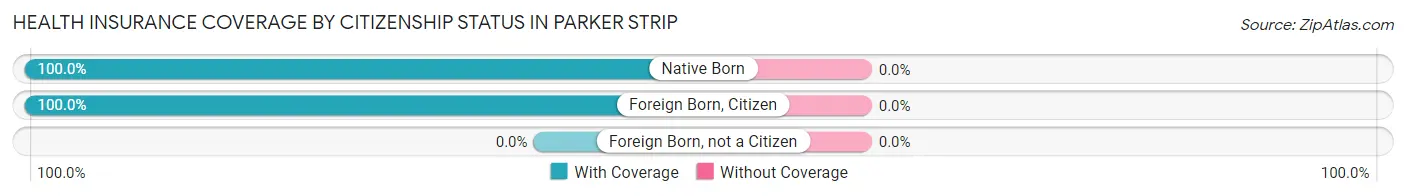
| Citizenship Status | With Coverage | Without Coverage |
| Native Born | 23 (100.0%) | 0 (0.0%) |
| Foreign Born, Citizen | 40 (100.0%) | 0 (0.0%) |
| Foreign Born, not a Citizen | 0 (0.0%) | 0 (0.0%) |
Health Insurance Coverage by Household Income in Parker Strip
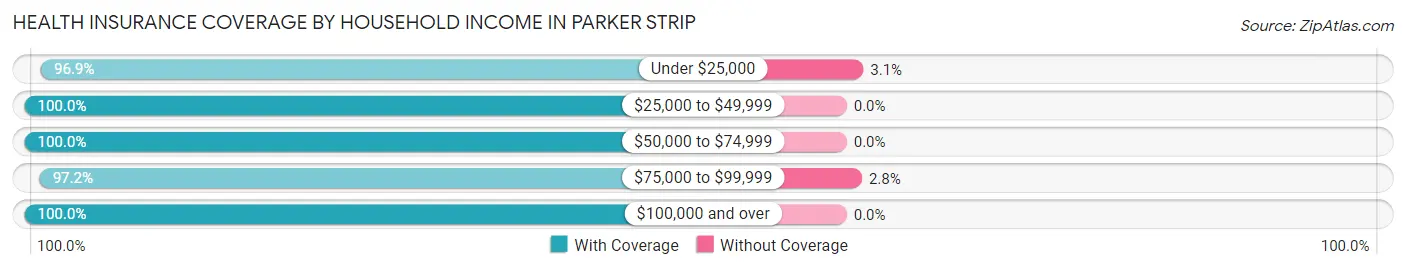
| Household Income | With Coverage | Without Coverage |
| Under $25,000 | 125 (96.9%) | 4 (3.1%) |
| $25,000 to $49,999 | 272 (100.0%) | 0 (0.0%) |
| $50,000 to $74,999 | 119 (100.0%) | 0 (0.0%) |
| $75,000 to $99,999 | 137 (97.2%) | 4 (2.8%) |
| $100,000 and over | 153 (100.0%) | 0 (0.0%) |
Public vs Private Health Insurance Coverage by Age in Parker Strip
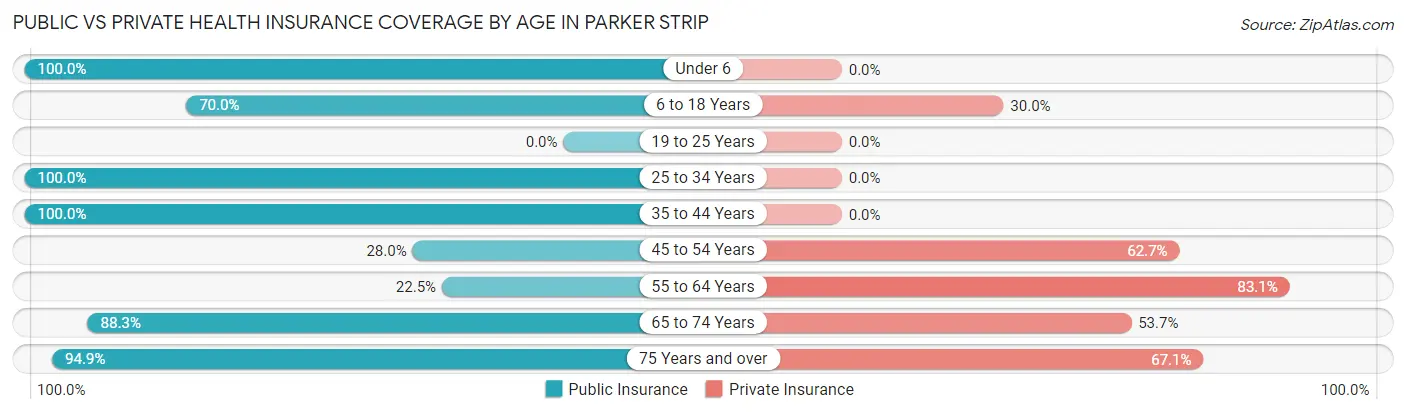
| Age Bracket | Public Insurance | Private Insurance |
| Under 6 | 23 (100.0%) | 0 (0.0%) |
| 6 to 18 Years | 28 (70.0%) | 12 (30.0%) |
| 19 to 25 Years | 0 (0.0%) | 0 (0.0%) |
| 25 to 34 Years | 23 (100.0%) | 0 (0.0%) |
| 35 to 44 Years | 10 (100.0%) | 0 (0.0%) |
| 45 to 54 Years | 21 (28.0%) | 47 (62.7%) |
| 55 to 64 Years | 32 (22.5%) | 118 (83.1%) |
| 65 to 74 Years | 166 (88.3%) | 101 (53.7%) |
| 75 Years and over | 297 (94.9%) | 210 (67.1%) |
| Total | 600 (73.7%) | 488 (60.0%) |
Disability Status by Sex by Age in Parker Strip
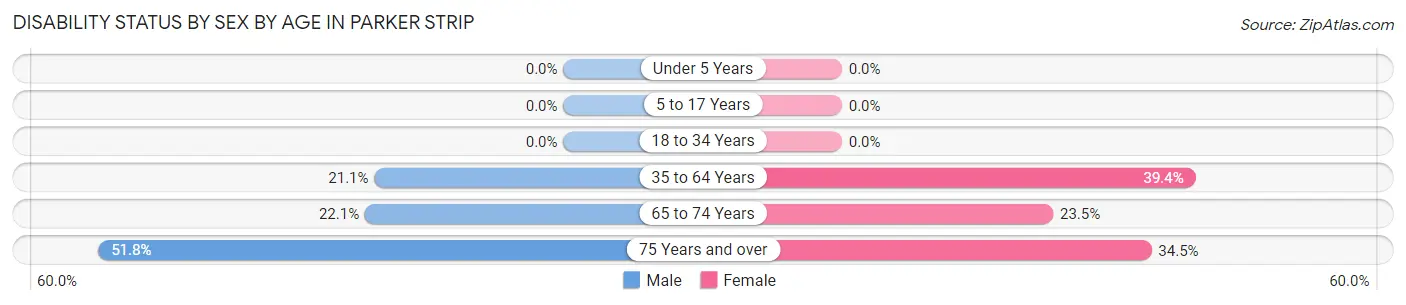
| Age Bracket | Male | Female |
| Under 5 Years | 0 (0.0%) | 0 (0.0%) |
| 5 to 17 Years | 0 (0.0%) | 0 (0.0%) |
| 18 to 34 Years | 0 (0.0%) | 0 (0.0%) |
| 35 to 64 Years | 20 (21.0%) | 52 (39.4%) |
| 65 to 74 Years | 19 (22.1%) | 24 (23.5%) |
| 75 Years and over | 72 (51.8%) | 60 (34.5%) |
Disability Class by Sex by Age in Parker Strip
Disability Class: Hearing Difficulty
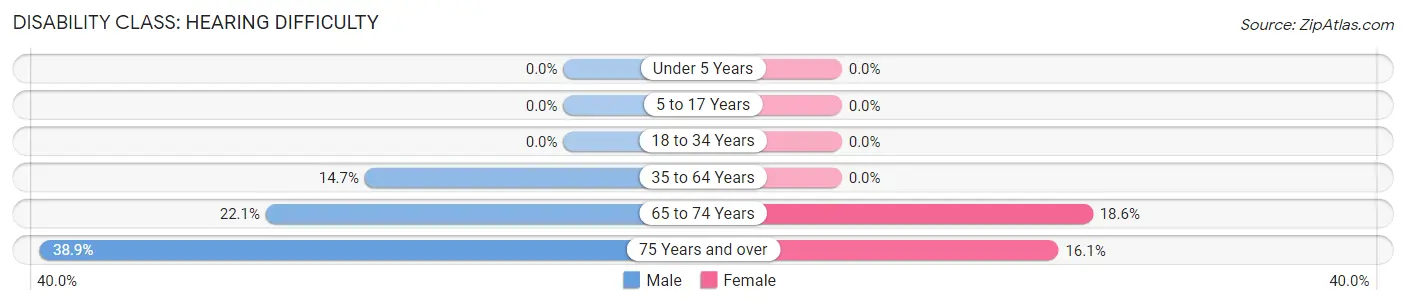
| Age Bracket | Male | Female |
| Under 5 Years | 0 (0.0%) | 0 (0.0%) |
| 5 to 17 Years | 0 (0.0%) | 0 (0.0%) |
| 18 to 34 Years | 0 (0.0%) | 0 (0.0%) |
| 35 to 64 Years | 14 (14.7%) | 0 (0.0%) |
| 65 to 74 Years | 19 (22.1%) | 19 (18.6%) |
| 75 Years and over | 54 (38.9%) | 28 (16.1%) |
Disability Class: Vision Difficulty
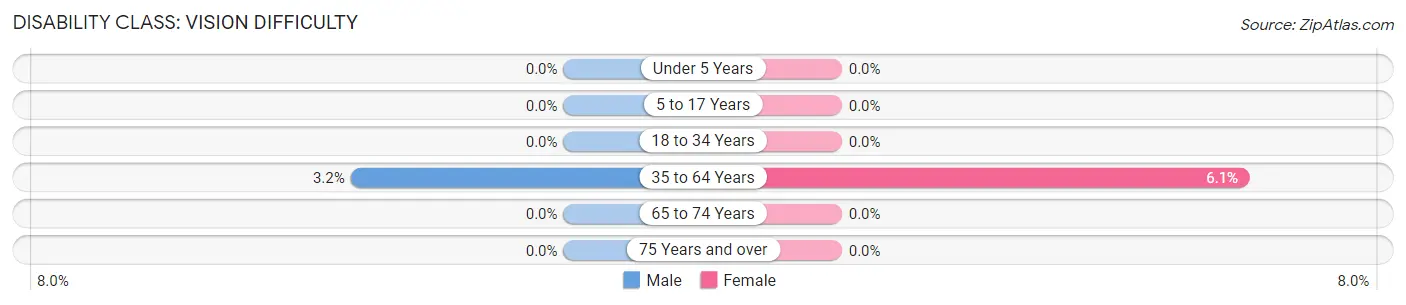
| Age Bracket | Male | Female |
| Under 5 Years | 0 (0.0%) | 0 (0.0%) |
| 5 to 17 Years | 0 (0.0%) | 0 (0.0%) |
| 18 to 34 Years | 0 (0.0%) | 0 (0.0%) |
| 35 to 64 Years | 3 (3.2%) | 8 (6.1%) |
| 65 to 74 Years | 0 (0.0%) | 0 (0.0%) |
| 75 Years and over | 0 (0.0%) | 0 (0.0%) |
Disability Class: Cognitive Difficulty
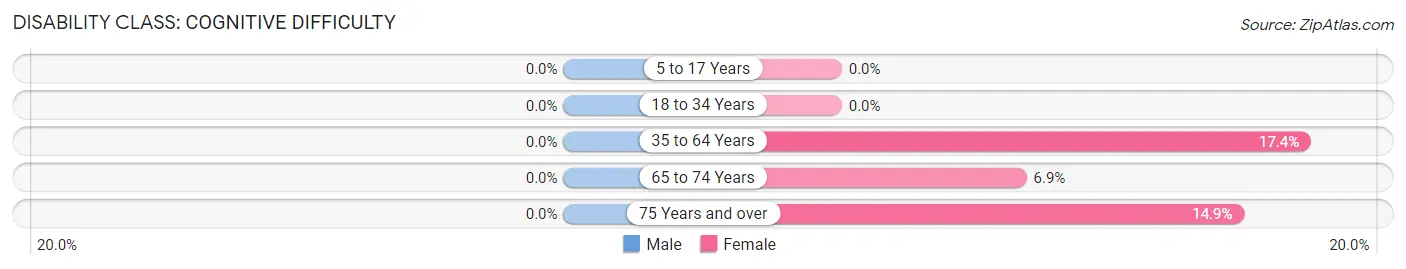
| Age Bracket | Male | Female |
| 5 to 17 Years | 0 (0.0%) | 0 (0.0%) |
| 18 to 34 Years | 0 (0.0%) | 0 (0.0%) |
| 35 to 64 Years | 0 (0.0%) | 23 (17.4%) |
| 65 to 74 Years | 0 (0.0%) | 7 (6.9%) |
| 75 Years and over | 0 (0.0%) | 26 (14.9%) |
Disability Class: Ambulatory Difficulty
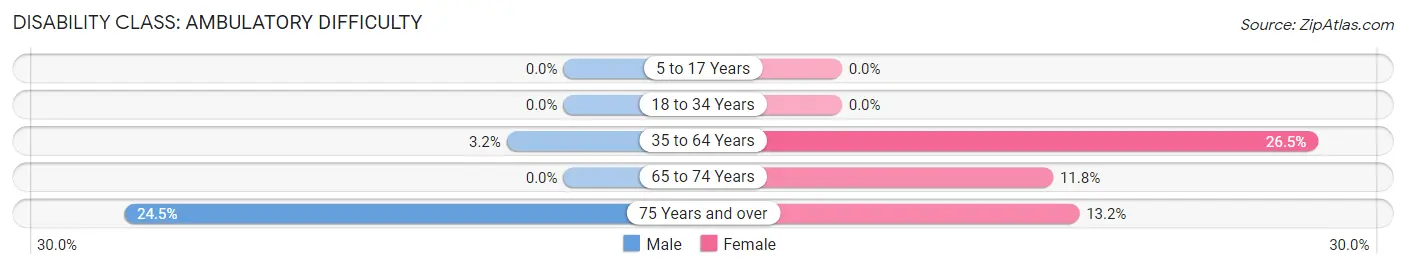
| Age Bracket | Male | Female |
| 5 to 17 Years | 0 (0.0%) | 0 (0.0%) |
| 18 to 34 Years | 0 (0.0%) | 0 (0.0%) |
| 35 to 64 Years | 3 (3.2%) | 35 (26.5%) |
| 65 to 74 Years | 0 (0.0%) | 12 (11.8%) |
| 75 Years and over | 34 (24.5%) | 23 (13.2%) |
Disability Class: Self-Care Difficulty
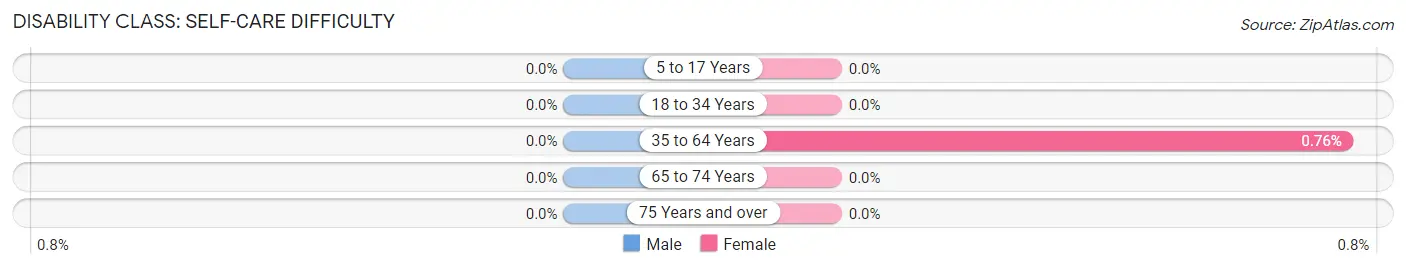
| Age Bracket | Male | Female |
| 5 to 17 Years | 0 (0.0%) | 0 (0.0%) |
| 18 to 34 Years | 0 (0.0%) | 0 (0.0%) |
| 35 to 64 Years | 0 (0.0%) | 1 (0.8%) |
| 65 to 74 Years | 0 (0.0%) | 0 (0.0%) |
| 75 Years and over | 0 (0.0%) | 0 (0.0%) |
Technology Access in Parker Strip
Computing Device Access in Parker Strip
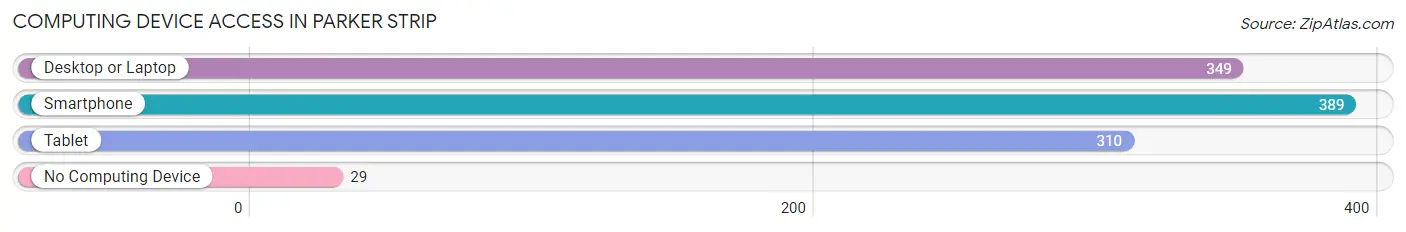
| Device Type | # Households | % Households |
| Desktop or Laptop | 349 | 73.6% |
| Smartphone | 389 | 82.1% |
| Tablet | 310 | 65.4% |
| No Computing Device | 29 | 6.1% |
| Total | 474 | 100.0% |
Internet Access in Parker Strip
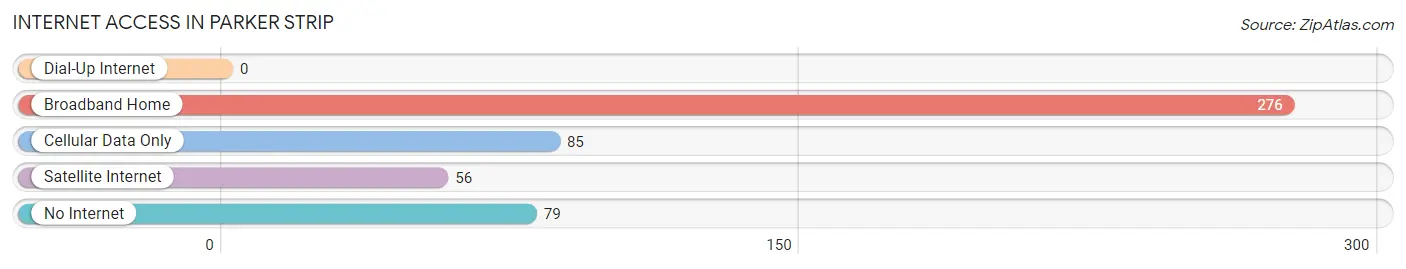
| Internet Type | # Households | % Households |
| Dial-Up Internet | 0 | 0.0% |
| Broadband Home | 276 | 58.2% |
| Cellular Data Only | 85 | 17.9% |
| Satellite Internet | 56 | 11.8% |
| No Internet | 79 | 16.7% |
| Total | 474 | 100.0% |
Parker Strip Summary
Parker Strip is a region located in La Paz County, Arizona, United States. It is situated along the Colorado River, which forms the border between Arizona and California. The region is known for its stunning scenery, recreational activities, and its unique history.
Geography
Parker Strip is located in the southwestern corner of La Paz County, Arizona, and is bordered by the Colorado River to the west and the Arizona-California border to the south. The region is approximately 25 miles long and 5 miles wide, and is composed of a variety of terrain, including desert, mountains, and canyons. The highest point in the region is the Parker Dam, which stands at an elevation of 1,400 feet. The region is also home to several lakes, including Lake Havasu, Lake Mohave, and Lake Havasu City.
History
The Parker Strip has a long and varied history. The area was first inhabited by the Mojave and Chemehuevi Native American tribes, who lived in the region for centuries before the arrival of European settlers. The first Europeans to explore the area were Spanish explorers, who arrived in the late 1700s. In the early 1800s, the area was part of Mexico, and was later ceded to the United States in 1848.
In the late 1800s, the area was settled by ranchers and miners, who established several small towns in the region. The area was also home to several military outposts, including Fort Mohave and Fort Yuma. In the early 1900s, the area was developed for agriculture, and the Parker Dam was built in 1938 to provide irrigation water for the region.
Economy
The economy of the Parker Strip is largely based on tourism and recreation. The region is home to several popular tourist attractions, including Lake Havasu, Lake Mohave, and Lake Havasu City. The area is also home to several resorts, campgrounds, and marinas, which attract visitors from all over the world.
In addition to tourism, the region is also home to several industries, including mining, agriculture, and manufacturing. The region is also home to several military bases, which provide jobs for local residents.
Demographics
As of the 2010 census, the population of the Parker Strip was 8,845. The population is largely composed of white (77.3%) and Hispanic (17.2%) residents. The median household income in the region is $45,845, and the median age is 44.7 years.
Conclusion
Parker Strip is a region located in La Paz County, Arizona, United States. It is situated along the Colorado River, which forms the border between Arizona and California. The region is known for its stunning scenery, recreational activities, and its unique history. The economy of the region is largely based on tourism and recreation, and the population is largely composed of white and Hispanic residents.
Common Questions
What is the Total Population of Parker Strip?
Total Population of Parker Strip is 814.
What is the Total Male Population of Parker Strip?
Total Male Population of Parker Strip is 360.
What is the Total Female Population of Parker Strip?
Total Female Population of Parker Strip is 454.
What is the Ratio of Males per 100 Females in Parker Strip?
There are 79.30 Males per 100 Females in Parker Strip.
What is the Ratio of Females per 100 Males in Parker Strip?
There are 126.11 Females per 100 Males in Parker Strip.
What is the Median Population Age in Parker Strip?
Median Population Age in Parker Strip is 72.1 Years.
What is the Average Family Size in Parker Strip
Average Family Size in Parker Strip is 2.1 People.
What is the Average Household Size in Parker Strip
Average Household Size in Parker Strip is 1.7 People.
What is Per Capita Income in Parker Strip?
Per Capita income in Parker Strip is $52,814.
What is the Median Family Income in Parker Strip?
Median Family Income in Parker Strip is $58,393.
What is the Median Household income in Parker Strip?
Median Household Income in Parker Strip is $48,333.
What is Family Income Deficit in Parker Strip?
Family Income Deficit in Parker Strip is $6,823.
Families that are below poverty line in Parker Strip earn $6,823 less on average than the poverty threshold level.
What is Inequality or Gini Index in Parker Strip?
Inequality or Gini Index in Parker Strip is 0.58.
How Large is the Labor Force in Parker Strip?
There are 213 People in the Labor Forcein in Parker Strip.
What is the Percentage of People in the Labor Force in Parker Strip?
28.2% of People are in the Labor Force in Parker Strip.
What is the Unemployment Rate in Parker Strip?
Unemployment Rate in Parker Strip is 12.2%.