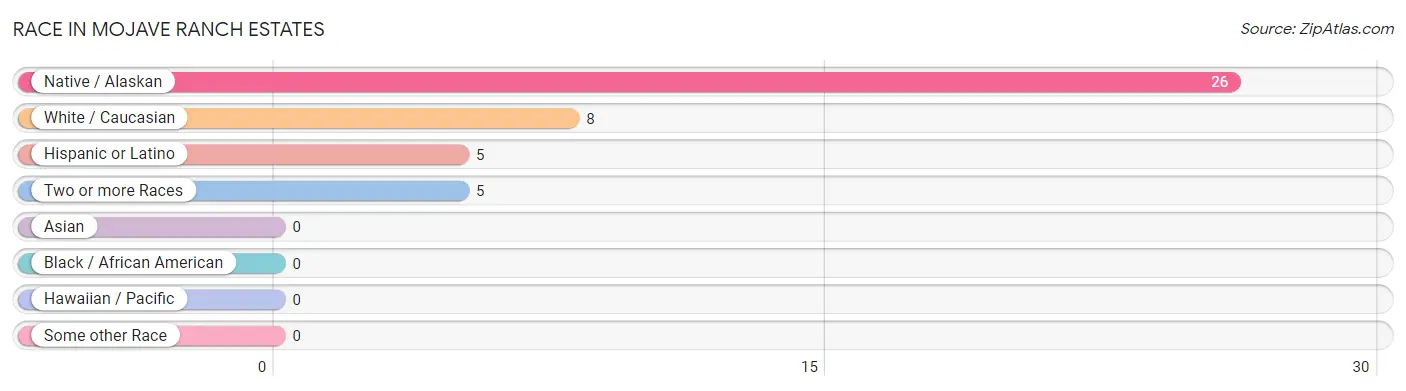
The most populous races in Mojave Ranch Estates are Native / Alaskan (26 | 66.7%), White / Caucasian (8 | 20.5%), and Hispanic or Latino (5 | 12.8%).
Race
# Population
% Population
Asian
0
0.0%
Black / African American
0
0.0%
Hawaiian / Pacific
0
0.0%
Hispanic or Latino
5
12.8%
Native / Alaskan
26
66.7%
White / Caucasian
8
20.5%
Two or more Races
5
12.8%
Some other Race
0
0.0%
Total
39
100.0%
Ancestry in Mojave Ranch Estates
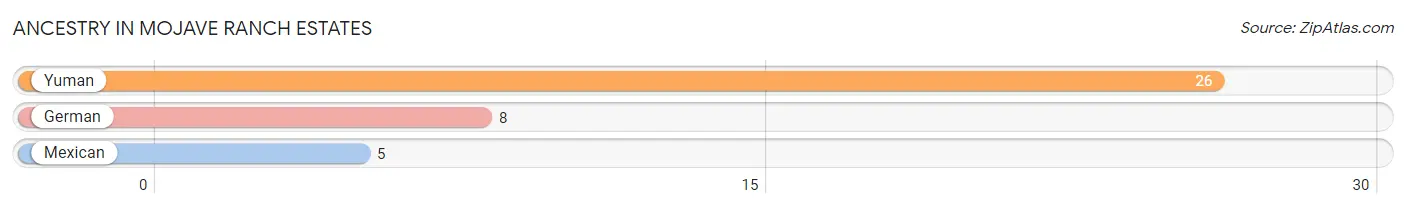
The most populous ancestries reported in Mojave Ranch Estates are Yuman (26 | 66.7%), German (8 | 20.5%), and Mexican (5 | 12.8%), together accounting for 100.0% of all Mojave Ranch Estates residents.
Ancestry
# Population
% Population
German
8
20.5%
Mexican
5
12.8%
Yuman
26
66.7%
View All 3 Rows
Immigrants in Mojave Ranch Estates
Immigration Origin
# Population
% Population
View All 0 Rows
Sex and Age in Mojave Ranch Estates
Sex and Age in Mojave Ranch Estates
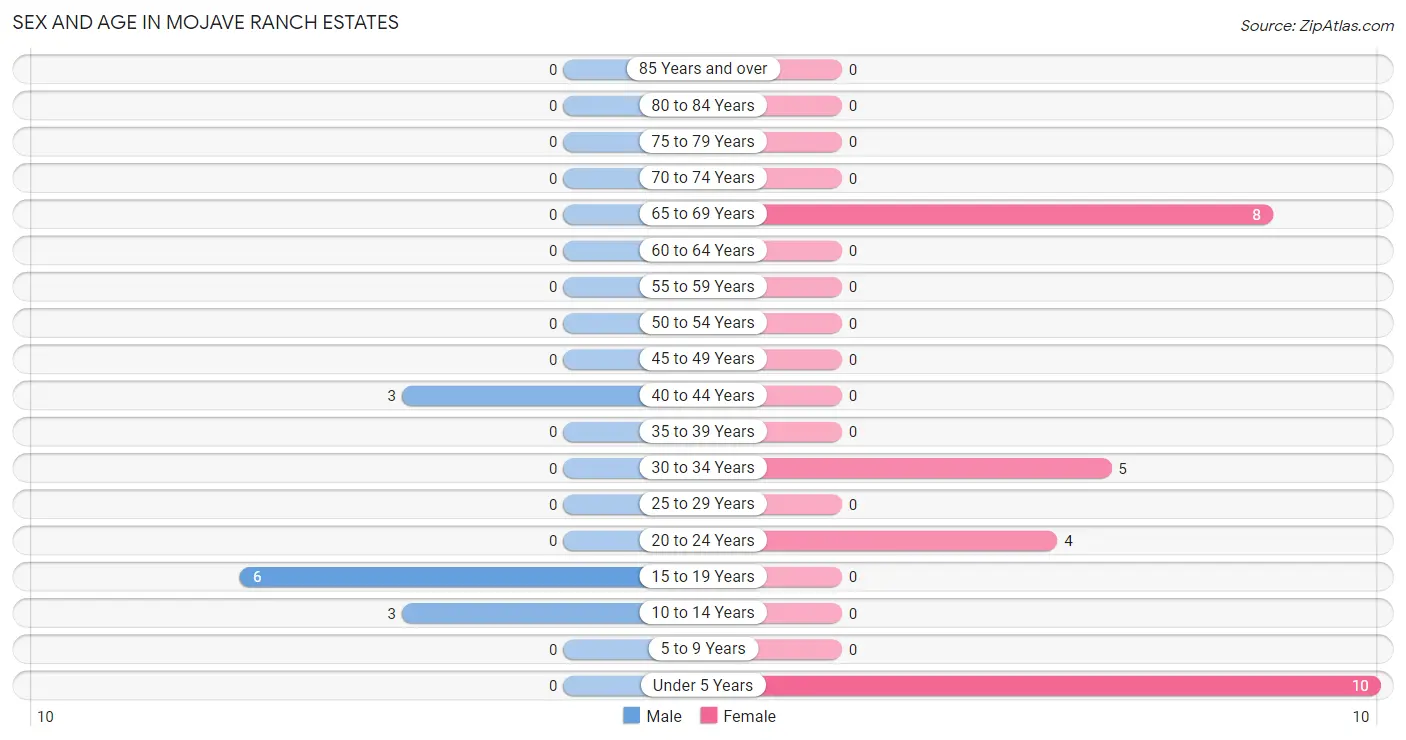
The most populous age groups in Mojave Ranch Estates are 15 to 19 Years (6 | 50.0%) for men and Under 5 Years (10 | 37.0%) for women.
Age Bracket
Male
Female
Under 5 Years
0 (0.0%)
10 (37.0%)
5 to 9 Years
0 (0.0%)
0 (0.0%)
10 to 14 Years
3 (25.0%)
0 (0.0%)
15 to 19 Years
6 (50.0%)
0 (0.0%)
20 to 24 Years
0 (0.0%)
4 (14.8%)
25 to 29 Years
0 (0.0%)
0 (0.0%)
30 to 34 Years
0 (0.0%)
5 (18.5%)
35 to 39 Years
0 (0.0%)
0 (0.0%)
40 to 44 Years
3 (25.0%)
0 (0.0%)
45 to 49 Years
0 (0.0%)
0 (0.0%)
50 to 54 Years
0 (0.0%)
0 (0.0%)
55 to 59 Years
0 (0.0%)
0 (0.0%)
60 to 64 Years
0 (0.0%)
0 (0.0%)
65 to 69 Years
0 (0.0%)
8 (29.6%)
70 to 74 Years
0 (0.0%)
0 (0.0%)
75 to 79 Years
0 (0.0%)
0 (0.0%)
80 to 84 Years
0 (0.0%)
0 (0.0%)
85 Years and over
0 (0.0%)
0 (0.0%)
Total
12 (100.0%)
27 (100.0%)
Families and Households in Mojave Ranch Estates
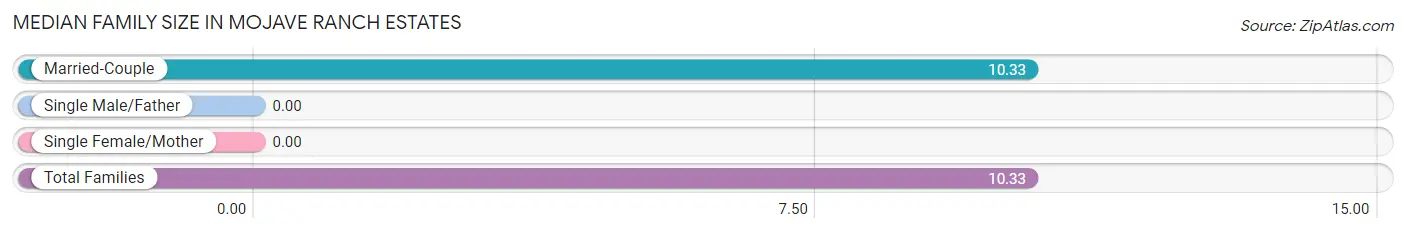
Median Family Size in Mojave Ranch Estates
Family Type
# Families
Family Size
Married-Couple
3 (100.0%)
10.33
Single Male/Father
0 (0.0%)
-
Single Female/Mother
0 (0.0%)
-
Total Families
3 (100.0%)
10.33
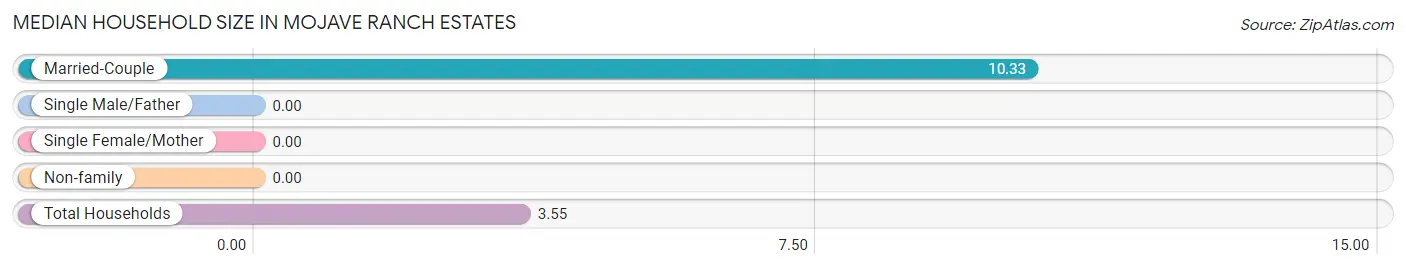
Median Household Size in Mojave Ranch Estates
Household Type
# Households
Household Size
Married-Couple
3 (27.3%)
10.33
Single Male/Father
0 (0.0%)
-
Single Female/Mother
0 (0.0%)
-
Non-family
8 (72.7%)
-
Total Households
11 (100.0%)
3.55
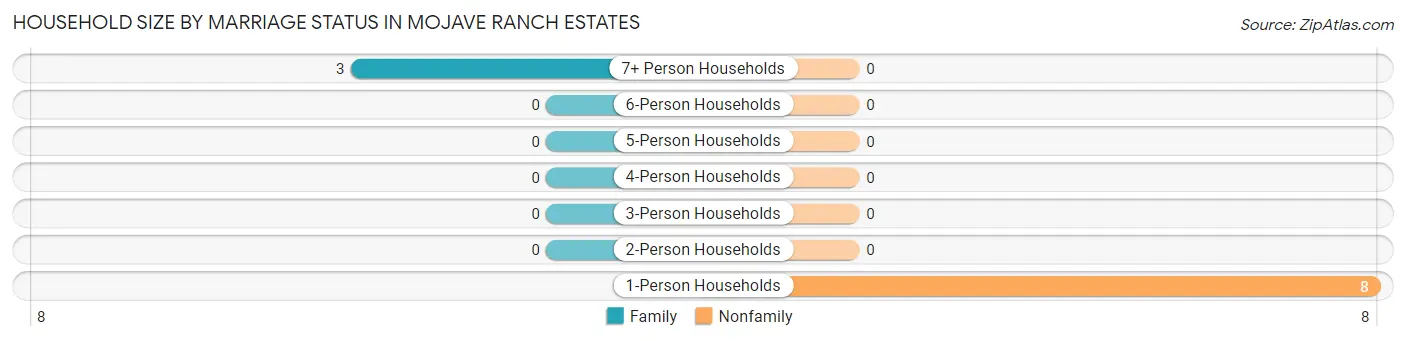
Household Size by Marriage Status in Mojave Ranch Estates
Out of a total of 11 households in Mojave Ranch Estates, 3 (27.3%) are family households, while 8 (72.7%) are nonfamily households. The most numerous type of family households are 7+ person households, comprising 3, and the most common type of nonfamily households are 1-person households, comprising 8.
Household Size
Family Households
Nonfamily Households
1-Person Households
-
8 (72.7%)
2-Person Households
0 (0.0%)
0 (0.0%)
3-Person Households
0 (0.0%)
0 (0.0%)
4-Person Households
0 (0.0%)
0 (0.0%)
5-Person Households
0 (0.0%)
0 (0.0%)
6-Person Households
0 (0.0%)
0 (0.0%)
7+ Person Households
3 (27.3%)
0 (0.0%)
Total
3 (27.3%)
8 (72.7%)
Female Fertility in Mojave Ranch Estates
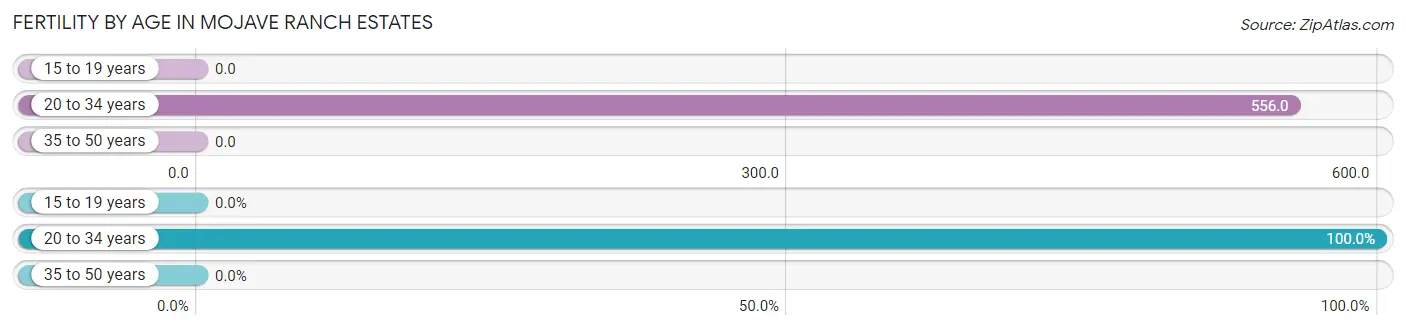
Fertility by Age in Mojave Ranch Estates
Average fertility rate in Mojave Ranch Estates is 556.0 births per 1,000 women. Women in the age bracket of 20 to 34 years have the highest fertility rate with 556.0 births per 1,000 women. Women in the age bracket of 20 to 34 years acount for 100.0% of all women with births.
Age Bracket
Women with Births
Births / 1,000 Women
15 to 19 years
0 (0.0%)
0.0
20 to 34 years
5 (100.0%)
556.0
35 to 50 years
0 (0.0%)
0.0
Total
5 (100.0%)
556.0
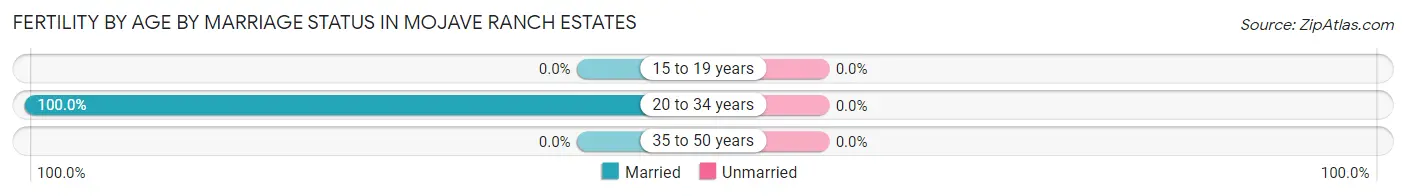
Fertility by Age by Marriage Status in Mojave Ranch Estates
Age Bracket
Married
Unmarried
15 to 19 years
0 (0.0%)
0 (0.0%)
20 to 34 years
5 (100.0%)
0 (0.0%)
35 to 50 years
0 (0.0%)
0 (0.0%)
Total
5 (100.0%)
0 (0.0%)
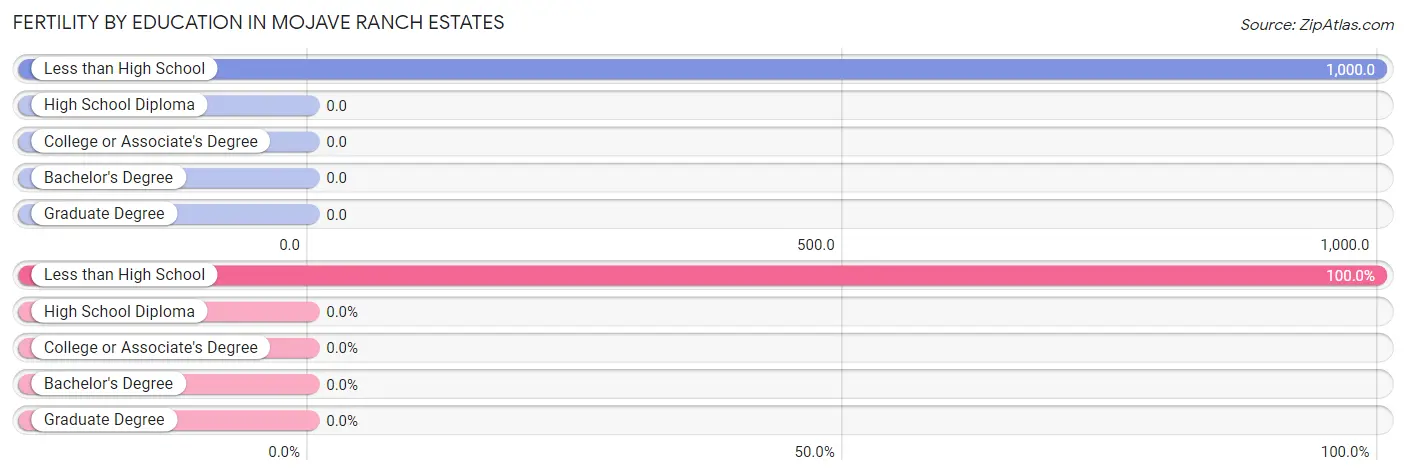
Fertility by Education in Mojave Ranch Estates
Educational Attainment
Women with Births
Births / 1,000 Women
Less than High School
5 (100.0%)
1,000.0
High School Diploma
0 (0.0%)
0.0
College or Associate's Degree
0 (0.0%)
0.0
Bachelor's Degree
0 (0.0%)
0.0
Graduate Degree
0 (0.0%)
0.0
Total
5 (100.0%)
556.0
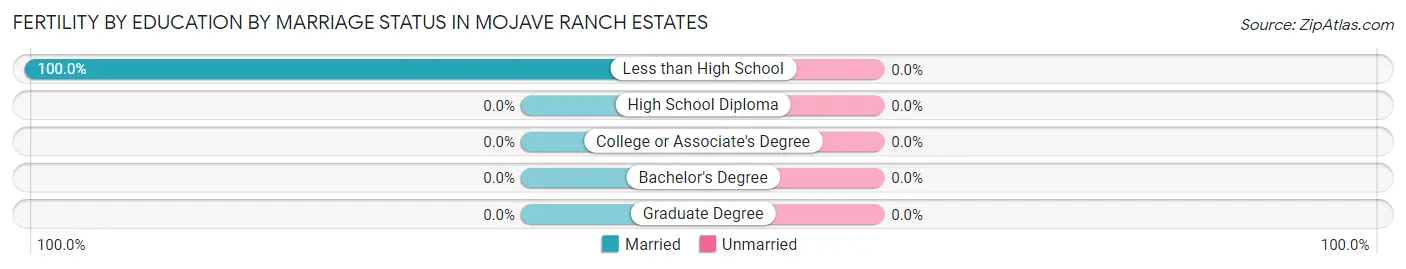
Fertility by Education by Marriage Status in Mojave Ranch Estates
Educational Attainment
Married
Unmarried
Less than High School
5 (100.0%)
0 (0.0%)
High School Diploma
0 (0.0%)
0 (0.0%)
College or Associate's Degree
0 (0.0%)
0 (0.0%)
Bachelor's Degree
0 (0.0%)
0 (0.0%)
Graduate Degree
0 (0.0%)
0 (0.0%)
Total
5 (100.0%)
0 (0.0%)
Income in Mojave Ranch Estates
Income Overview in Mojave Ranch Estates
Characteristic
Number
Measure
Per Capita Income
39
$0
Median Family Income
3
$0
Mean Family Income
3
$0
Median Household Income
11
$0
Mean Household Income
11
$0
Income Deficit
3
$0
Wage / Income Gap (%)
39
0.00%
Wage / Income Gap ($)
39
100.00¢ per $1
Gini / Inequality Index
39
0.34
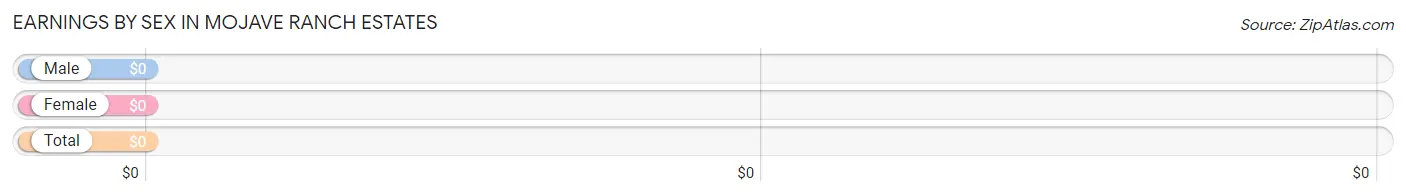
Earnings by Sex in Mojave Ranch Estates
Sex
Number
Average Earnings
Male
3 (100.0%)
$0
Female
0 (0.0%)
$0
Total
3 (100.0%)
$0
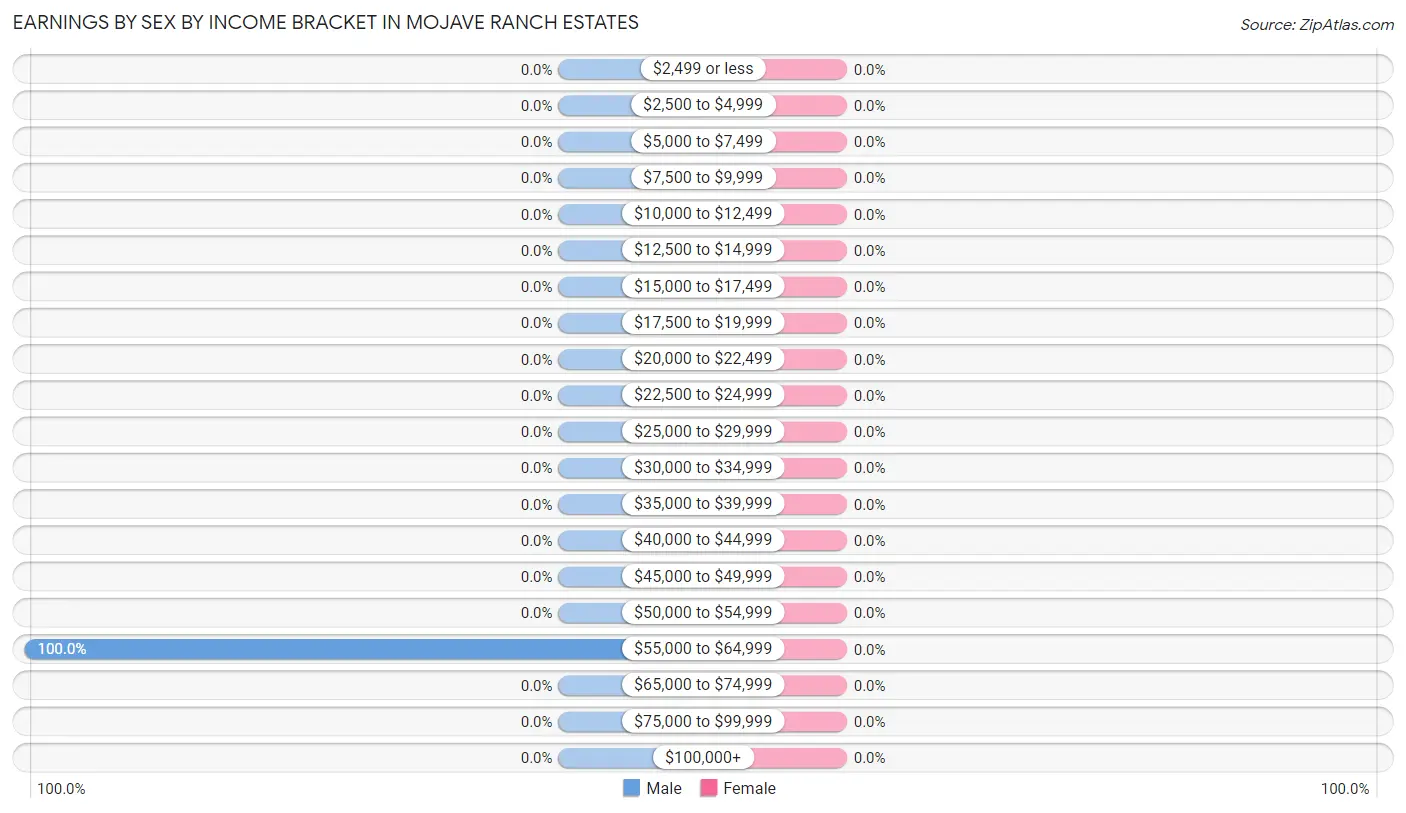
Earnings by Sex by Income Bracket in Mojave Ranch Estates
Income
Male
Female
$2,499 or less
0 (0.0%)
0 (0.0%)
$2,500 to $4,999
0 (0.0%)
0 (0.0%)
$5,000 to $7,499
0 (0.0%)
0 (0.0%)
$7,500 to $9,999
0 (0.0%)
0 (0.0%)
$10,000 to $12,499
0 (0.0%)
0 (0.0%)
$12,500 to $14,999
0 (0.0%)
0 (0.0%)
$15,000 to $17,499
0 (0.0%)
0 (0.0%)
$17,500 to $19,999
0 (0.0%)
0 (0.0%)
$20,000 to $22,499
0 (0.0%)
0 (0.0%)
$22,500 to $24,999
0 (0.0%)
0 (0.0%)
$25,000 to $29,999
0 (0.0%)
0 (0.0%)
$30,000 to $34,999
0 (0.0%)
0 (0.0%)
$35,000 to $39,999
0 (0.0%)
0 (0.0%)
$40,000 to $44,999
0 (0.0%)
0 (0.0%)
$45,000 to $49,999
0 (0.0%)
0 (0.0%)
$50,000 to $54,999
0 (0.0%)
0 (0.0%)
$55,000 to $64,999
3 (100.0%)
0 (0.0%)
$65,000 to $74,999
0 (0.0%)
0 (0.0%)
$75,000 to $99,999
0 (0.0%)
0 (0.0%)
$100,000+
0 (0.0%)
0 (0.0%)
Total
3 (100.0%)
0 (0.0%)
Earnings by Sex by Educational Attainment in Mojave Ranch Estates
Educational Attainment
Male Income
Female Income
Less than High School
-
-
High School Diploma
-
-
College or Associate's Degree
-
-
Bachelor's Degree
-
-
Graduate Degree
-
-
Total
-
-
Family Income in Mojave Ranch Estates
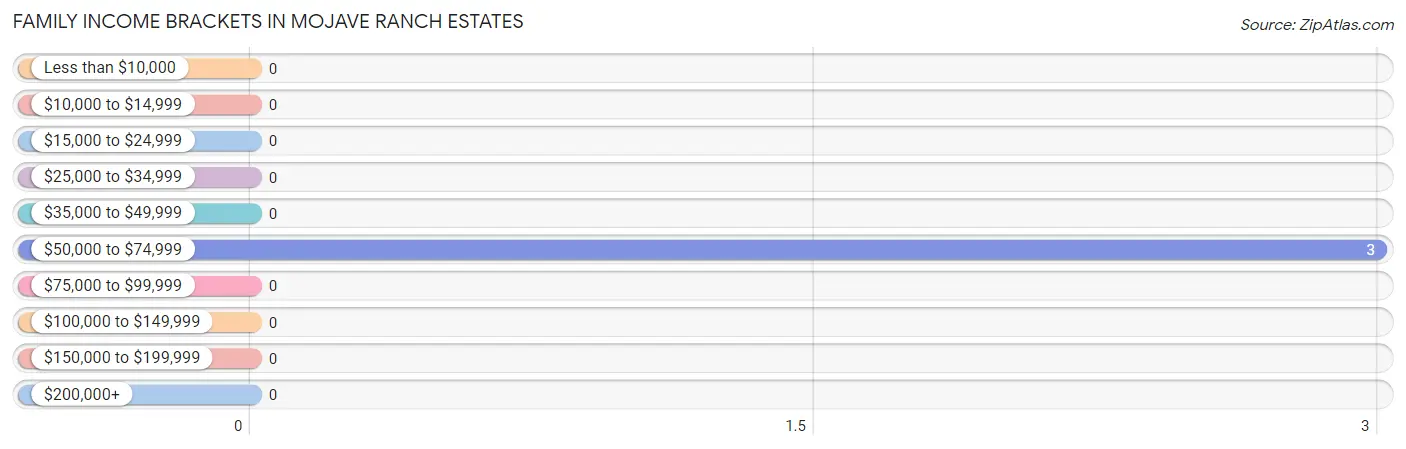
Family Income Brackets in Mojave Ranch Estates
According to the Mojave Ranch Estates family income data, there are 3 families falling into the $50,000 to $74,999 income range, which is the most common income bracket and makes up 100.0% of all families.
Income Bracket
# Families
% Families
Less than $10,000
0
0.0%
$10,000 to $14,999
0
0.0%
$15,000 to $24,999
0
0.0%
$25,000 to $34,999
0
0.0%
$35,000 to $49,999
0
0.0%
$50,000 to $74,999
3
100.0%
$75,000 to $99,999
0
0.0%
$100,000 to $149,999
0
0.0%
$150,000 to $199,999
0
0.0%
$200,000+
0
0.0%
Family Income by Famaliy Size in Mojave Ranch Estates
Income Bracket
# Families
Median Income
2-Person Families
0 (0.0%)
$0
3-Person Families
0 (0.0%)
$0
4-Person Families
0 (0.0%)
$0
5-Person Families
0 (0.0%)
$0
6-Person Families
0 (0.0%)
$0
7+ Person Families
3 (100.0%)
$0
Total
3 (100.0%)
$0
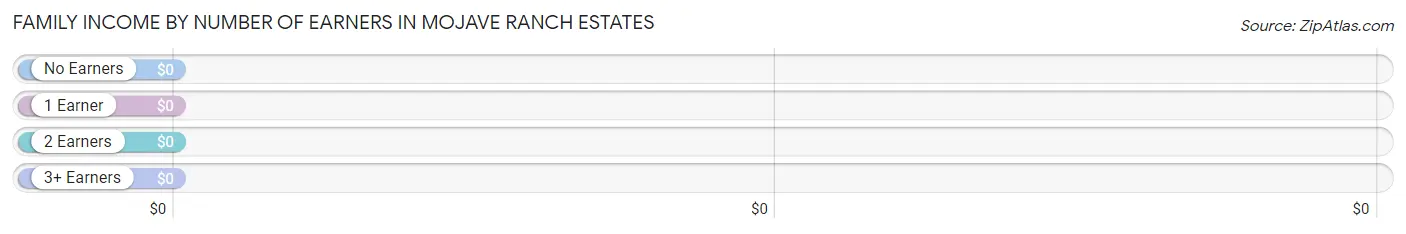
Family Income by Number of Earners in Mojave Ranch Estates
Number of Earners
# Families
Median Income
No Earners
0 (0.0%)
$0
1 Earner
3 (100.0%)
$0
2 Earners
0 (0.0%)
$0
3+ Earners
0 (0.0%)
$0
Total
3 (100.0%)
$0
Household Income in Mojave Ranch Estates
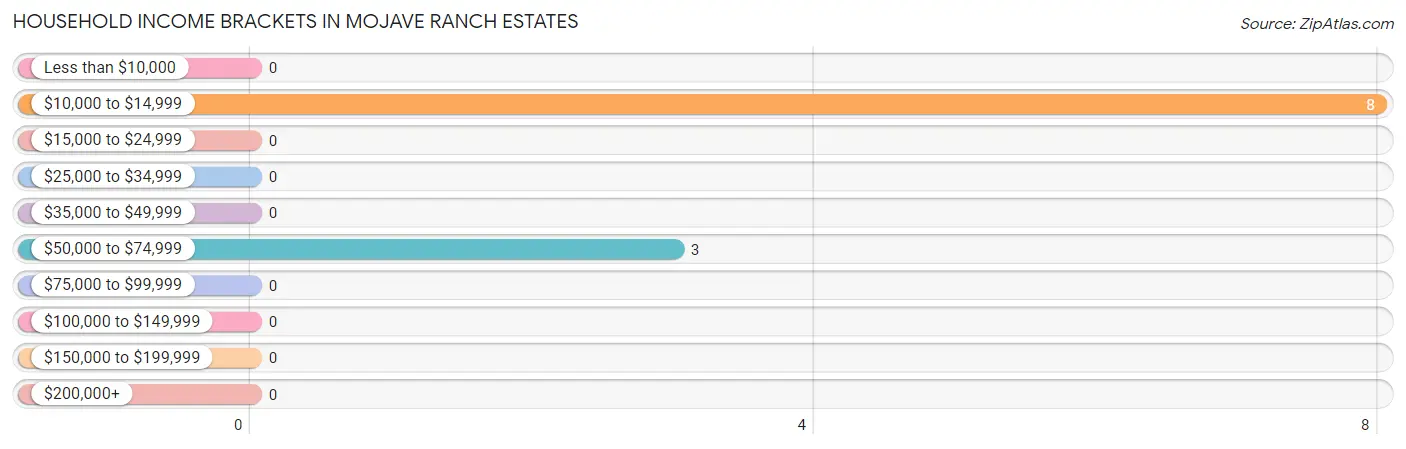
Household Income Brackets in Mojave Ranch Estates
With 8 households falling in the category, the $10,000 to $14,999 income range is the most frequent in Mojave Ranch Estates, accounting for 72.7% of all households.
Income Bracket
# Households
% Households
Less than $10,000
0
0.0%
$10,000 to $14,999
8
72.7%
$15,000 to $24,999
0
0.0%
$25,000 to $34,999
0
0.0%
$35,000 to $49,999
0
0.0%
$50,000 to $74,999
3
27.3%
$75,000 to $99,999
0
0.0%
$100,000 to $149,999
0
0.0%
$150,000 to $199,999
0
0.0%
$200,000+
0
0.0%
Household Income by Householder Age in Mojave Ranch Estates
Income Bracket
# Households
Median Income
15 to 24 Years
0 (0.0%)
$0
25 to 44 Years
3 (27.3%)
$0
45 to 64 Years
0 (0.0%)
$0
65+ Years
8 (72.7%)
$0
Total
11 (100.0%)
$0
Poverty in Mojave Ranch Estates
Income Below Poverty by Sex and Age in Mojave Ranch Estates
Age Bracket
Male
Female
Under 5 Years
0 (0.0%)
0 (0.0%)
5 Years
0 (0.0%)
0 (0.0%)
6 to 11 Years
0 (0.0%)
0 (0.0%)
12 to 14 Years
0 (0.0%)
0 (0.0%)
15 Years
0 (0.0%)
0 (0.0%)
16 and 17 Years
0 (0.0%)
0 (0.0%)
18 to 24 Years
0 (0.0%)
0 (0.0%)
25 to 34 Years
0 (0.0%)
0 (0.0%)
35 to 44 Years
0 (0.0%)
0 (0.0%)
45 to 54 Years
0 (0.0%)
0 (0.0%)
55 to 64 Years
0 (0.0%)
0 (0.0%)
65 to 74 Years
0 (0.0%)
0 (0.0%)
75 Years and over
0 (0.0%)
0 (0.0%)
Total
0 (0.0%)
0 (0.0%)
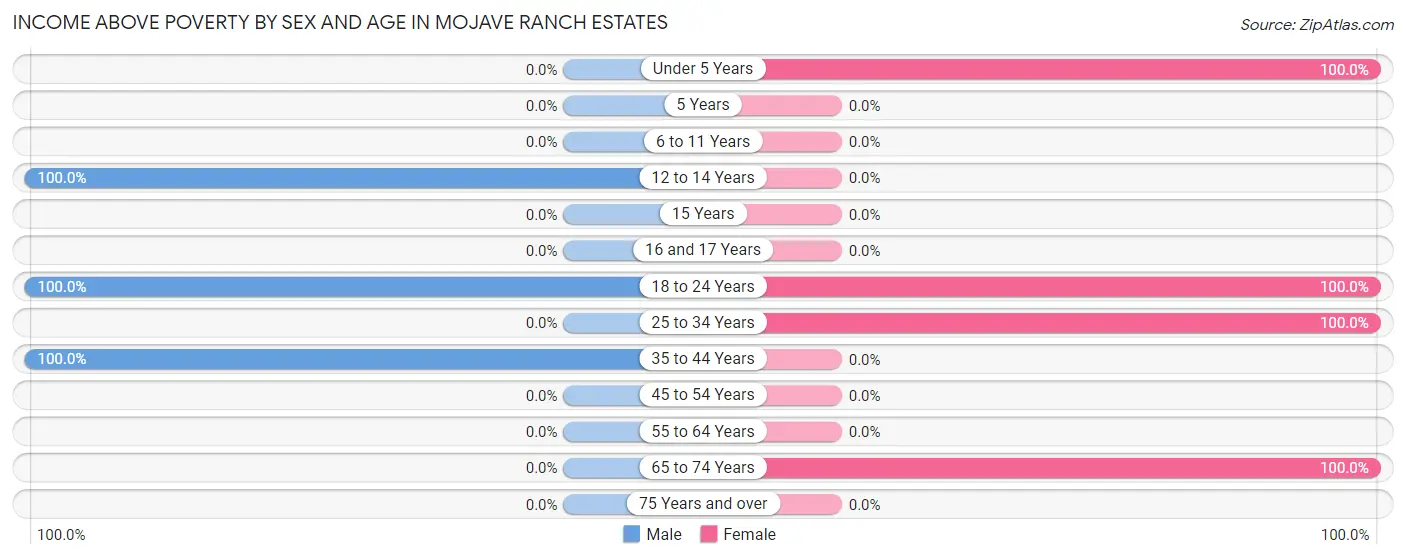
Income Above Poverty by Sex and Age in Mojave Ranch Estates
According to the poverty statistics in Mojave Ranch Estates, males aged 12 to 14 years and females aged under 5 years are the age groups that are most secure financially, with 100.0% of males and 100.0% of females in these age groups living above the poverty line.
Age Bracket
Male
Female
Under 5 Years
0 (0.0%)
10 (100.0%)
5 Years
0 (0.0%)
0 (0.0%)
6 to 11 Years
0 (0.0%)
0 (0.0%)
12 to 14 Years
3 (100.0%)
0 (0.0%)
15 Years
0 (0.0%)
0 (0.0%)
16 and 17 Years
0 (0.0%)
0 (0.0%)
18 to 24 Years
6 (100.0%)
4 (100.0%)
25 to 34 Years
0 (0.0%)
5 (100.0%)
35 to 44 Years
3 (100.0%)
0 (0.0%)
45 to 54 Years
0 (0.0%)
0 (0.0%)
55 to 64 Years
0 (0.0%)
0 (0.0%)
65 to 74 Years
0 (0.0%)
8 (100.0%)
75 Years and over
0 (0.0%)
0 (0.0%)
Total
12 (100.0%)
27 (100.0%)
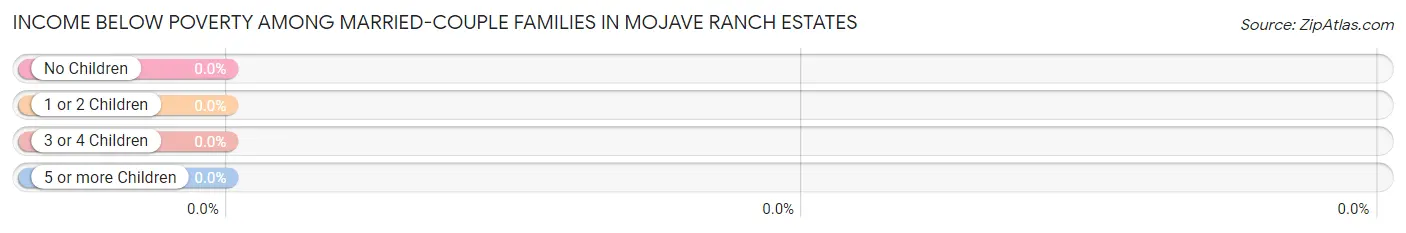
Income Below Poverty Among Married-Couple Families in Mojave Ranch Estates
Children
Above Poverty
Below Poverty
No Children
0 (0.0%)
0 (0.0%)
1 or 2 Children
0 (0.0%)
0 (0.0%)
3 or 4 Children
3 (100.0%)
0 (0.0%)
5 or more Children
0 (0.0%)
0 (0.0%)
Total
3 (100.0%)
0 (0.0%)
Income Below Poverty Among Single-Parent Households in Mojave Ranch Estates
Children
Single Father
Single Mother
No Children
0 (0.0%)
0 (0.0%)
1 or 2 Children
0 (0.0%)
0 (0.0%)
3 or 4 Children
0 (0.0%)
0 (0.0%)
5 or more Children
0 (0.0%)
0 (0.0%)
Total
0 (0.0%)
0 (0.0%)
Income Below Poverty Among Married-Couple vs Single-Parent Households in Mojave Ranch Estates
Children
Married-Couple Families
Single-Parent Households
No Children
0 (0.0%)
0 (0.0%)
1 or 2 Children
0 (0.0%)
0 (0.0%)
3 or 4 Children
0 (0.0%)
0 (0.0%)
5 or more Children
0 (0.0%)
0 (0.0%)
Total
0 (0.0%)
0 (0.0%)
Employment Characteristics in Mojave Ranch Estates
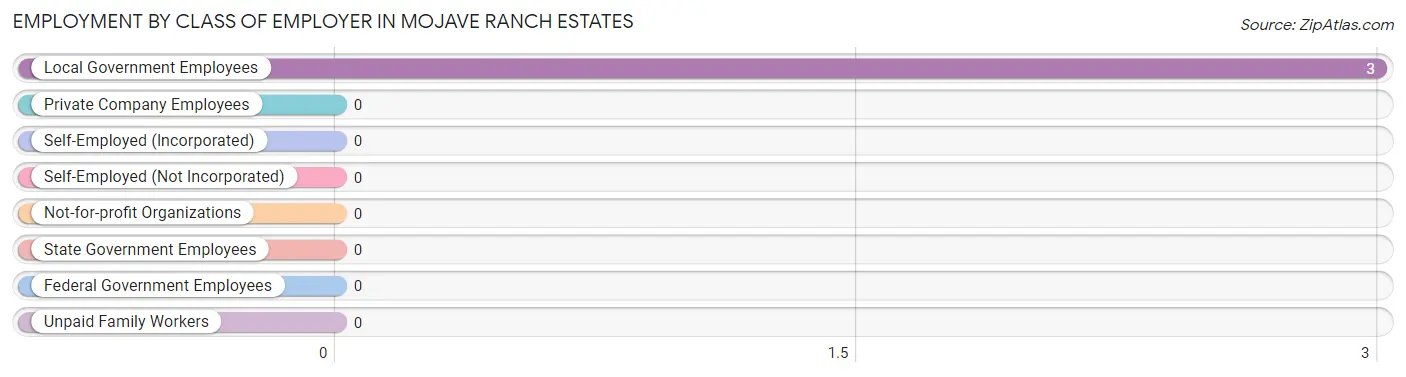
Employment by Class of Employer in Mojave Ranch Estates
Among the 3 employed individuals in Mojave Ranch Estates, , and local government employees (3 | 100.0%) make up the most common classes of employment.
Employer Class
# Employees
% Employees
Private Company Employees
0
0.0%
Self-Employed (Incorporated)
0
0.0%
Self-Employed (Not Incorporated)
0
0.0%
Not-for-profit Organizations
0
0.0%
Local Government Employees
3
100.0%
State Government Employees
0
0.0%
Federal Government Employees
0
0.0%
Unpaid Family Workers
0
0.0%
Total
3
100.0%
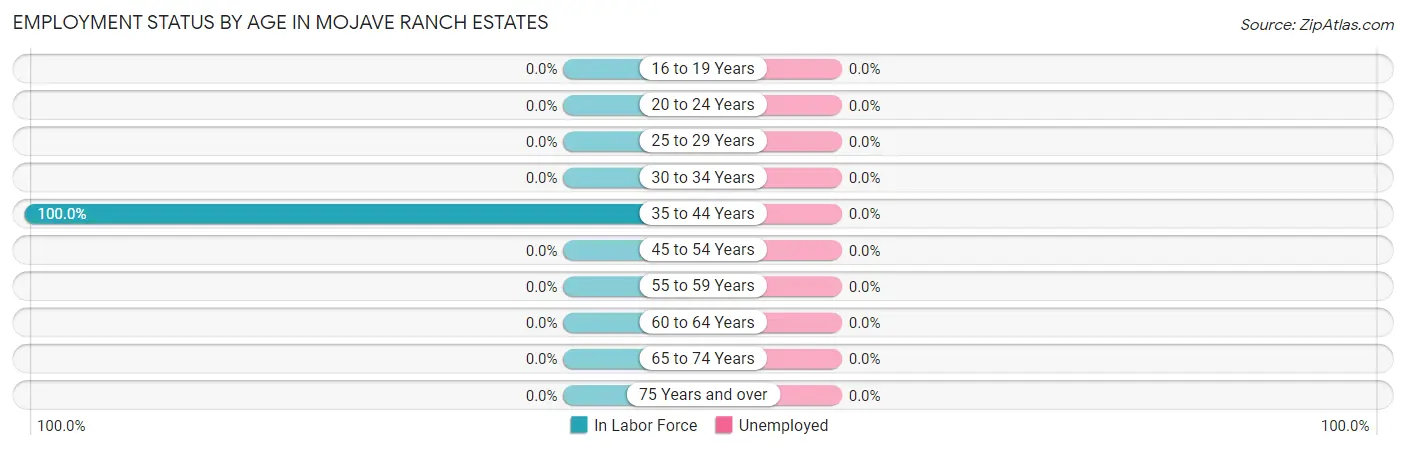
Employment Status by Age in Mojave Ranch Estates
Age Bracket
In Labor Force
Unemployed
16 to 19 Years
0 (0.0%)
0 (0.0%)
20 to 24 Years
0 (0.0%)
0 (0.0%)
25 to 29 Years
0 (0.0%)
0 (0.0%)
30 to 34 Years
0 (0.0%)
0 (0.0%)
35 to 44 Years
3 (100.0%)
0 (0.0%)
45 to 54 Years
0 (0.0%)
0 (0.0%)
55 to 59 Years
0 (0.0%)
0 (0.0%)
60 to 64 Years
0 (0.0%)
0 (0.0%)
65 to 74 Years
0 (0.0%)
0 (0.0%)
75 Years and over
0 (0.0%)
0 (0.0%)
Total
3 (11.5%)
0 (0.0%)
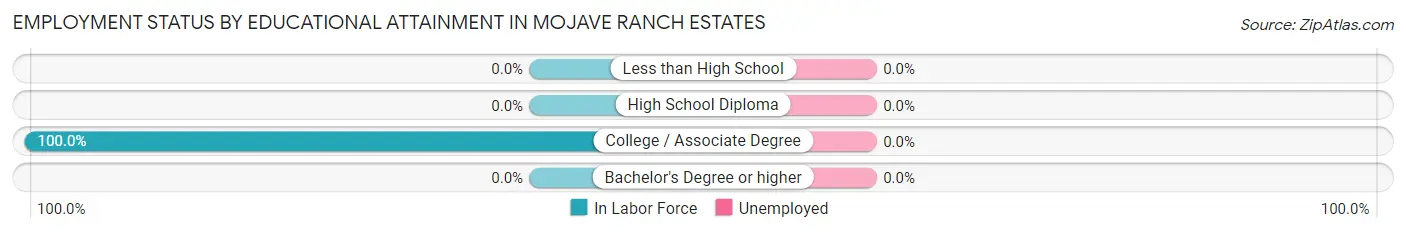
Employment Status by Educational Attainment in Mojave Ranch Estates
Educational Attainment
In Labor Force
Unemployed
Less than High School
0 (0.0%)
0 (0.0%)
High School Diploma
0 (0.0%)
0 (0.0%)
College / Associate Degree
3 (100.0%)
0 (0.0%)
Bachelor's Degree or higher
0 (0.0%)
0 (0.0%)
Total
3 (37.5%)
0 (0.0%)
Employment Occupations by Sex in Mojave Ranch Estates
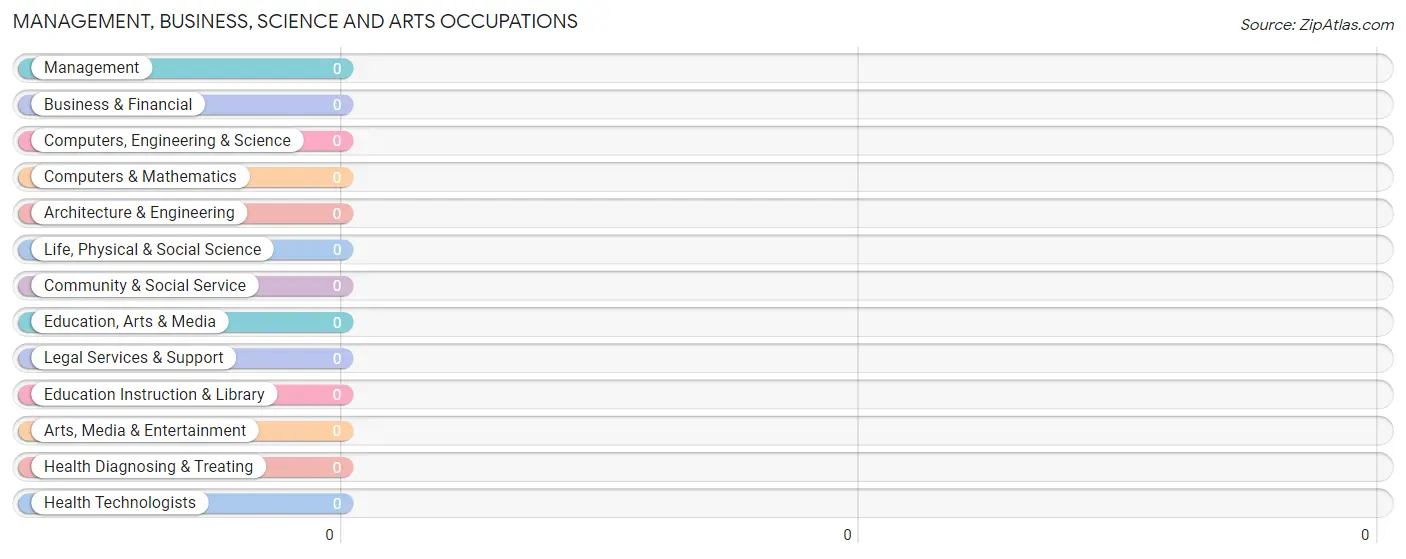
Management, Business, Science and Arts Occupations
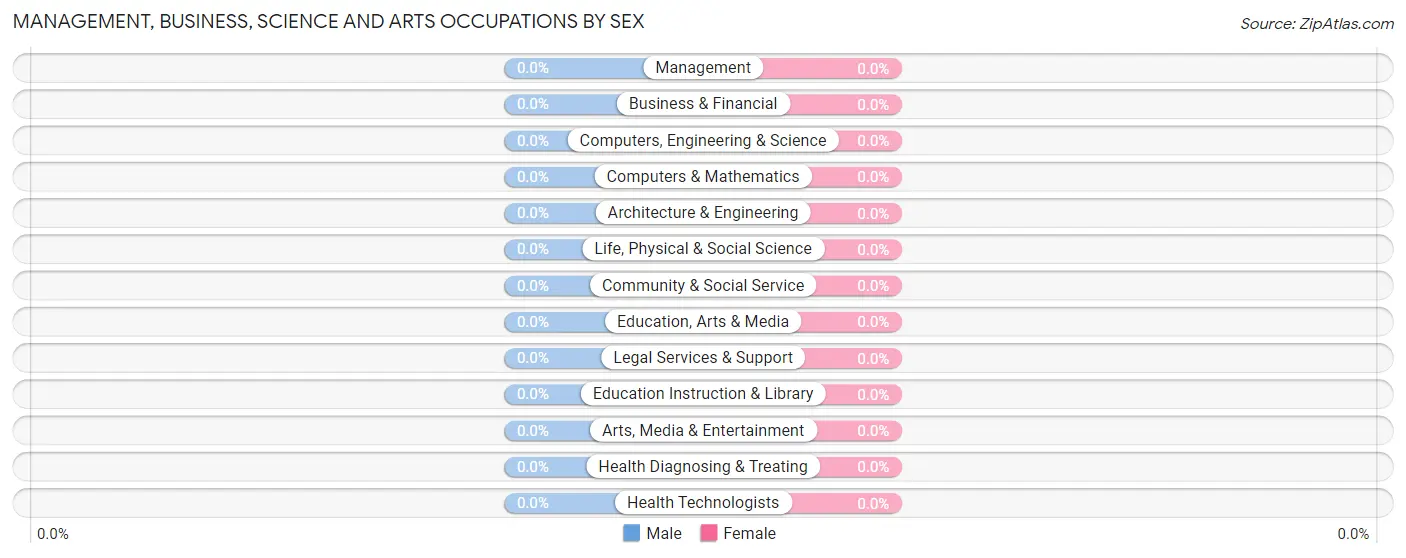
Management, Business, Science and Arts Occupations by Sex
Occupation
Male
Female
Management
0 (0.0%)
0 (0.0%)
Business & Financial
0 (0.0%)
0 (0.0%)
Computers, Engineering & Science
0 (0.0%)
0 (0.0%)
Computers & Mathematics
0 (0.0%)
0 (0.0%)
Architecture & Engineering
0 (0.0%)
0 (0.0%)
Life, Physical & Social Science
0 (0.0%)
0 (0.0%)
Community & Social Service
0 (0.0%)
0 (0.0%)
Education, Arts & Media
0 (0.0%)
0 (0.0%)
Legal Services & Support
0 (0.0%)
0 (0.0%)
Education Instruction & Library
0 (0.0%)
0 (0.0%)
Arts, Media & Entertainment
0 (0.0%)
0 (0.0%)
Health Diagnosing & Treating
0 (0.0%)
0 (0.0%)
Health Technologists
0 (0.0%)
0 (0.0%)
Total (Category)
0 (0.0%)
0 (0.0%)
Total (Overall)
3 (100.0%)
0 (0.0%)
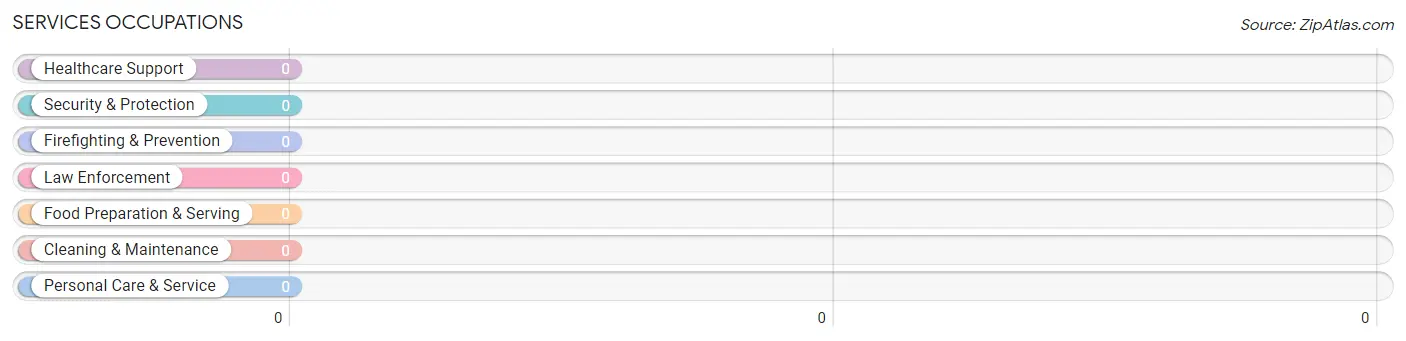
Services Occupations
Services Occupations by Sex
Occupation
Male
Female
Healthcare Support
0 (0.0%)
0 (0.0%)
Security & Protection
0 (0.0%)
0 (0.0%)
Firefighting & Prevention
0 (0.0%)
0 (0.0%)
Law Enforcement
0 (0.0%)
0 (0.0%)
Food Preparation & Serving
0 (0.0%)
0 (0.0%)
Cleaning & Maintenance
0 (0.0%)
0 (0.0%)
Personal Care & Service
0 (0.0%)
0 (0.0%)
Total (Category)
0 (0.0%)
0 (0.0%)
Total (Overall)
3 (100.0%)
0 (0.0%)
Sales and Office Occupations
Sales and Office Occupations by Sex
Occupation
Male
Female
Sales & Related
0 (0.0%)
0 (0.0%)
Office & Administration
0 (0.0%)
0 (0.0%)
Total (Category)
0 (0.0%)
0 (0.0%)
Total (Overall)
3 (100.0%)
0 (0.0%)
Natural Resources, Construction and Maintenance Occupations
Natural Resources, Construction and Maintenance Occupations by Sex
Occupation
Male
Female
Farming, Fishing & Forestry
0 (0.0%)
0 (0.0%)
Construction & Extraction
0 (0.0%)
0 (0.0%)
Installation, Maintenance & Repair
0 (0.0%)
0 (0.0%)
Total (Category)
0 (0.0%)
0 (0.0%)
Total (Overall)
3 (100.0%)
0 (0.0%)
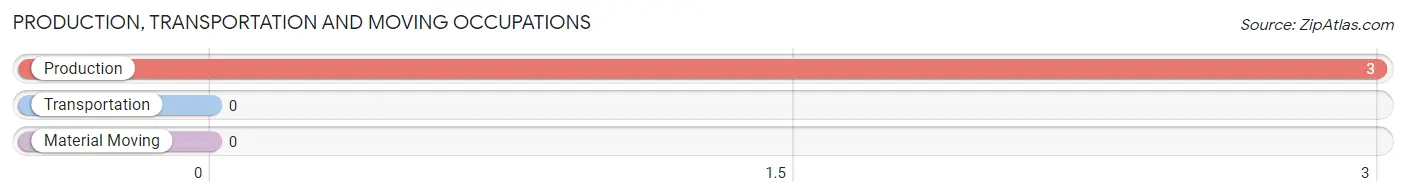
Production, Transportation and Moving Occupations
The most common Production, Transportation and Moving occupations in Mojave Ranch Estates are , and Production (3 | 100.0%).
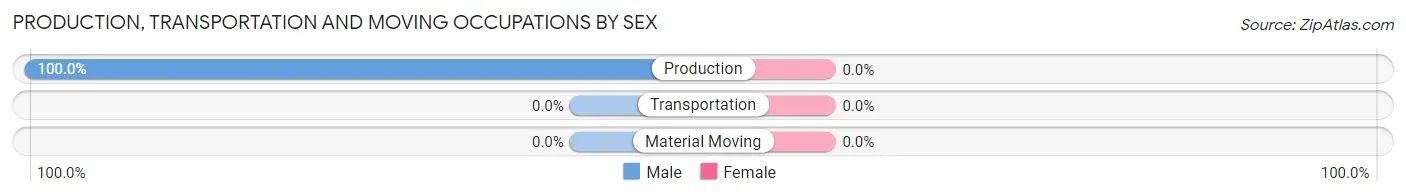
Production, Transportation and Moving Occupations by Sex
Occupation
Male
Female
Production
3 (100.0%)
0 (0.0%)
Transportation
0 (0.0%)
0 (0.0%)
Material Moving
0 (0.0%)
0 (0.0%)
Total (Category)
3 (100.0%)
0 (0.0%)
Total (Overall)
3 (100.0%)
0 (0.0%)
Employment Industries by Sex in Mojave Ranch Estates
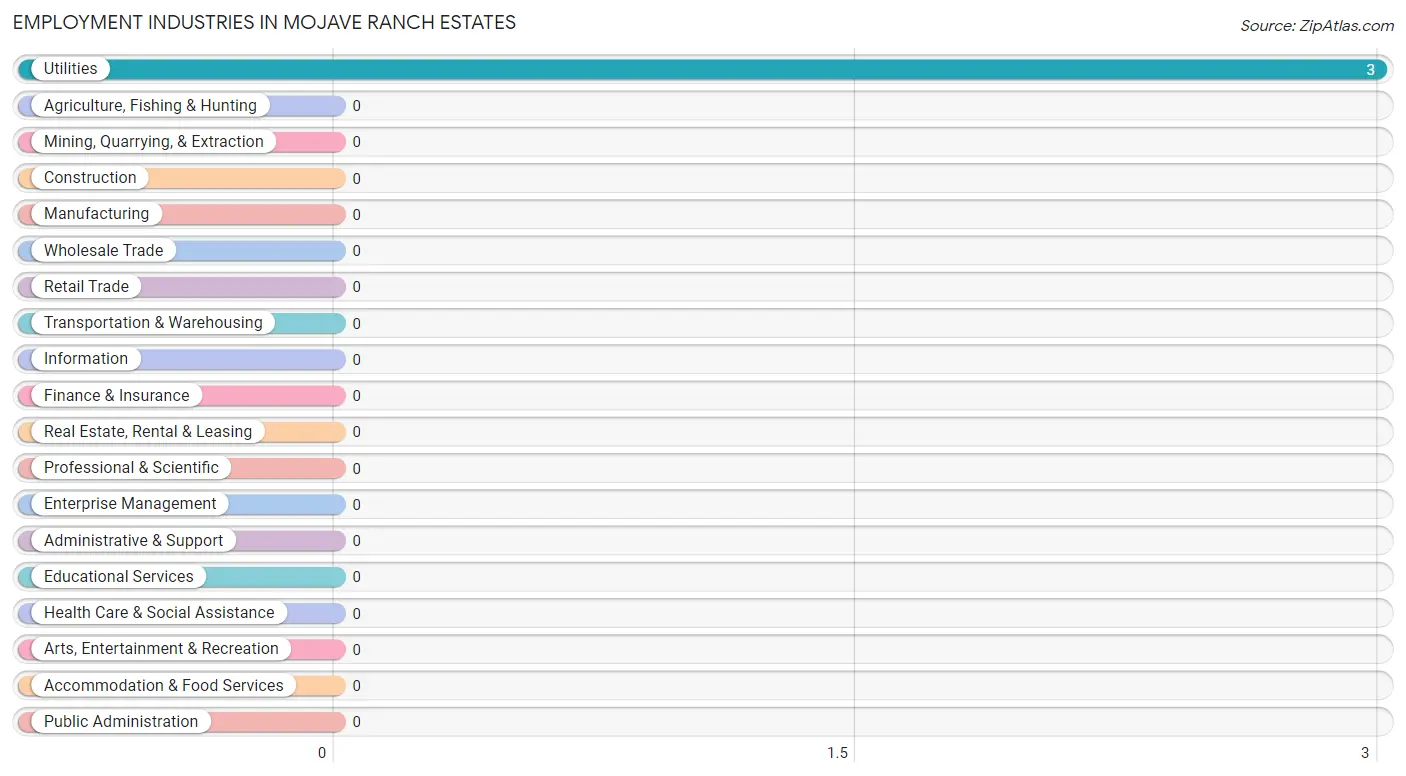
Employment Industries in Mojave Ranch Estates
The major employment industries in Mojave Ranch Estates include , and Utilities (3 | 100.0%).
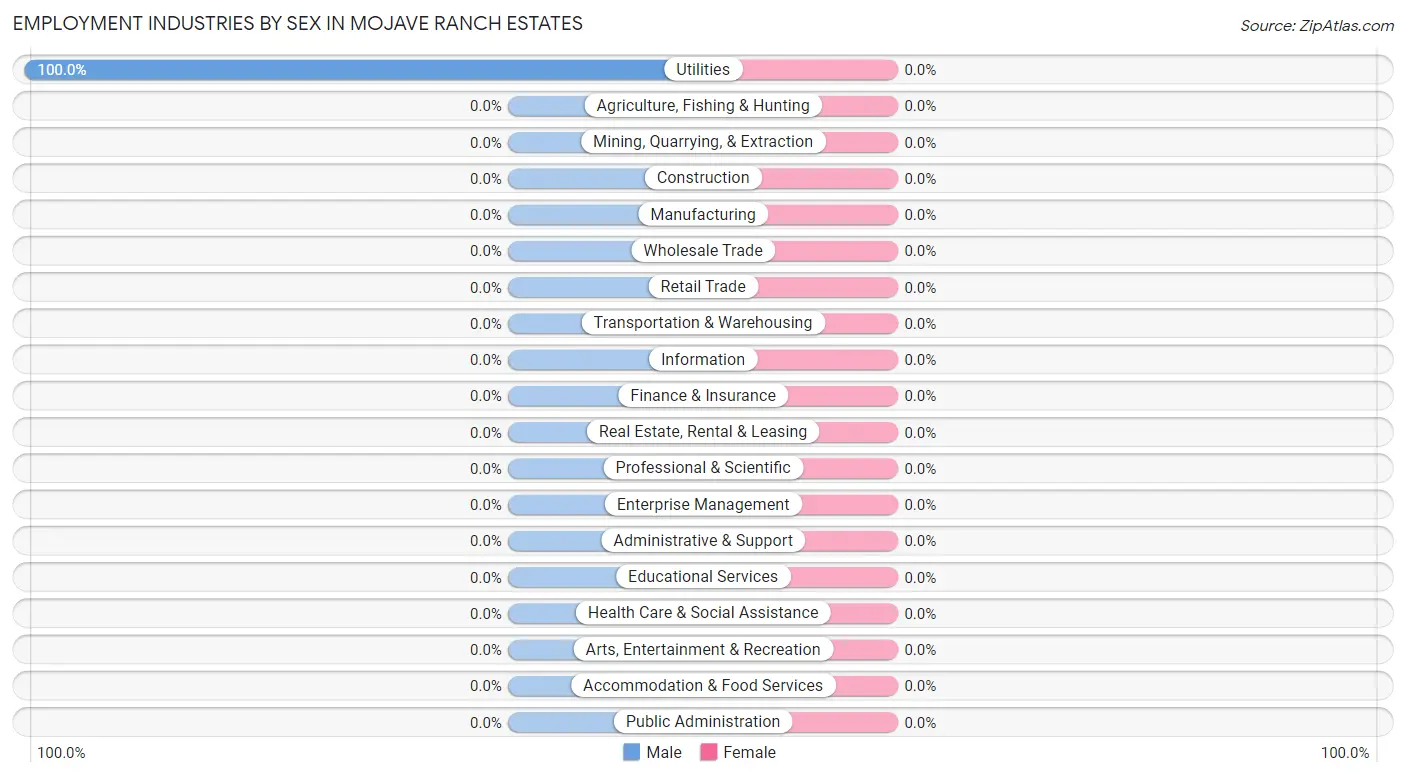
Employment Industries by Sex in Mojave Ranch Estates
Industry
Male
Female
Agriculture, Fishing & Hunting
0 (0.0%)
0 (0.0%)
Mining, Quarrying, & Extraction
0 (0.0%)
0 (0.0%)
Construction
0 (0.0%)
0 (0.0%)
Manufacturing
0 (0.0%)
0 (0.0%)
Wholesale Trade
0 (0.0%)
0 (0.0%)
Retail Trade
0 (0.0%)
0 (0.0%)
Transportation & Warehousing
0 (0.0%)
0 (0.0%)
Utilities
3 (100.0%)
0 (0.0%)
Information
0 (0.0%)
0 (0.0%)
Finance & Insurance
0 (0.0%)
0 (0.0%)
Real Estate, Rental & Leasing
0 (0.0%)
0 (0.0%)
Professional & Scientific
0 (0.0%)
0 (0.0%)
Enterprise Management
0 (0.0%)
0 (0.0%)
Administrative & Support
0 (0.0%)
0 (0.0%)
Educational Services
0 (0.0%)
0 (0.0%)
Health Care & Social Assistance
0 (0.0%)
0 (0.0%)
Arts, Entertainment & Recreation
0 (0.0%)
0 (0.0%)
Accommodation & Food Services
0 (0.0%)
0 (0.0%)
Public Administration
0 (0.0%)
0 (0.0%)
Total
3 (100.0%)
0 (0.0%)
Education in Mojave Ranch Estates
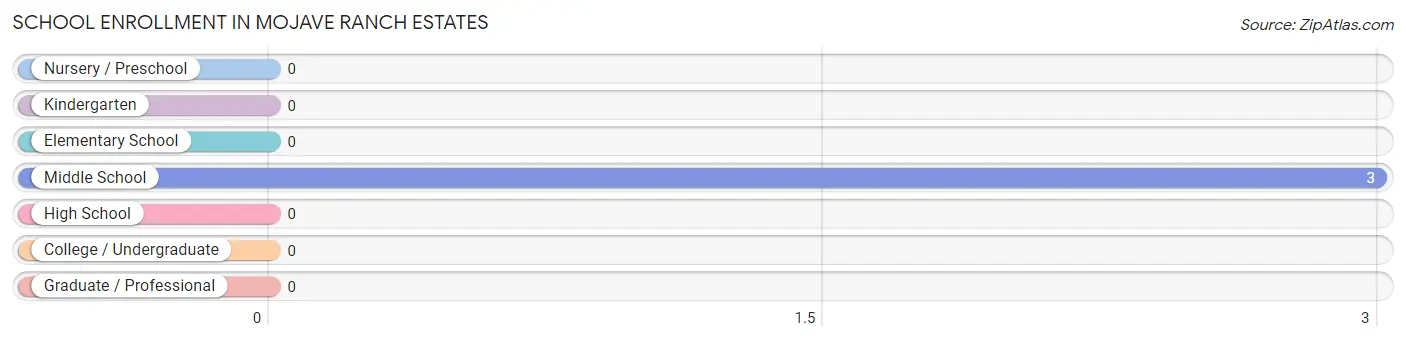
School Enrollment in Mojave Ranch Estates
School Level
# Students
% Students
Nursery / Preschool
0
0.0%
Kindergarten
0
0.0%
Elementary School
0
0.0%
Middle School
3
100.0%
High School
0
0.0%
College / Undergraduate
0
0.0%
Graduate / Professional
0
0.0%
Total
3
100.0%
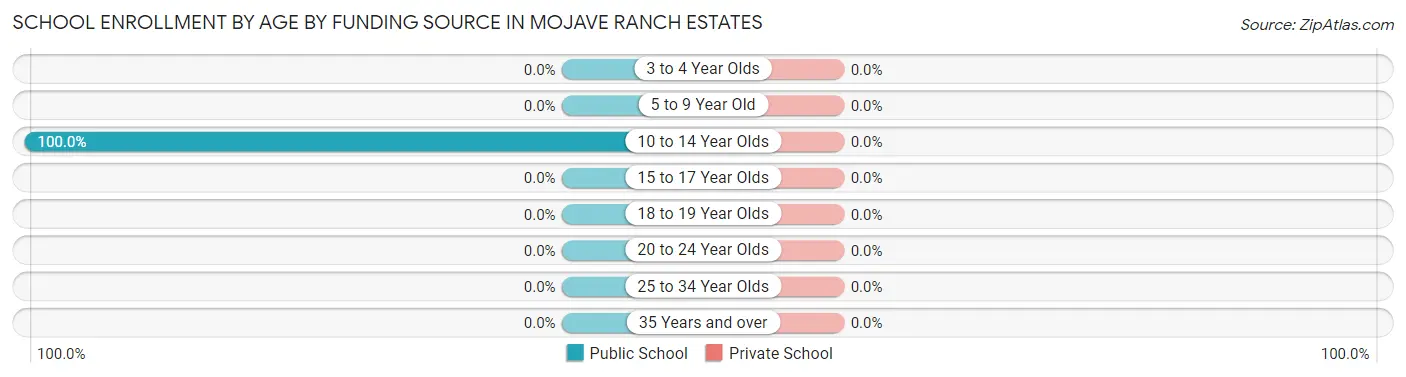
School Enrollment by Age by Funding Source in Mojave Ranch Estates
Age Bracket
Public School
Private School
3 to 4 Year Olds
0 (0.0%)
0 (0.0%)
5 to 9 Year Old
0 (0.0%)
0 (0.0%)
10 to 14 Year Olds
3 (100.0%)
0 (0.0%)
15 to 17 Year Olds
0 (0.0%)
0 (0.0%)
18 to 19 Year Olds
0 (0.0%)
0 (0.0%)
20 to 24 Year Olds
0 (0.0%)
0 (0.0%)
25 to 34 Year Olds
0 (0.0%)
0 (0.0%)
35 Years and over
0 (0.0%)
0 (0.0%)
Total
3 (100.0%)
0 (0.0%)
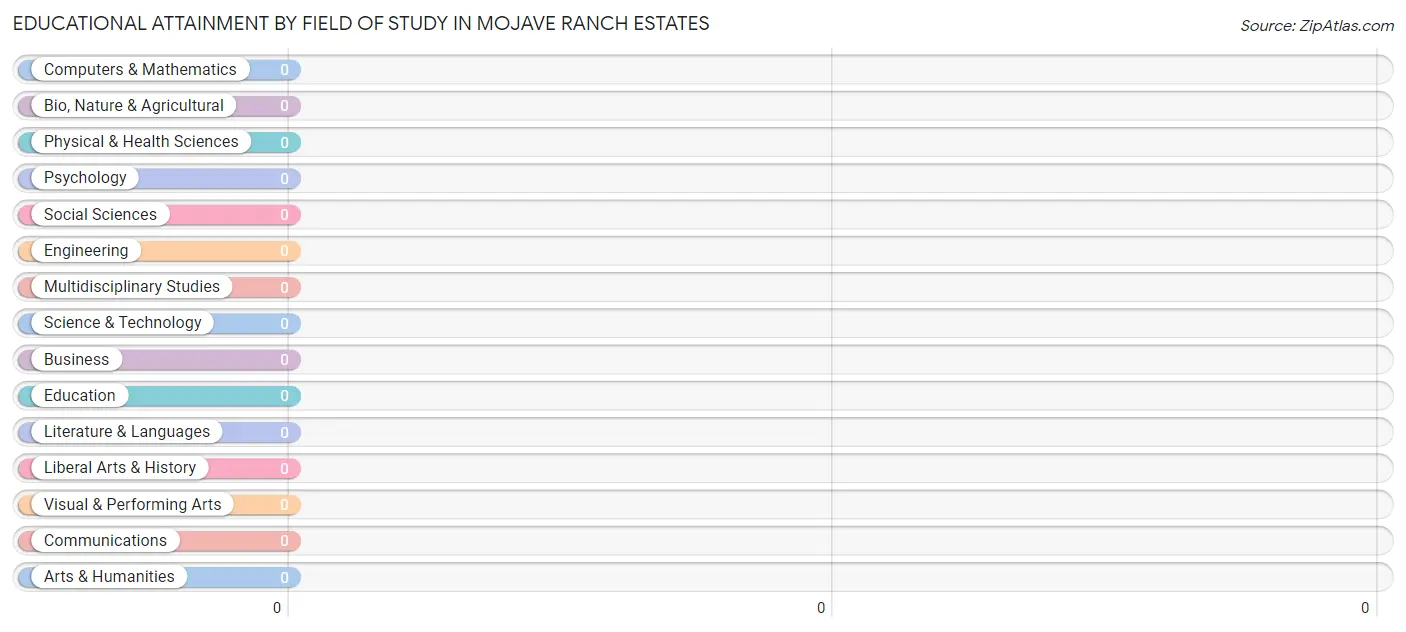
Educational Attainment by Field of Study in Mojave Ranch Estates
Field of Study
# Graduates
% Graduates
Computers & Mathematics
0
0.0%
Bio, Nature & Agricultural
0
0.0%
Physical & Health Sciences
0
0.0%
Psychology
0
0.0%
Social Sciences
0
0.0%
Engineering
0
0.0%
Multidisciplinary Studies
0
0.0%
Science & Technology
0
0.0%
Business
0
0.0%
Education
0
0.0%
Literature & Languages
0
0.0%
Liberal Arts & History
0
0.0%
Visual & Performing Arts
0
0.0%
Communications
0
0.0%
Arts & Humanities
0
0.0%
Total
0
0.0%
Transportation & Commute in Mojave Ranch Estates
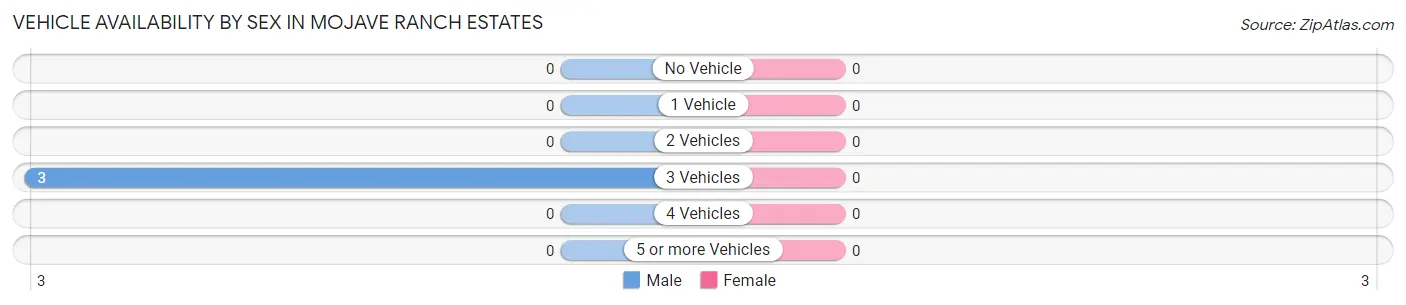
Vehicle Availability by Sex in Mojave Ranch Estates
Vehicles Available
Male
Female
No Vehicle
0 (0.0%)
0 (0.0%)
1 Vehicle
0 (0.0%)
0 (0.0%)
2 Vehicles
0 (0.0%)
0 (0.0%)
3 Vehicles
3 (100.0%)
0 (0.0%)
4 Vehicles
0 (0.0%)
0 (0.0%)
5 or more Vehicles
0 (0.0%)
0 (0.0%)
Total
3 (100.0%)
0 (0.0%)
Commute Time in Mojave Ranch Estates
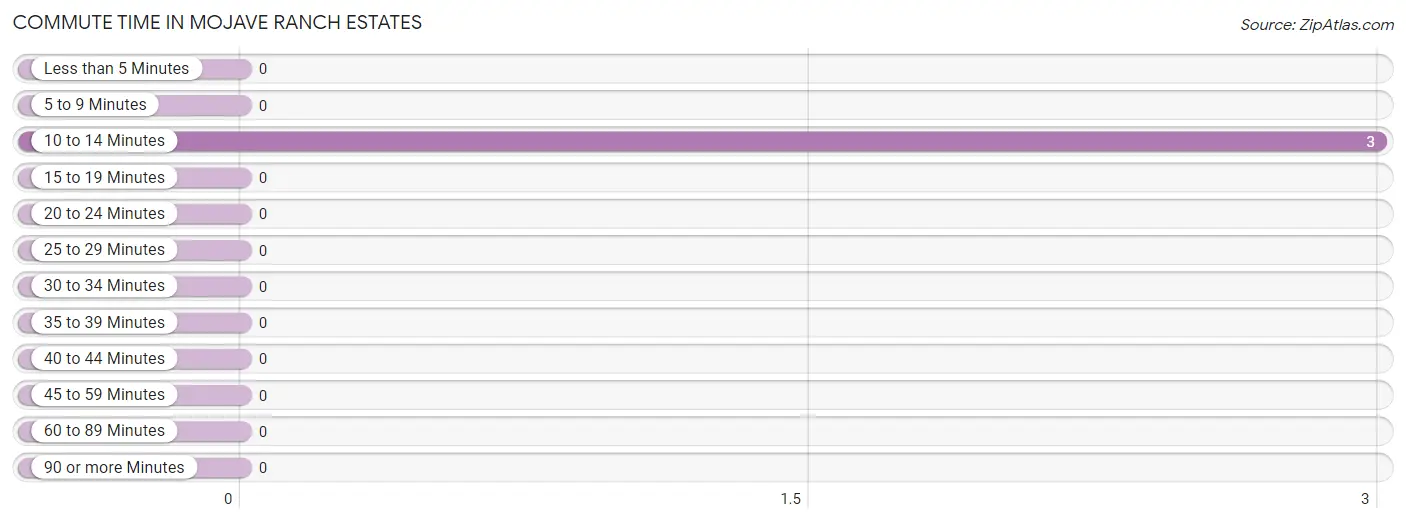
The most frequently occuring commute durations in Mojave Ranch Estates are 10 to 14 minutes (3 commuters, 100.0%), less than 5 minutes (0 commuters, 0.0%), and 5 to 9 minutes (0 commuters, 0.0%).
Commute Time
# Commuters
% Commuters
Less than 5 Minutes
0
0.0%
5 to 9 Minutes
0
0.0%
10 to 14 Minutes
3
100.0%
15 to 19 Minutes
0
0.0%
20 to 24 Minutes
0
0.0%
25 to 29 Minutes
0
0.0%
30 to 34 Minutes
0
0.0%
35 to 39 Minutes
0
0.0%
40 to 44 Minutes
0
0.0%
45 to 59 Minutes
0
0.0%
60 to 89 Minutes
0
0.0%
90 or more Minutes
0
0.0%
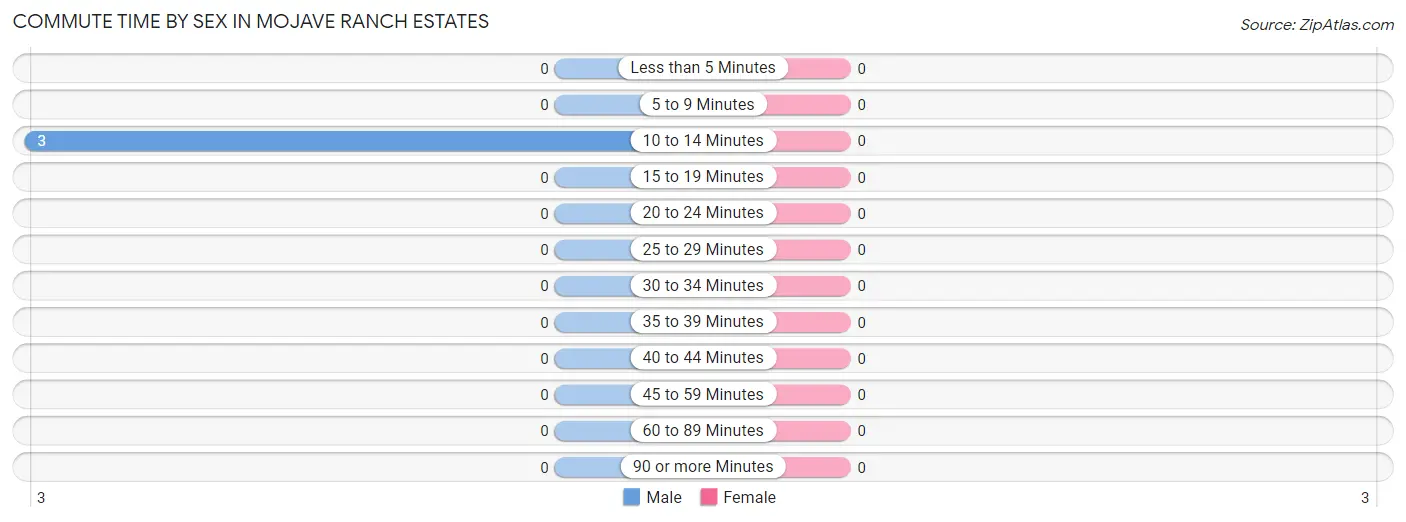
Commute Time by Sex in Mojave Ranch Estates
Commute Time
Male
Female
Less than 5 Minutes
0 (0.0%)
0 (0.0%)
5 to 9 Minutes
0 (0.0%)
0 (0.0%)
10 to 14 Minutes
3 (100.0%)
0 (0.0%)
15 to 19 Minutes
0 (0.0%)
0 (0.0%)
20 to 24 Minutes
0 (0.0%)
0 (0.0%)
25 to 29 Minutes
0 (0.0%)
0 (0.0%)
30 to 34 Minutes
0 (0.0%)
0 (0.0%)
35 to 39 Minutes
0 (0.0%)
0 (0.0%)
40 to 44 Minutes
0 (0.0%)
0 (0.0%)
45 to 59 Minutes
0 (0.0%)
0 (0.0%)
60 to 89 Minutes
0 (0.0%)
0 (0.0%)
90 or more Minutes
0 (0.0%)
0 (0.0%)
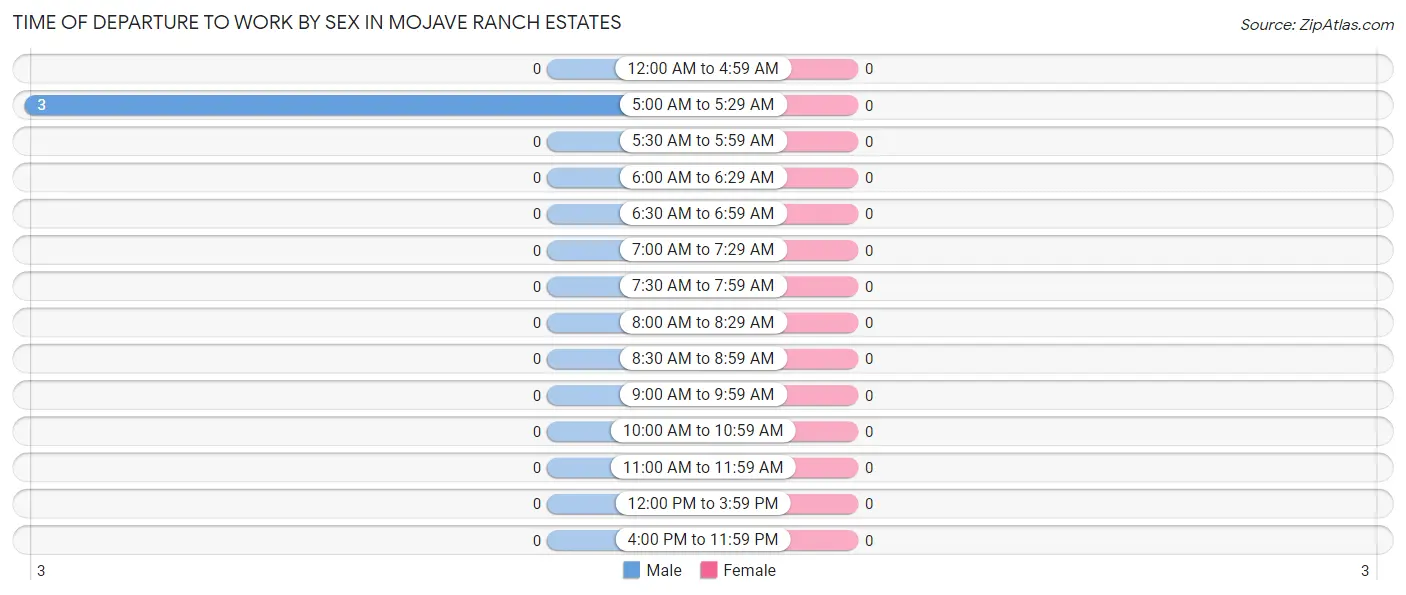
Time of Departure to Work by Sex in Mojave Ranch Estates
Time of Departure
Male
Female
12:00 AM to 4:59 AM
0 (0.0%)
0 (0.0%)
5:00 AM to 5:29 AM
3 (100.0%)
0 (0.0%)
5:30 AM to 5:59 AM
0 (0.0%)
0 (0.0%)
6:00 AM to 6:29 AM
0 (0.0%)
0 (0.0%)
6:30 AM to 6:59 AM
0 (0.0%)
0 (0.0%)
7:00 AM to 7:29 AM
0 (0.0%)
0 (0.0%)
7:30 AM to 7:59 AM
0 (0.0%)
0 (0.0%)
8:00 AM to 8:29 AM
0 (0.0%)
0 (0.0%)
8:30 AM to 8:59 AM
0 (0.0%)
0 (0.0%)
9:00 AM to 9:59 AM
0 (0.0%)
0 (0.0%)
10:00 AM to 10:59 AM
0 (0.0%)
0 (0.0%)
11:00 AM to 11:59 AM
0 (0.0%)
0 (0.0%)
12:00 PM to 3:59 PM
0 (0.0%)
0 (0.0%)
4:00 PM to 11:59 PM
0 (0.0%)
0 (0.0%)
Total
3 (100.0%)
0 (0.0%)
Housing Occupancy in Mojave Ranch Estates
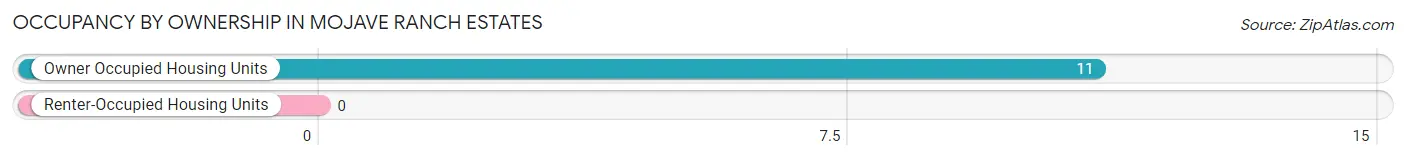
Occupancy by Ownership in Mojave Ranch Estates
Of the total 11 dwellings in Mojave Ranch Estates, owner-occupied units account for 11 (100.0%), while renter-occupied units make up 0 (0.0%).
Occupancy
# Housing Units
% Housing Units
Owner Occupied Housing Units
11
100.0%
Renter-Occupied Housing Units
0
0.0%
Total Occupied Housing Units
11
100.0%
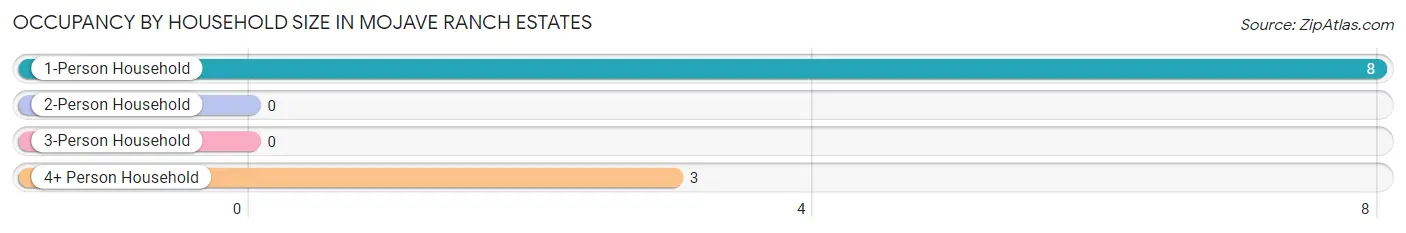
Occupancy by Household Size in Mojave Ranch Estates
Household Size
# Housing Units
% Housing Units
1-Person Household
8
72.7%
2-Person Household
0
0.0%
3-Person Household
0
0.0%
4+ Person Household
3
27.3%
Total Housing Units
11
100.0%
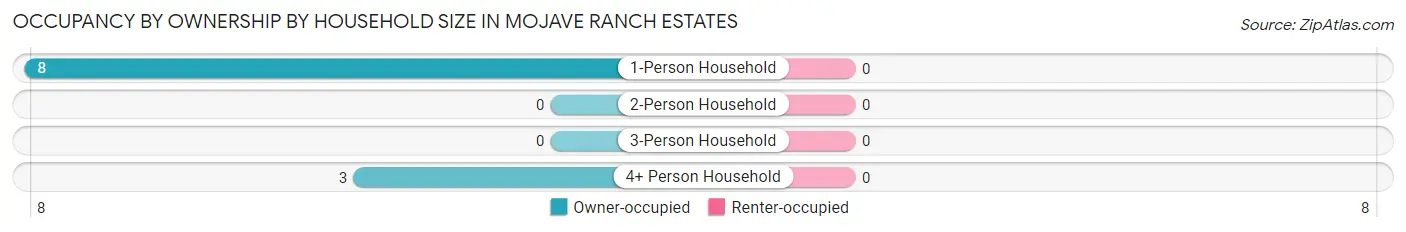
Occupancy by Ownership by Household Size in Mojave Ranch Estates
Household Size
Owner-occupied
Renter-occupied
1-Person Household
8 (100.0%)
0 (0.0%)
2-Person Household
0 (0.0%)
0 (0.0%)
3-Person Household
0 (0.0%)
0 (0.0%)
4+ Person Household
3 (100.0%)
0 (0.0%)
Total Housing Units
11 (100.0%)
0 (0.0%)
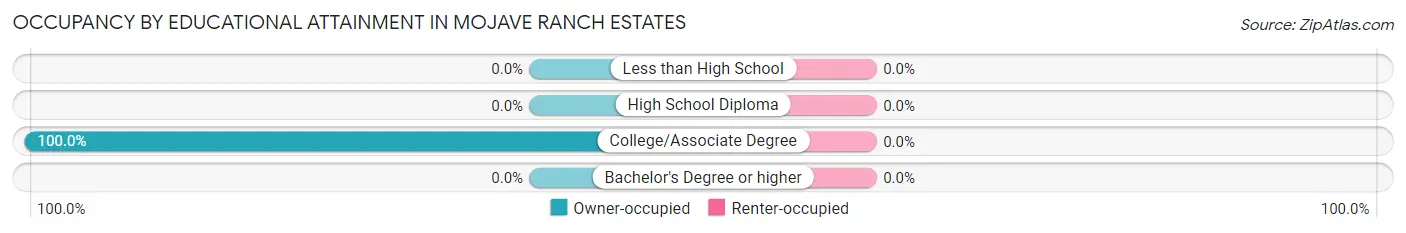
Occupancy by Educational Attainment in Mojave Ranch Estates
Household Size
Owner-occupied
Renter-occupied
Less than High School
0 (0.0%)
0 (0.0%)
High School Diploma
0 (0.0%)
0 (0.0%)
College/Associate Degree
11 (100.0%)
0 (0.0%)
Bachelor's Degree or higher
0 (0.0%)
0 (0.0%)
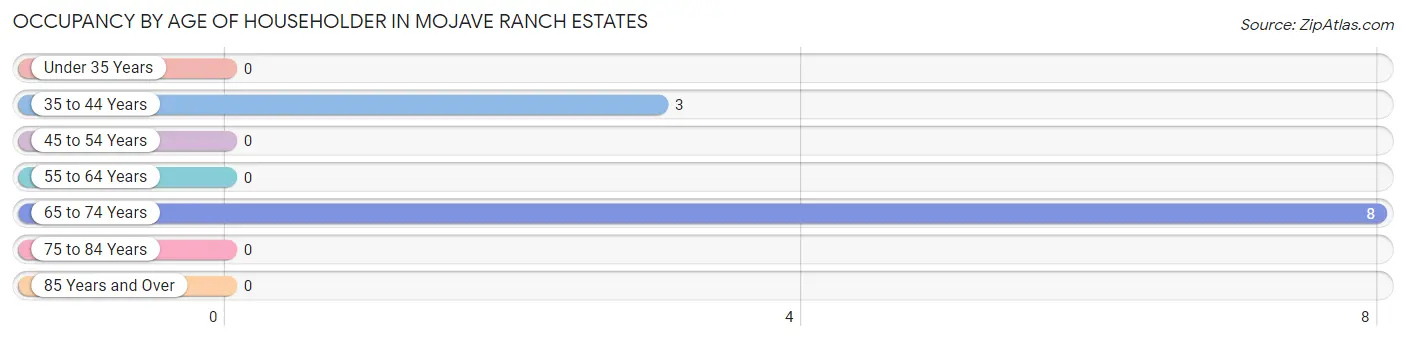
Occupancy by Age of Householder in Mojave Ranch Estates
Age Bracket
# Households
% Households
Under 35 Years
0
0.0%
35 to 44 Years
3
27.3%
45 to 54 Years
0
0.0%
55 to 64 Years
0
0.0%
65 to 74 Years
8
72.7%
75 to 84 Years
0
0.0%
85 Years and Over
0
0.0%
Total
11
100.0%
Housing Finances in Mojave Ranch Estates
Median Income by Occupancy in Mojave Ranch Estates
Occupancy Type
# Households
Median Income
Owner-Occupied
11 (100.0%)
$0
Renter-Occupied
0 (0.0%)
$0
Average
11 (100.0%)
$0
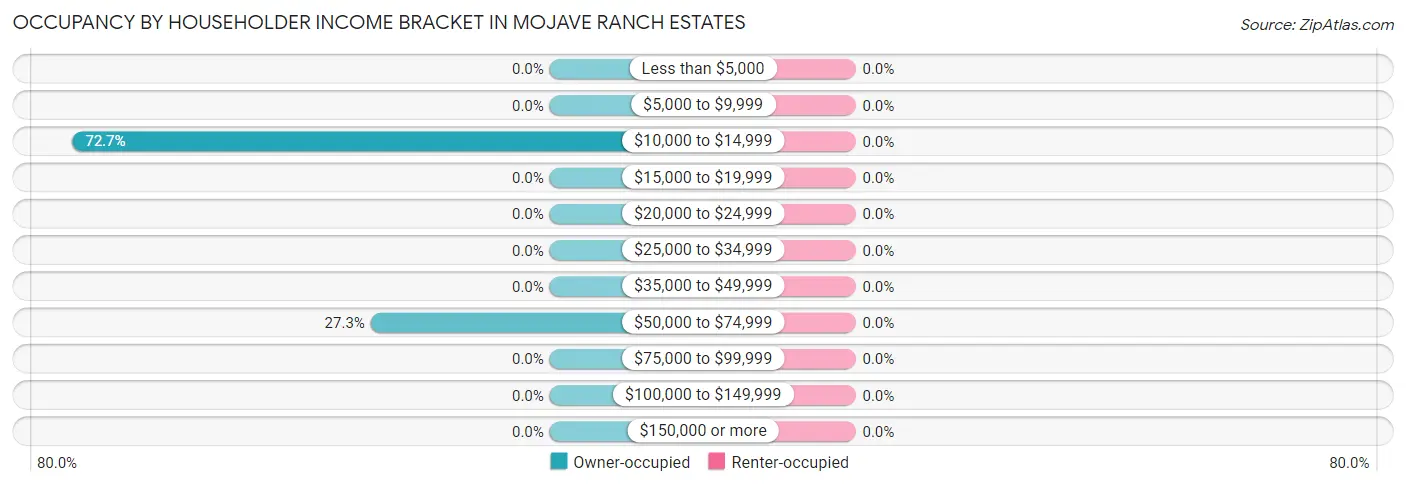
Occupancy by Householder Income Bracket in Mojave Ranch Estates
Income Bracket
Owner-occupied
Renter-occupied
Less than $5,000
0 (0.0%)
0 (0.0%)
$5,000 to $9,999
0 (0.0%)
0 (0.0%)
$10,000 to $14,999
8 (72.7%)
0 (0.0%)
$15,000 to $19,999
0 (0.0%)
0 (0.0%)
$20,000 to $24,999
0 (0.0%)
0 (0.0%)
$25,000 to $34,999
0 (0.0%)
0 (0.0%)
$35,000 to $49,999
0 (0.0%)
0 (0.0%)
$50,000 to $74,999
3 (27.3%)
0 (0.0%)
$75,000 to $99,999
0 (0.0%)
0 (0.0%)
$100,000 to $149,999
0 (0.0%)
0 (0.0%)
$150,000 or more
0 (0.0%)
0 (0.0%)
Total
11 (100.0%)
0 (0.0%)
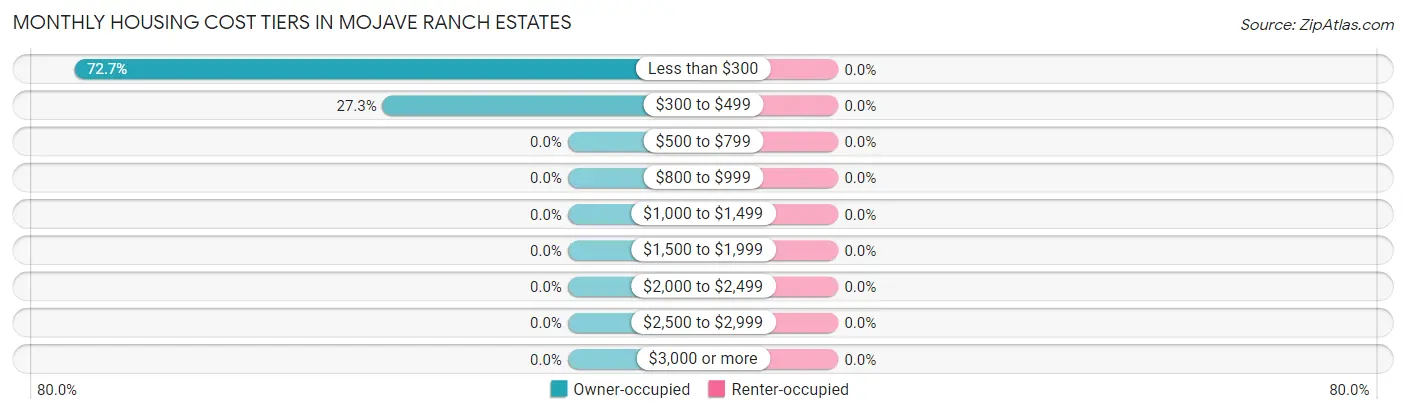
Monthly Housing Cost Tiers in Mojave Ranch Estates
Monthly Cost
Owner-occupied
Renter-occupied
Less than $300
8 (72.7%)
0 (0.0%)
$300 to $499
3 (27.3%)
0 (0.0%)
$500 to $799
0 (0.0%)
0 (0.0%)
$800 to $999
0 (0.0%)
0 (0.0%)
$1,000 to $1,499
0 (0.0%)
0 (0.0%)
$1,500 to $1,999
0 (0.0%)
0 (0.0%)
$2,000 to $2,499
0 (0.0%)
0 (0.0%)
$2,500 to $2,999
0 (0.0%)
0 (0.0%)
$3,000 or more
0 (0.0%)
0 (0.0%)
Total
11 (100.0%)
0 (0.0%)
Physical Housing Characteristics in Mojave Ranch Estates
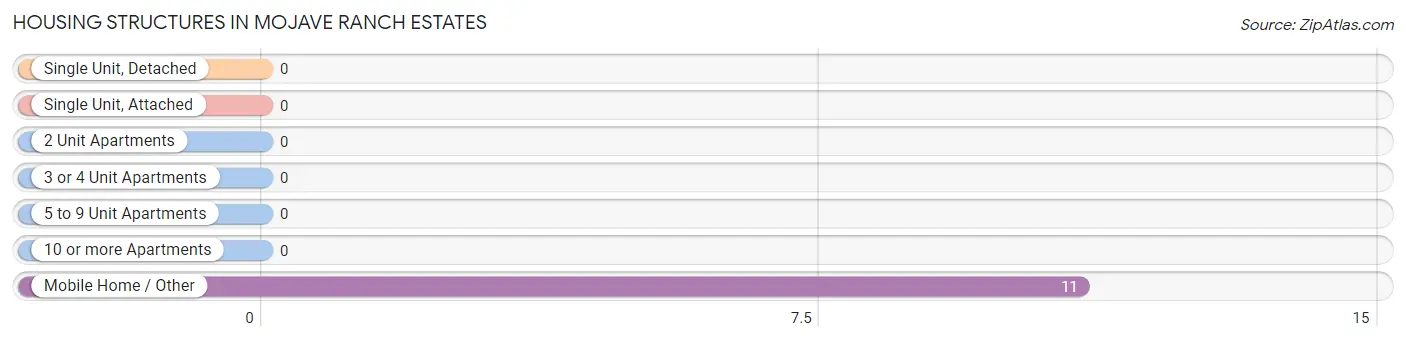
Housing Structures in Mojave Ranch Estates
Structure Type
# Housing Units
% Housing Units
Single Unit, Detached
0
0.0%
Single Unit, Attached
0
0.0%
2 Unit Apartments
0
0.0%
3 or 4 Unit Apartments
0
0.0%
5 to 9 Unit Apartments
0
0.0%
10 or more Apartments
0
0.0%
Mobile Home / Other
11
100.0%
Total
11
100.0%
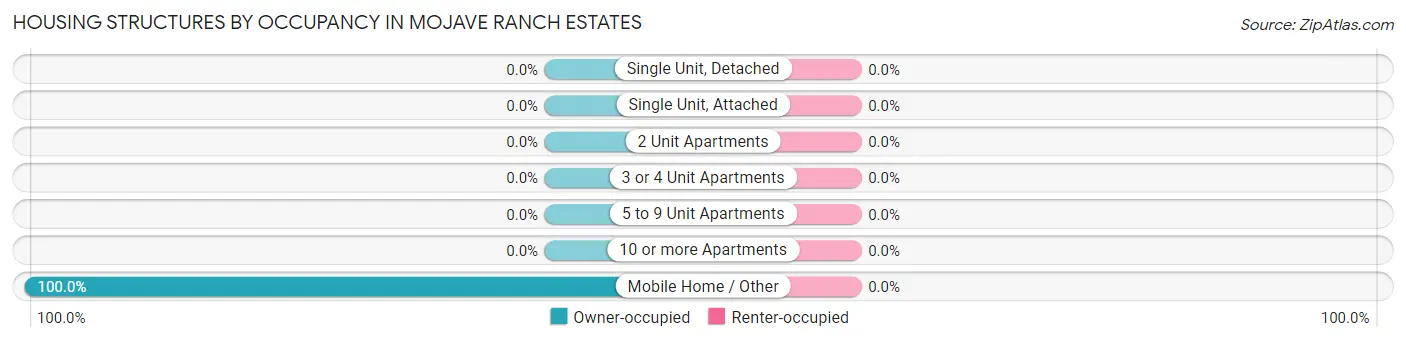
Housing Structures by Occupancy in Mojave Ranch Estates
Structure Type
Owner-occupied
Renter-occupied
Single Unit, Detached
0 (0.0%)
0 (0.0%)
Single Unit, Attached
0 (0.0%)
0 (0.0%)
2 Unit Apartments
0 (0.0%)
0 (0.0%)
3 or 4 Unit Apartments
0 (0.0%)
0 (0.0%)
5 to 9 Unit Apartments
0 (0.0%)
0 (0.0%)
10 or more Apartments
0 (0.0%)
0 (0.0%)
Mobile Home / Other
11 (100.0%)
0 (0.0%)
Total
11 (100.0%)
0 (0.0%)
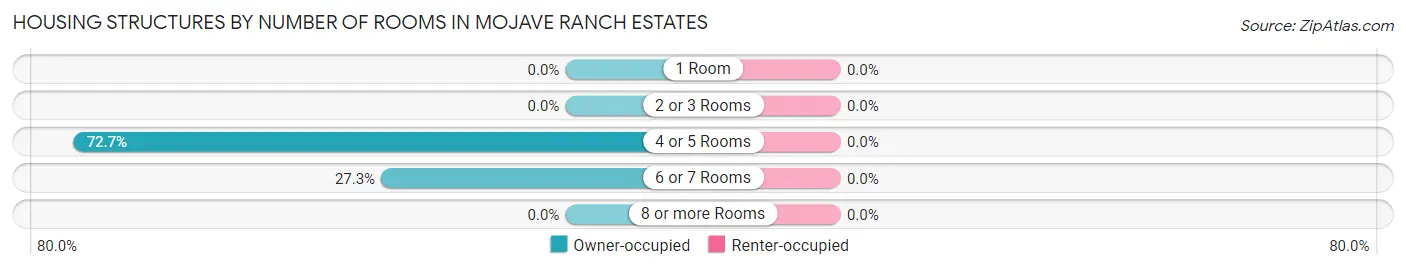
Housing Structures by Number of Rooms in Mojave Ranch Estates
Number of Rooms
Owner-occupied
Renter-occupied
1 Room
0 (0.0%)
0 (0.0%)
2 or 3 Rooms
0 (0.0%)
0 (0.0%)
4 or 5 Rooms
8 (72.7%)
0 (0.0%)
6 or 7 Rooms
3 (27.3%)
0 (0.0%)
8 or more Rooms
0 (0.0%)
0 (0.0%)
Total
11 (100.0%)
0 (0.0%)
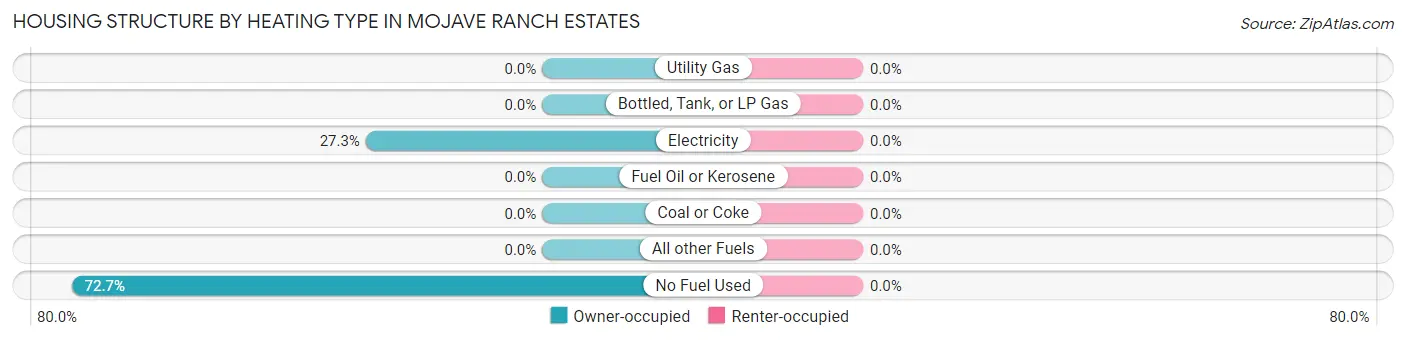
Housing Structure by Heating Type in Mojave Ranch Estates
Heating Type
Owner-occupied
Renter-occupied
Utility Gas
0 (0.0%)
0 (0.0%)
Bottled, Tank, or LP Gas
0 (0.0%)
0 (0.0%)
Electricity
3 (27.3%)
0 (0.0%)
Fuel Oil or Kerosene
0 (0.0%)
0 (0.0%)
Coal or Coke
0 (0.0%)
0 (0.0%)
All other Fuels
0 (0.0%)
0 (0.0%)
No Fuel Used
8 (72.7%)
0 (0.0%)
Total
11 (100.0%)
0 (0.0%)
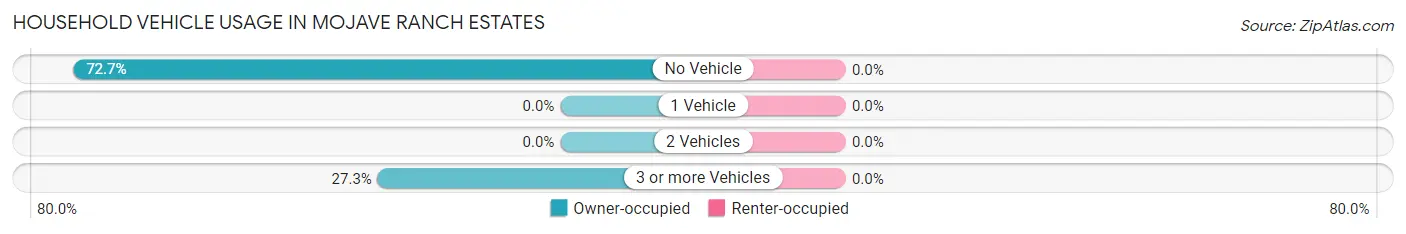
Household Vehicle Usage in Mojave Ranch Estates
Vehicles per Household
Owner-occupied
Renter-occupied
No Vehicle
8 (72.7%)
0 (0.0%)
1 Vehicle
0 (0.0%)
0 (0.0%)
2 Vehicles
0 (0.0%)
0 (0.0%)
3 or more Vehicles
3 (27.3%)
0 (0.0%)
Total
11 (100.0%)
0 (0.0%)
Real Estate & Mortgages in Mojave Ranch Estates
Real Estate and Mortgage Overview in Mojave Ranch Estates
Characteristic
Without Mortgage
With Mortgage
Housing Units
11
0
Median Property Value
-
-
Median Household Income
-
-
Monthly Housing Costs
-
-
Real Estate Taxes
-
-
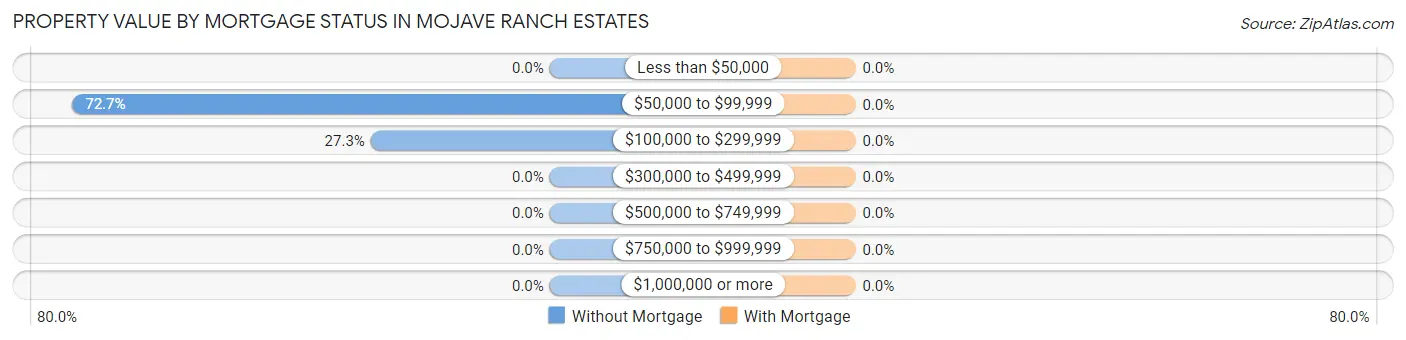
Property Value by Mortgage Status in Mojave Ranch Estates
Property Value
Without Mortgage
With Mortgage
Less than $50,000
0 (0.0%)
0 (0.0%)
$50,000 to $99,999
8 (72.7%)
0 (0.0%)
$100,000 to $299,999
3 (27.3%)
0 (0.0%)
$300,000 to $499,999
0 (0.0%)
0 (0.0%)
$500,000 to $749,999
0 (0.0%)
0 (0.0%)
$750,000 to $999,999
0 (0.0%)
0 (0.0%)
$1,000,000 or more
0 (0.0%)
0 (0.0%)
Total
11 (100.0%)
0 (0.0%)
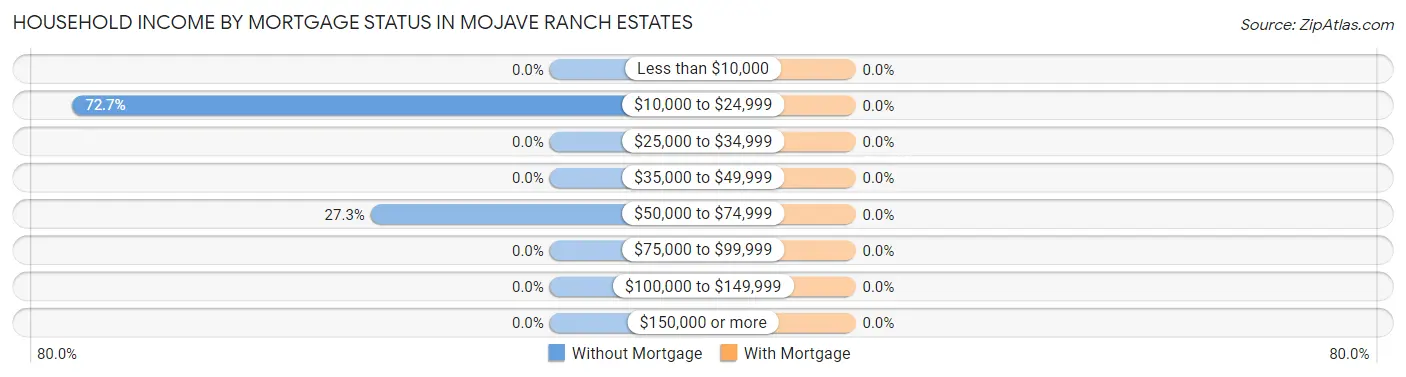
Household Income by Mortgage Status in Mojave Ranch Estates
Household Income
Without Mortgage
With Mortgage
Less than $10,000
0 (0.0%)
0 (0.0%)
$10,000 to $24,999
8 (72.7%)
0 (0.0%)
$25,000 to $34,999
0 (0.0%)
0 (0.0%)
$35,000 to $49,999
0 (0.0%)
0 (0.0%)
$50,000 to $74,999
3 (27.3%)
0 (0.0%)
$75,000 to $99,999
0 (0.0%)
0 (0.0%)
$100,000 to $149,999
0 (0.0%)
0 (0.0%)
$150,000 or more
0 (0.0%)
0 (0.0%)
Total
11 (100.0%)
0 (0.0%)
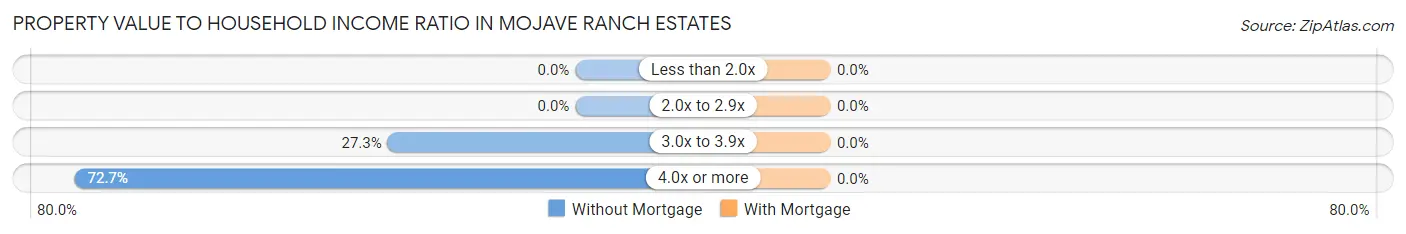
Property Value to Household Income Ratio in Mojave Ranch Estates
Value-to-Income Ratio
Without Mortgage
With Mortgage
Less than 2.0x
0 (0.0%)
0 (0.0%)
2.0x to 2.9x
0 (0.0%)
0 (0.0%)
3.0x to 3.9x
3 (27.3%)
0 (0.0%)
4.0x or more
8 (72.7%)
0 (0.0%)
Total
11 (100.0%)
0 (0.0%)
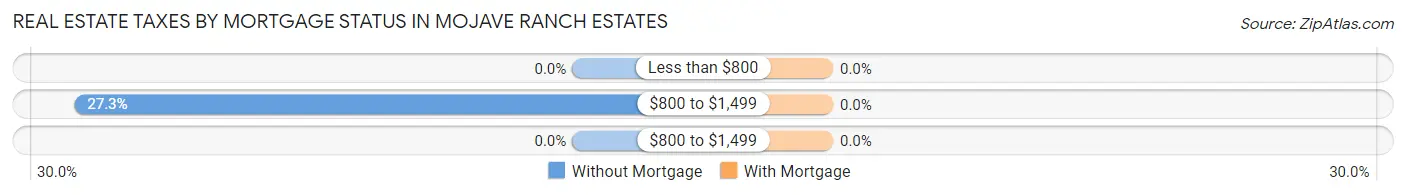
Real Estate Taxes by Mortgage Status in Mojave Ranch Estates
Property Taxes
Without Mortgage
With Mortgage
Less than $800
0 (0.0%)
0 (0.0%)
$800 to $1,499
3 (27.3%)
0 (0.0%)
$800 to $1,499
0 (0.0%)
0 (0.0%)
Total
11 (100.0%)
0 (0.0%)
Health & Disability in Mojave Ranch Estates
Health Insurance Coverage by Age in Mojave Ranch Estates
Age Bracket
With Coverage
Without Coverage
Under 6 Years
5 (50.0%)
5 (50.0%)
6 to 18 Years
9 (100.0%)
0 (0.0%)
19 to 25 Years
4 (100.0%)
0 (0.0%)
26 to 34 Years
5 (100.0%)
0 (0.0%)
35 to 44 Years
3 (100.0%)
0 (0.0%)
45 to 54 Years
0 (0.0%)
0 (0.0%)
55 to 64 Years
0 (0.0%)
0 (0.0%)
65 to 74 Years
8 (100.0%)
0 (0.0%)
75 Years and older
0 (0.0%)
0 (0.0%)
Total
34 (87.2%)
5 (12.8%)
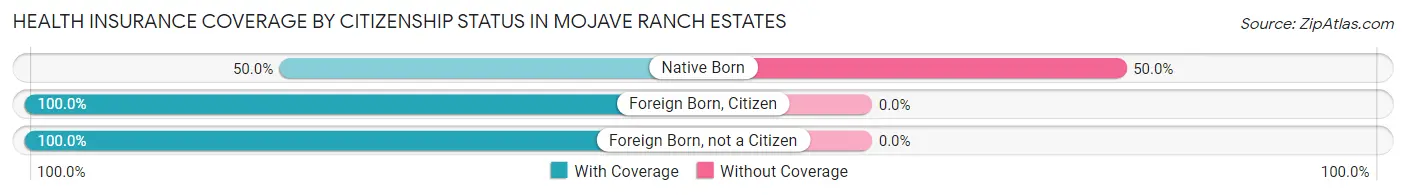
Health Insurance Coverage by Citizenship Status in Mojave Ranch Estates
Citizenship Status
With Coverage
Without Coverage
Native Born
5 (50.0%)
5 (50.0%)
Foreign Born, Citizen
9 (100.0%)
0 (0.0%)
Foreign Born, not a Citizen
4 (100.0%)
0 (0.0%)
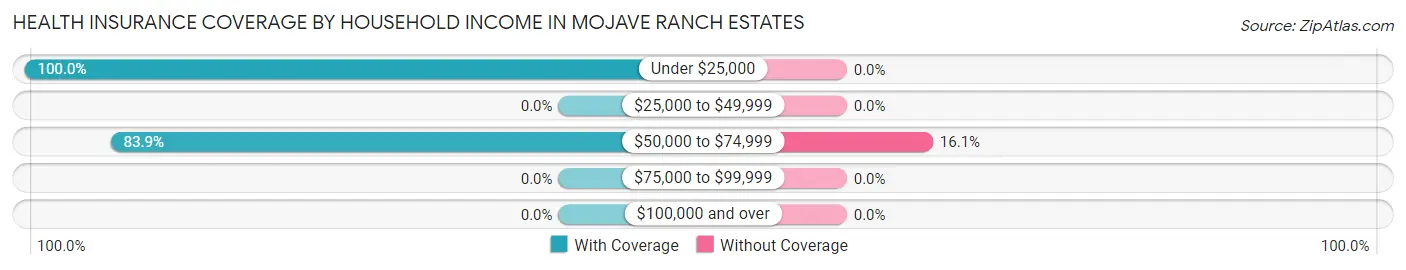
Health Insurance Coverage by Household Income in Mojave Ranch Estates
Household Income
With Coverage
Without Coverage
Under $25,000
8 (100.0%)
0 (0.0%)
$25,000 to $49,999
0 (0.0%)
0 (0.0%)
$50,000 to $74,999
26 (83.9%)
5 (16.1%)
$75,000 to $99,999
0 (0.0%)
0 (0.0%)
$100,000 and over
0 (0.0%)
0 (0.0%)
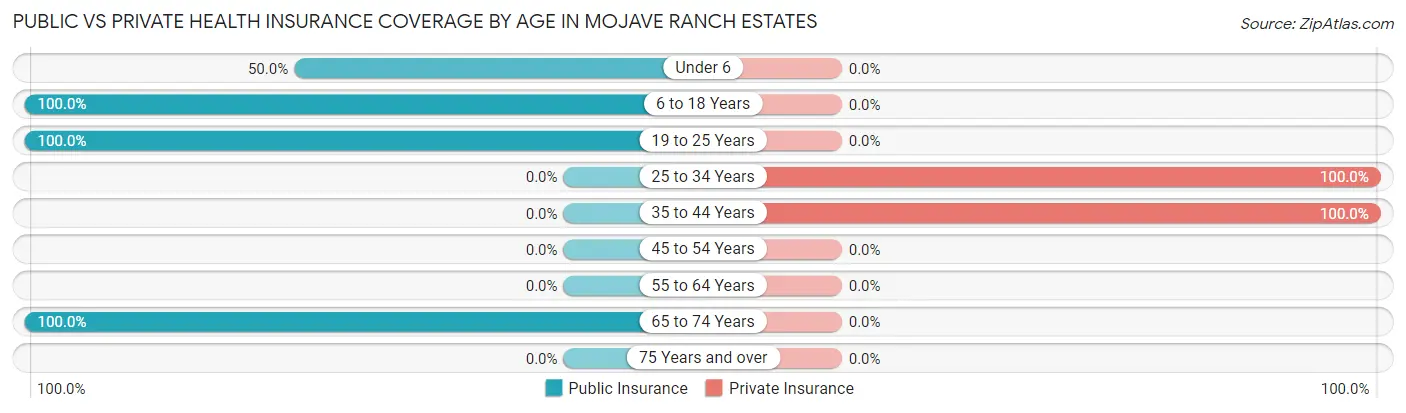
Public vs Private Health Insurance Coverage by Age in Mojave Ranch Estates
Age Bracket
Public Insurance
Private Insurance
Under 6
5 (50.0%)
0 (0.0%)
6 to 18 Years
9 (100.0%)
0 (0.0%)
19 to 25 Years
4 (100.0%)
0 (0.0%)
25 to 34 Years
0 (0.0%)
5 (100.0%)
35 to 44 Years
0 (0.0%)
3 (100.0%)
45 to 54 Years
0 (0.0%)
0 (0.0%)
55 to 64 Years
0 (0.0%)
0 (0.0%)
65 to 74 Years
8 (100.0%)
0 (0.0%)
75 Years and over
0 (0.0%)
0 (0.0%)
Total
26 (66.7%)
8 (20.5%)
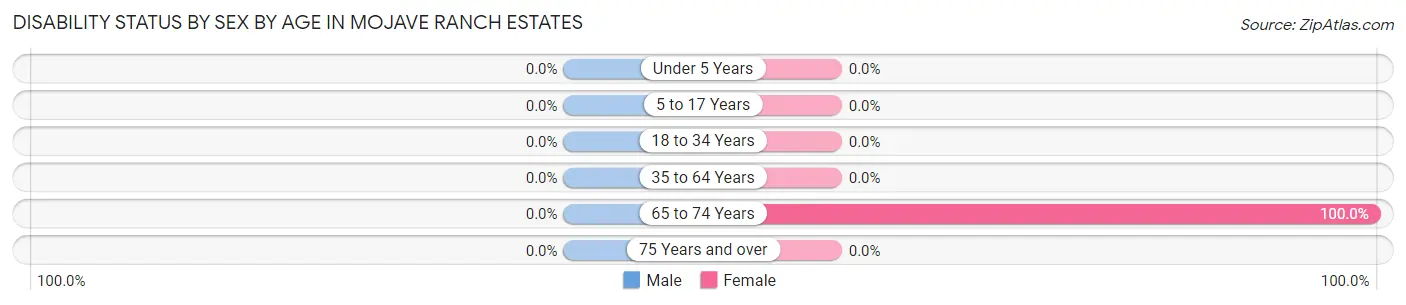
Disability Status by Sex by Age in Mojave Ranch Estates
Age Bracket
Male
Female
Under 5 Years
0 (0.0%)
0 (0.0%)
5 to 17 Years
0 (0.0%)
0 (0.0%)
18 to 34 Years
0 (0.0%)
0 (0.0%)
35 to 64 Years
0 (0.0%)
0 (0.0%)
65 to 74 Years
0 (0.0%)
8 (100.0%)
75 Years and over
0 (0.0%)
0 (0.0%)
Disability Class by Sex by Age in Mojave Ranch Estates
Disability Class: Hearing Difficulty
Age Bracket
Male
Female
Under 5 Years
0 (0.0%)
0 (0.0%)
5 to 17 Years
0 (0.0%)
0 (0.0%)
18 to 34 Years
0 (0.0%)
0 (0.0%)
35 to 64 Years
0 (0.0%)
0 (0.0%)
65 to 74 Years
0 (0.0%)
8 (100.0%)
75 Years and over
0 (0.0%)
0 (0.0%)
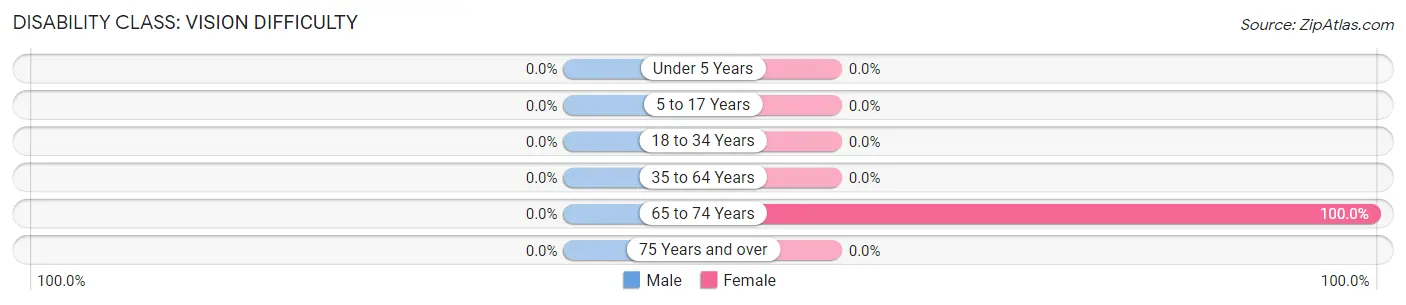
Disability Class: Vision Difficulty
Age Bracket
Male
Female
Under 5 Years
0 (0.0%)
0 (0.0%)
5 to 17 Years
0 (0.0%)
0 (0.0%)
18 to 34 Years
0 (0.0%)
0 (0.0%)
35 to 64 Years
0 (0.0%)
0 (0.0%)
65 to 74 Years
0 (0.0%)
8 (100.0%)
75 Years and over
0 (0.0%)
0 (0.0%)
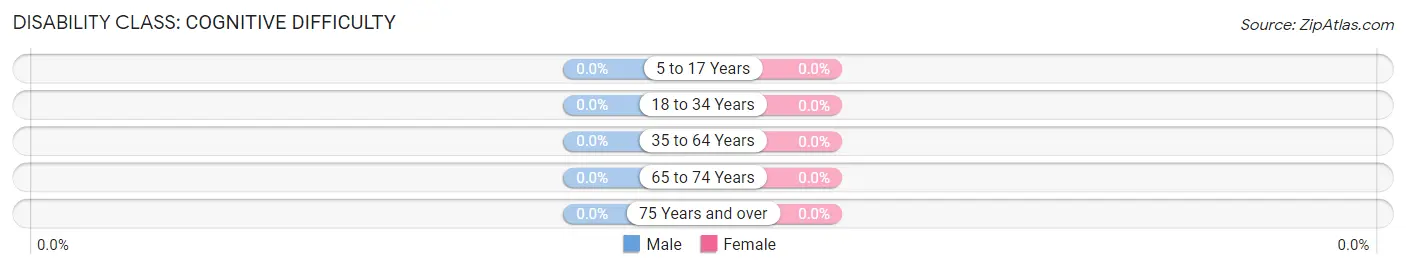
Disability Class: Cognitive Difficulty
Age Bracket
Male
Female
5 to 17 Years
0 (0.0%)
0 (0.0%)
18 to 34 Years
0 (0.0%)
0 (0.0%)
35 to 64 Years
0 (0.0%)
0 (0.0%)
65 to 74 Years
0 (0.0%)
0 (0.0%)
75 Years and over
0 (0.0%)
0 (0.0%)
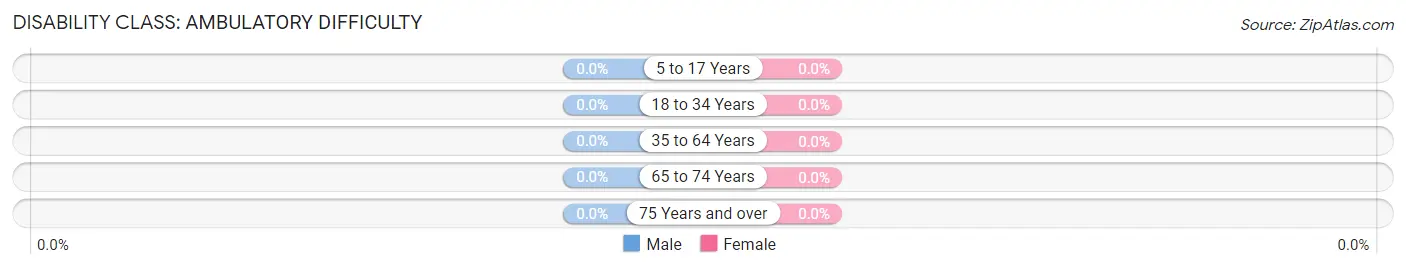
Disability Class: Ambulatory Difficulty
Age Bracket
Male
Female
5 to 17 Years
0 (0.0%)
0 (0.0%)
18 to 34 Years
0 (0.0%)
0 (0.0%)
35 to 64 Years
0 (0.0%)
0 (0.0%)
65 to 74 Years
0 (0.0%)
0 (0.0%)
75 Years and over
0 (0.0%)
0 (0.0%)
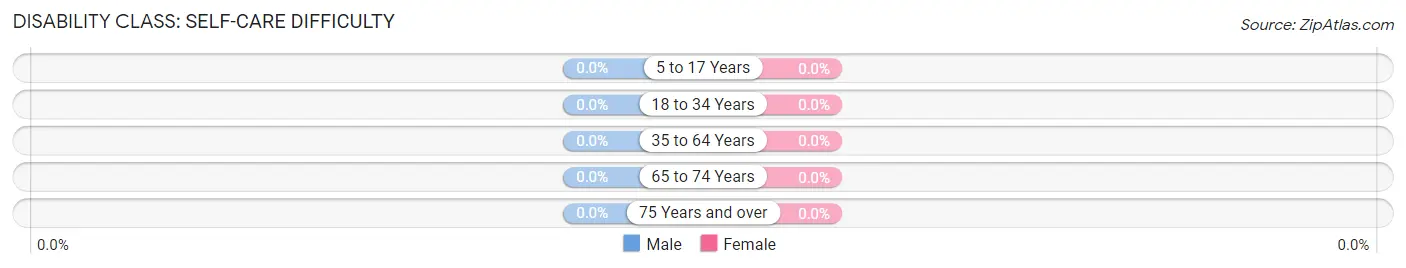
Disability Class: Self-Care Difficulty
Age Bracket
Male
Female
5 to 17 Years
0 (0.0%)
0 (0.0%)
18 to 34 Years
0 (0.0%)
0 (0.0%)
35 to 64 Years
0 (0.0%)
0 (0.0%)
65 to 74 Years
0 (0.0%)
0 (0.0%)
75 Years and over
0 (0.0%)
0 (0.0%)
Technology Access in Mojave Ranch Estates
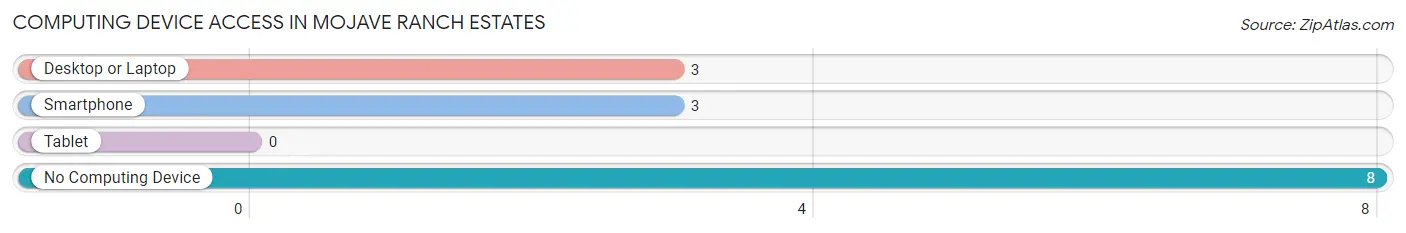
Computing Device Access in Mojave Ranch Estates
Device Type
# Households
% Households
Desktop or Laptop
3
27.3%
Smartphone
3
27.3%
Tablet
0
0.0%
No Computing Device
8
72.7%
Total
11
100.0%
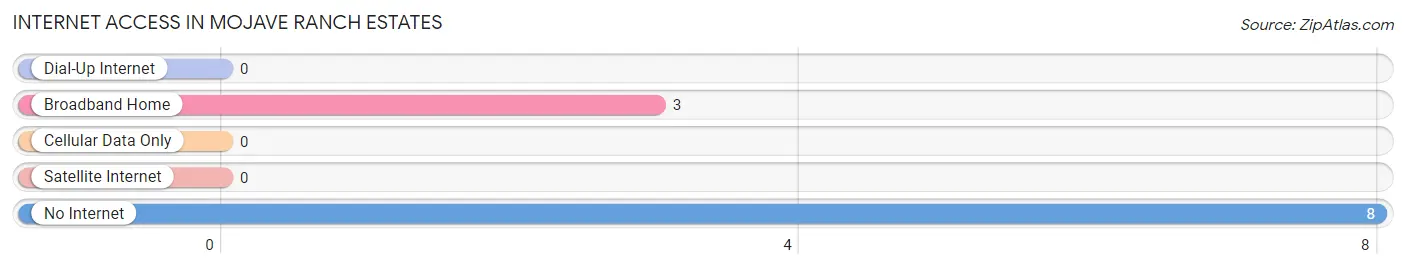
Internet Access in Mojave Ranch Estates
Internet Type
# Households
% Households
Dial-Up Internet
0
0.0%
Broadband Home
3
27.3%
Cellular Data Only
0
0.0%
Satellite Internet
0
0.0%
No Internet
8
72.7%
Total
11
100.0%
Mojave Ranch Estates Summary
Mojave Ranch Estates is a census-designated place (CDP) located in Yavapai County, Arizona. It is situated in the foothills of the Bradshaw Mountains, approximately 25 miles south of Prescott. The CDP has a total area of 4.2 square miles, all of which is land. As of the 2010 census, the population of Mojave Ranch Estates was 1,845.
Geography
Mojave Ranch Estates is located in the foothills of the Bradshaw Mountains, approximately 25 miles south of Prescott. The CDP has a total area of 4.2 square miles, all of which is land. The terrain is mostly flat, with some rolling hills. The elevation ranges from 4,400 to 5,000 feet above sea level. The climate is semi-arid, with hot summers and mild winters.
Economy
Mojave Ranch Estates is primarily a residential community, with no major industries or businesses. The majority of the population is employed in the service sector, with many working in the nearby cities of Prescott and Phoenix. The median household income in Mojave Ranch Estates is $45,000, slightly lower than the state average.
Demographics
As of the 2010 census, the population of Mojave Ranch Estates was 1,845. The racial makeup of the CDP was 94.3% White, 0.7% African American, 0.7% Native American, 0.7% Asian, 0.1% Pacific Islander, 1.7% from other races, and 1.7% from two or more races. Hispanic or Latino of any race were 5.2% of the population.
The median age in Mojave Ranch Estates is 48.2 years, slightly higher than the state average. The median household income is $45,000, slightly lower than the state average. The per capita income is $25,000, slightly lower than the state average.
History
Mojave Ranch Estates was first settled in the late 1800s by ranchers and farmers. The area was originally part of the Yavapai County, but was annexed by Maricopa County in the early 1900s. The area was then re-annexed by Yavapai County in the late 1950s.
In the early 2000s, the area was developed into a residential community. The CDP was officially established in 2010, when the population was 1,845. Since then, the population has grown steadily, and the area has become a popular destination for retirees and second-home owners.
Common Questions
What is the Total Population of Mojave Ranch Estates?
Total Population of Mojave Ranch Estates is 39.
What is the Total Male Population of Mojave Ranch Estates?
Total Male Population of Mojave Ranch Estates is 12.
What is the Total Female Population of Mojave Ranch Estates?
Total Female Population of Mojave Ranch Estates is 27.
What is the Ratio of Males per 100 Females in Mojave Ranch Estates?
There are 44.44 Males per 100 Females in Mojave Ranch Estates.
What is the Ratio of Females per 100 Males in Mojave Ranch Estates?
There are 225.00 Females per 100 Males in Mojave Ranch Estates.
What is the Median Population Age in Mojave Ranch Estates?
Median Population Age in Mojave Ranch Estates is 21.1 Years.
What is the Average Family Size in Mojave Ranch Estates
Average Family Size in Mojave Ranch Estates is 10.3 People.
What is the Average Household Size in Mojave Ranch Estates
Average Household Size in Mojave Ranch Estates is 3.5 People.
What is Inequality or Gini Index in Mojave Ranch Estates?
Inequality or Gini Index in Mojave Ranch Estates is 0.34.
How Large is the Labor Force in Mojave Ranch Estates?
There are 3 People in the Labor Forcein in Mojave Ranch Estates.
What is the Percentage of People in the Labor Force in Mojave Ranch Estates?
11.5% of People are in the Labor Force in Mojave Ranch Estates.
Report Title
Report Link
HTML Copy & Paste Link
Social Media
Copy and paste the folowing code into any webpage where you would like this interactive chart to display