Zip Codes with the Highest Percentage of Population Employed in Administrative & Support Services in Maricopa, AZ
RELATED REPORTS & OPTIONS
Administrative & Support Services
Maricopa
Compare Zip Codes
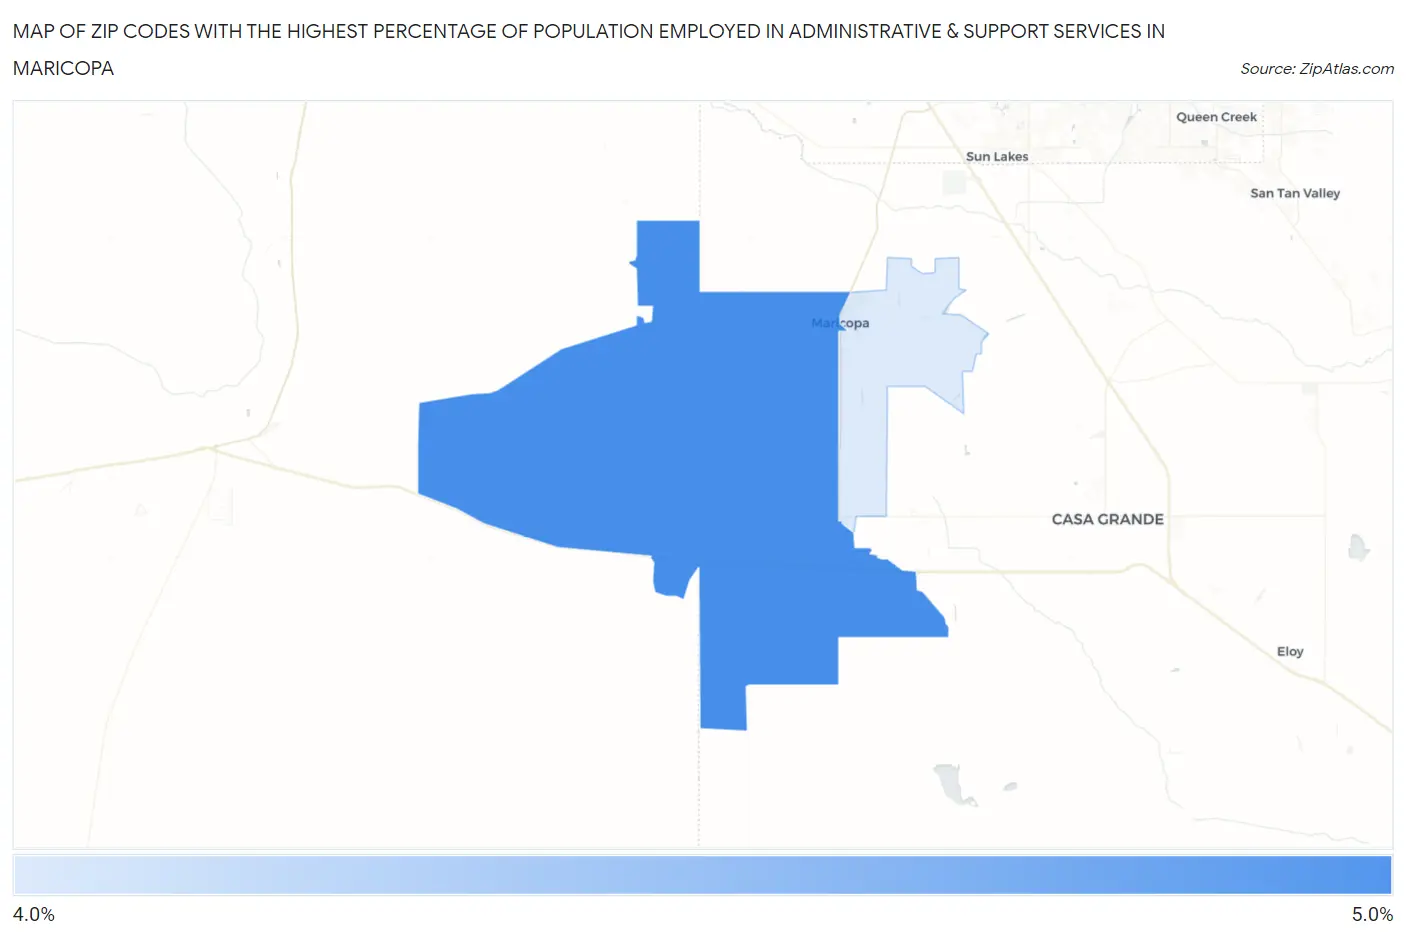
Map of Zip Codes with the Highest Percentage of Population Employed in Administrative & Support Services in Maricopa
0.0%
5.0%
Zip Codes with the Highest Percentage of Population Employed in Administrative & Support Services in Maricopa, AZ
| Zip Code | % Employed | vs State | vs National | |
| 1. | 85139 | 4.9% | 5.4%(-0.482)#151 | 4.1%(+0.722)#7,494 |
| 2. | 85138 | 4.8% | 5.4%(-0.523)#156 | 4.1%(+0.682)#7,622 |
1
Common Questions
What are the Top Zip Codes with the Highest Percentage of Population Employed in Administrative & Support Services in Maricopa, AZ?
Top Zip Codes with the Highest Percentage of Population Employed in Administrative & Support Services in Maricopa, AZ are:
What zip code has the Highest Percentage of Population Employed in Administrative & Support Services in Maricopa, AZ?
85139 has the Highest Percentage of Population Employed in Administrative & Support Services in Maricopa, AZ with 4.9%.
What is the Percentage of Population Employed in Administrative & Support Services in Maricopa, AZ?
Percentage of Population Employed in Administrative & Support Services in Maricopa is 5.1%.
What is the Percentage of Population Employed in Administrative & Support Services in Arizona?
Percentage of Population Employed in Administrative & Support Services in Arizona is 5.4%.
What is the Percentage of Population Employed in Administrative & Support Services in the United States?
Percentage of Population Employed in Administrative & Support Services in the United States is 4.1%.