Zip Codes with the Highest Percentage of Population Employed in Farming, Fishing & Forestry in Maricopa, AZ
RELATED REPORTS & OPTIONS
Farming, Fishing & Forestry
Maricopa
Compare Zip Codes
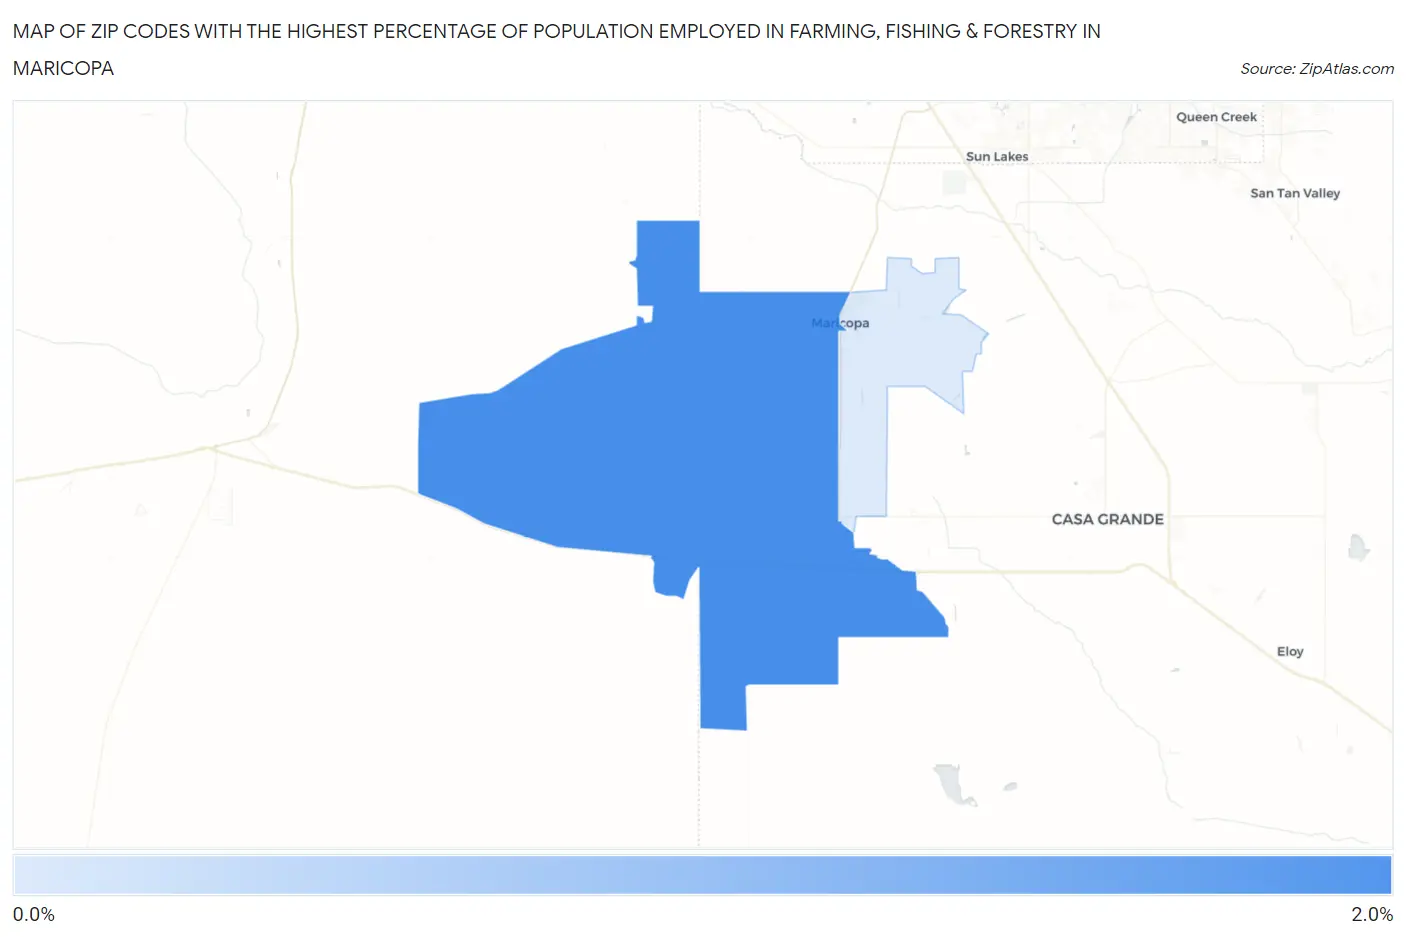
Map of Zip Codes with the Highest Percentage of Population Employed in Farming, Fishing & Forestry in Maricopa
0.0%
2.0%
Zip Codes with the Highest Percentage of Population Employed in Farming, Fishing & Forestry in Maricopa, AZ
| Zip Code | % Employed | vs State | vs National | |
| 1. | 85139 | 1.7% | 0.51%(+1.16)#52 | 0.61%(+1.06)#7,374 |
| 2. | 85138 | 0.70% | 0.51%(+0.192)#88 | 0.61%(+0.094)#11,387 |
1
Common Questions
What are the Top Zip Codes with the Highest Percentage of Population Employed in Farming, Fishing & Forestry in Maricopa, AZ?
Top Zip Codes with the Highest Percentage of Population Employed in Farming, Fishing & Forestry in Maricopa, AZ are:
What zip code has the Highest Percentage of Population Employed in Farming, Fishing & Forestry in Maricopa, AZ?
85139 has the Highest Percentage of Population Employed in Farming, Fishing & Forestry in Maricopa, AZ with 1.7%.
What is the Percentage of Population Employed in Farming, Fishing & Forestry in Maricopa, AZ?
Percentage of Population Employed in Farming, Fishing & Forestry in Maricopa is 0.49%.
What is the Percentage of Population Employed in Farming, Fishing & Forestry in Arizona?
Percentage of Population Employed in Farming, Fishing & Forestry in Arizona is 0.51%.
What is the Percentage of Population Employed in Farming, Fishing & Forestry in the United States?
Percentage of Population Employed in Farming, Fishing & Forestry in the United States is 0.61%.