Zip Codes with the Highest Percentage of Population Employed in Accommodation & Food Services in Maricopa, AZ
RELATED REPORTS & OPTIONS
Accommodation & Food Services
Maricopa
Compare Zip Codes
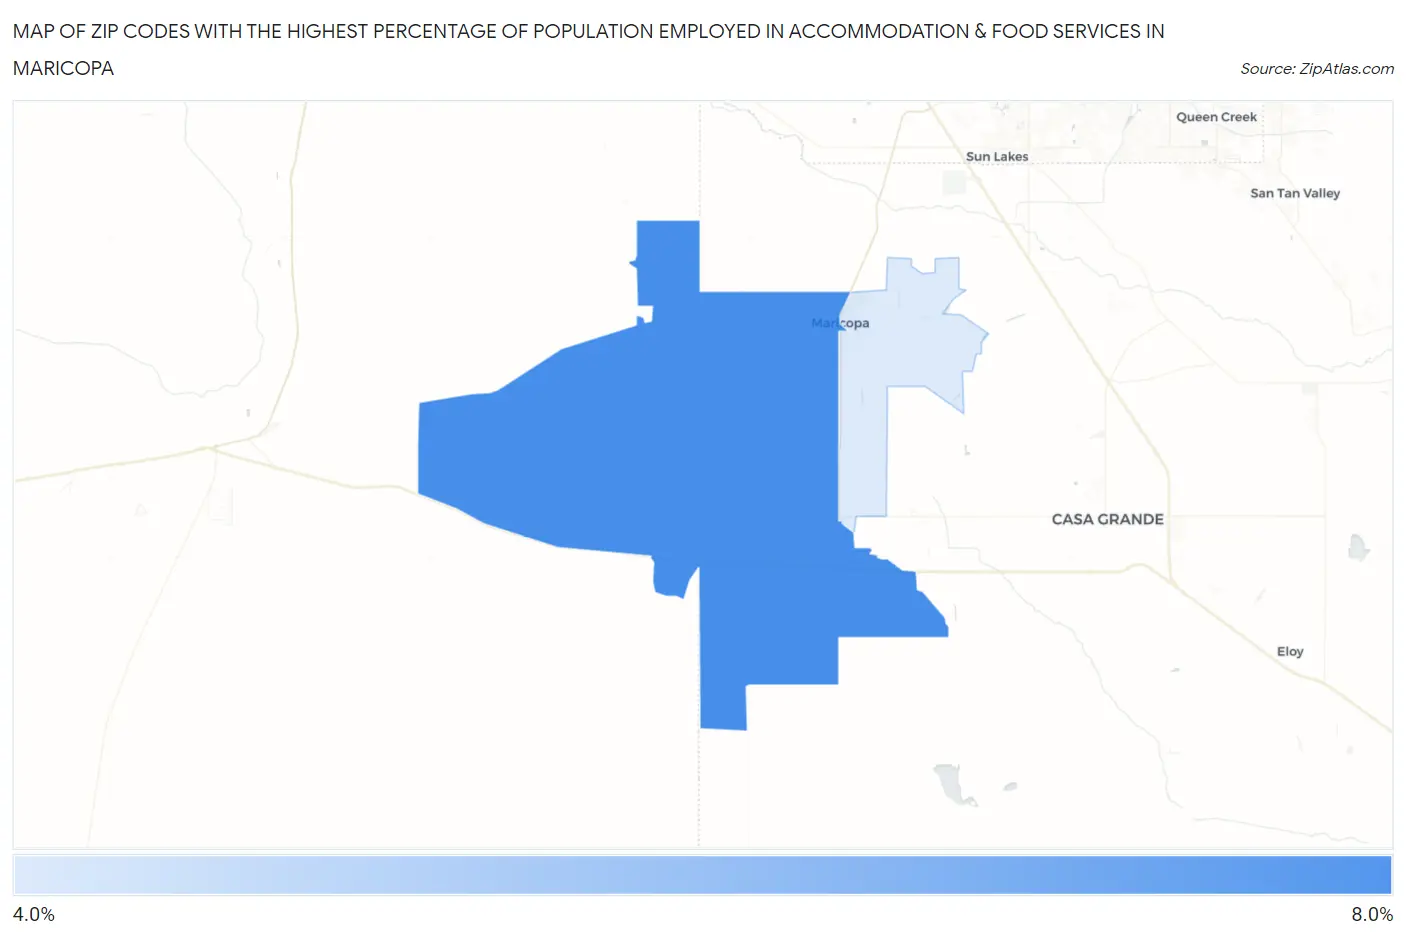
Map of Zip Codes with the Highest Percentage of Population Employed in Accommodation & Food Services in Maricopa
0.0%
8.0%
Zip Codes with the Highest Percentage of Population Employed in Accommodation & Food Services in Maricopa, AZ
| Zip Code | % Employed | vs State | vs National | |
| 1. | 85139 | 6.6% | 7.6%(-0.990)#211 | 6.9%(-0.317)#11,636 |
| 2. | 85138 | 4.8% | 7.6%(-2.71)#289 | 6.9%(-2.04)#17,347 |
1
Common Questions
What are the Top Zip Codes with the Highest Percentage of Population Employed in Accommodation & Food Services in Maricopa, AZ?
Top Zip Codes with the Highest Percentage of Population Employed in Accommodation & Food Services in Maricopa, AZ are:
What zip code has the Highest Percentage of Population Employed in Accommodation & Food Services in Maricopa, AZ?
85139 has the Highest Percentage of Population Employed in Accommodation & Food Services in Maricopa, AZ with 6.6%.
What is the Percentage of Population Employed in Accommodation & Food Services in Maricopa, AZ?
Percentage of Population Employed in Accommodation & Food Services in Maricopa is 5.5%.
What is the Percentage of Population Employed in Accommodation & Food Services in Arizona?
Percentage of Population Employed in Accommodation & Food Services in Arizona is 7.6%.
What is the Percentage of Population Employed in Accommodation & Food Services in the United States?
Percentage of Population Employed in Accommodation & Food Services in the United States is 6.9%.