Lake Montezuma, AZ
Lake Montezuma Map
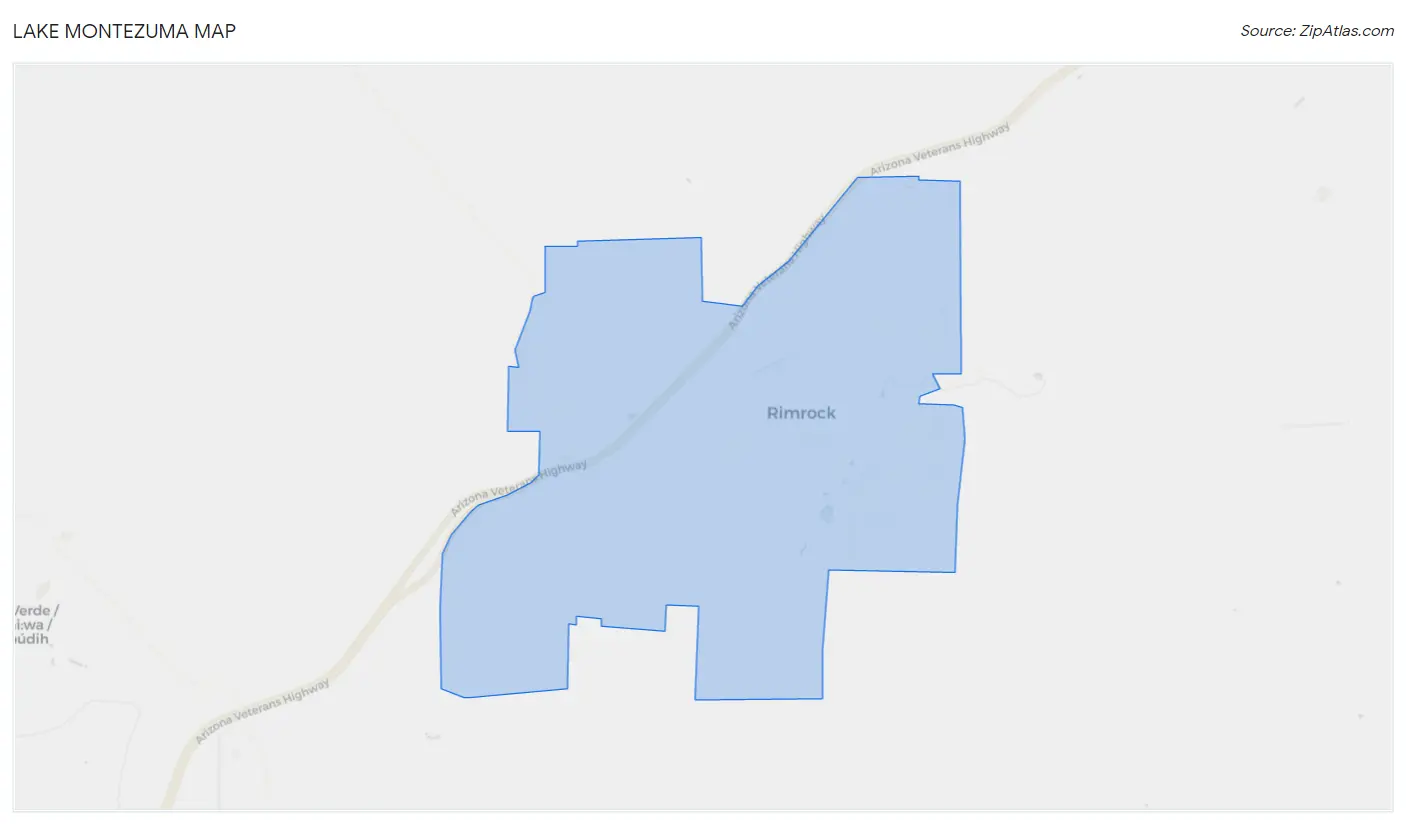
Lake Montezuma Overview
4,526
TOTAL POPULATION
2,265
MALE POPULATION
2,261
FEMALE POPULATION
100.18
MALES / 100 FEMALES
99.82
FEMALES / 100 MALES
61.8
MEDIAN AGE
2.3
AVG FAMILY SIZE
1.8
AVG HOUSEHOLD SIZE
$36,807
PER CAPITA INCOME
$78,231
AVG FAMILY INCOME
$57,575
AVG HOUSEHOLD INCOME
0.40
INEQUALITY / GINI INDEX
1,799
LABOR FORCE [ PEOPLE ]
42.1%
PERCENT IN LABOR FORCE
2.8%
UNEMPLOYMENT RATE
Lake Montezuma Area Codes
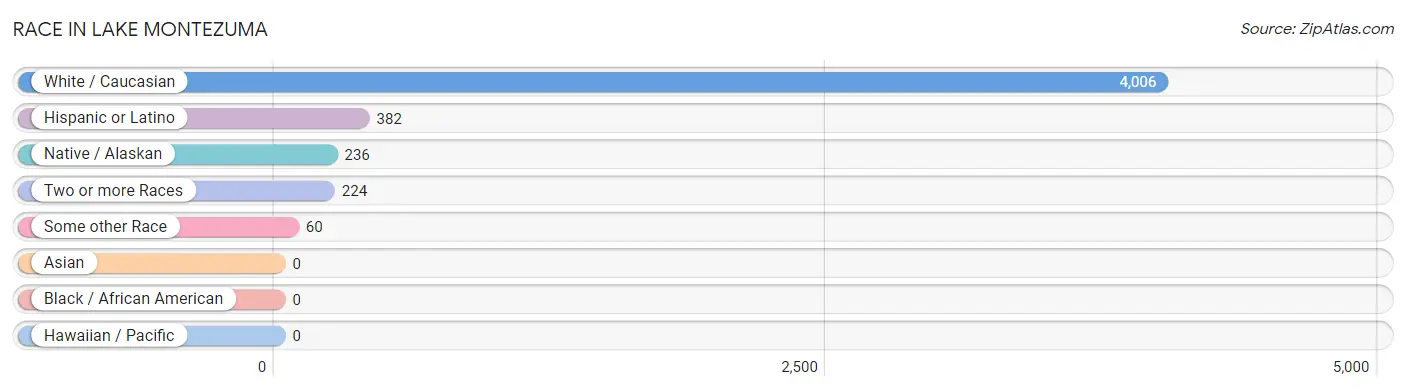
Race in Lake Montezuma
The most populous races in Lake Montezuma are White / Caucasian (4,006 | 88.5%), Hispanic or Latino (382 | 8.4%), and Native / Alaskan (236 | 5.2%).
| Race | # Population | % Population |
| Asian | 0 | 0.0% |
| Black / African American | 0 | 0.0% |
| Hawaiian / Pacific | 0 | 0.0% |
| Hispanic or Latino | 382 | 8.4% |
| Native / Alaskan | 236 | 5.2% |
| White / Caucasian | 4,006 | 88.5% |
| Two or more Races | 224 | 5.0% |
| Some other Race | 60 | 1.3% |
| Total | 4,526 | 100.0% |
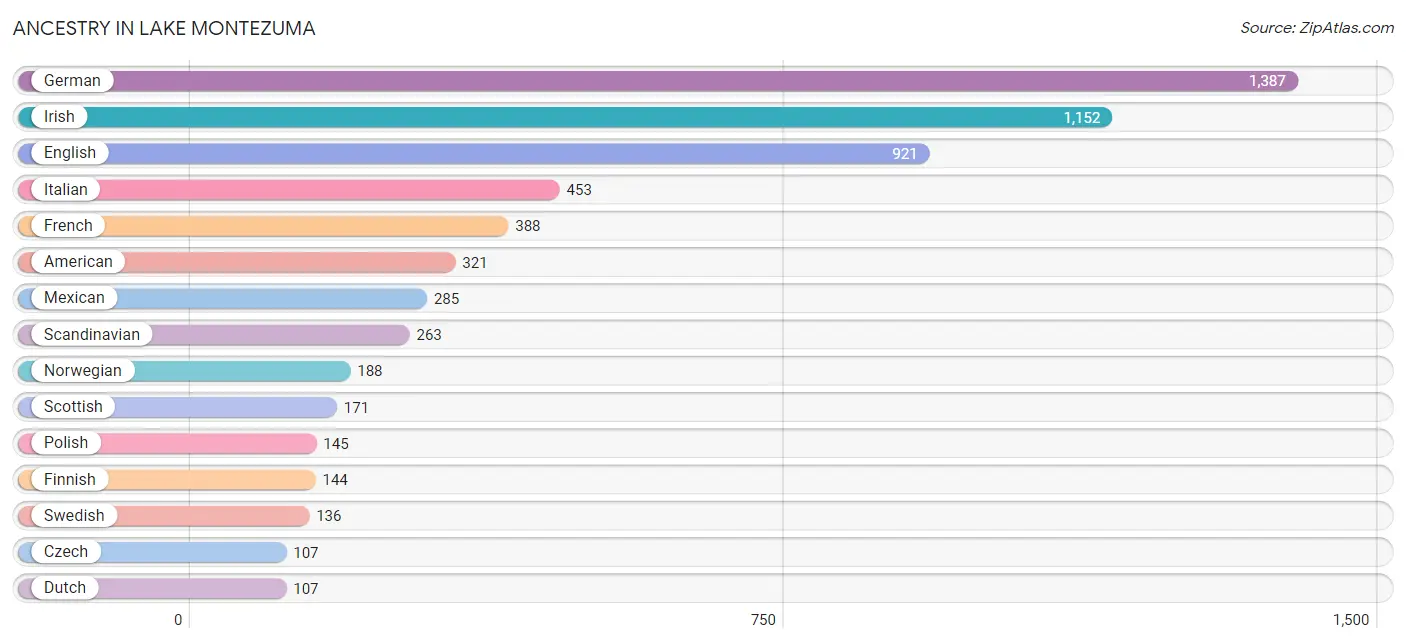
Ancestry in Lake Montezuma
The most populous ancestries reported in Lake Montezuma are German (1,387 | 30.6%), Irish (1,152 | 25.5%), English (921 | 20.3%), Italian (453 | 10.0%), and French (388 | 8.6%), together accounting for 95.0% of all Lake Montezuma residents.
| Ancestry | # Population | % Population |
| American | 321 | 7.1% |
| Argentinean | 19 | 0.4% |
| Australian | 18 | 0.4% |
| Cherokee | 78 | 1.7% |
| Choctaw | 42 | 0.9% |
| Cuban | 56 | 1.2% |
| Czech | 107 | 2.4% |
| Dutch | 107 | 2.4% |
| English | 921 | 20.3% |
| European | 24 | 0.5% |
| Finnish | 144 | 3.2% |
| French | 388 | 8.6% |
| French Canadian | 4 | 0.1% |
| German | 1,387 | 30.6% |
| Greek | 28 | 0.6% |
| Irish | 1,152 | 25.5% |
| Italian | 453 | 10.0% |
| Mexican | 285 | 6.3% |
| Norwegian | 188 | 4.2% |
| Polish | 145 | 3.2% |
| Puerto Rican | 22 | 0.5% |
| Romanian | 4 | 0.1% |
| Scandinavian | 263 | 5.8% |
| Scotch-Irish | 97 | 2.1% |
| Scottish | 171 | 3.8% |
| South American | 19 | 0.4% |
| Swedish | 136 | 3.0% |
| Swiss | 10 | 0.2% |
| Ukrainian | 8 | 0.2% |
| Welsh | 67 | 1.5% | View All 30 Rows |
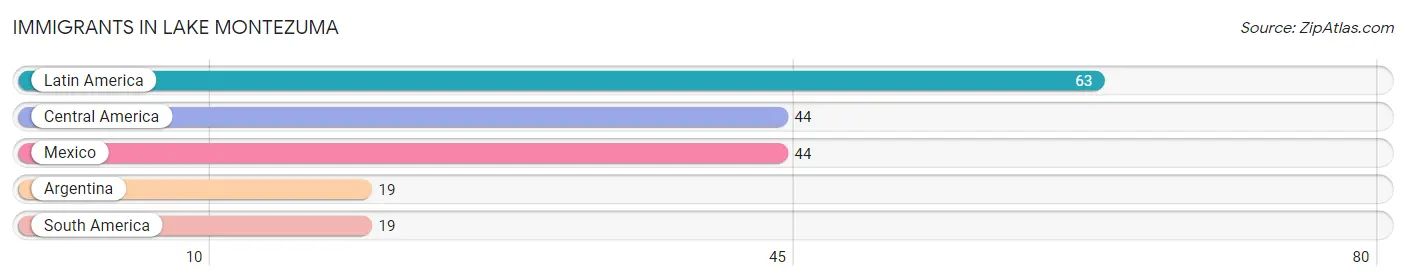
Immigrants in Lake Montezuma
The most numerous immigrant groups reported in Lake Montezuma came from Latin America (63 | 1.4%), Central America (44 | 1.0%), Mexico (44 | 1.0%), Argentina (19 | 0.4%), and South America (19 | 0.4%), together accounting for 4.2% of all Lake Montezuma residents.
| Immigration Origin | # Population | % Population |
| Argentina | 19 | 0.4% |
| Central America | 44 | 1.0% |
| Latin America | 63 | 1.4% |
| Mexico | 44 | 1.0% |
| South America | 19 | 0.4% | View All 5 Rows |
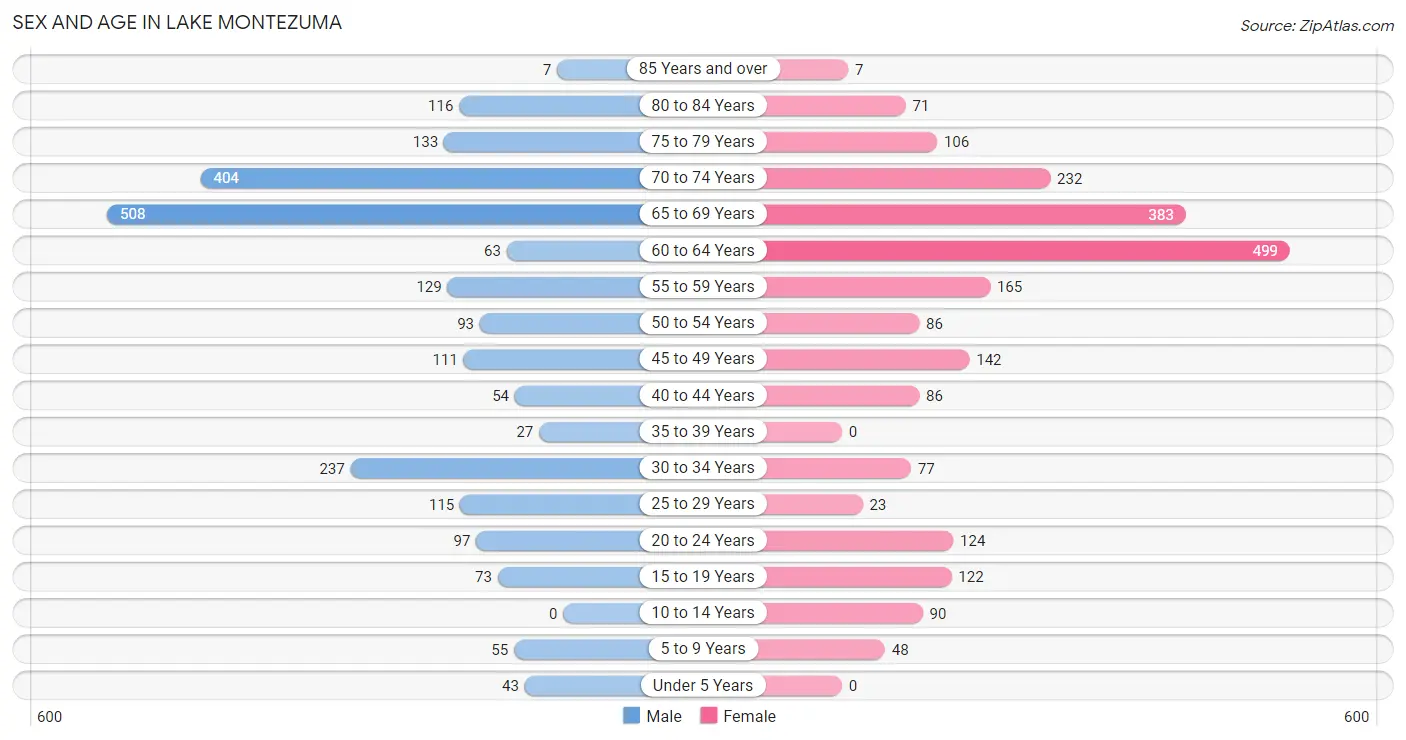
Sex and Age in Lake Montezuma
Sex and Age in Lake Montezuma
The most populous age groups in Lake Montezuma are 65 to 69 Years (508 | 22.4%) for men and 60 to 64 Years (499 | 22.1%) for women.
| Age Bracket | Male | Female |
| Under 5 Years | 43 (1.9%) | 0 (0.0%) |
| 5 to 9 Years | 55 (2.4%) | 48 (2.1%) |
| 10 to 14 Years | 0 (0.0%) | 90 (4.0%) |
| 15 to 19 Years | 73 (3.2%) | 122 (5.4%) |
| 20 to 24 Years | 97 (4.3%) | 124 (5.5%) |
| 25 to 29 Years | 115 (5.1%) | 23 (1.0%) |
| 30 to 34 Years | 237 (10.5%) | 77 (3.4%) |
| 35 to 39 Years | 27 (1.2%) | 0 (0.0%) |
| 40 to 44 Years | 54 (2.4%) | 86 (3.8%) |
| 45 to 49 Years | 111 (4.9%) | 142 (6.3%) |
| 50 to 54 Years | 93 (4.1%) | 86 (3.8%) |
| 55 to 59 Years | 129 (5.7%) | 165 (7.3%) |
| 60 to 64 Years | 63 (2.8%) | 499 (22.1%) |
| 65 to 69 Years | 508 (22.4%) | 383 (16.9%) |
| 70 to 74 Years | 404 (17.8%) | 232 (10.3%) |
| 75 to 79 Years | 133 (5.9%) | 106 (4.7%) |
| 80 to 84 Years | 116 (5.1%) | 71 (3.1%) |
| 85 Years and over | 7 (0.3%) | 7 (0.3%) |
| Total | 2,265 (100.0%) | 2,261 (100.0%) |
Families and Households in Lake Montezuma
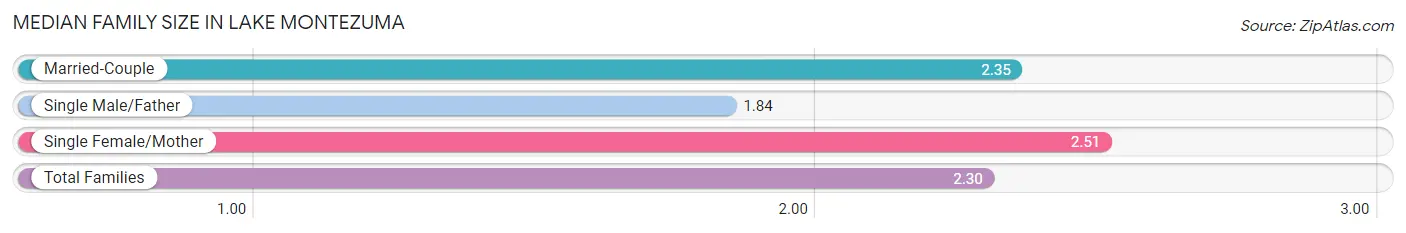
Median Family Size in Lake Montezuma
The median family size in Lake Montezuma is 2.30 persons per family, with single female/mother families (185 | 12.7%) accounting for the largest median family size of 2.51 persons per family. On the other hand, single male/father families (200 | 13.7%) represent the smallest median family size with 1.84 persons per family.
| Family Type | # Families | Family Size |
| Married-Couple | 1,076 (73.7%) | 2.35 |
| Single Male/Father | 200 (13.7%) | 1.84 |
| Single Female/Mother | 185 (12.7%) | 2.51 |
| Total Families | 1,461 (100.0%) | 2.30 |
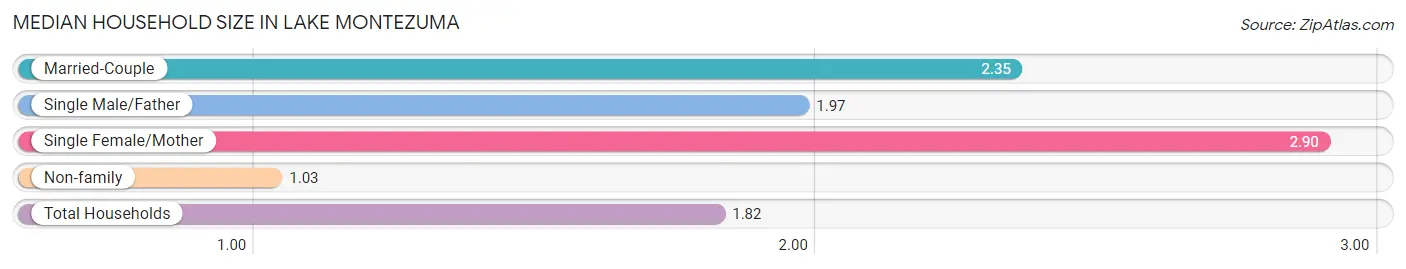
Median Household Size in Lake Montezuma
The median household size in Lake Montezuma is 1.82 persons per household, with single female/mother households (185 | 7.4%) accounting for the largest median household size of 2.9 persons per household. non-family households (1,030 | 41.3%) represent the smallest median household size with 1.03 persons per household.
| Household Type | # Households | Household Size |
| Married-Couple | 1,076 (43.2%) | 2.35 |
| Single Male/Father | 200 (8.0%) | 1.97 |
| Single Female/Mother | 185 (7.4%) | 2.90 |
| Non-family | 1,030 (41.3%) | 1.03 |
| Total Households | 2,491 (100.0%) | 1.82 |
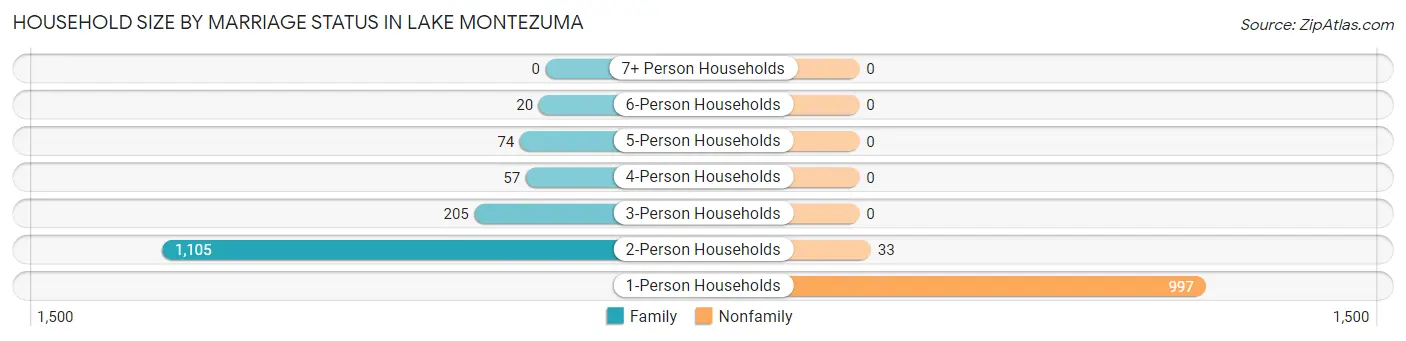
Household Size by Marriage Status in Lake Montezuma
Out of a total of 2,491 households in Lake Montezuma, 1,461 (58.7%) are family households, while 1,030 (41.3%) are nonfamily households. The most numerous type of family households are 2-person households, comprising 1,105, and the most common type of nonfamily households are 1-person households, comprising 997.
| Household Size | Family Households | Nonfamily Households |
| 1-Person Households | - | 997 (40.0%) |
| 2-Person Households | 1,105 (44.4%) | 33 (1.3%) |
| 3-Person Households | 205 (8.2%) | 0 (0.0%) |
| 4-Person Households | 57 (2.3%) | 0 (0.0%) |
| 5-Person Households | 74 (3.0%) | 0 (0.0%) |
| 6-Person Households | 20 (0.8%) | 0 (0.0%) |
| 7+ Person Households | 0 (0.0%) | 0 (0.0%) |
| Total | 1,461 (58.7%) | 1,030 (41.3%) |
Female Fertility in Lake Montezuma
Fertility by Age in Lake Montezuma
Average fertility rate in Lake Montezuma is 32.0 births per 1,000 women. Women in the age bracket of 20 to 34 years have the highest fertility rate with 85.0 births per 1,000 women. Women in the age bracket of 20 to 34 years acount for 100.0% of all women with births.
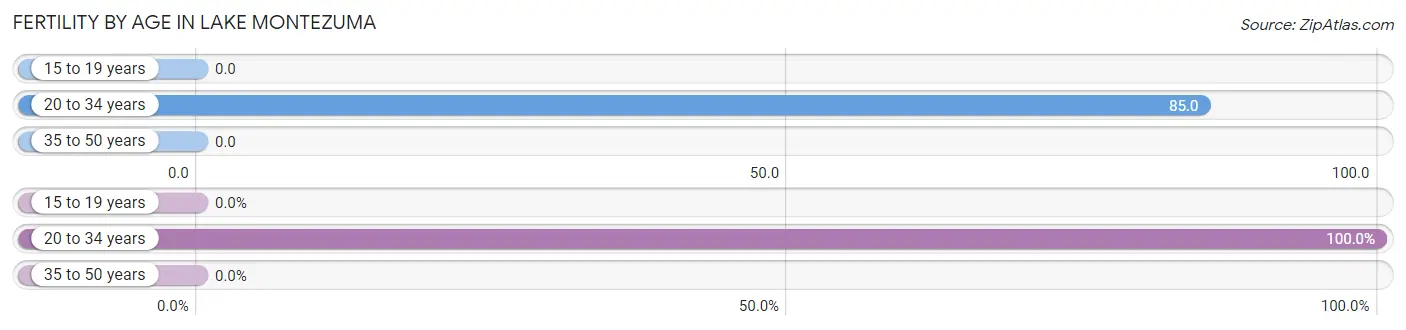
| Age Bracket | Women with Births | Births / 1,000 Women |
| 15 to 19 years | 0 (0.0%) | 0.0 |
| 20 to 34 years | 19 (100.0%) | 85.0 |
| 35 to 50 years | 0 (0.0%) | 0.0 |
| Total | 19 (100.0%) | 32.0 |
Fertility by Age by Marriage Status in Lake Montezuma
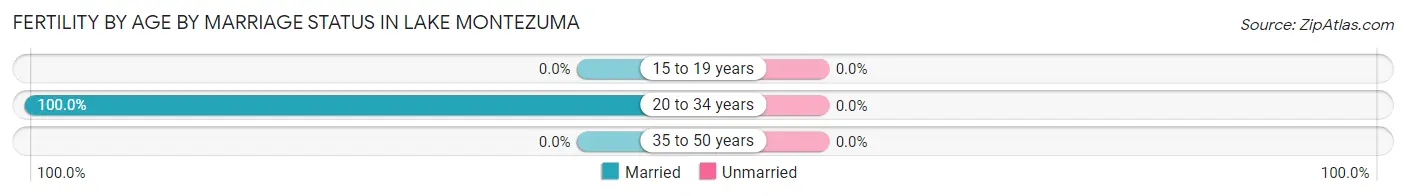
| Age Bracket | Married | Unmarried |
| 15 to 19 years | 0 (0.0%) | 0 (0.0%) |
| 20 to 34 years | 19 (100.0%) | 0 (0.0%) |
| 35 to 50 years | 0 (0.0%) | 0 (0.0%) |
| Total | 19 (100.0%) | 0 (0.0%) |
Fertility by Education in Lake Montezuma
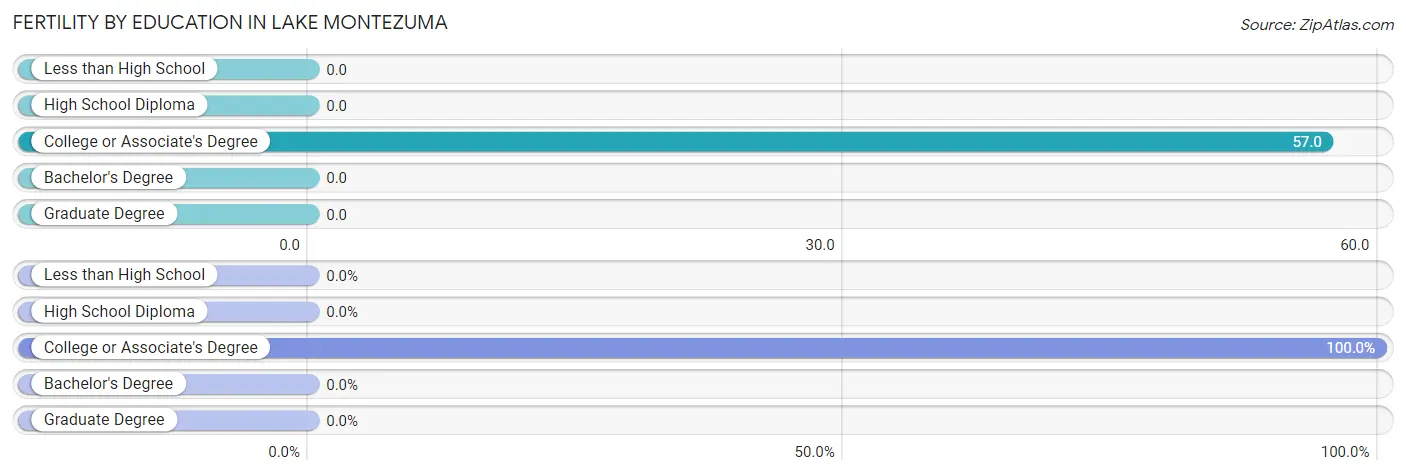
| Educational Attainment | Women with Births | Births / 1,000 Women |
| Less than High School | 0 (0.0%) | 0.0 |
| High School Diploma | 0 (0.0%) | 0.0 |
| College or Associate's Degree | 19 (100.0%) | 57.0 |
| Bachelor's Degree | 0 (0.0%) | 0.0 |
| Graduate Degree | 0 (0.0%) | 0.0 |
| Total | 19 (100.0%) | 32.0 |
Fertility by Education by Marriage Status in Lake Montezuma
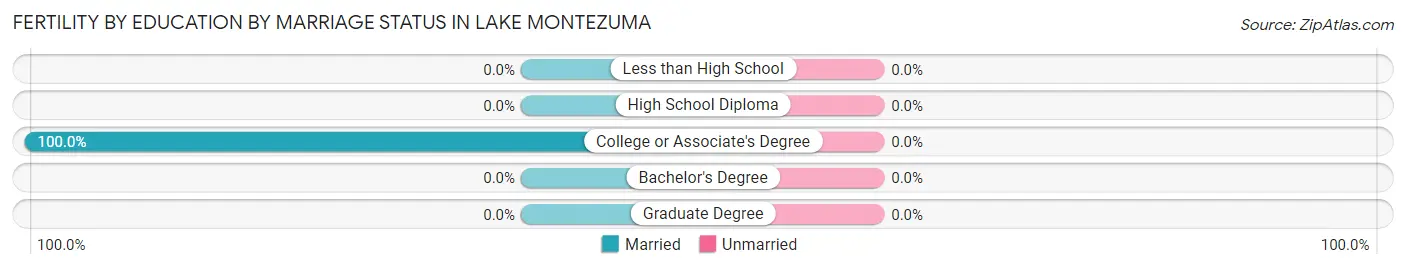
| Educational Attainment | Married | Unmarried |
| Less than High School | 0 (0.0%) | 0 (0.0%) |
| High School Diploma | 0 (0.0%) | 0 (0.0%) |
| College or Associate's Degree | 19 (100.0%) | 0 (0.0%) |
| Bachelor's Degree | 0 (0.0%) | 0 (0.0%) |
| Graduate Degree | 0 (0.0%) | 0 (0.0%) |
| Total | 19 (100.0%) | 0 (0.0%) |
Income in Lake Montezuma
Income Overview in Lake Montezuma
Per Capita Income in Lake Montezuma is $36,807, while median incomes of families and households are $78,231 and $57,575 respectively.
| Characteristic | Number | Measure |
| Per Capita Income | 4,526 | $36,807 |
| Median Family Income | 1,461 | $78,231 |
| Mean Family Income | 1,461 | $87,086 |
| Median Household Income | 2,491 | $57,575 |
| Mean Household Income | 2,491 | $66,968 |
| Income Deficit | 1,461 | $0 |
| Wage / Income Gap (%) | 4,526 | 0.00% |
| Wage / Income Gap ($) | 4,526 | 100.00¢ per $1 |
| Gini / Inequality Index | 4,526 | 0.40 |
Earnings by Sex in Lake Montezuma
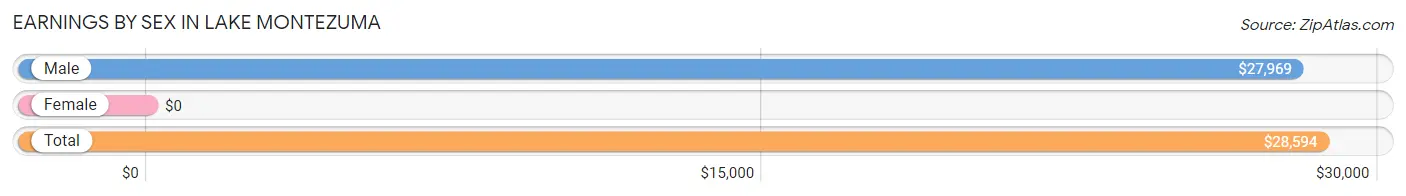
| Sex | Number | Average Earnings |
| Male | 1,039 (47.2%) | $27,969 |
| Female | 1,160 (52.7%) | $0 |
| Total | 2,199 (100.0%) | $28,594 |
Earnings by Sex by Income Bracket in Lake Montezuma
The most common earnings brackets in Lake Montezuma are $10,000 to $12,499 for men (204 | 19.6%) and $7,500 to $9,999 for women (143 | 12.3%).
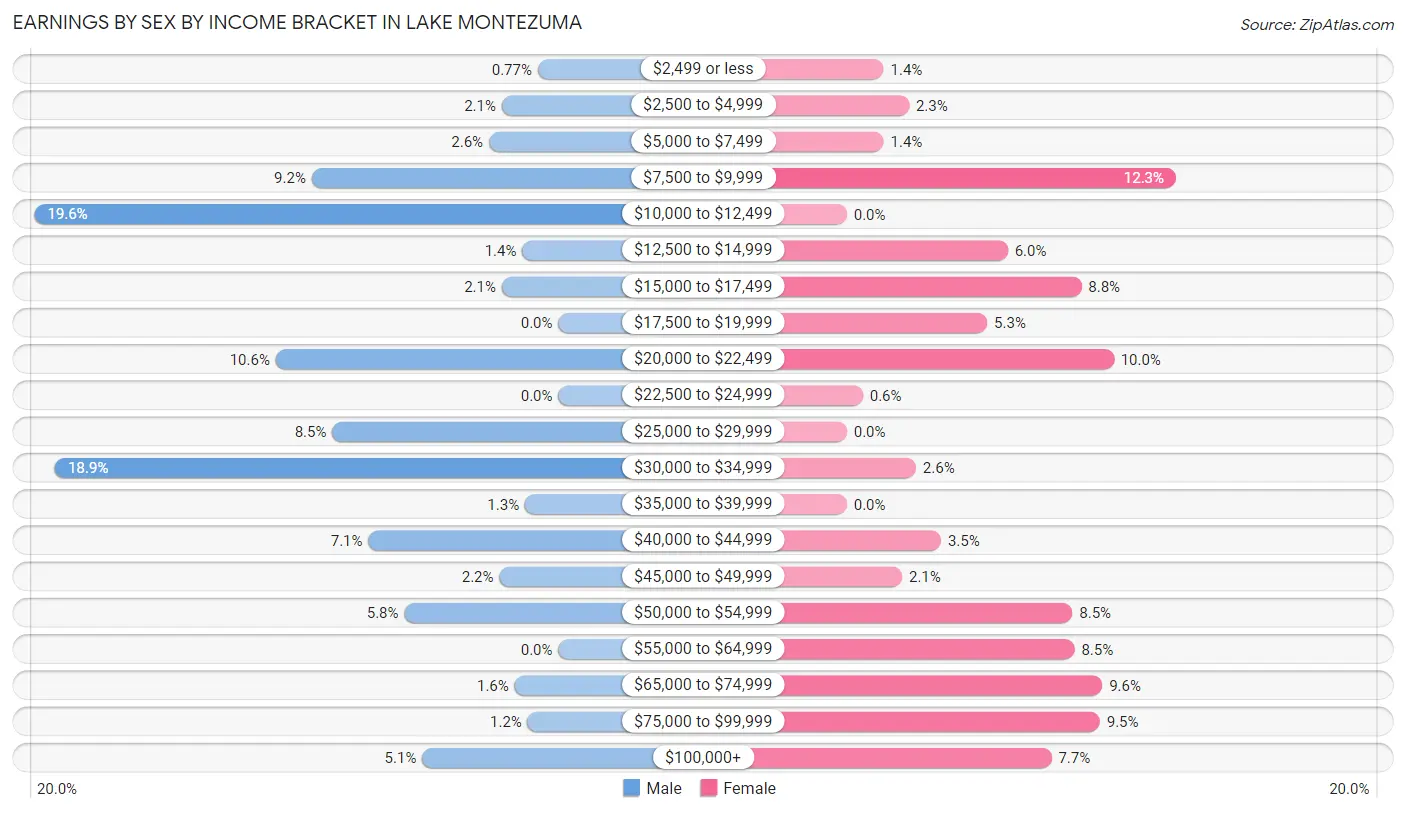
| Income | Male | Female |
| $2,499 or less | 8 (0.8%) | 16 (1.4%) |
| $2,500 to $4,999 | 22 (2.1%) | 27 (2.3%) |
| $5,000 to $7,499 | 27 (2.6%) | 16 (1.4%) |
| $7,500 to $9,999 | 96 (9.2%) | 143 (12.3%) |
| $10,000 to $12,499 | 204 (19.6%) | 0 (0.0%) |
| $12,500 to $14,999 | 14 (1.3%) | 70 (6.0%) |
| $15,000 to $17,499 | 22 (2.1%) | 102 (8.8%) |
| $17,500 to $19,999 | 0 (0.0%) | 61 (5.3%) |
| $20,000 to $22,499 | 110 (10.6%) | 116 (10.0%) |
| $22,500 to $24,999 | 0 (0.0%) | 7 (0.6%) |
| $25,000 to $29,999 | 88 (8.5%) | 0 (0.0%) |
| $30,000 to $34,999 | 196 (18.9%) | 30 (2.6%) |
| $35,000 to $39,999 | 13 (1.3%) | 0 (0.0%) |
| $40,000 to $44,999 | 74 (7.1%) | 41 (3.5%) |
| $45,000 to $49,999 | 23 (2.2%) | 24 (2.1%) |
| $50,000 to $54,999 | 60 (5.8%) | 98 (8.5%) |
| $55,000 to $64,999 | 0 (0.0%) | 99 (8.5%) |
| $65,000 to $74,999 | 17 (1.6%) | 111 (9.6%) |
| $75,000 to $99,999 | 12 (1.1%) | 110 (9.5%) |
| $100,000+ | 53 (5.1%) | 89 (7.7%) |
| Total | 1,039 (100.0%) | 1,160 (100.0%) |
Earnings by Sex by Educational Attainment in Lake Montezuma
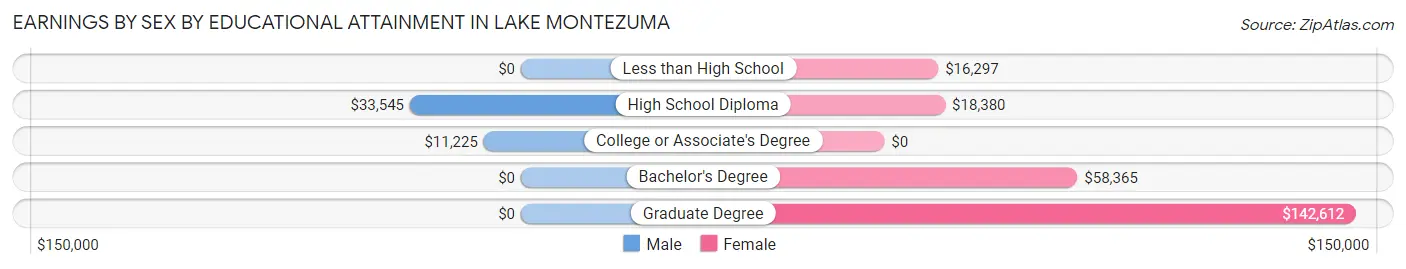
| Educational Attainment | Male Income | Female Income |
| Less than High School | - | - |
| High School Diploma | $33,545 | $18,380 |
| College or Associate's Degree | $11,225 | $0 |
| Bachelor's Degree | - | - |
| Graduate Degree | - | - |
| Total | $28,491 | $0 |
Family Income in Lake Montezuma
Family Income Brackets in Lake Montezuma
According to the Lake Montezuma family income data, there are 501 families falling into the $75,000 to $99,999 income range, which is the most common income bracket and makes up 34.3% of all families.
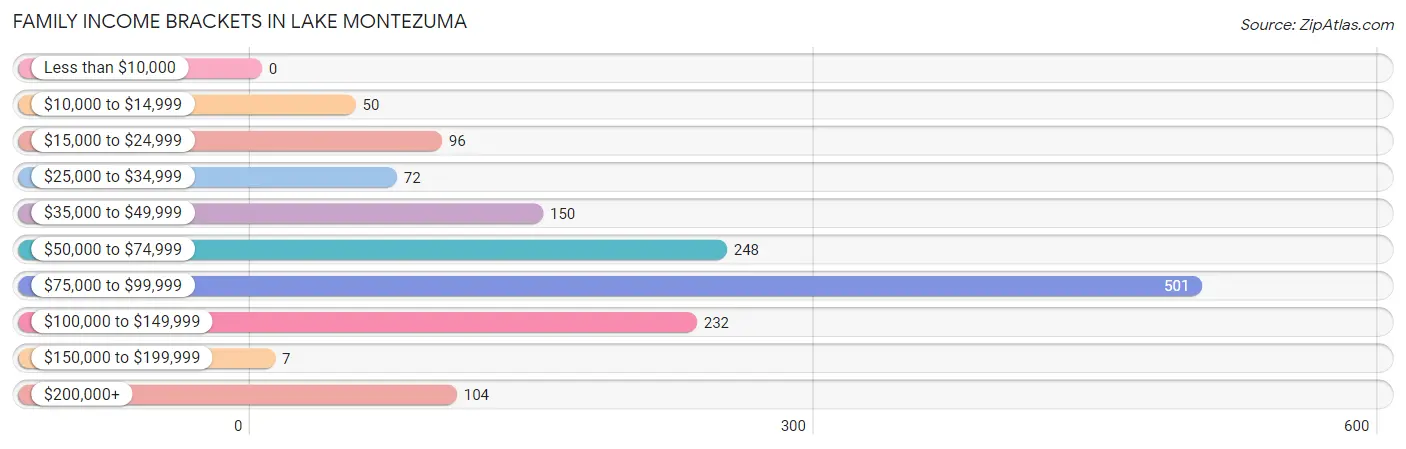
| Income Bracket | # Families | % Families |
| Less than $10,000 | 0 | 0.0% |
| $10,000 to $14,999 | 50 | 3.4% |
| $15,000 to $24,999 | 96 | 6.6% |
| $25,000 to $34,999 | 72 | 4.9% |
| $35,000 to $49,999 | 150 | 10.3% |
| $50,000 to $74,999 | 248 | 17.0% |
| $75,000 to $99,999 | 501 | 34.3% |
| $100,000 to $149,999 | 232 | 15.9% |
| $150,000 to $199,999 | 7 | 0.5% |
| $200,000+ | 104 | 7.1% |
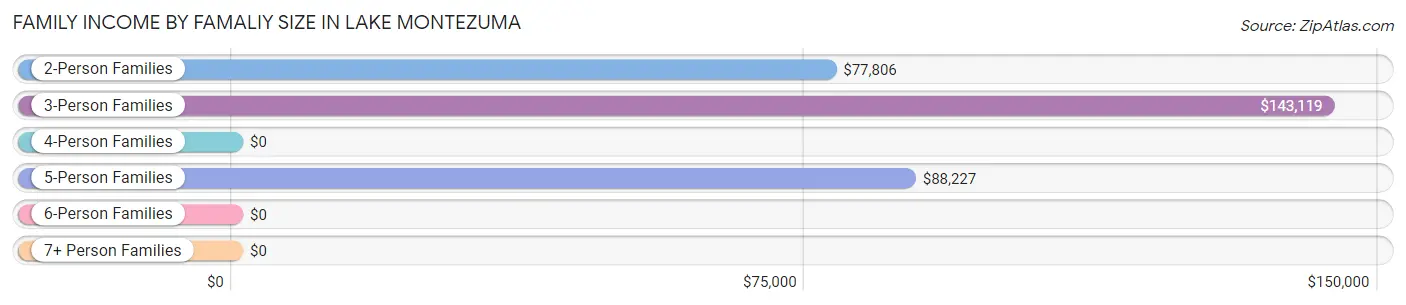
Family Income by Famaliy Size in Lake Montezuma
3-person families (161 | 11.0%) account for the highest median family income in Lake Montezuma with $143,119 per family, while 3-person families (161 | 11.0%) have the highest median income of $47,706 per family member.
| Income Bracket | # Families | Median Income |
| 2-Person Families | 1,171 (80.1%) | $77,806 |
| 3-Person Families | 161 (11.0%) | $143,119 |
| 4-Person Families | 35 (2.4%) | $0 |
| 5-Person Families | 78 (5.3%) | $88,227 |
| 6-Person Families | 16 (1.1%) | $0 |
| 7+ Person Families | 0 (0.0%) | $0 |
| Total | 1,461 (100.0%) | $78,231 |
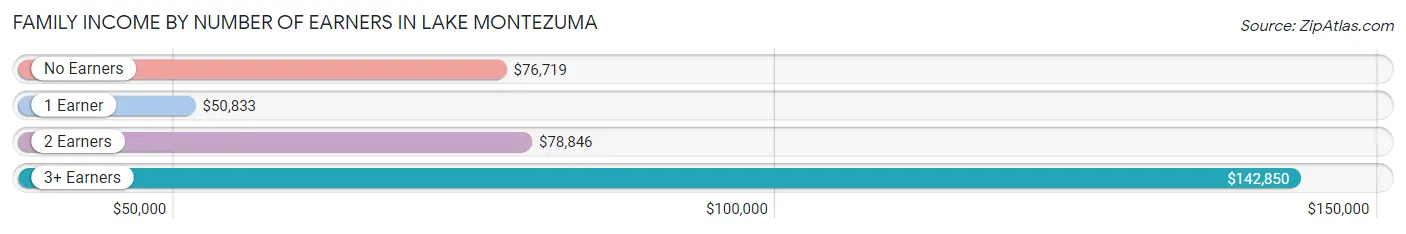
Family Income by Number of Earners in Lake Montezuma
The median family income in Lake Montezuma is $78,231, with families comprising 3+ earners (184) having the highest median family income of $142,850, while families with 1 earner (180) have the lowest median family income of $50,833, accounting for 12.6% and 12.3% of families, respectively.
| Number of Earners | # Families | Median Income |
| No Earners | 617 (42.2%) | $76,719 |
| 1 Earner | 180 (12.3%) | $50,833 |
| 2 Earners | 480 (32.9%) | $78,846 |
| 3+ Earners | 184 (12.6%) | $142,850 |
| Total | 1,461 (100.0%) | $78,231 |
Household Income in Lake Montezuma
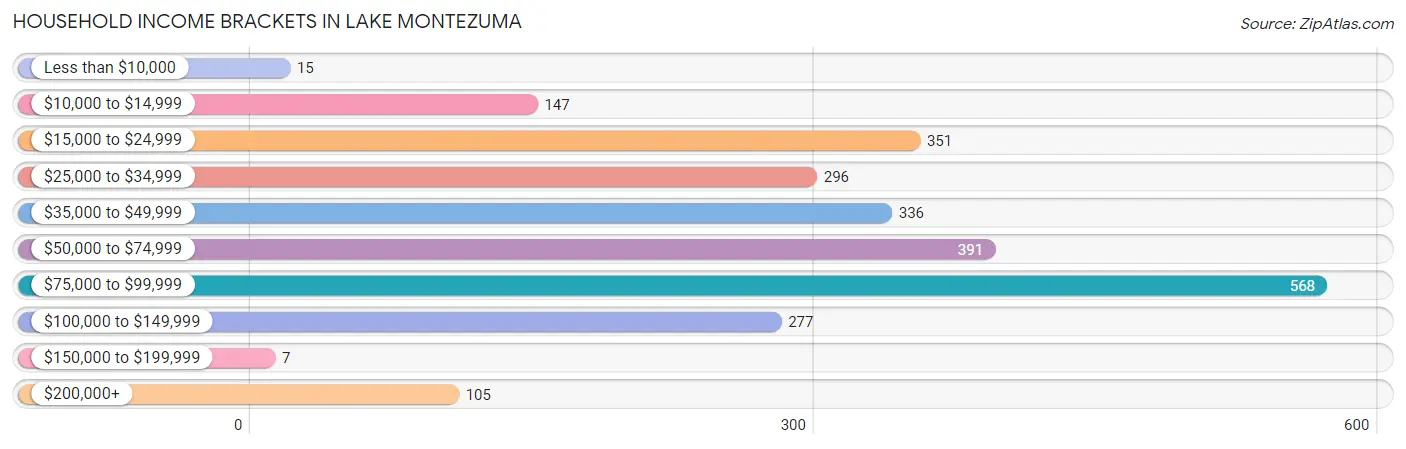
Household Income Brackets in Lake Montezuma
With 568 households falling in the category, the $75,000 to $99,999 income range is the most frequent in Lake Montezuma, accounting for 22.8% of all households. In contrast, only 7 households (0.3%) fall into the $150,000 to $199,999 income bracket, making it the least populous group.
| Income Bracket | # Households | % Households |
| Less than $10,000 | 15 | 0.6% |
| $10,000 to $14,999 | 147 | 5.9% |
| $15,000 to $24,999 | 351 | 14.1% |
| $25,000 to $34,999 | 296 | 11.9% |
| $35,000 to $49,999 | 336 | 13.5% |
| $50,000 to $74,999 | 391 | 15.7% |
| $75,000 to $99,999 | 568 | 22.8% |
| $100,000 to $149,999 | 277 | 11.1% |
| $150,000 to $199,999 | 7 | 0.3% |
| $200,000+ | 105 | 4.2% |
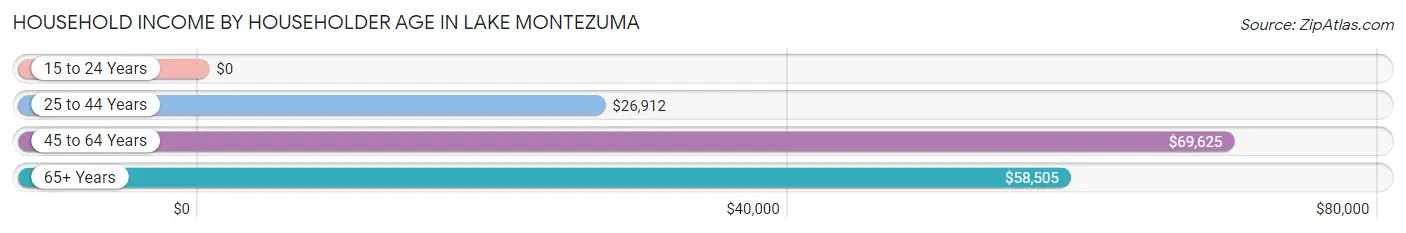
Household Income by Householder Age in Lake Montezuma
The median household income in Lake Montezuma is $57,575, with the highest median household income of $69,625 found in the 45 to 64 years age bracket for the primary householder. A total of 729 households (29.3%) fall into this category. Meanwhile, the 15 to 24 years age bracket for the primary householder has the lowest median household income of $0, with 13 households (0.5%) in this group.
| Income Bracket | # Households | Median Income |
| 15 to 24 Years | 13 (0.5%) | $0 |
| 25 to 44 Years | 390 (15.7%) | $26,912 |
| 45 to 64 Years | 729 (29.3%) | $69,625 |
| 65+ Years | 1,359 (54.6%) | $58,505 |
| Total | 2,491 (100.0%) | $57,575 |
Poverty in Lake Montezuma
Income Below Poverty by Sex and Age in Lake Montezuma
With 10.5% poverty level for males and 5.3% for females among the residents of Lake Montezuma, under 5 year old males and 6 to 11 year old females are the most vulnerable to poverty, with 21 males (48.8%) and 25 females (36.8%) in their respective age groups living below the poverty level.
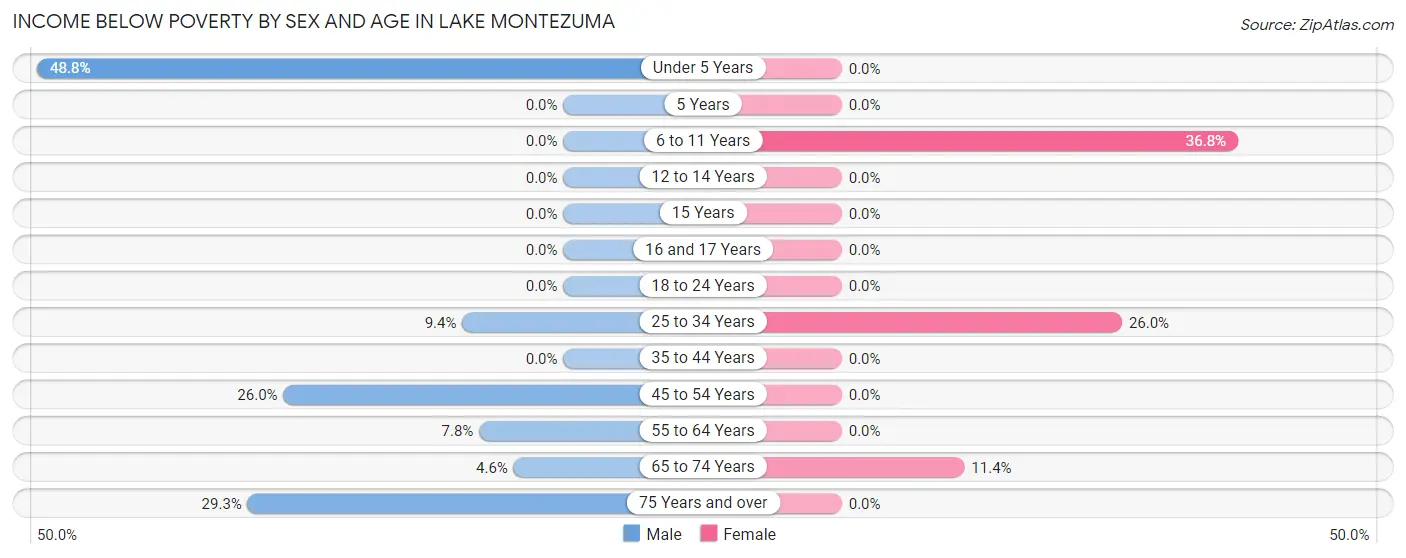
| Age Bracket | Male | Female |
| Under 5 Years | 21 (48.8%) | 0 (0.0%) |
| 5 Years | 0 (0.0%) | 0 (0.0%) |
| 6 to 11 Years | 0 (0.0%) | 25 (36.8%) |
| 12 to 14 Years | 0 (0.0%) | 0 (0.0%) |
| 15 Years | 0 (0.0%) | 0 (0.0%) |
| 16 and 17 Years | 0 (0.0%) | 0 (0.0%) |
| 18 to 24 Years | 0 (0.0%) | 0 (0.0%) |
| 25 to 34 Years | 33 (9.4%) | 26 (26.0%) |
| 35 to 44 Years | 0 (0.0%) | 0 (0.0%) |
| 45 to 54 Years | 53 (26.0%) | 0 (0.0%) |
| 55 to 64 Years | 15 (7.8%) | 0 (0.0%) |
| 65 to 74 Years | 42 (4.6%) | 70 (11.4%) |
| 75 Years and over | 75 (29.3%) | 0 (0.0%) |
| Total | 239 (10.5%) | 121 (5.3%) |
Income Above Poverty by Sex and Age in Lake Montezuma
According to the poverty statistics in Lake Montezuma, males aged 5 years and females aged 12 to 14 years are the age groups that are most secure financially, with 100.0% of males and 100.0% of females in these age groups living above the poverty line.
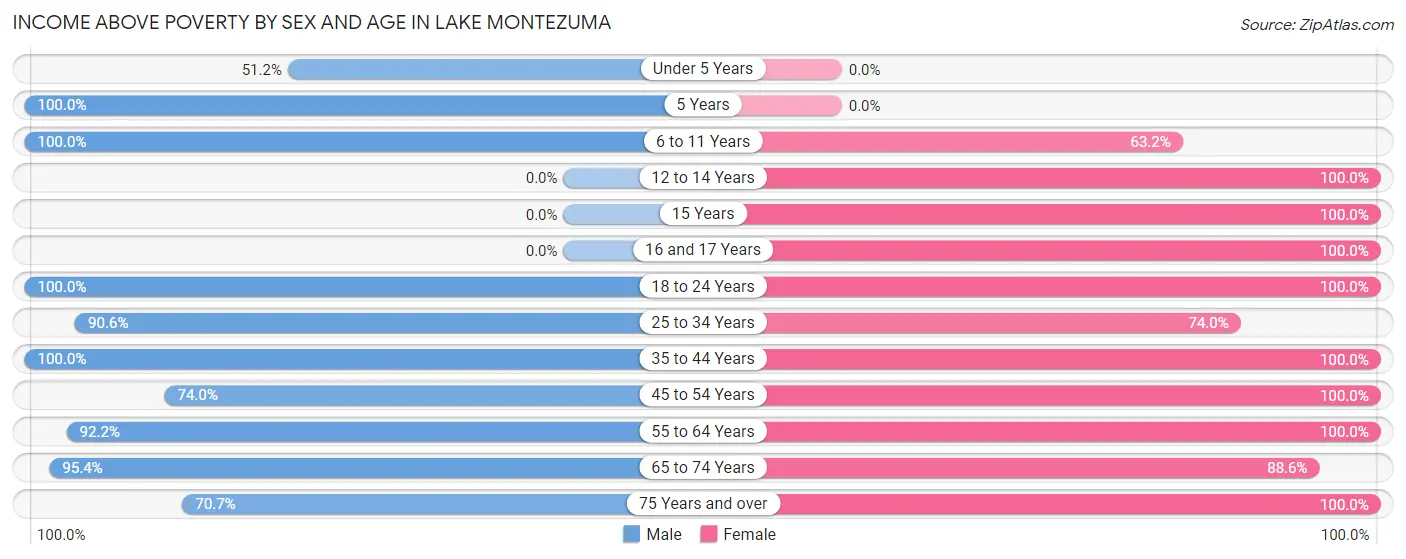
| Age Bracket | Male | Female |
| Under 5 Years | 22 (51.2%) | 0 (0.0%) |
| 5 Years | 3 (100.0%) | 0 (0.0%) |
| 6 to 11 Years | 52 (100.0%) | 43 (63.2%) |
| 12 to 14 Years | 0 (0.0%) | 70 (100.0%) |
| 15 Years | 0 (0.0%) | 16 (100.0%) |
| 16 and 17 Years | 0 (0.0%) | 16 (100.0%) |
| 18 to 24 Years | 170 (100.0%) | 214 (100.0%) |
| 25 to 34 Years | 319 (90.6%) | 74 (74.0%) |
| 35 to 44 Years | 81 (100.0%) | 86 (100.0%) |
| 45 to 54 Years | 151 (74.0%) | 228 (100.0%) |
| 55 to 64 Years | 177 (92.2%) | 664 (100.0%) |
| 65 to 74 Years | 870 (95.4%) | 545 (88.6%) |
| 75 Years and over | 181 (70.7%) | 184 (100.0%) |
| Total | 2,026 (89.4%) | 2,140 (94.7%) |
Income Below Poverty Among Married-Couple Families in Lake Montezuma
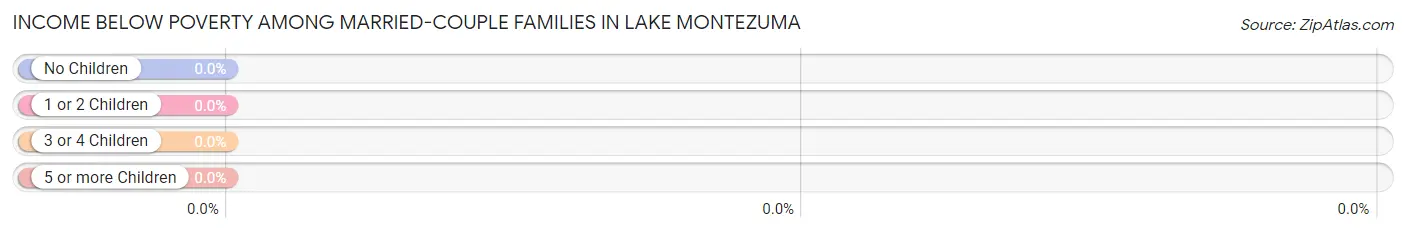
| Children | Above Poverty | Below Poverty |
| No Children | 967 (100.0%) | 0 (0.0%) |
| 1 or 2 Children | 90 (100.0%) | 0 (0.0%) |
| 3 or 4 Children | 19 (100.0%) | 0 (0.0%) |
| 5 or more Children | 0 (0.0%) | 0 (0.0%) |
| Total | 1,076 (100.0%) | 0 (0.0%) |
Income Below Poverty Among Single-Parent Households in Lake Montezuma
According to the poverty data in Lake Montezuma, 22.0% or 44 single-father households and 14.6% or 27 single-mother households are living below the poverty line. Among single-father households, those with 1 or 2 children have the highest poverty rate, with 22 households (100.0%) experiencing poverty. Likewise, among single-mother households, those with no children have the highest poverty rate, with 27 households (15.8%) falling below the poverty line.
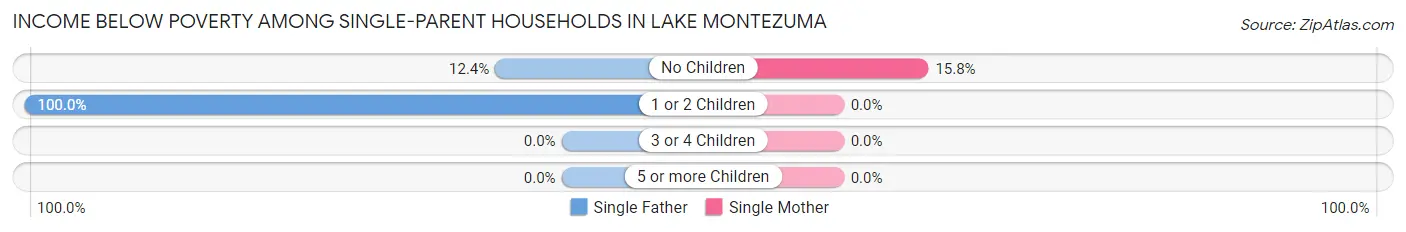
| Children | Single Father | Single Mother |
| No Children | 22 (12.4%) | 27 (15.8%) |
| 1 or 2 Children | 22 (100.0%) | 0 (0.0%) |
| 3 or 4 Children | 0 (0.0%) | 0 (0.0%) |
| 5 or more Children | 0 (0.0%) | 0 (0.0%) |
| Total | 44 (22.0%) | 27 (14.6%) |
Income Below Poverty Among Married-Couple vs Single-Parent Households in Lake Montezuma
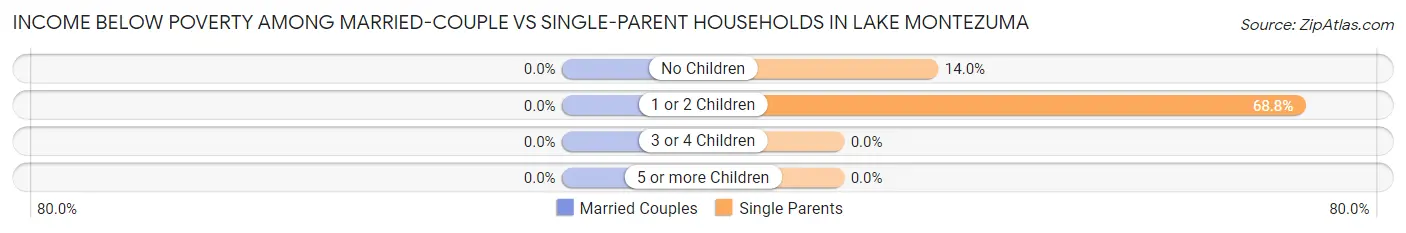
| Children | Married-Couple Families | Single-Parent Households |
| No Children | 0 (0.0%) | 49 (14.0%) |
| 1 or 2 Children | 0 (0.0%) | 22 (68.8%) |
| 3 or 4 Children | 0 (0.0%) | 0 (0.0%) |
| 5 or more Children | 0 (0.0%) | 0 (0.0%) |
| Total | 0 (0.0%) | 71 (18.4%) |
Employment Characteristics in Lake Montezuma
Employment by Class of Employer in Lake Montezuma
Among the 1,718 employed individuals in Lake Montezuma, private company employees (1,269 | 73.9%), local government employees (136 | 7.9%), and self-employed (incorporated) (104 | 6.0%) make up the most common classes of employment.
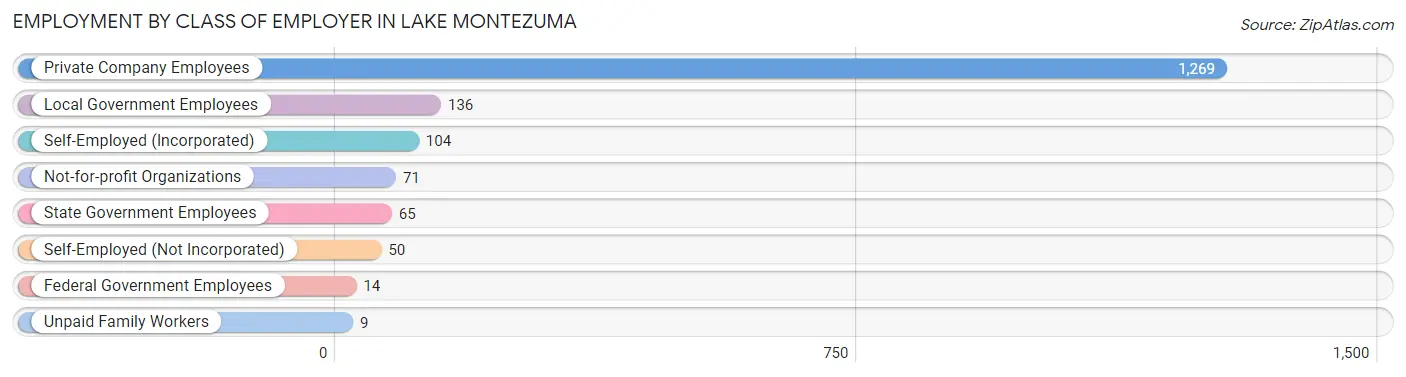
| Employer Class | # Employees | % Employees |
| Private Company Employees | 1,269 | 73.9% |
| Self-Employed (Incorporated) | 104 | 6.0% |
| Self-Employed (Not Incorporated) | 50 | 2.9% |
| Not-for-profit Organizations | 71 | 4.1% |
| Local Government Employees | 136 | 7.9% |
| State Government Employees | 65 | 3.8% |
| Federal Government Employees | 14 | 0.8% |
| Unpaid Family Workers | 9 | 0.5% |
| Total | 1,718 | 100.0% |
Employment Status by Age in Lake Montezuma
According to the labor force statistics for Lake Montezuma, out of the total population over 16 years of age (4,274), 42.1% or 1,799 individuals are in the labor force, with 2.8% or 50 of them unemployed. The age group with the highest labor force participation rate is 16 to 19 years, with 100.0% or 179 individuals in the labor force. Within the labor force, the 30 to 34 years age range has the highest percentage of unemployed individuals, with 24.2% or 22 of them being unemployed.
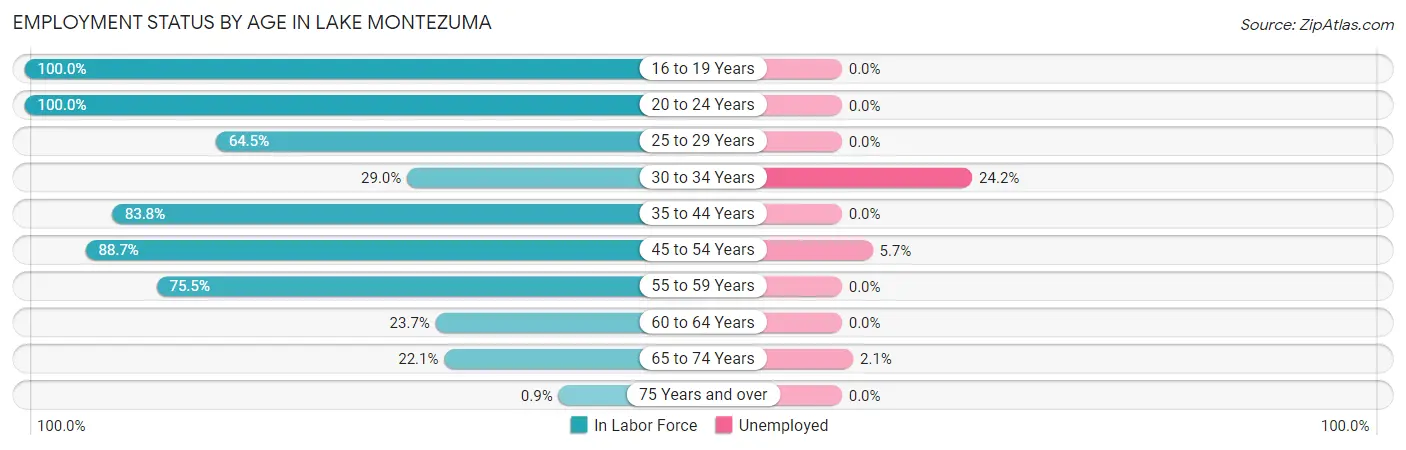
| Age Bracket | In Labor Force | Unemployed |
| 16 to 19 Years | 179 (100.0%) | 0 (0.0%) |
| 20 to 24 Years | 221 (100.0%) | 0 (0.0%) |
| 25 to 29 Years | 89 (64.5%) | 0 (0.0%) |
| 30 to 34 Years | 91 (29.0%) | 22 (24.2%) |
| 35 to 44 Years | 140 (83.8%) | 0 (0.0%) |
| 45 to 54 Years | 383 (88.7%) | 22 (5.7%) |
| 55 to 59 Years | 222 (75.5%) | 0 (0.0%) |
| 60 to 64 Years | 133 (23.7%) | 0 (0.0%) |
| 65 to 74 Years | 337 (22.1%) | 7 (2.1%) |
| 75 Years and over | 4 (0.9%) | 0 (0.0%) |
| Total | 1,799 (42.1%) | 50 (2.8%) |
Employment Status by Educational Attainment in Lake Montezuma
According to labor force statistics for Lake Montezuma, 55.5% of individuals (1,058) out of the total population between 25 and 64 years of age (1,907) are in the labor force, with 4.2% or 44 of them being unemployed. The group with the highest labor force participation rate are those with the educational attainment of less than high school, with 100.0% or 146 individuals in the labor force. Within the labor force, individuals with college / associate degree education have the highest percentage of unemployment, with 9.8% or 44 of them being unemployed.
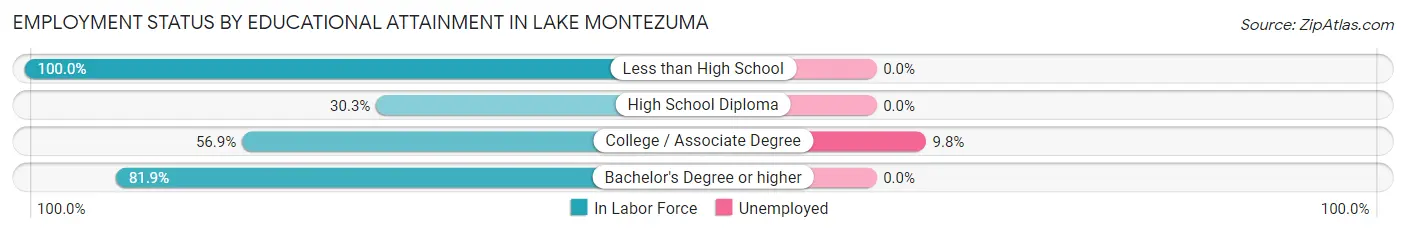
| Educational Attainment | In Labor Force | Unemployed |
| Less than High School | 146 (100.0%) | 0 (0.0%) |
| High School Diploma | 196 (30.3%) | 0 (0.0%) |
| College / Associate Degree | 449 (56.9%) | 77 (9.8%) |
| Bachelor's Degree or higher | 267 (81.9%) | 0 (0.0%) |
| Total | 1,058 (55.5%) | 80 (4.2%) |
Employment Occupations by Sex in Lake Montezuma
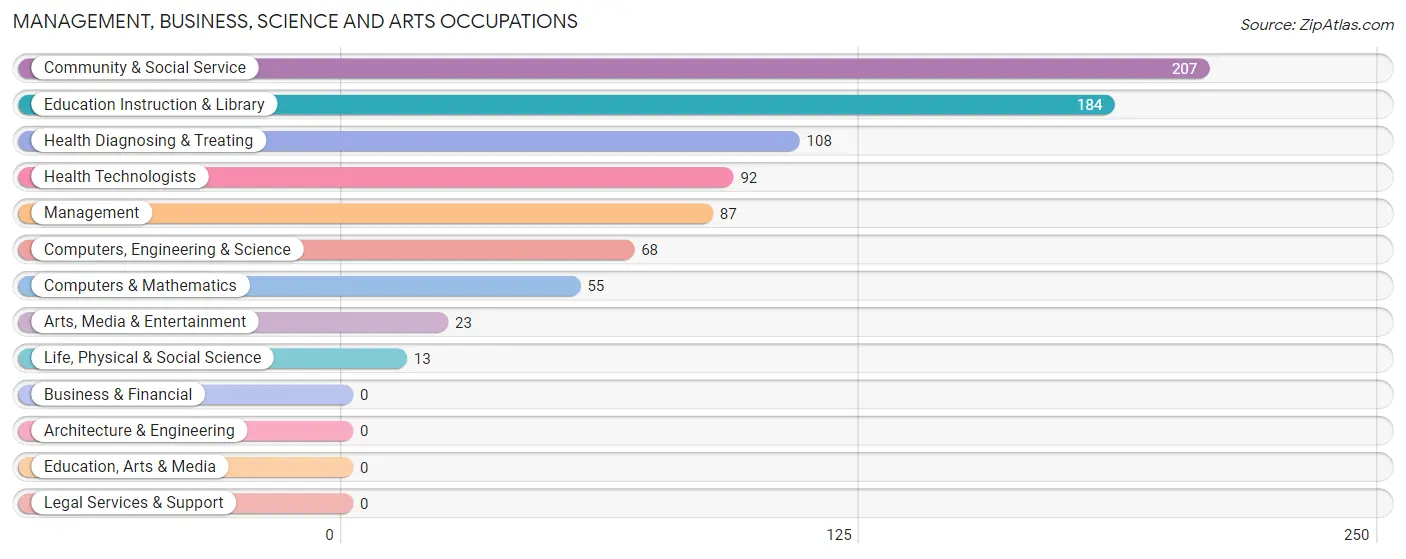
Management, Business, Science and Arts Occupations
The most common Management, Business, Science and Arts occupations in Lake Montezuma are Community & Social Service (207 | 11.8%), Education Instruction & Library (184 | 10.5%), Health Diagnosing & Treating (108 | 6.2%), Health Technologists (92 | 5.3%), and Management (87 | 5.0%).
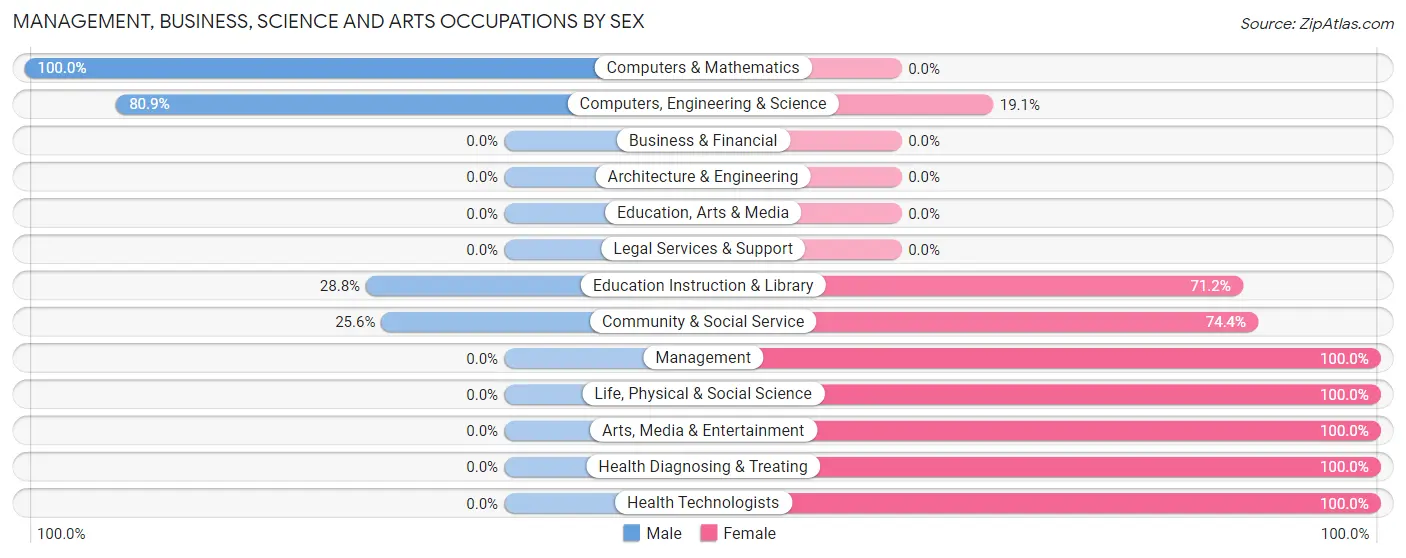
Management, Business, Science and Arts Occupations by Sex
Within the Management, Business, Science and Arts occupations in Lake Montezuma, the most male-oriented occupations are Computers & Mathematics (100.0%), Computers, Engineering & Science (80.9%), and Education Instruction & Library (28.8%), while the most female-oriented occupations are Management (100.0%), Life, Physical & Social Science (100.0%), and Arts, Media & Entertainment (100.0%).
| Occupation | Male | Female |
| Management | 0 (0.0%) | 87 (100.0%) |
| Business & Financial | 0 (0.0%) | 0 (0.0%) |
| Computers, Engineering & Science | 55 (80.9%) | 13 (19.1%) |
| Computers & Mathematics | 55 (100.0%) | 0 (0.0%) |
| Architecture & Engineering | 0 (0.0%) | 0 (0.0%) |
| Life, Physical & Social Science | 0 (0.0%) | 13 (100.0%) |
| Community & Social Service | 53 (25.6%) | 154 (74.4%) |
| Education, Arts & Media | 0 (0.0%) | 0 (0.0%) |
| Legal Services & Support | 0 (0.0%) | 0 (0.0%) |
| Education Instruction & Library | 53 (28.8%) | 131 (71.2%) |
| Arts, Media & Entertainment | 0 (0.0%) | 23 (100.0%) |
| Health Diagnosing & Treating | 0 (0.0%) | 108 (100.0%) |
| Health Technologists | 0 (0.0%) | 92 (100.0%) |
| Total (Category) | 108 (23.0%) | 362 (77.0%) |
| Total (Overall) | 736 (42.1%) | 1,012 (57.9%) |
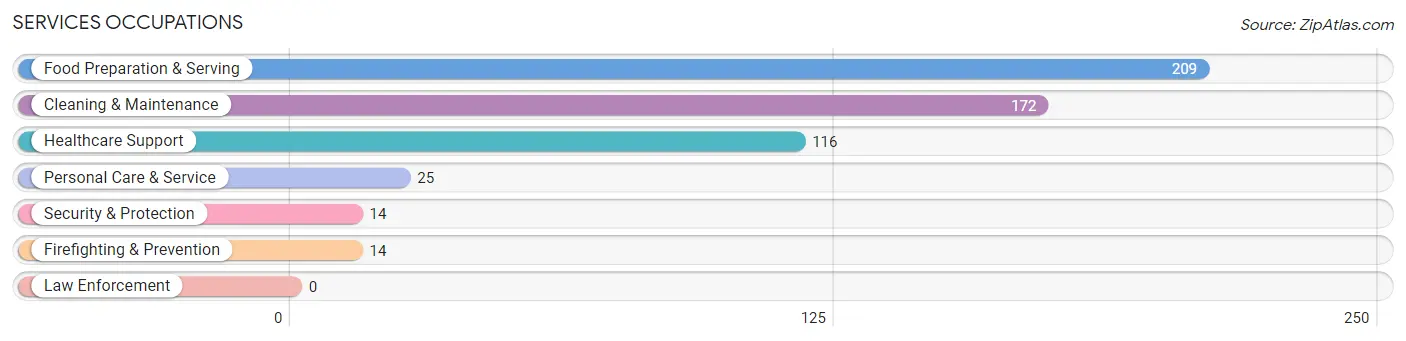
Services Occupations
The most common Services occupations in Lake Montezuma are Food Preparation & Serving (209 | 12.0%), Cleaning & Maintenance (172 | 9.8%), Healthcare Support (116 | 6.6%), Personal Care & Service (25 | 1.4%), and Security & Protection (14 | 0.8%).
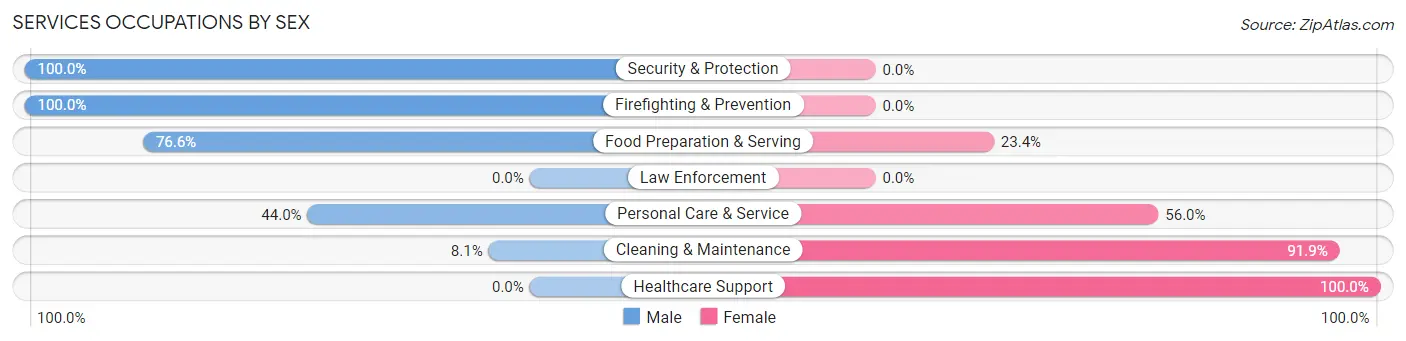
Services Occupations by Sex
Within the Services occupations in Lake Montezuma, the most male-oriented occupations are Security & Protection (100.0%), Firefighting & Prevention (100.0%), and Food Preparation & Serving (76.6%), while the most female-oriented occupations are Healthcare Support (100.0%), Cleaning & Maintenance (91.9%), and Personal Care & Service (56.0%).
| Occupation | Male | Female |
| Healthcare Support | 0 (0.0%) | 116 (100.0%) |
| Security & Protection | 14 (100.0%) | 0 (0.0%) |
| Firefighting & Prevention | 14 (100.0%) | 0 (0.0%) |
| Law Enforcement | 0 (0.0%) | 0 (0.0%) |
| Food Preparation & Serving | 160 (76.6%) | 49 (23.4%) |
| Cleaning & Maintenance | 14 (8.1%) | 158 (91.9%) |
| Personal Care & Service | 11 (44.0%) | 14 (56.0%) |
| Total (Category) | 199 (37.1%) | 337 (62.9%) |
| Total (Overall) | 736 (42.1%) | 1,012 (57.9%) |
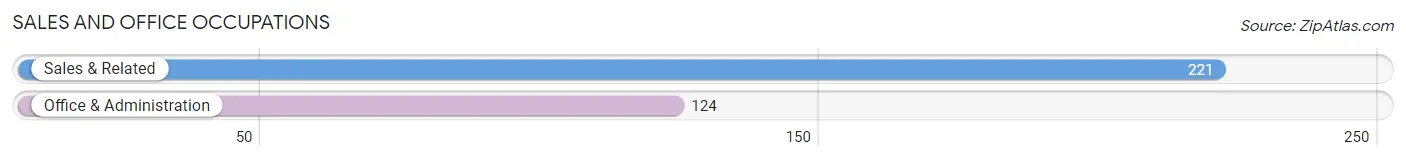
Sales and Office Occupations
The most common Sales and Office occupations in Lake Montezuma are Sales & Related (221 | 12.6%), and Office & Administration (124 | 7.1%).
Sales and Office Occupations by Sex
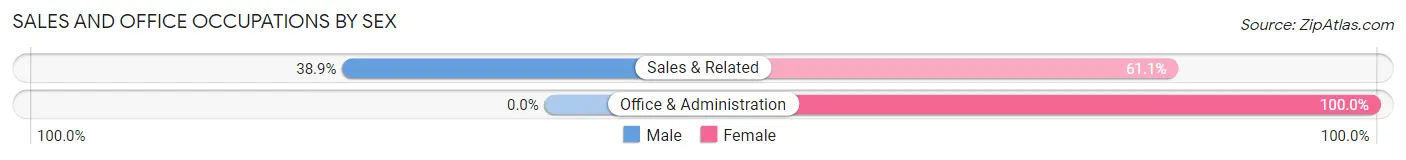
| Occupation | Male | Female |
| Sales & Related | 86 (38.9%) | 135 (61.1%) |
| Office & Administration | 0 (0.0%) | 124 (100.0%) |
| Total (Category) | 86 (24.9%) | 259 (75.1%) |
| Total (Overall) | 736 (42.1%) | 1,012 (57.9%) |
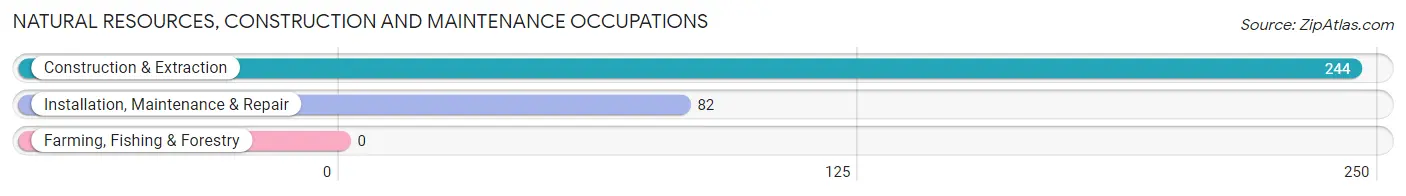
Natural Resources, Construction and Maintenance Occupations
The most common Natural Resources, Construction and Maintenance occupations in Lake Montezuma are Construction & Extraction (244 | 14.0%), and Installation, Maintenance & Repair (82 | 4.7%).
Natural Resources, Construction and Maintenance Occupations by Sex
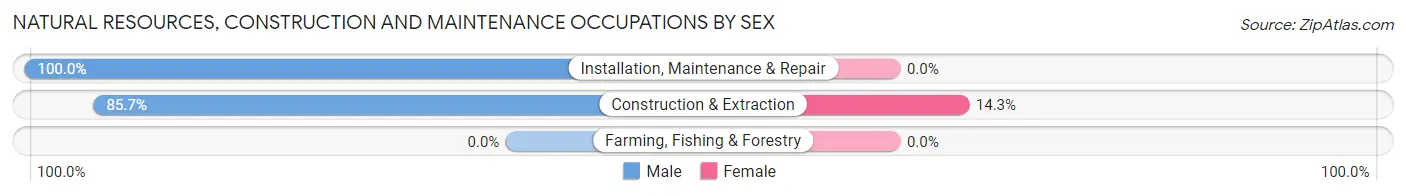
| Occupation | Male | Female |
| Farming, Fishing & Forestry | 0 (0.0%) | 0 (0.0%) |
| Construction & Extraction | 209 (85.7%) | 35 (14.3%) |
| Installation, Maintenance & Repair | 82 (100.0%) | 0 (0.0%) |
| Total (Category) | 291 (89.3%) | 35 (10.7%) |
| Total (Overall) | 736 (42.1%) | 1,012 (57.9%) |
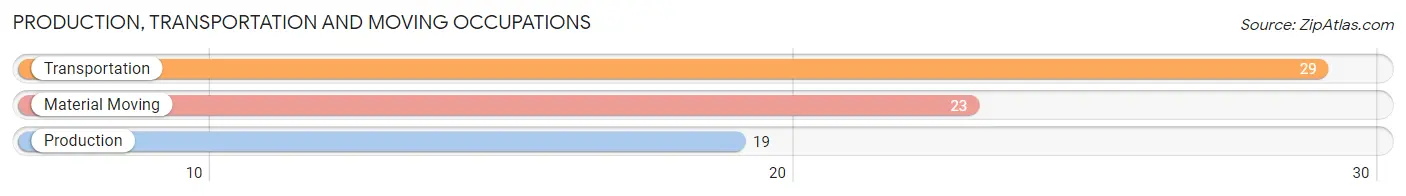
Production, Transportation and Moving Occupations
The most common Production, Transportation and Moving occupations in Lake Montezuma are Transportation (29 | 1.7%), Material Moving (23 | 1.3%), and Production (19 | 1.1%).
Production, Transportation and Moving Occupations by Sex
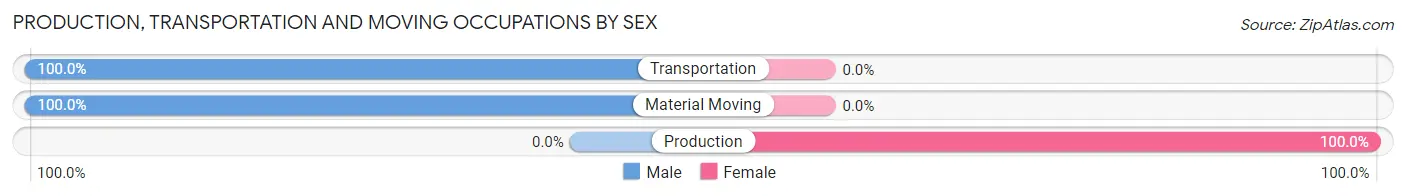
| Occupation | Male | Female |
| Production | 0 (0.0%) | 19 (100.0%) |
| Transportation | 29 (100.0%) | 0 (0.0%) |
| Material Moving | 23 (100.0%) | 0 (0.0%) |
| Total (Category) | 52 (73.2%) | 19 (26.8%) |
| Total (Overall) | 736 (42.1%) | 1,012 (57.9%) |
Employment Industries by Sex in Lake Montezuma
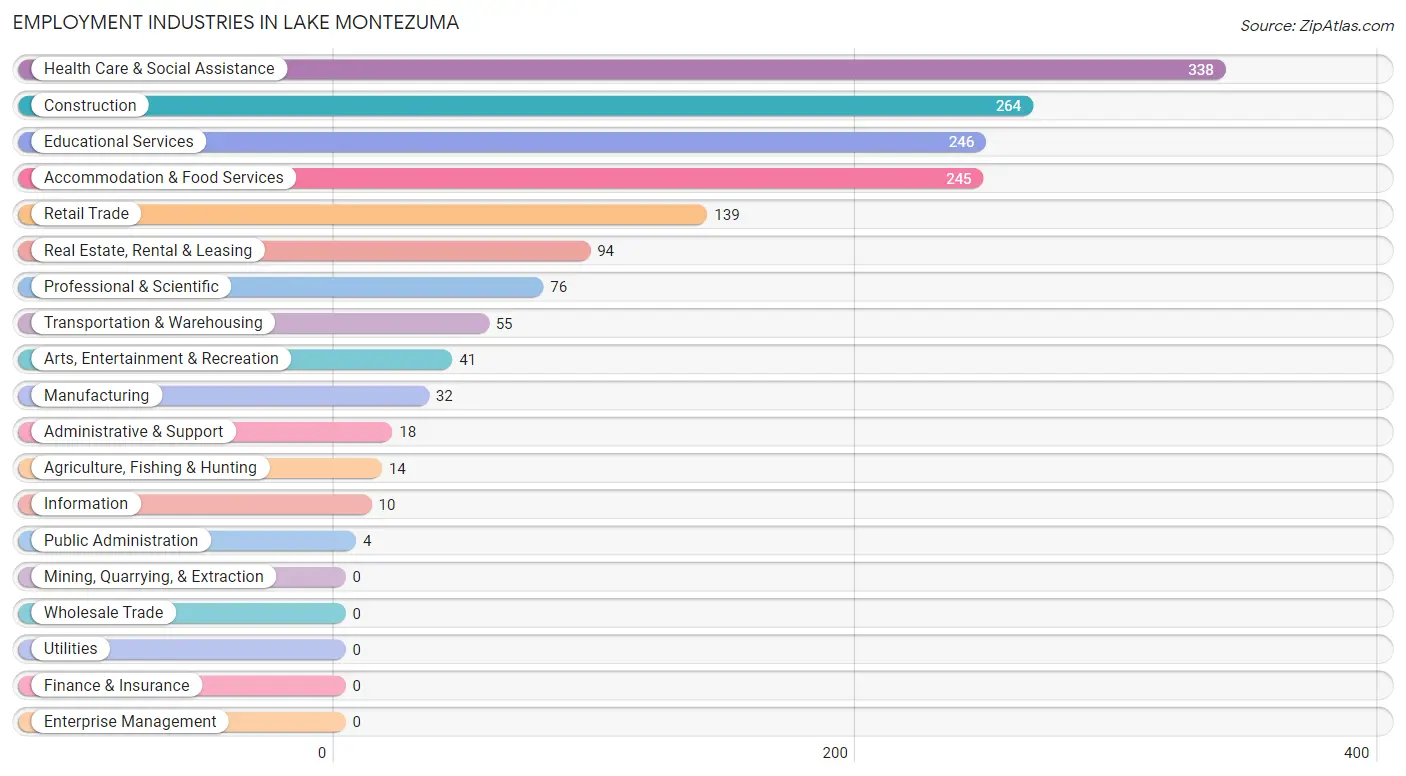
Employment Industries in Lake Montezuma
The major employment industries in Lake Montezuma include Health Care & Social Assistance (338 | 19.3%), Construction (264 | 15.1%), Educational Services (246 | 14.1%), Accommodation & Food Services (245 | 14.0%), and Retail Trade (139 | 8.0%).
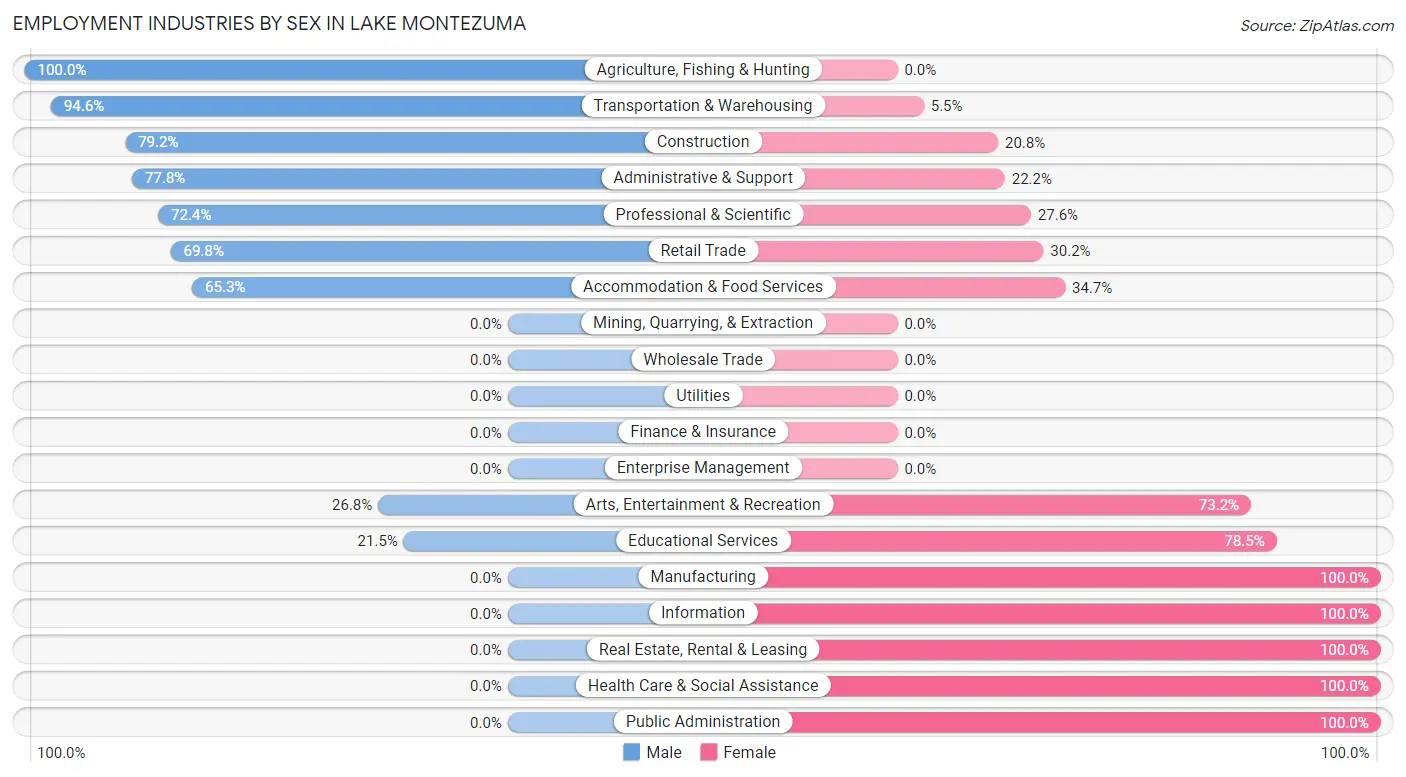
Employment Industries by Sex in Lake Montezuma
The Lake Montezuma industries that see more men than women are Agriculture, Fishing & Hunting (100.0%), Transportation & Warehousing (94.6%), and Construction (79.2%), whereas the industries that tend to have a higher number of women are Manufacturing (100.0%), Information (100.0%), and Real Estate, Rental & Leasing (100.0%).
| Industry | Male | Female |
| Agriculture, Fishing & Hunting | 14 (100.0%) | 0 (0.0%) |
| Mining, Quarrying, & Extraction | 0 (0.0%) | 0 (0.0%) |
| Construction | 209 (79.2%) | 55 (20.8%) |
| Manufacturing | 0 (0.0%) | 32 (100.0%) |
| Wholesale Trade | 0 (0.0%) | 0 (0.0%) |
| Retail Trade | 97 (69.8%) | 42 (30.2%) |
| Transportation & Warehousing | 52 (94.6%) | 3 (5.4%) |
| Utilities | 0 (0.0%) | 0 (0.0%) |
| Information | 0 (0.0%) | 10 (100.0%) |
| Finance & Insurance | 0 (0.0%) | 0 (0.0%) |
| Real Estate, Rental & Leasing | 0 (0.0%) | 94 (100.0%) |
| Professional & Scientific | 55 (72.4%) | 21 (27.6%) |
| Enterprise Management | 0 (0.0%) | 0 (0.0%) |
| Administrative & Support | 14 (77.8%) | 4 (22.2%) |
| Educational Services | 53 (21.5%) | 193 (78.5%) |
| Health Care & Social Assistance | 0 (0.0%) | 338 (100.0%) |
| Arts, Entertainment & Recreation | 11 (26.8%) | 30 (73.2%) |
| Accommodation & Food Services | 160 (65.3%) | 85 (34.7%) |
| Public Administration | 0 (0.0%) | 4 (100.0%) |
| Total | 736 (42.1%) | 1,012 (57.9%) |
Education in Lake Montezuma
School Enrollment in Lake Montezuma
The most common levels of schooling among the 261 students in Lake Montezuma are elementary school (100 | 38.3%), middle school (90 | 34.5%), and high school (44 | 16.9%).
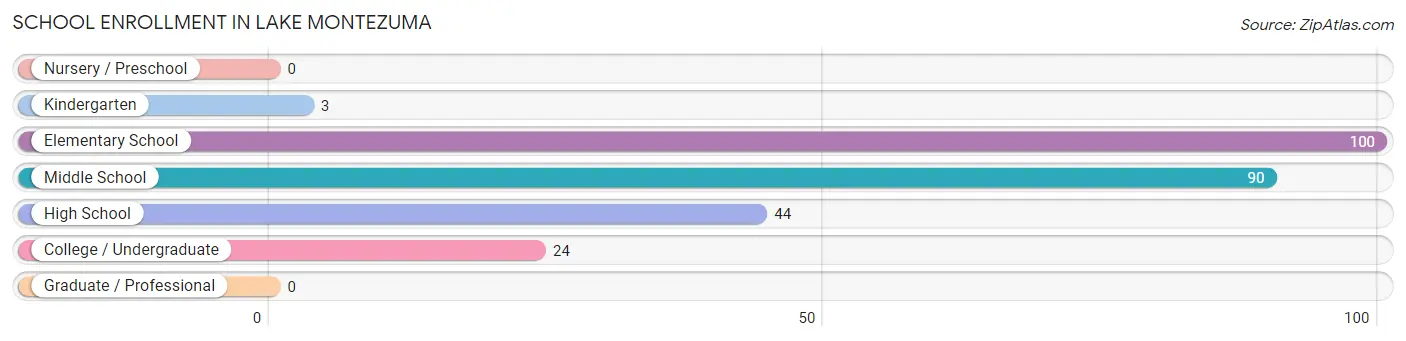
| School Level | # Students | % Students |
| Nursery / Preschool | 0 | 0.0% |
| Kindergarten | 3 | 1.1% |
| Elementary School | 100 | 38.3% |
| Middle School | 90 | 34.5% |
| High School | 44 | 16.9% |
| College / Undergraduate | 24 | 9.2% |
| Graduate / Professional | 0 | 0.0% |
| Total | 261 | 100.0% |
School Enrollment by Age by Funding Source in Lake Montezuma
Out of a total of 261 students who are enrolled in schools in Lake Montezuma, 28 (10.7%) attend a private institution, while the remaining 233 (89.3%) are enrolled in public schools. The age group of 15 to 17 year olds has the highest likelihood of being enrolled in private schools, with 16 (100.0% in the age bracket) enrolled. Conversely, the age group of 5 to 9 year old has the lowest likelihood of being enrolled in a private school, with 103 (100.0% in the age bracket) attending a public institution.
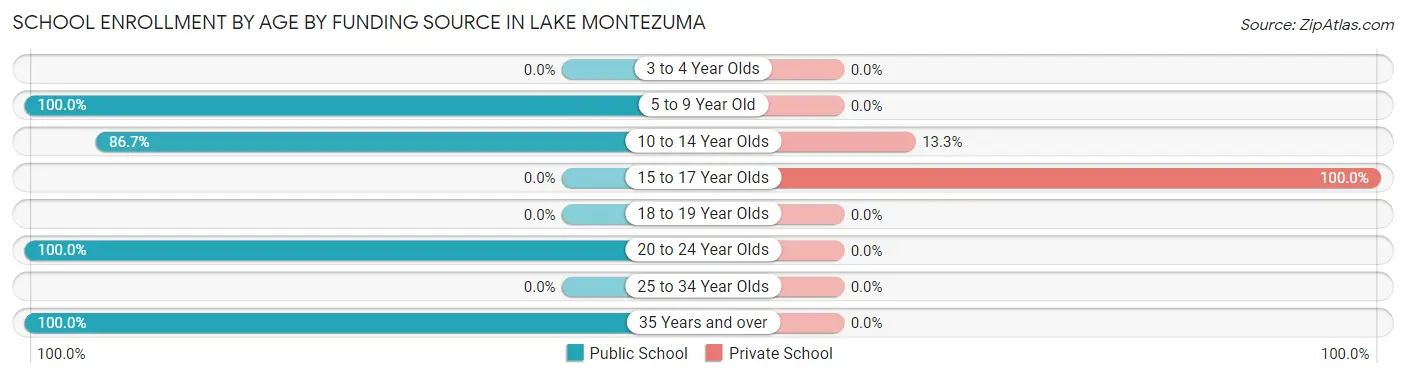
| Age Bracket | Public School | Private School |
| 3 to 4 Year Olds | 0 (0.0%) | 0 (0.0%) |
| 5 to 9 Year Old | 103 (100.0%) | 0 (0.0%) |
| 10 to 14 Year Olds | 78 (86.7%) | 12 (13.3%) |
| 15 to 17 Year Olds | 0 (0.0%) | 16 (100.0%) |
| 18 to 19 Year Olds | 0 (0.0%) | 0 (0.0%) |
| 20 to 24 Year Olds | 14 (100.0%) | 0 (0.0%) |
| 25 to 34 Year Olds | 0 (0.0%) | 0 (0.0%) |
| 35 Years and over | 38 (100.0%) | 0 (0.0%) |
| Total | 233 (89.3%) | 28 (10.7%) |
Educational Attainment by Field of Study in Lake Montezuma
Education (199 | 27.4%), computers & mathematics (91 | 12.5%), business (75 | 10.3%), arts & humanities (60 | 8.3%), and social sciences (59 | 8.1%) are the most common fields of study among 726 individuals in Lake Montezuma who have obtained a bachelor's degree or higher.
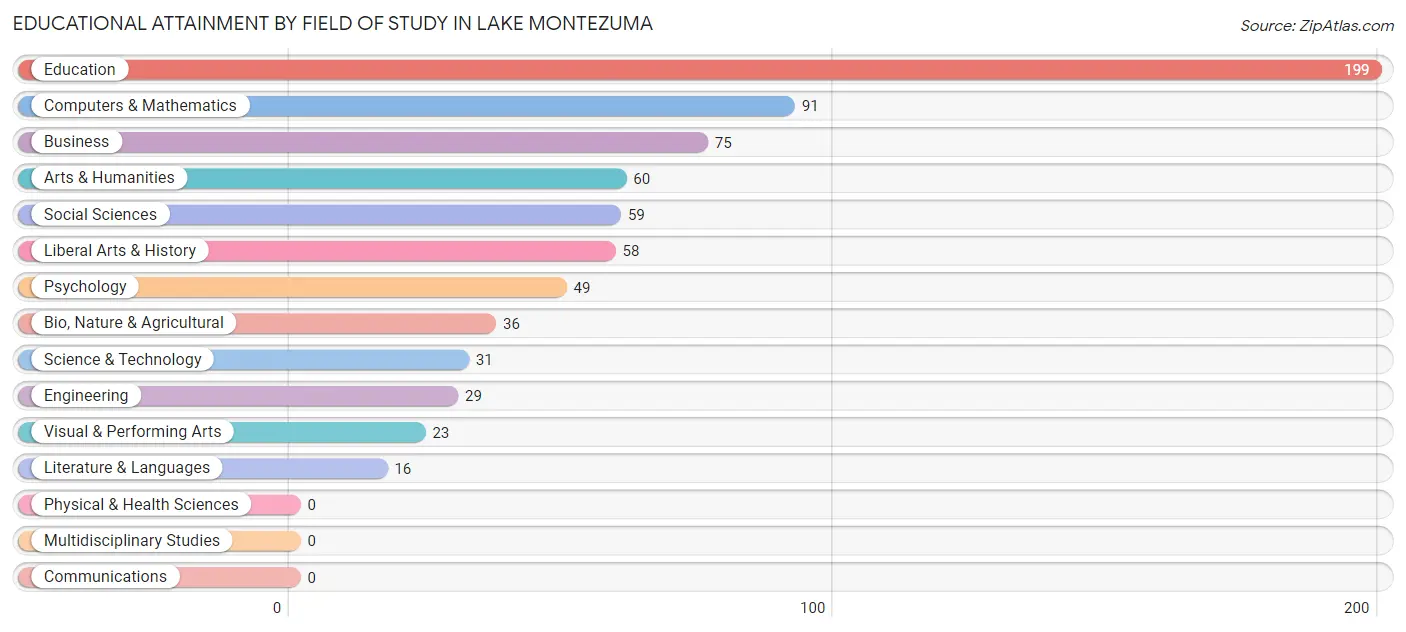
| Field of Study | # Graduates | % Graduates |
| Computers & Mathematics | 91 | 12.5% |
| Bio, Nature & Agricultural | 36 | 5.0% |
| Physical & Health Sciences | 0 | 0.0% |
| Psychology | 49 | 6.8% |
| Social Sciences | 59 | 8.1% |
| Engineering | 29 | 4.0% |
| Multidisciplinary Studies | 0 | 0.0% |
| Science & Technology | 31 | 4.3% |
| Business | 75 | 10.3% |
| Education | 199 | 27.4% |
| Literature & Languages | 16 | 2.2% |
| Liberal Arts & History | 58 | 8.0% |
| Visual & Performing Arts | 23 | 3.2% |
| Communications | 0 | 0.0% |
| Arts & Humanities | 60 | 8.3% |
| Total | 726 | 100.0% |
Transportation & Commute in Lake Montezuma
Vehicle Availability by Sex in Lake Montezuma
The most prevalent vehicle ownership categories in Lake Montezuma are males with 2 vehicles (396, accounting for 53.8%) and females with 2 vehicles (407, making up 40.3%).
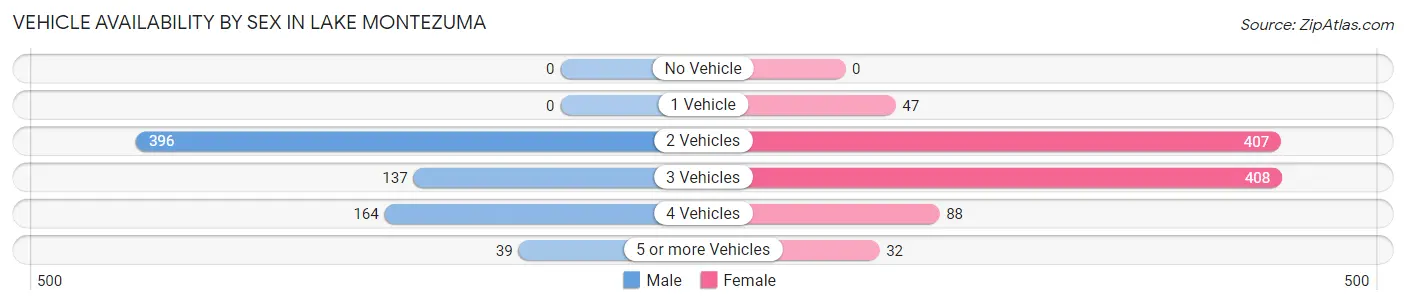
| Vehicles Available | Male | Female |
| No Vehicle | 0 (0.0%) | 0 (0.0%) |
| 1 Vehicle | 0 (0.0%) | 47 (4.8%) |
| 2 Vehicles | 396 (53.8%) | 407 (41.4%) |
| 3 Vehicles | 137 (18.6%) | 408 (41.5%) |
| 4 Vehicles | 164 (22.3%) | 88 (9.0%) |
| 5 or more Vehicles | 39 (5.3%) | 32 (3.3%) |
| Total | 736 (100.0%) | 982 (100.0%) |
Commute Time in Lake Montezuma
The most frequently occuring commute durations in Lake Montezuma are 30 to 34 minutes (467 commuters, 27.7%), 15 to 19 minutes (318 commuters, 18.9%), and 45 to 59 minutes (269 commuters, 16.0%).
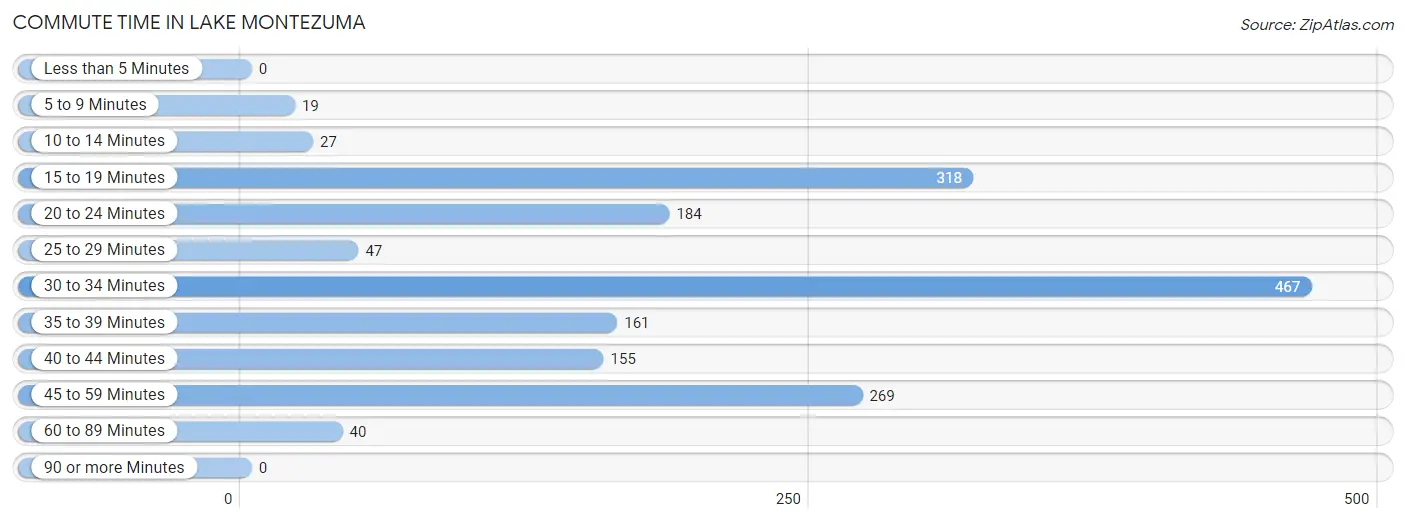
| Commute Time | # Commuters | % Commuters |
| Less than 5 Minutes | 0 | 0.0% |
| 5 to 9 Minutes | 19 | 1.1% |
| 10 to 14 Minutes | 27 | 1.6% |
| 15 to 19 Minutes | 318 | 18.9% |
| 20 to 24 Minutes | 184 | 10.9% |
| 25 to 29 Minutes | 47 | 2.8% |
| 30 to 34 Minutes | 467 | 27.7% |
| 35 to 39 Minutes | 161 | 9.5% |
| 40 to 44 Minutes | 155 | 9.2% |
| 45 to 59 Minutes | 269 | 16.0% |
| 60 to 89 Minutes | 40 | 2.4% |
| 90 or more Minutes | 0 | 0.0% |
Commute Time by Sex in Lake Montezuma
The most common commute times in Lake Montezuma are 15 to 19 minutes (237 commuters, 32.2%) for males and 30 to 34 minutes (233 commuters, 24.5%) for females.
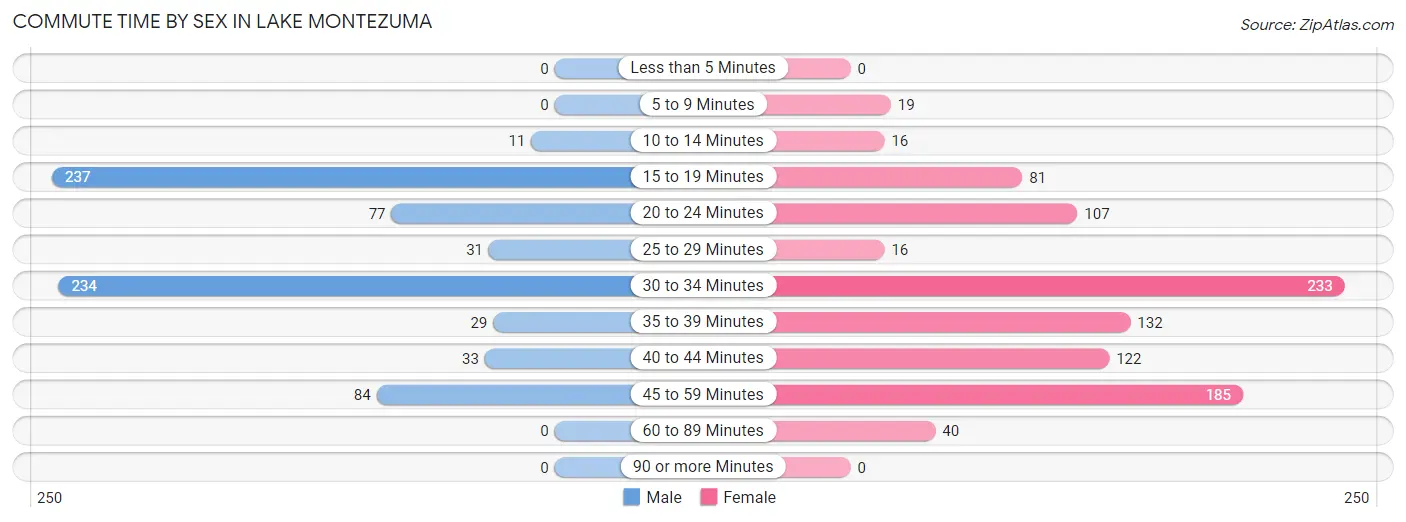
| Commute Time | Male | Female |
| Less than 5 Minutes | 0 (0.0%) | 0 (0.0%) |
| 5 to 9 Minutes | 0 (0.0%) | 19 (2.0%) |
| 10 to 14 Minutes | 11 (1.5%) | 16 (1.7%) |
| 15 to 19 Minutes | 237 (32.2%) | 81 (8.5%) |
| 20 to 24 Minutes | 77 (10.5%) | 107 (11.3%) |
| 25 to 29 Minutes | 31 (4.2%) | 16 (1.7%) |
| 30 to 34 Minutes | 234 (31.8%) | 233 (24.5%) |
| 35 to 39 Minutes | 29 (3.9%) | 132 (13.9%) |
| 40 to 44 Minutes | 33 (4.5%) | 122 (12.8%) |
| 45 to 59 Minutes | 84 (11.4%) | 185 (19.5%) |
| 60 to 89 Minutes | 0 (0.0%) | 40 (4.2%) |
| 90 or more Minutes | 0 (0.0%) | 0 (0.0%) |
Time of Departure to Work by Sex in Lake Montezuma
The most frequent times of departure to work in Lake Montezuma are 5:30 AM to 5:59 AM (163, 22.2%) for males and 6:30 AM to 6:59 AM (255, 26.8%) for females.
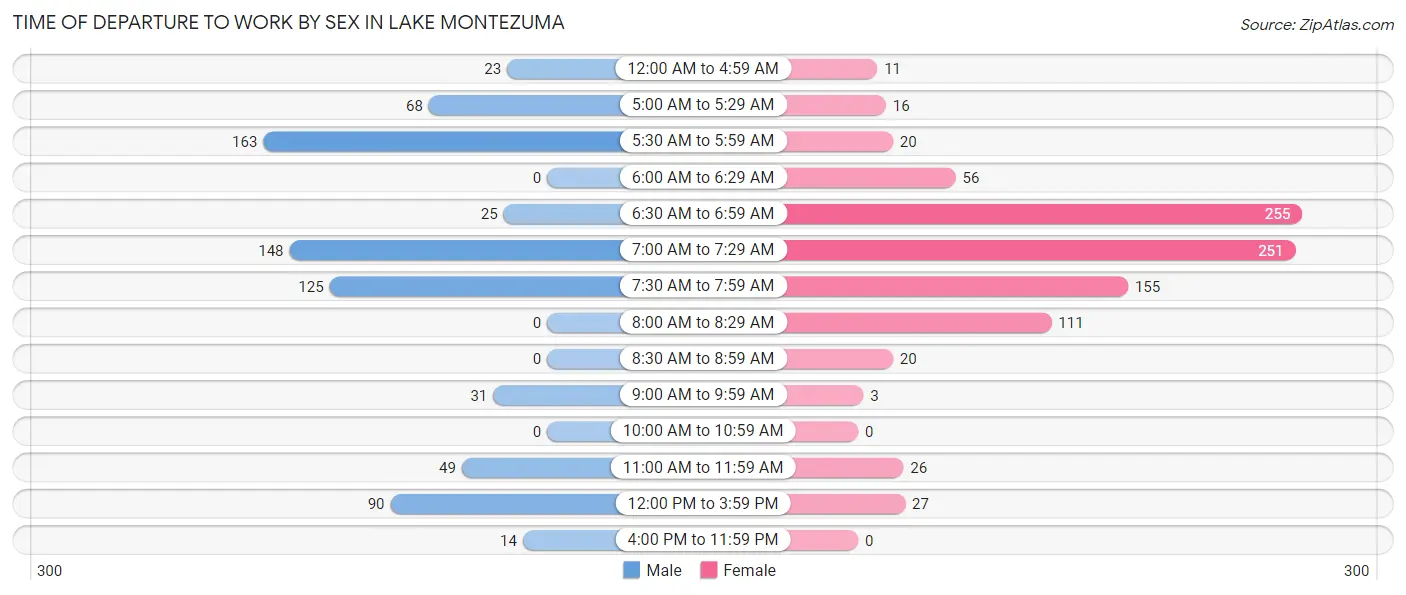
| Time of Departure | Male | Female |
| 12:00 AM to 4:59 AM | 23 (3.1%) | 11 (1.2%) |
| 5:00 AM to 5:29 AM | 68 (9.2%) | 16 (1.7%) |
| 5:30 AM to 5:59 AM | 163 (22.2%) | 20 (2.1%) |
| 6:00 AM to 6:29 AM | 0 (0.0%) | 56 (5.9%) |
| 6:30 AM to 6:59 AM | 25 (3.4%) | 255 (26.8%) |
| 7:00 AM to 7:29 AM | 148 (20.1%) | 251 (26.4%) |
| 7:30 AM to 7:59 AM | 125 (17.0%) | 155 (16.3%) |
| 8:00 AM to 8:29 AM | 0 (0.0%) | 111 (11.7%) |
| 8:30 AM to 8:59 AM | 0 (0.0%) | 20 (2.1%) |
| 9:00 AM to 9:59 AM | 31 (4.2%) | 3 (0.3%) |
| 10:00 AM to 10:59 AM | 0 (0.0%) | 0 (0.0%) |
| 11:00 AM to 11:59 AM | 49 (6.7%) | 26 (2.7%) |
| 12:00 PM to 3:59 PM | 90 (12.2%) | 27 (2.8%) |
| 4:00 PM to 11:59 PM | 14 (1.9%) | 0 (0.0%) |
| Total | 736 (100.0%) | 951 (100.0%) |
Housing Occupancy in Lake Montezuma
Occupancy by Ownership in Lake Montezuma
Of the total 2,491 dwellings in Lake Montezuma, owner-occupied units account for 1,590 (63.8%), while renter-occupied units make up 901 (36.2%).
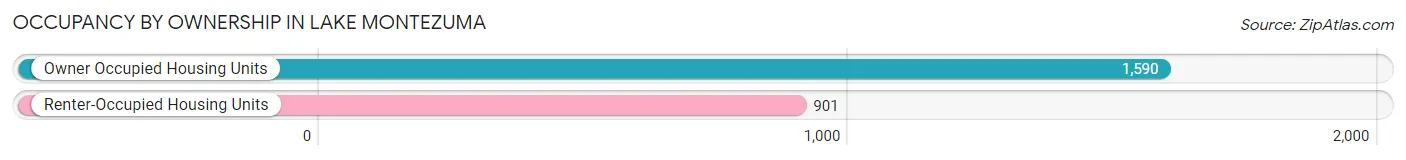
| Occupancy | # Housing Units | % Housing Units |
| Owner Occupied Housing Units | 1,590 | 63.8% |
| Renter-Occupied Housing Units | 901 | 36.2% |
| Total Occupied Housing Units | 2,491 | 100.0% |
Occupancy by Household Size in Lake Montezuma
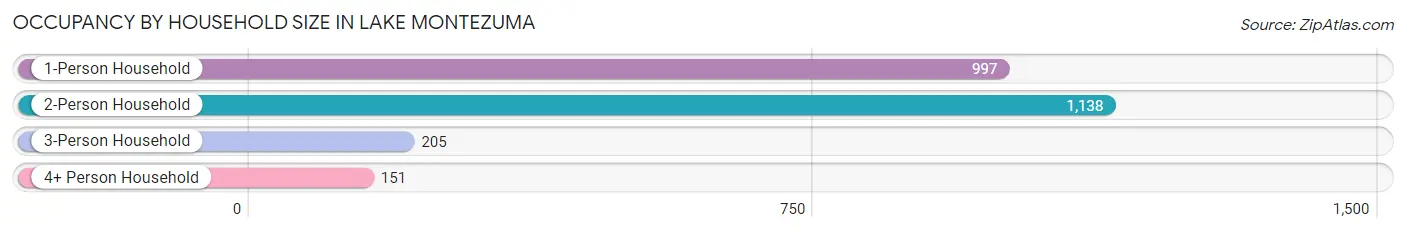
| Household Size | # Housing Units | % Housing Units |
| 1-Person Household | 997 | 40.0% |
| 2-Person Household | 1,138 | 45.7% |
| 3-Person Household | 205 | 8.2% |
| 4+ Person Household | 151 | 6.1% |
| Total Housing Units | 2,491 | 100.0% |
Occupancy by Ownership by Household Size in Lake Montezuma
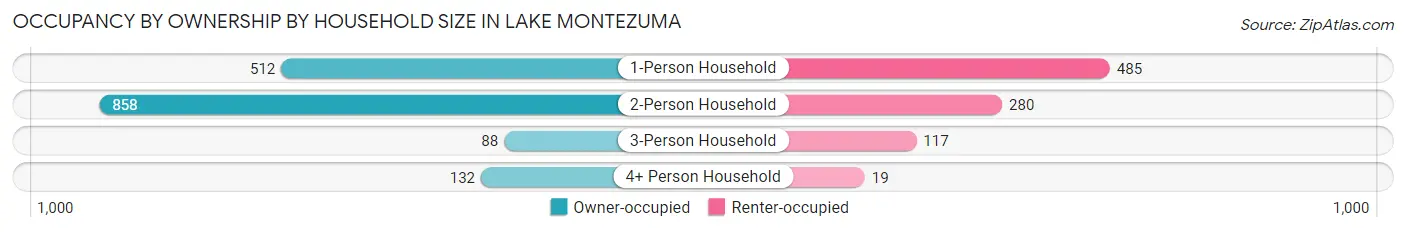
| Household Size | Owner-occupied | Renter-occupied |
| 1-Person Household | 512 (51.3%) | 485 (48.6%) |
| 2-Person Household | 858 (75.4%) | 280 (24.6%) |
| 3-Person Household | 88 (42.9%) | 117 (57.1%) |
| 4+ Person Household | 132 (87.4%) | 19 (12.6%) |
| Total Housing Units | 1,590 (63.8%) | 901 (36.2%) |
Occupancy by Educational Attainment in Lake Montezuma
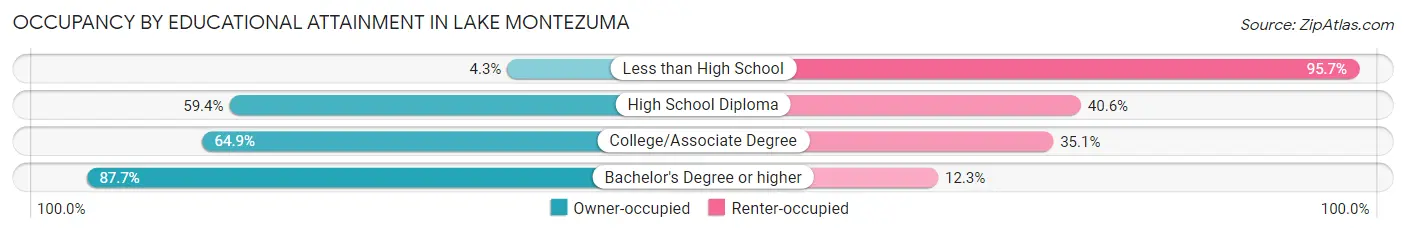
| Household Size | Owner-occupied | Renter-occupied |
| Less than High School | 6 (4.3%) | 133 (95.7%) |
| High School Diploma | 322 (59.4%) | 220 (40.6%) |
| College/Associate Degree | 926 (64.9%) | 501 (35.1%) |
| Bachelor's Degree or higher | 336 (87.7%) | 47 (12.3%) |
Occupancy by Age of Householder in Lake Montezuma
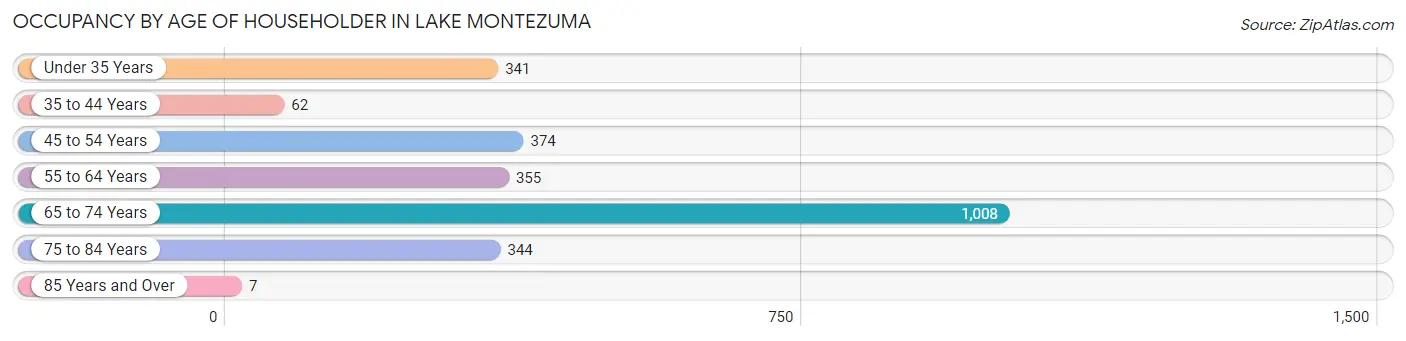
| Age Bracket | # Households | % Households |
| Under 35 Years | 341 | 13.7% |
| 35 to 44 Years | 62 | 2.5% |
| 45 to 54 Years | 374 | 15.0% |
| 55 to 64 Years | 355 | 14.2% |
| 65 to 74 Years | 1,008 | 40.5% |
| 75 to 84 Years | 344 | 13.8% |
| 85 Years and Over | 7 | 0.3% |
| Total | 2,491 | 100.0% |
Housing Finances in Lake Montezuma
Median Income by Occupancy in Lake Montezuma
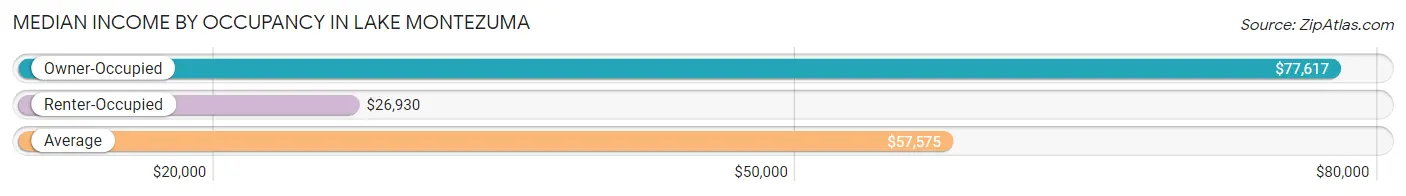
| Occupancy Type | # Households | Median Income |
| Owner-Occupied | 1,590 (63.8%) | $77,617 |
| Renter-Occupied | 901 (36.2%) | $26,930 |
| Average | 2,491 (100.0%) | $57,575 |
Occupancy by Householder Income Bracket in Lake Montezuma
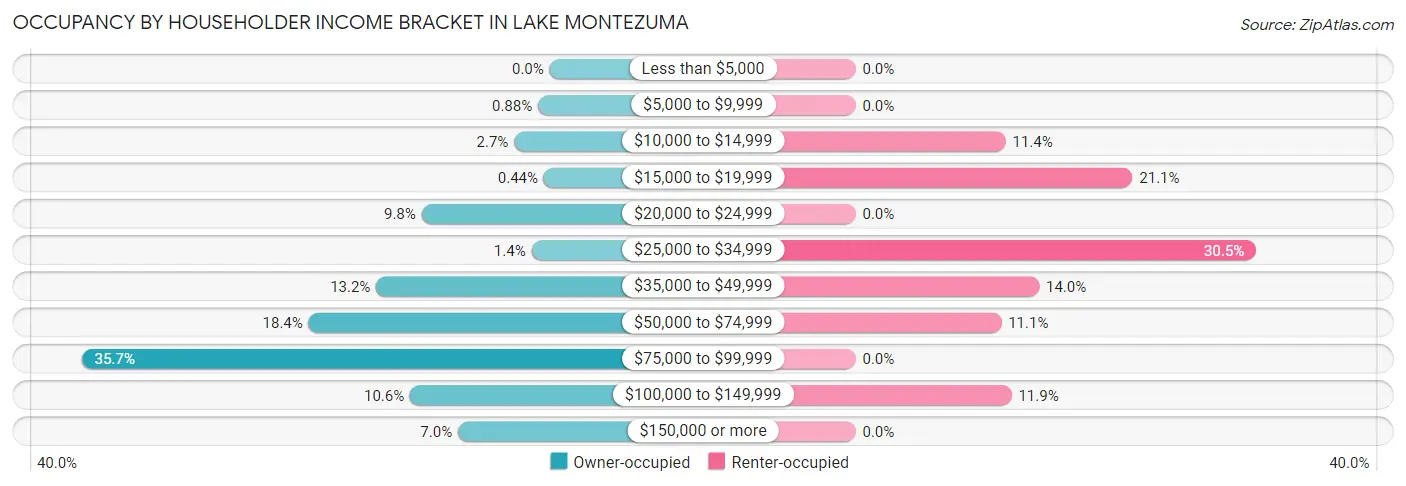
| Income Bracket | Owner-occupied | Renter-occupied |
| Less than $5,000 | 0 (0.0%) | 0 (0.0%) |
| $5,000 to $9,999 | 14 (0.9%) | 0 (0.0%) |
| $10,000 to $14,999 | 43 (2.7%) | 103 (11.4%) |
| $15,000 to $19,999 | 7 (0.4%) | 190 (21.1%) |
| $20,000 to $24,999 | 155 (9.8%) | 0 (0.0%) |
| $25,000 to $34,999 | 22 (1.4%) | 275 (30.5%) |
| $35,000 to $49,999 | 210 (13.2%) | 126 (14.0%) |
| $50,000 to $74,999 | 292 (18.4%) | 100 (11.1%) |
| $75,000 to $99,999 | 567 (35.7%) | 0 (0.0%) |
| $100,000 to $149,999 | 169 (10.6%) | 107 (11.9%) |
| $150,000 or more | 111 (7.0%) | 0 (0.0%) |
| Total | 1,590 (100.0%) | 901 (100.0%) |
Monthly Housing Cost Tiers in Lake Montezuma
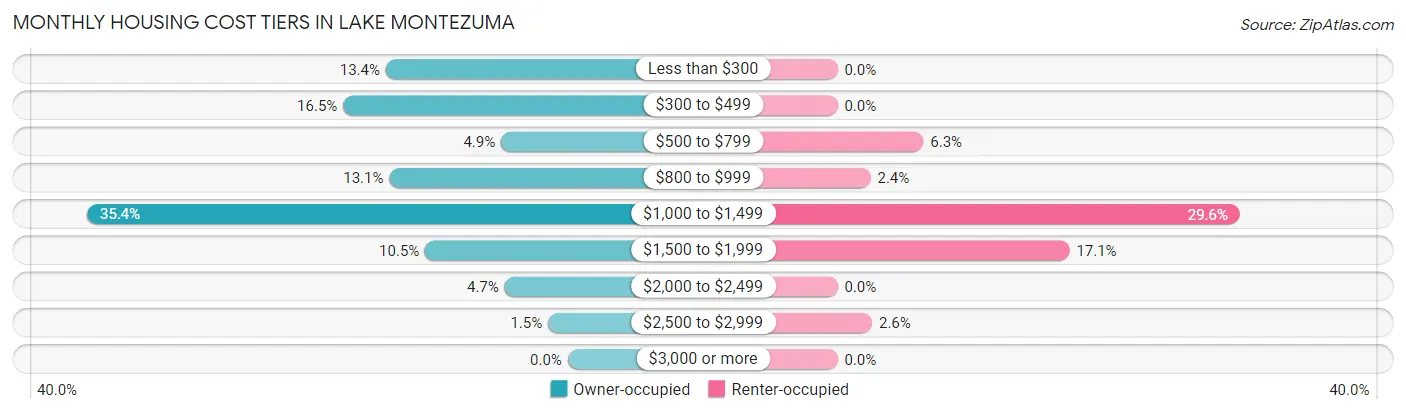
| Monthly Cost | Owner-occupied | Renter-occupied |
| Less than $300 | 213 (13.4%) | 0 (0.0%) |
| $300 to $499 | 263 (16.5%) | 0 (0.0%) |
| $500 to $799 | 78 (4.9%) | 57 (6.3%) |
| $800 to $999 | 209 (13.1%) | 22 (2.4%) |
| $1,000 to $1,499 | 563 (35.4%) | 267 (29.6%) |
| $1,500 to $1,999 | 167 (10.5%) | 154 (17.1%) |
| $2,000 to $2,499 | 74 (4.6%) | 0 (0.0%) |
| $2,500 to $2,999 | 23 (1.5%) | 23 (2.5%) |
| $3,000 or more | 0 (0.0%) | 0 (0.0%) |
| Total | 1,590 (100.0%) | 901 (100.0%) |
Physical Housing Characteristics in Lake Montezuma
Housing Structures in Lake Montezuma
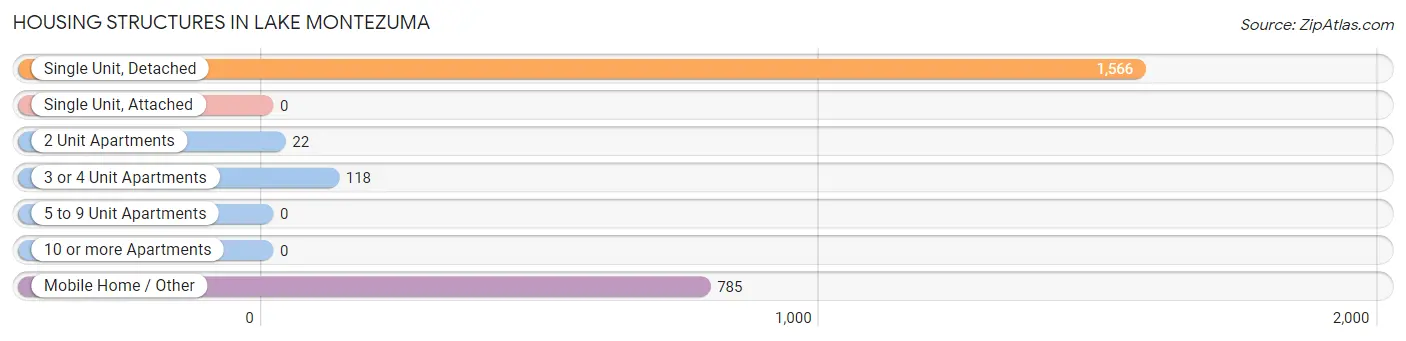
| Structure Type | # Housing Units | % Housing Units |
| Single Unit, Detached | 1,566 | 62.9% |
| Single Unit, Attached | 0 | 0.0% |
| 2 Unit Apartments | 22 | 0.9% |
| 3 or 4 Unit Apartments | 118 | 4.7% |
| 5 to 9 Unit Apartments | 0 | 0.0% |
| 10 or more Apartments | 0 | 0.0% |
| Mobile Home / Other | 785 | 31.5% |
| Total | 2,491 | 100.0% |
Housing Structures by Occupancy in Lake Montezuma
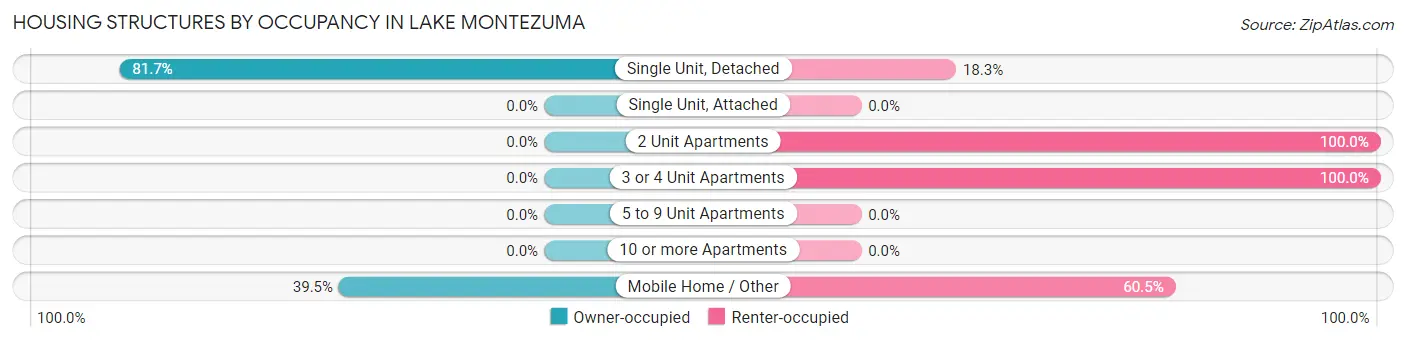
| Structure Type | Owner-occupied | Renter-occupied |
| Single Unit, Detached | 1,280 (81.7%) | 286 (18.3%) |
| Single Unit, Attached | 0 (0.0%) | 0 (0.0%) |
| 2 Unit Apartments | 0 (0.0%) | 22 (100.0%) |
| 3 or 4 Unit Apartments | 0 (0.0%) | 118 (100.0%) |
| 5 to 9 Unit Apartments | 0 (0.0%) | 0 (0.0%) |
| 10 or more Apartments | 0 (0.0%) | 0 (0.0%) |
| Mobile Home / Other | 310 (39.5%) | 475 (60.5%) |
| Total | 1,590 (63.8%) | 901 (36.2%) |
Housing Structures by Number of Rooms in Lake Montezuma
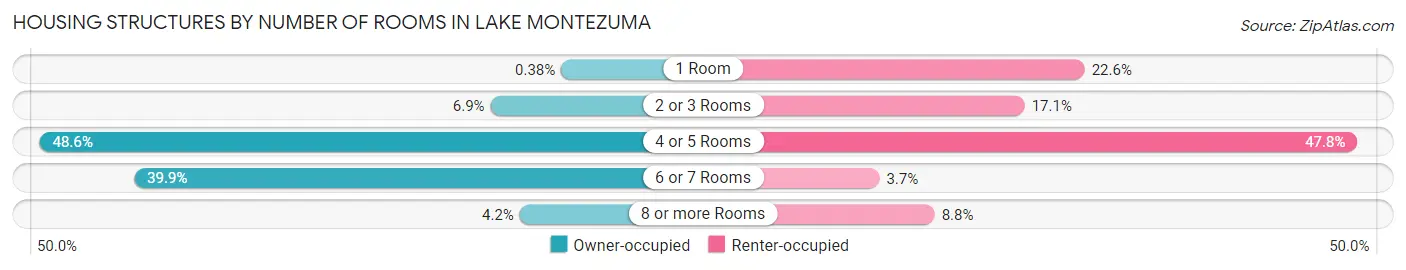
| Number of Rooms | Owner-occupied | Renter-occupied |
| 1 Room | 6 (0.4%) | 204 (22.6%) |
| 2 or 3 Rooms | 110 (6.9%) | 154 (17.1%) |
| 4 or 5 Rooms | 773 (48.6%) | 431 (47.8%) |
| 6 or 7 Rooms | 634 (39.9%) | 33 (3.7%) |
| 8 or more Rooms | 67 (4.2%) | 79 (8.8%) |
| Total | 1,590 (100.0%) | 901 (100.0%) |
Housing Structure by Heating Type in Lake Montezuma
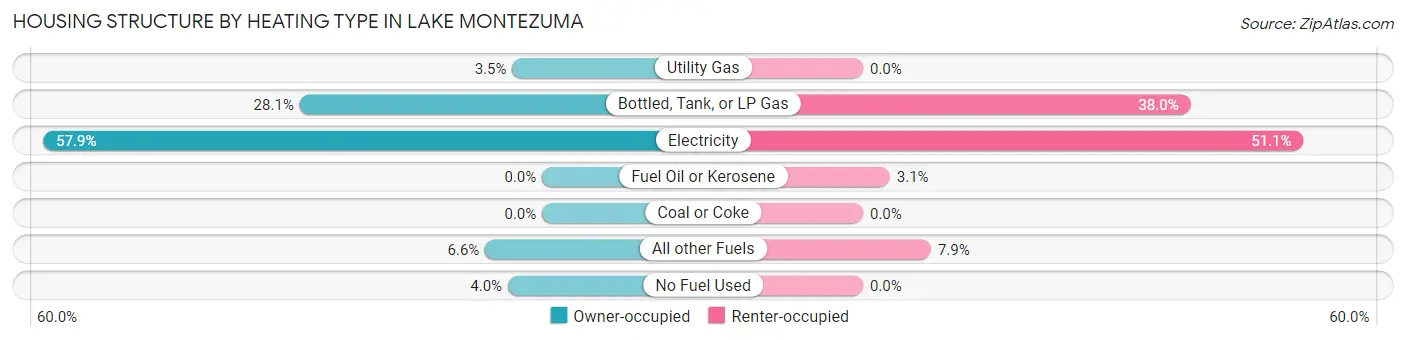
| Heating Type | Owner-occupied | Renter-occupied |
| Utility Gas | 55 (3.5%) | 0 (0.0%) |
| Bottled, Tank, or LP Gas | 447 (28.1%) | 342 (38.0%) |
| Electricity | 920 (57.9%) | 460 (51.0%) |
| Fuel Oil or Kerosene | 0 (0.0%) | 28 (3.1%) |
| Coal or Coke | 0 (0.0%) | 0 (0.0%) |
| All other Fuels | 105 (6.6%) | 71 (7.9%) |
| No Fuel Used | 63 (4.0%) | 0 (0.0%) |
| Total | 1,590 (100.0%) | 901 (100.0%) |
Household Vehicle Usage in Lake Montezuma
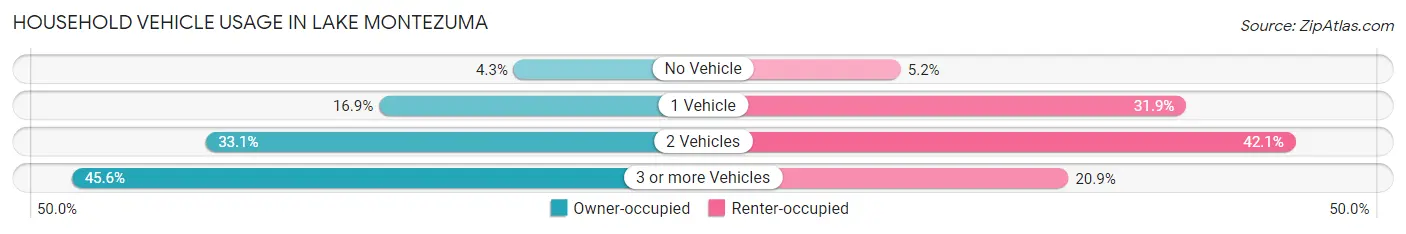
| Vehicles per Household | Owner-occupied | Renter-occupied |
| No Vehicle | 69 (4.3%) | 47 (5.2%) |
| 1 Vehicle | 269 (16.9%) | 287 (31.9%) |
| 2 Vehicles | 527 (33.1%) | 379 (42.1%) |
| 3 or more Vehicles | 725 (45.6%) | 188 (20.9%) |
| Total | 1,590 (100.0%) | 901 (100.0%) |
Real Estate & Mortgages in Lake Montezuma
Real Estate and Mortgage Overview in Lake Montezuma
| Characteristic | Without Mortgage | With Mortgage |
| Housing Units | 620 | 970 |
| Median Property Value | $242,200 | $284,700 |
| Median Household Income | $52,157 | $104 |
| Monthly Housing Costs | $394 | $0 |
| Real Estate Taxes | $1,237 | $4 |
Property Value by Mortgage Status in Lake Montezuma
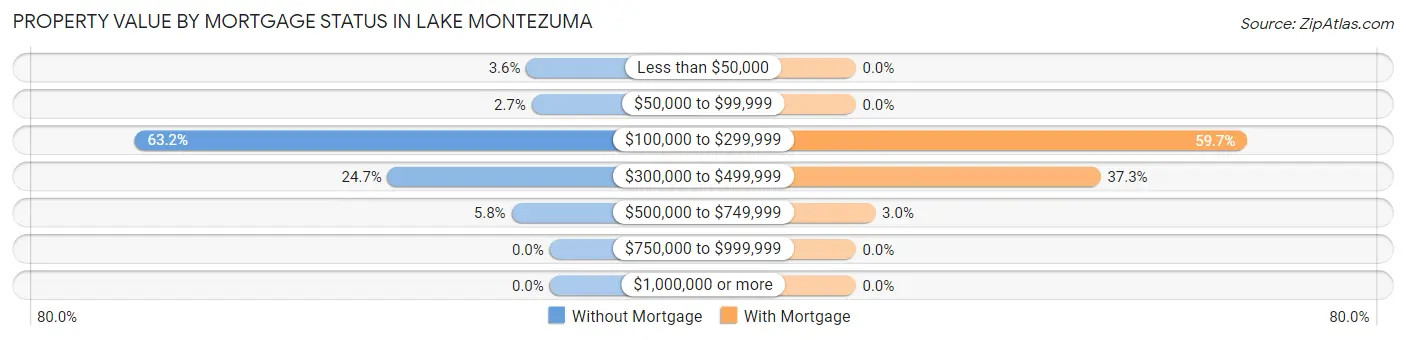
| Property Value | Without Mortgage | With Mortgage |
| Less than $50,000 | 22 (3.5%) | 0 (0.0%) |
| $50,000 to $99,999 | 17 (2.7%) | 0 (0.0%) |
| $100,000 to $299,999 | 392 (63.2%) | 579 (59.7%) |
| $300,000 to $499,999 | 153 (24.7%) | 362 (37.3%) |
| $500,000 to $749,999 | 36 (5.8%) | 29 (3.0%) |
| $750,000 to $999,999 | 0 (0.0%) | 0 (0.0%) |
| $1,000,000 or more | 0 (0.0%) | 0 (0.0%) |
| Total | 620 (100.0%) | 970 (100.0%) |
Household Income by Mortgage Status in Lake Montezuma
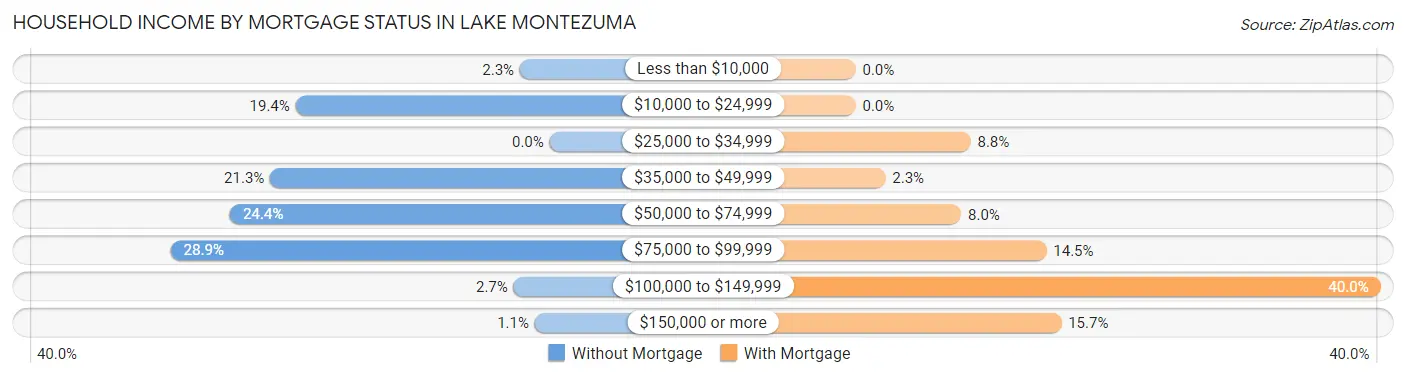
| Household Income | Without Mortgage | With Mortgage |
| Less than $10,000 | 14 (2.3%) | 0 (0.0%) |
| $10,000 to $24,999 | 120 (19.4%) | 0 (0.0%) |
| $25,000 to $34,999 | 0 (0.0%) | 85 (8.8%) |
| $35,000 to $49,999 | 132 (21.3%) | 22 (2.3%) |
| $50,000 to $74,999 | 151 (24.3%) | 78 (8.0%) |
| $75,000 to $99,999 | 179 (28.9%) | 141 (14.5%) |
| $100,000 to $149,999 | 17 (2.7%) | 388 (40.0%) |
| $150,000 or more | 7 (1.1%) | 152 (15.7%) |
| Total | 620 (100.0%) | 970 (100.0%) |
Property Value to Household Income Ratio in Lake Montezuma
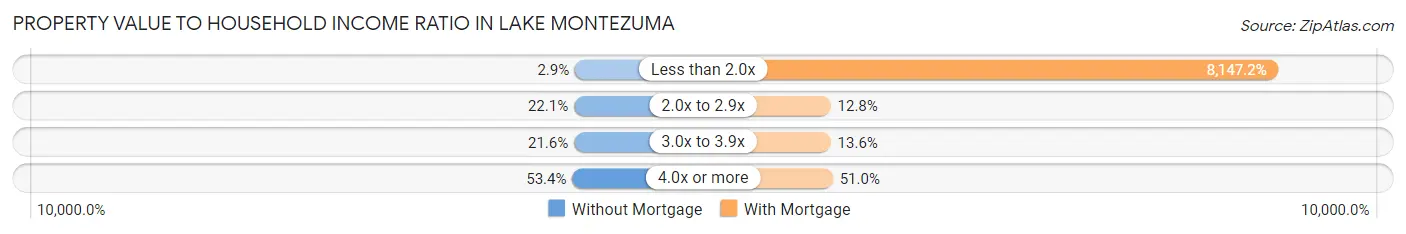
| Value-to-Income Ratio | Without Mortgage | With Mortgage |
| Less than 2.0x | 18 (2.9%) | 79,028 (8,147.2%) |
| 2.0x to 2.9x | 137 (22.1%) | 124 (12.8%) |
| 3.0x to 3.9x | 134 (21.6%) | 132 (13.6%) |
| 4.0x or more | 331 (53.4%) | 495 (51.0%) |
| Total | 620 (100.0%) | 970 (100.0%) |
Real Estate Taxes by Mortgage Status in Lake Montezuma
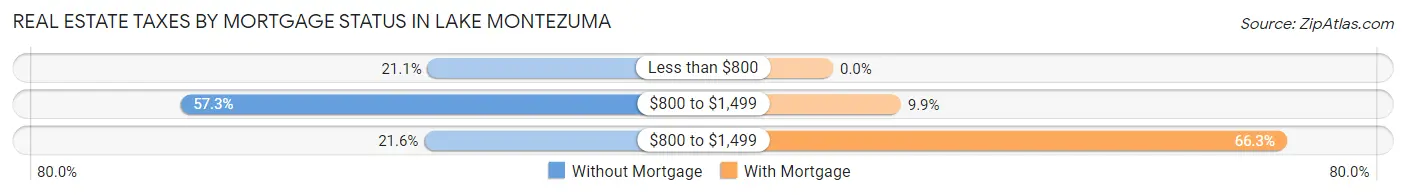
| Property Taxes | Without Mortgage | With Mortgage |
| Less than $800 | 131 (21.1%) | 0 (0.0%) |
| $800 to $1,499 | 355 (57.3%) | 96 (9.9%) |
| $800 to $1,499 | 134 (21.6%) | 643 (66.3%) |
| Total | 620 (100.0%) | 970 (100.0%) |
Health & Disability in Lake Montezuma
Health Insurance Coverage by Age in Lake Montezuma
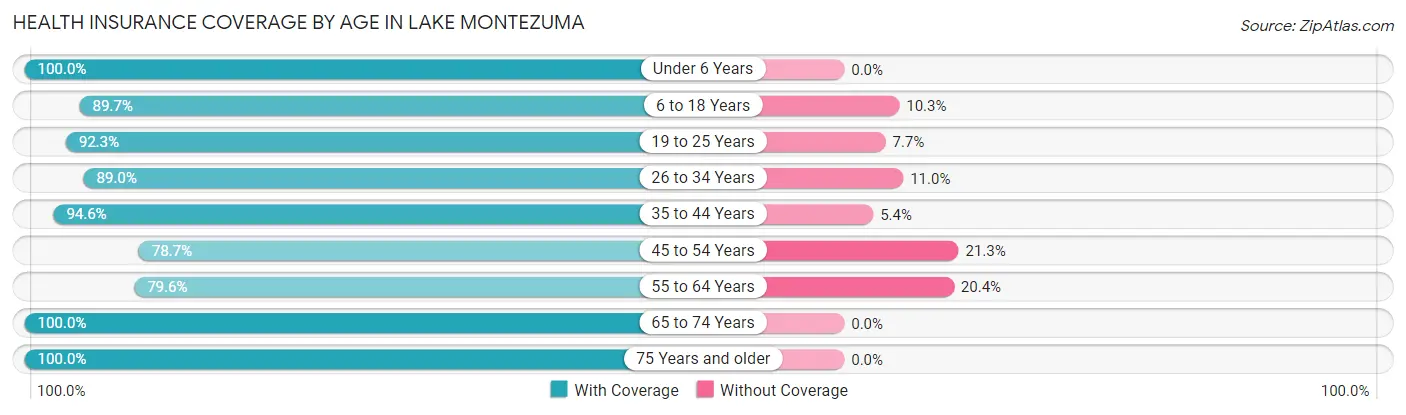
| Age Bracket | With Coverage | Without Coverage |
| Under 6 Years | 46 (100.0%) | 0 (0.0%) |
| 6 to 18 Years | 280 (89.7%) | 32 (10.3%) |
| 19 to 25 Years | 336 (92.3%) | 28 (7.7%) |
| 26 to 34 Years | 340 (89.0%) | 42 (11.0%) |
| 35 to 44 Years | 158 (94.6%) | 9 (5.4%) |
| 45 to 54 Years | 340 (78.7%) | 92 (21.3%) |
| 55 to 64 Years | 681 (79.6%) | 175 (20.4%) |
| 65 to 74 Years | 1,527 (100.0%) | 0 (0.0%) |
| 75 Years and older | 440 (100.0%) | 0 (0.0%) |
| Total | 4,148 (91.6%) | 378 (8.4%) |
Health Insurance Coverage by Citizenship Status in Lake Montezuma
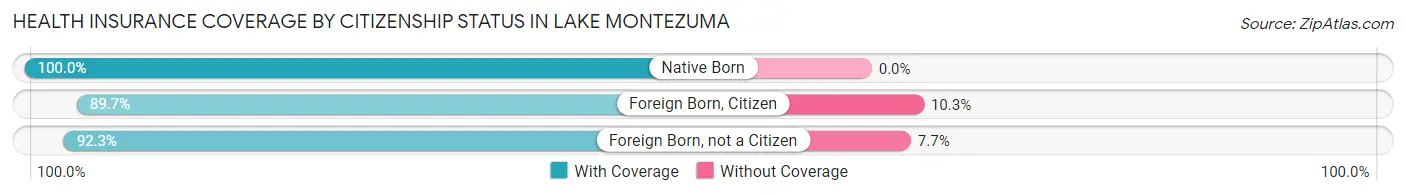
| Citizenship Status | With Coverage | Without Coverage |
| Native Born | 46 (100.0%) | 0 (0.0%) |
| Foreign Born, Citizen | 280 (89.7%) | 32 (10.3%) |
| Foreign Born, not a Citizen | 336 (92.3%) | 28 (7.7%) |
Health Insurance Coverage by Household Income in Lake Montezuma
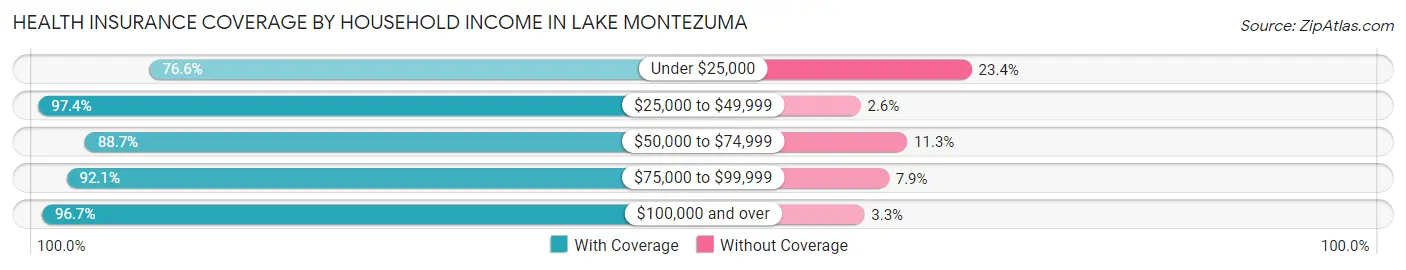
| Household Income | With Coverage | Without Coverage |
| Under $25,000 | 465 (76.6%) | 142 (23.4%) |
| $25,000 to $49,999 | 986 (97.4%) | 26 (2.6%) |
| $50,000 to $74,999 | 596 (88.7%) | 76 (11.3%) |
| $75,000 to $99,999 | 1,218 (92.1%) | 104 (7.9%) |
| $100,000 and over | 883 (96.7%) | 30 (3.3%) |
Public vs Private Health Insurance Coverage by Age in Lake Montezuma
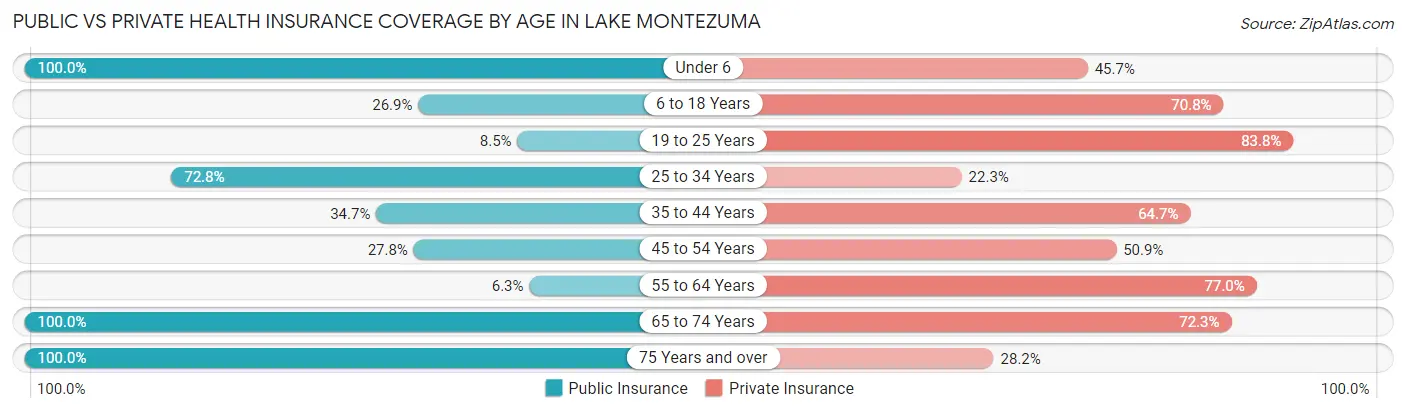
| Age Bracket | Public Insurance | Private Insurance |
| Under 6 | 46 (100.0%) | 21 (45.7%) |
| 6 to 18 Years | 84 (26.9%) | 221 (70.8%) |
| 19 to 25 Years | 31 (8.5%) | 305 (83.8%) |
| 25 to 34 Years | 278 (72.8%) | 85 (22.3%) |
| 35 to 44 Years | 58 (34.7%) | 108 (64.7%) |
| 45 to 54 Years | 120 (27.8%) | 220 (50.9%) |
| 55 to 64 Years | 54 (6.3%) | 659 (77.0%) |
| 65 to 74 Years | 1,527 (100.0%) | 1,104 (72.3%) |
| 75 Years and over | 440 (100.0%) | 124 (28.2%) |
| Total | 2,638 (58.3%) | 2,847 (62.9%) |
Disability Status by Sex by Age in Lake Montezuma
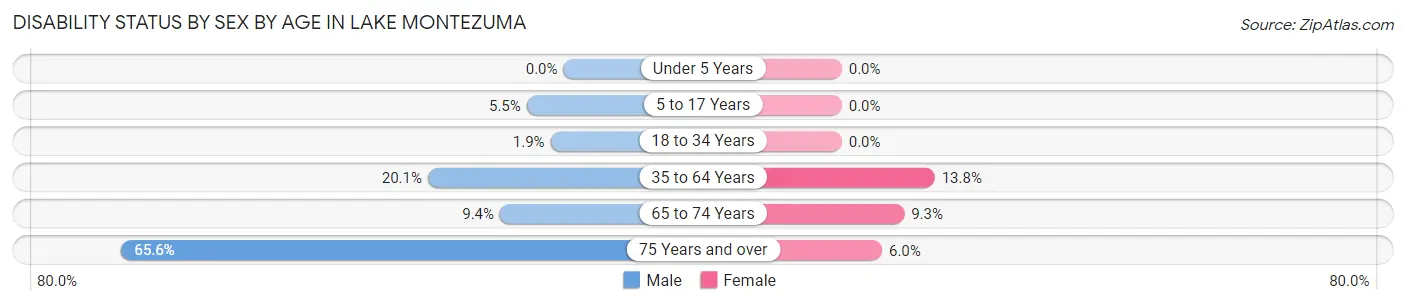
| Age Bracket | Male | Female |
| Under 5 Years | 0 (0.0%) | 0 (0.0%) |
| 5 to 17 Years | 3 (5.4%) | 0 (0.0%) |
| 18 to 34 Years | 10 (1.9%) | 0 (0.0%) |
| 35 to 64 Years | 96 (20.1%) | 135 (13.8%) |
| 65 to 74 Years | 86 (9.4%) | 57 (9.3%) |
| 75 Years and over | 168 (65.6%) | 11 (6.0%) |
Disability Class by Sex by Age in Lake Montezuma
Disability Class: Hearing Difficulty
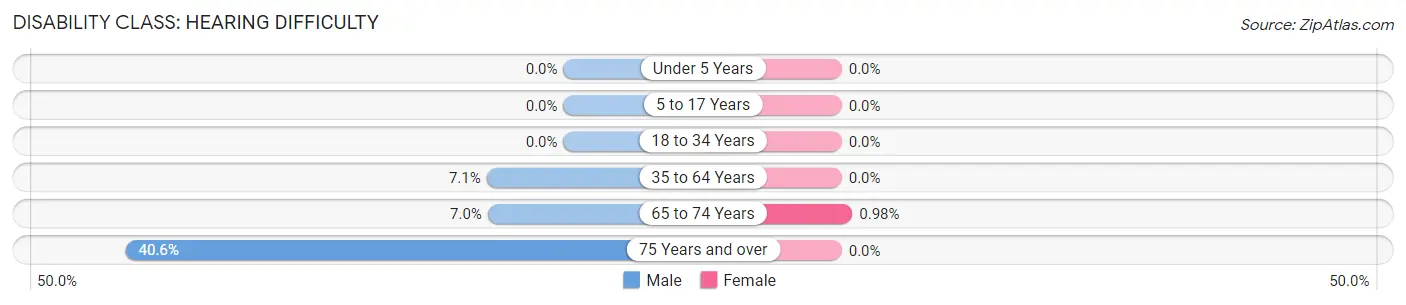
| Age Bracket | Male | Female |
| Under 5 Years | 0 (0.0%) | 0 (0.0%) |
| 5 to 17 Years | 0 (0.0%) | 0 (0.0%) |
| 18 to 34 Years | 0 (0.0%) | 0 (0.0%) |
| 35 to 64 Years | 34 (7.1%) | 0 (0.0%) |
| 65 to 74 Years | 64 (7.0%) | 6 (1.0%) |
| 75 Years and over | 104 (40.6%) | 0 (0.0%) |
Disability Class: Vision Difficulty
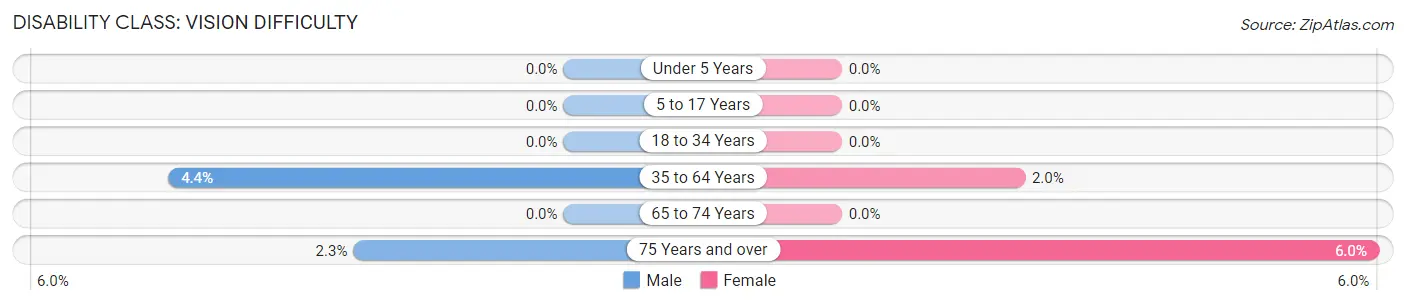
| Age Bracket | Male | Female |
| Under 5 Years | 0 (0.0%) | 0 (0.0%) |
| 5 to 17 Years | 0 (0.0%) | 0 (0.0%) |
| 18 to 34 Years | 0 (0.0%) | 0 (0.0%) |
| 35 to 64 Years | 21 (4.4%) | 20 (2.0%) |
| 65 to 74 Years | 0 (0.0%) | 0 (0.0%) |
| 75 Years and over | 6 (2.3%) | 11 (6.0%) |
Disability Class: Cognitive Difficulty
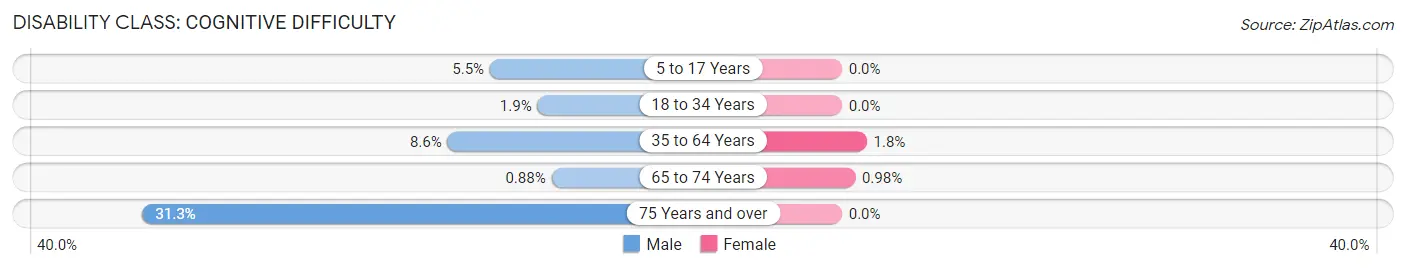
| Age Bracket | Male | Female |
| 5 to 17 Years | 3 (5.4%) | 0 (0.0%) |
| 18 to 34 Years | 10 (1.9%) | 0 (0.0%) |
| 35 to 64 Years | 41 (8.6%) | 18 (1.8%) |
| 65 to 74 Years | 8 (0.9%) | 6 (1.0%) |
| 75 Years and over | 80 (31.2%) | 0 (0.0%) |
Disability Class: Ambulatory Difficulty
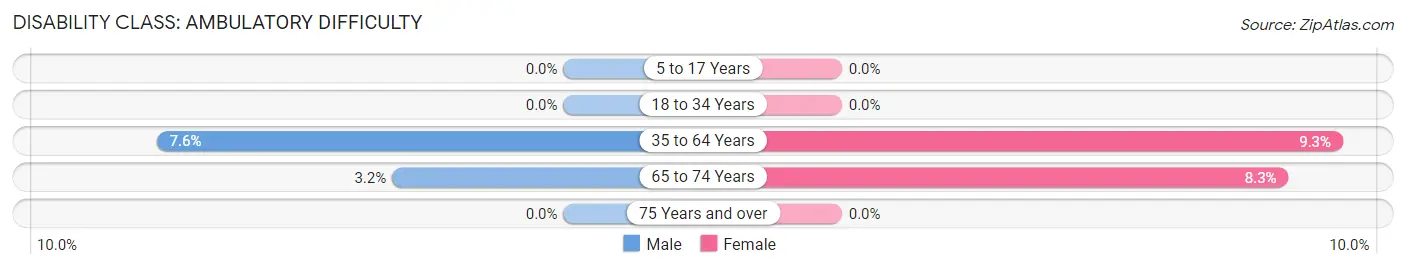
| Age Bracket | Male | Female |
| 5 to 17 Years | 0 (0.0%) | 0 (0.0%) |
| 18 to 34 Years | 0 (0.0%) | 0 (0.0%) |
| 35 to 64 Years | 36 (7.5%) | 91 (9.3%) |
| 65 to 74 Years | 29 (3.2%) | 51 (8.3%) |
| 75 Years and over | 0 (0.0%) | 0 (0.0%) |
Disability Class: Self-Care Difficulty
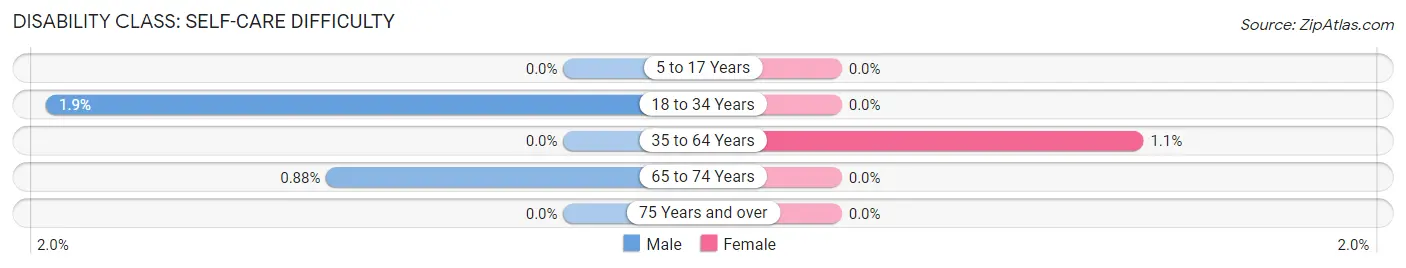
| Age Bracket | Male | Female |
| 5 to 17 Years | 0 (0.0%) | 0 (0.0%) |
| 18 to 34 Years | 10 (1.9%) | 0 (0.0%) |
| 35 to 64 Years | 0 (0.0%) | 11 (1.1%) |
| 65 to 74 Years | 8 (0.9%) | 0 (0.0%) |
| 75 Years and over | 0 (0.0%) | 0 (0.0%) |
Technology Access in Lake Montezuma
Computing Device Access in Lake Montezuma
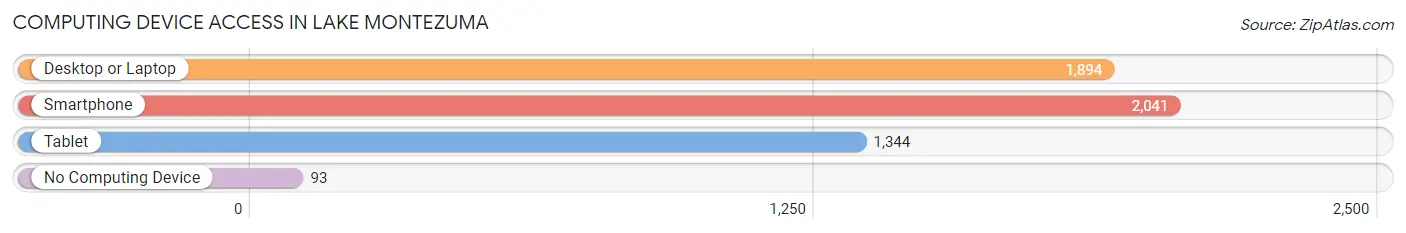
| Device Type | # Households | % Households |
| Desktop or Laptop | 1,894 | 76.0% |
| Smartphone | 2,041 | 81.9% |
| Tablet | 1,344 | 53.9% |
| No Computing Device | 93 | 3.7% |
| Total | 2,491 | 100.0% |
Internet Access in Lake Montezuma
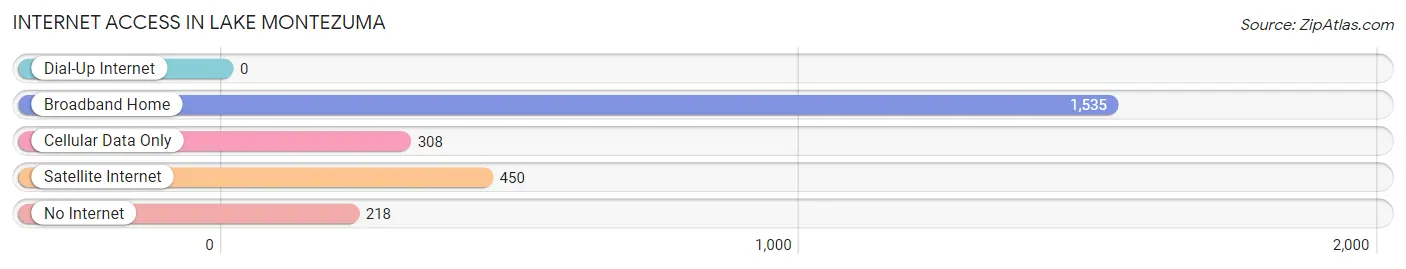
| Internet Type | # Households | % Households |
| Dial-Up Internet | 0 | 0.0% |
| Broadband Home | 1,535 | 61.6% |
| Cellular Data Only | 308 | 12.4% |
| Satellite Internet | 450 | 18.1% |
| No Internet | 218 | 8.7% |
| Total | 2,491 | 100.0% |
Lake Montezuma Summary
History
The area now known as Lake Montezuma, Arizona was first inhabited by the Yavapai people, who lived in the area for centuries before the arrival of Europeans. The first Europeans to explore the area were Spanish missionaries, who arrived in the late 1700s. The area was later explored by American settlers in the mid-1800s, and the first settlement was established in 1876. The settlement was named Montezuma, after the Aztec emperor, and the area was later renamed Lake Montezuma in the early 1900s.
The area was initially used for ranching and farming, and the first post office was established in 1883. The town grew slowly, and by the early 1900s, it had a population of around 200 people. The town was incorporated in 1912, and the first school was built in 1913.
In the 1920s, the area began to attract tourists, and the first hotel was built in 1924. The town continued to grow, and by the 1950s, it had a population of around 500 people.
Geography
Lake Montezuma is located in central Arizona, in Yavapai County. It is situated in the Verde Valley, which is surrounded by the Mogollon Rim to the north and the Bradshaw Mountains to the south. The town is located at an elevation of 4,400 feet, and the climate is semi-arid, with hot summers and mild winters.
The town is located near the Verde River, which is a tributary of the Salt River. The Verde River is a popular destination for fishing, swimming, and boating. The town is also located near several lakes, including Lake Montezuma, which is a popular destination for fishing and boating.
Economy
The economy of Lake Montezuma is largely based on tourism. The town is a popular destination for outdoor activities, such as fishing, boating, hiking, and camping. The town is also home to several restaurants, shops, and art galleries.
The town is also home to several businesses, including a lumber mill, a furniture store, and a hardware store. The town is also home to several small manufacturing companies, including a metal fabrication company and a plastics company.
Demographics
As of the 2010 census, the population of Lake Montezuma was 1,890. The population is largely white (90.2%), with small percentages of Native American (3.2%), Hispanic (2.7%), and African American (1.2%) residents. The median household income is $41,250, and the median age is 44.
Conclusion
Lake Montezuma, Arizona is a small town located in the Verde Valley of central Arizona. The town has a long history, and it was first settled in the late 1800s. The town is a popular destination for outdoor activities, and it is home to several businesses. The population of the town is largely white, and the median household income is $41,250.
Common Questions
What is the Total Population of Lake Montezuma?
Total Population of Lake Montezuma is 4,526.
What is the Total Male Population of Lake Montezuma?
Total Male Population of Lake Montezuma is 2,265.
What is the Total Female Population of Lake Montezuma?
Total Female Population of Lake Montezuma is 2,261.
What is the Ratio of Males per 100 Females in Lake Montezuma?
There are 100.18 Males per 100 Females in Lake Montezuma.
What is the Ratio of Females per 100 Males in Lake Montezuma?
There are 99.82 Females per 100 Males in Lake Montezuma.
What is the Median Population Age in Lake Montezuma?
Median Population Age in Lake Montezuma is 61.8 Years.
What is the Average Family Size in Lake Montezuma
Average Family Size in Lake Montezuma is 2.3 People.
What is the Average Household Size in Lake Montezuma
Average Household Size in Lake Montezuma is 1.8 People.
What is Per Capita Income in Lake Montezuma?
Per Capita income in Lake Montezuma is $36,807.
What is the Median Family Income in Lake Montezuma?
Median Family Income in Lake Montezuma is $78,231.
What is the Median Household income in Lake Montezuma?
Median Household Income in Lake Montezuma is $57,575.
What is Inequality or Gini Index in Lake Montezuma?
Inequality or Gini Index in Lake Montezuma is 0.40.
How Large is the Labor Force in Lake Montezuma?
There are 1,799 People in the Labor Forcein in Lake Montezuma.
What is the Percentage of People in the Labor Force in Lake Montezuma?
42.1% of People are in the Labor Force in Lake Montezuma.
What is the Unemployment Rate in Lake Montezuma?
Unemployment Rate in Lake Montezuma is 2.8%.