Heber Overgaard, AZ
Heber Overgaard Map
Heber Overgaard Overview
2,651
TOTAL POPULATION
1,451
MALE POPULATION
1,200
FEMALE POPULATION
120.92
MALES / 100 FEMALES
82.70
FEMALES / 100 MALES
55.8
MEDIAN AGE
3.1
AVG FAMILY SIZE
2.2
AVG HOUSEHOLD SIZE
$21,211
PER CAPITA INCOME
$51,250
AVG FAMILY INCOME
$39,779
AVG HOUSEHOLD INCOME
3.4%
WAGE / INCOME GAP [ % ]
96.6¢/ $1
WAGE / INCOME GAP [ $ ]
0.39
INEQUALITY / GINI INDEX
945
LABOR FORCE [ PEOPLE ]
40.5%
PERCENT IN LABOR FORCE
26.7%
UNEMPLOYMENT RATE
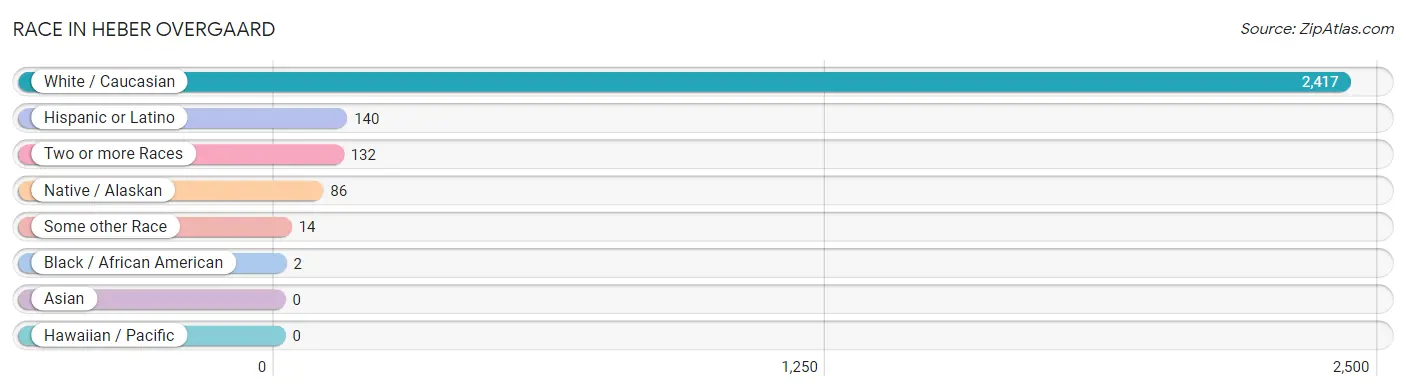
Race in Heber Overgaard
The most populous races in Heber Overgaard are White / Caucasian (2,417 | 91.2%), Hispanic or Latino (140 | 5.3%), and Two or more Races (132 | 5.0%).
| Race | # Population | % Population |
| Asian | 0 | 0.0% |
| Black / African American | 2 | 0.1% |
| Hawaiian / Pacific | 0 | 0.0% |
| Hispanic or Latino | 140 | 5.3% |
| Native / Alaskan | 86 | 3.2% |
| White / Caucasian | 2,417 | 91.2% |
| Two or more Races | 132 | 5.0% |
| Some other Race | 14 | 0.5% |
| Total | 2,651 | 100.0% |
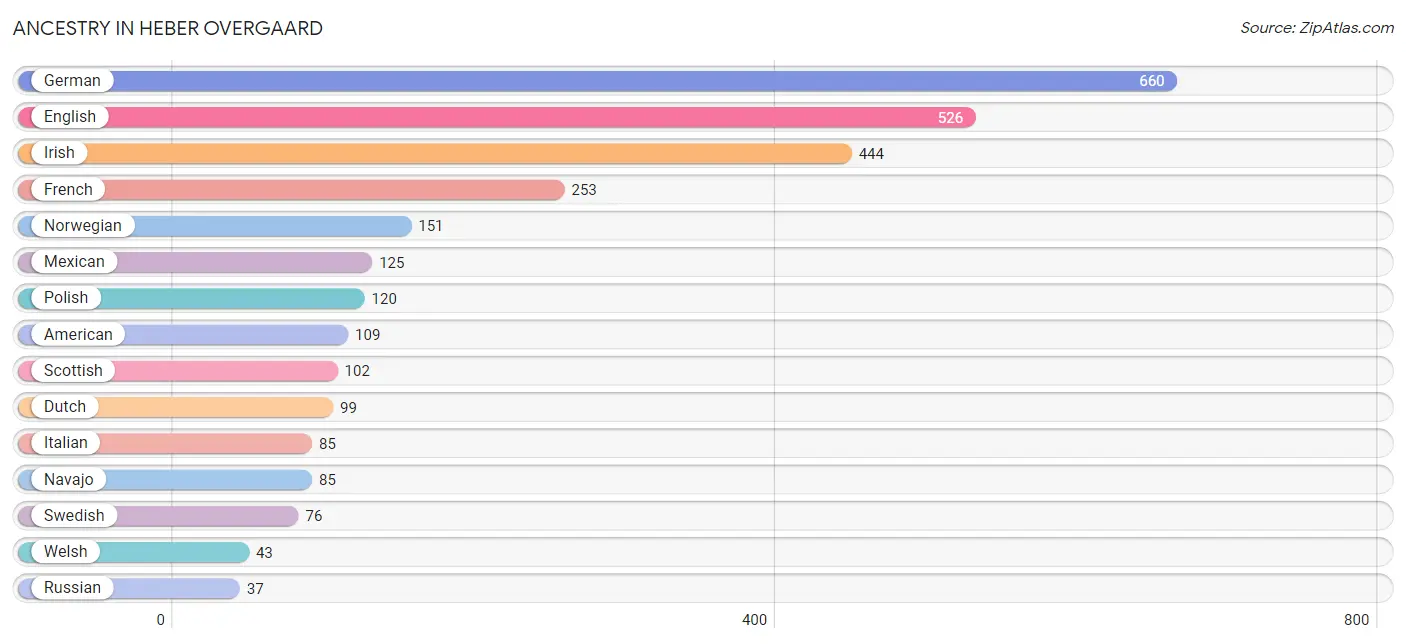
Ancestry in Heber Overgaard
The most populous ancestries reported in Heber Overgaard are German (660 | 24.9%), English (526 | 19.8%), Irish (444 | 16.8%), French (253 | 9.5%), and Norwegian (151 | 5.7%), together accounting for 76.7% of all Heber Overgaard residents.
| Ancestry | # Population | % Population |
| American | 109 | 4.1% |
| Arab | 27 | 1.0% |
| British | 12 | 0.4% |
| Choctaw | 5 | 0.2% |
| Danish | 23 | 0.9% |
| Dutch | 99 | 3.7% |
| English | 526 | 19.8% |
| Finnish | 23 | 0.9% |
| French | 253 | 9.5% |
| German | 660 | 24.9% |
| Irish | 444 | 16.8% |
| Italian | 85 | 3.2% |
| Lebanese | 27 | 1.0% |
| Mexican | 125 | 4.7% |
| Native Hawaiian | 36 | 1.4% |
| Navajo | 85 | 3.2% |
| Norwegian | 151 | 5.7% |
| Polish | 120 | 4.5% |
| Pueblo | 1 | 0.0% |
| Russian | 37 | 1.4% |
| Scottish | 102 | 3.8% |
| South American | 1 | 0.0% |
| Spanish | 14 | 0.5% |
| Swedish | 76 | 2.9% |
| Venezuelan | 1 | 0.0% |
| Welsh | 43 | 1.6% | View All 26 Rows |
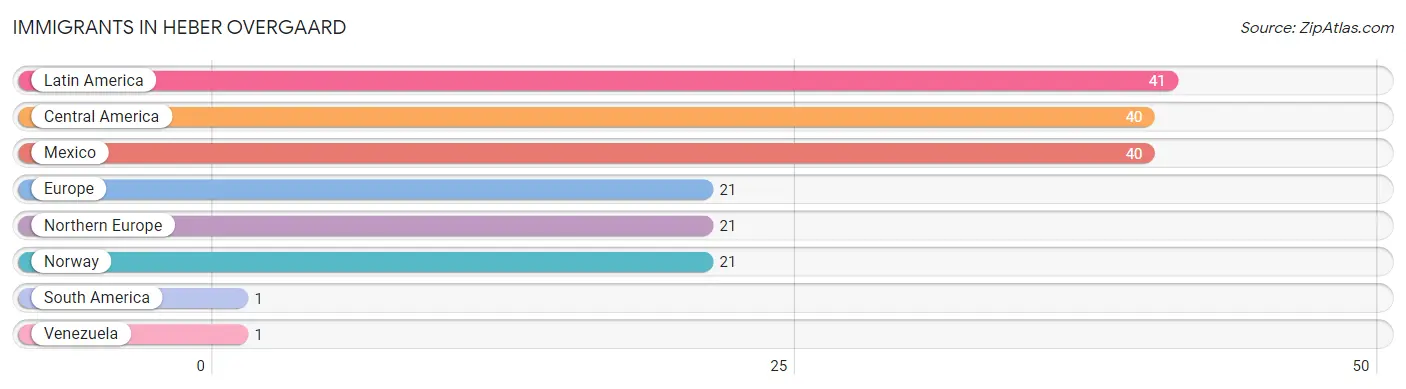
Immigrants in Heber Overgaard
The most numerous immigrant groups reported in Heber Overgaard came from Latin America (41 | 1.5%), Central America (40 | 1.5%), Mexico (40 | 1.5%), Europe (21 | 0.8%), and Northern Europe (21 | 0.8%), together accounting for 6.2% of all Heber Overgaard residents.
| Immigration Origin | # Population | % Population |
| Central America | 40 | 1.5% |
| Europe | 21 | 0.8% |
| Latin America | 41 | 1.5% |
| Mexico | 40 | 1.5% |
| Northern Europe | 21 | 0.8% |
| Norway | 21 | 0.8% |
| South America | 1 | 0.0% |
| Venezuela | 1 | 0.0% | View All 8 Rows |
Sex and Age in Heber Overgaard
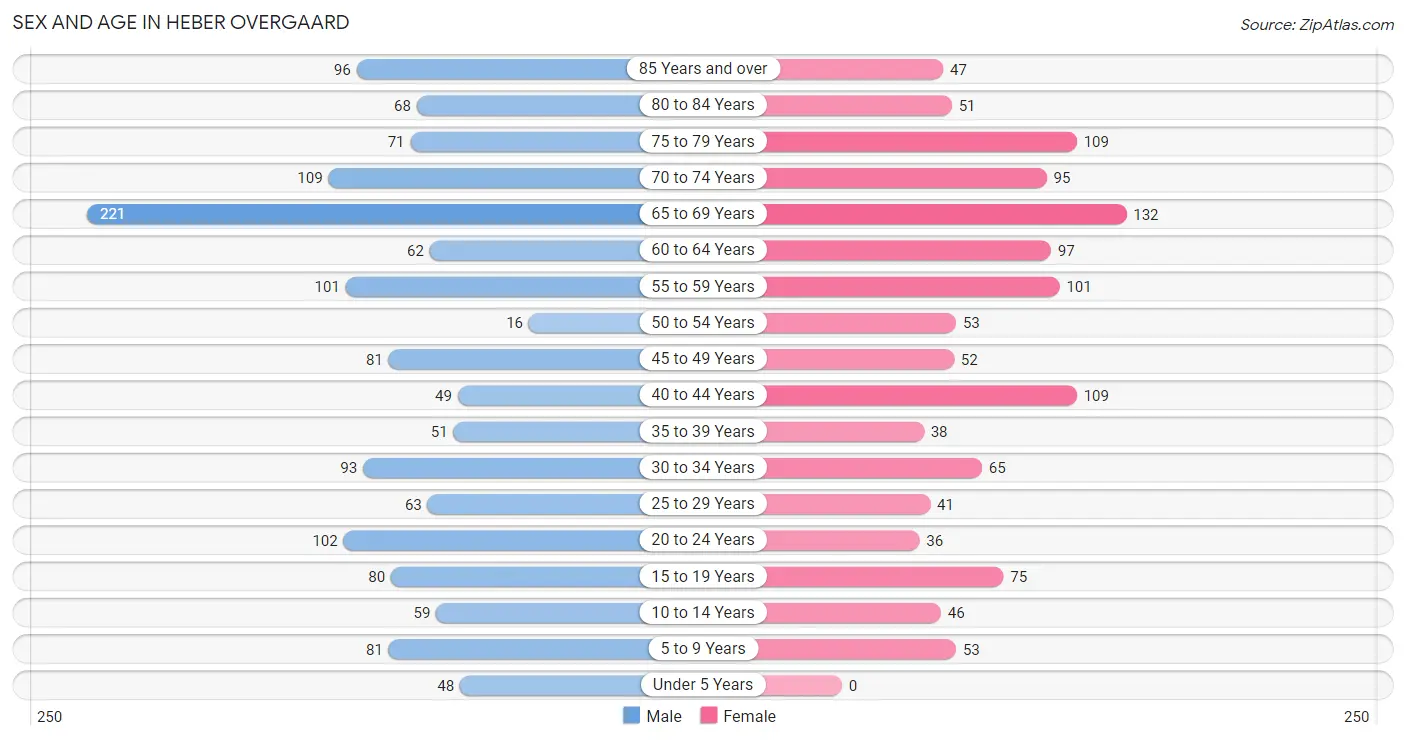
Sex and Age in Heber Overgaard
The most populous age groups in Heber Overgaard are 65 to 69 Years (221 | 15.2%) for men and 65 to 69 Years (132 | 11.0%) for women.
| Age Bracket | Male | Female |
| Under 5 Years | 48 (3.3%) | 0 (0.0%) |
| 5 to 9 Years | 81 (5.6%) | 53 (4.4%) |
| 10 to 14 Years | 59 (4.1%) | 46 (3.8%) |
| 15 to 19 Years | 80 (5.5%) | 75 (6.2%) |
| 20 to 24 Years | 102 (7.0%) | 36 (3.0%) |
| 25 to 29 Years | 63 (4.3%) | 41 (3.4%) |
| 30 to 34 Years | 93 (6.4%) | 65 (5.4%) |
| 35 to 39 Years | 51 (3.5%) | 38 (3.2%) |
| 40 to 44 Years | 49 (3.4%) | 109 (9.1%) |
| 45 to 49 Years | 81 (5.6%) | 52 (4.3%) |
| 50 to 54 Years | 16 (1.1%) | 53 (4.4%) |
| 55 to 59 Years | 101 (7.0%) | 101 (8.4%) |
| 60 to 64 Years | 62 (4.3%) | 97 (8.1%) |
| 65 to 69 Years | 221 (15.2%) | 132 (11.0%) |
| 70 to 74 Years | 109 (7.5%) | 95 (7.9%) |
| 75 to 79 Years | 71 (4.9%) | 109 (9.1%) |
| 80 to 84 Years | 68 (4.7%) | 51 (4.3%) |
| 85 Years and over | 96 (6.6%) | 47 (3.9%) |
| Total | 1,451 (100.0%) | 1,200 (100.0%) |
Families and Households in Heber Overgaard
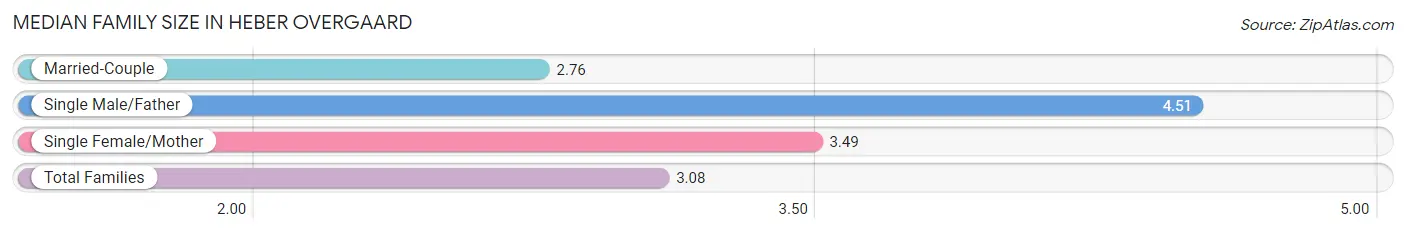
Median Family Size in Heber Overgaard
The median family size in Heber Overgaard is 3.08 persons per family, with single male/father families (82 | 12.6%) accounting for the largest median family size of 4.51 persons per family. On the other hand, married-couple families (478 | 73.3%) represent the smallest median family size with 2.76 persons per family.
| Family Type | # Families | Family Size |
| Married-Couple | 478 (73.3%) | 2.76 |
| Single Male/Father | 82 (12.6%) | 4.51 |
| Single Female/Mother | 92 (14.1%) | 3.49 |
| Total Families | 652 (100.0%) | 3.08 |
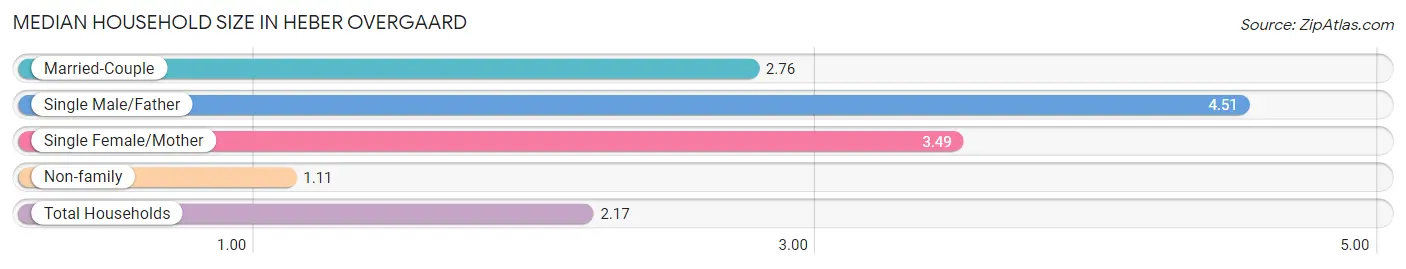
Median Household Size in Heber Overgaard
The median household size in Heber Overgaard is 2.17 persons per household, with single male/father households (82 | 6.7%) accounting for the largest median household size of 4.51 persons per household. non-family households (566 | 46.5%) represent the smallest median household size with 1.11 persons per household.
| Household Type | # Households | Household Size |
| Married-Couple | 478 (39.2%) | 2.76 |
| Single Male/Father | 82 (6.7%) | 4.51 |
| Single Female/Mother | 92 (7.5%) | 3.49 |
| Non-family | 566 (46.5%) | 1.11 |
| Total Households | 1,218 (100.0%) | 2.17 |
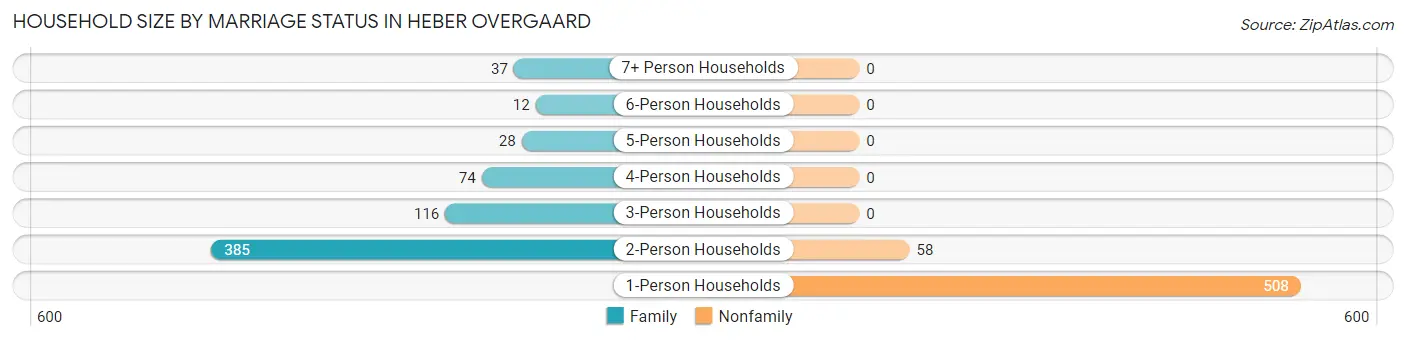
Household Size by Marriage Status in Heber Overgaard
Out of a total of 1,218 households in Heber Overgaard, 652 (53.5%) are family households, while 566 (46.5%) are nonfamily households. The most numerous type of family households are 2-person households, comprising 385, and the most common type of nonfamily households are 1-person households, comprising 508.
| Household Size | Family Households | Nonfamily Households |
| 1-Person Households | - | 508 (41.7%) |
| 2-Person Households | 385 (31.6%) | 58 (4.8%) |
| 3-Person Households | 116 (9.5%) | 0 (0.0%) |
| 4-Person Households | 74 (6.1%) | 0 (0.0%) |
| 5-Person Households | 28 (2.3%) | 0 (0.0%) |
| 6-Person Households | 12 (1.0%) | 0 (0.0%) |
| 7+ Person Households | 37 (3.0%) | 0 (0.0%) |
| Total | 652 (53.5%) | 566 (46.5%) |
Female Fertility in Heber Overgaard
Fertility by Age in Heber Overgaard
| Age Bracket | Women with Births | Births / 1,000 Women |
| 15 to 19 years | 0 (0.0%) | 0.0 |
| 20 to 34 years | 0 (0.0%) | 0.0 |
| 35 to 50 years | 0 (0.0%) | 0.0 |
| Total | 0 (0.0%) | 0.0 |
Fertility by Age by Marriage Status in Heber Overgaard
| Age Bracket | Married | Unmarried |
| 15 to 19 years | 0 (0.0%) | 0 (0.0%) |
| 20 to 34 years | 0 (0.0%) | 0 (0.0%) |
| 35 to 50 years | 0 (0.0%) | 0 (0.0%) |
| Total | 0 (0.0%) | 0 (0.0%) |
Fertility by Education in Heber Overgaard
| Educational Attainment | Women with Births | Births / 1,000 Women |
| Less than High School | 0 (0.0%) | 0.0 |
| High School Diploma | 0 (0.0%) | 0.0 |
| College or Associate's Degree | 0 (0.0%) | 0.0 |
| Bachelor's Degree | 0 (0.0%) | 0.0 |
| Graduate Degree | 0 (0.0%) | 0.0 |
| Total | 0 (0.0%) | 0.0 |
Fertility by Education by Marriage Status in Heber Overgaard
| Educational Attainment | Married | Unmarried |
| Less than High School | 0 (0.0%) | 0 (0.0%) |
| High School Diploma | 0 (0.0%) | 0 (0.0%) |
| College or Associate's Degree | 0 (0.0%) | 0 (0.0%) |
| Bachelor's Degree | 0 (0.0%) | 0 (0.0%) |
| Graduate Degree | 0 (0.0%) | 0 (0.0%) |
| Total | 0 (0.0%) | 0 (0.0%) |
Income in Heber Overgaard
Income Overview in Heber Overgaard
Per Capita Income in Heber Overgaard is $21,211, while median incomes of families and households are $51,250 and $39,779 respectively.
| Characteristic | Number | Measure |
| Per Capita Income | 2,651 | $21,211 |
| Median Family Income | 652 | $51,250 |
| Mean Family Income | 652 | $54,507 |
| Median Household Income | 1,218 | $39,779 |
| Mean Household Income | 1,218 | $45,009 |
| Income Deficit | 652 | $0 |
| Wage / Income Gap (%) | 2,651 | 3.40% |
| Wage / Income Gap ($) | 2,651 | 96.60¢ per $1 |
| Gini / Inequality Index | 2,651 | 0.39 |
Earnings by Sex in Heber Overgaard
Average Earnings in Heber Overgaard are $23,556, $24,043 for men and $23,225 for women, a difference of 3.4%.
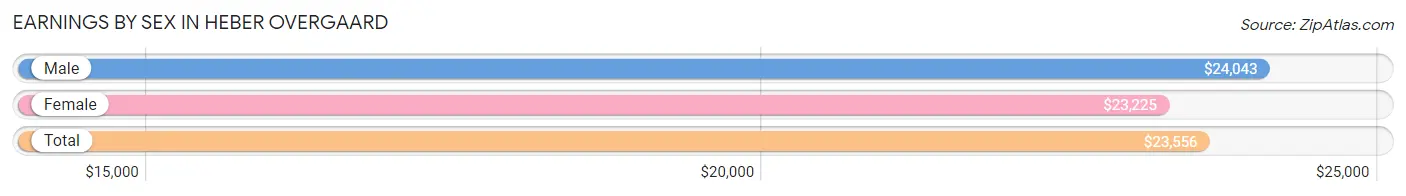
| Sex | Number | Average Earnings |
| Male | 530 (57.7%) | $24,043 |
| Female | 388 (42.3%) | $23,225 |
| Total | 918 (100.0%) | $23,556 |
Earnings by Sex by Income Bracket in Heber Overgaard
The most common earnings brackets in Heber Overgaard are $12,500 to $14,999 for men (74 | 14.0%) and $25,000 to $29,999 for women (70 | 18.0%).
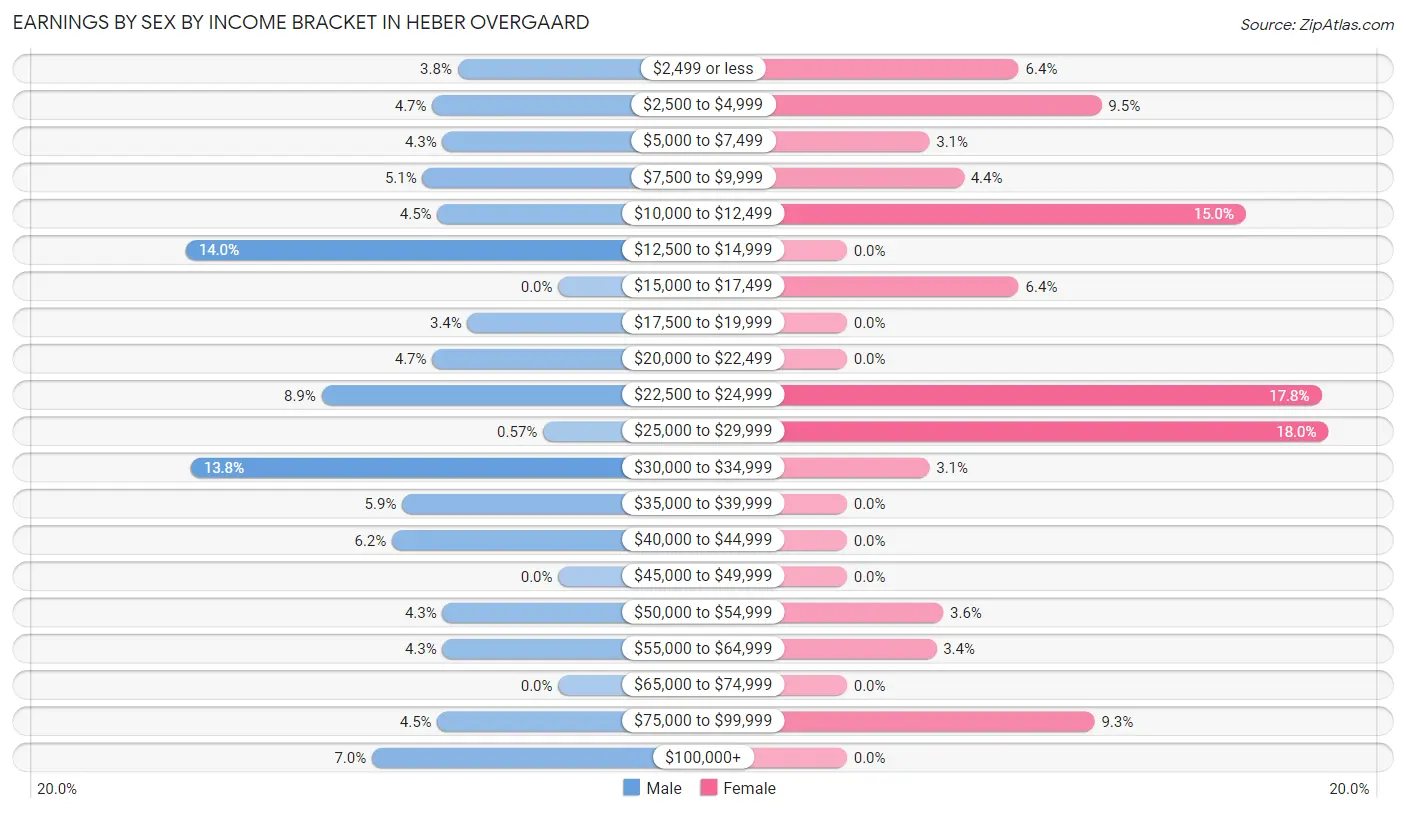
| Income | Male | Female |
| $2,499 or less | 20 (3.8%) | 25 (6.4%) |
| $2,500 to $4,999 | 25 (4.7%) | 37 (9.5%) |
| $5,000 to $7,499 | 23 (4.3%) | 12 (3.1%) |
| $7,500 to $9,999 | 27 (5.1%) | 17 (4.4%) |
| $10,000 to $12,499 | 24 (4.5%) | 58 (14.9%) |
| $12,500 to $14,999 | 74 (14.0%) | 0 (0.0%) |
| $15,000 to $17,499 | 0 (0.0%) | 25 (6.4%) |
| $17,500 to $19,999 | 18 (3.4%) | 0 (0.0%) |
| $20,000 to $22,499 | 25 (4.7%) | 0 (0.0%) |
| $22,500 to $24,999 | 47 (8.9%) | 69 (17.8%) |
| $25,000 to $29,999 | 3 (0.6%) | 70 (18.0%) |
| $30,000 to $34,999 | 73 (13.8%) | 12 (3.1%) |
| $35,000 to $39,999 | 31 (5.9%) | 0 (0.0%) |
| $40,000 to $44,999 | 33 (6.2%) | 0 (0.0%) |
| $45,000 to $49,999 | 0 (0.0%) | 0 (0.0%) |
| $50,000 to $54,999 | 23 (4.3%) | 14 (3.6%) |
| $55,000 to $64,999 | 23 (4.3%) | 13 (3.4%) |
| $65,000 to $74,999 | 0 (0.0%) | 0 (0.0%) |
| $75,000 to $99,999 | 24 (4.5%) | 36 (9.3%) |
| $100,000+ | 37 (7.0%) | 0 (0.0%) |
| Total | 530 (100.0%) | 388 (100.0%) |
Earnings by Sex by Educational Attainment in Heber Overgaard
Average earnings in Heber Overgaard are $33,579 for men and $24,545 for women, a difference of 26.9%. Men with an educational attainment of high school diploma enjoy the highest average annual earnings of $36,953, while those with college or associate's degree education earn the least with $33,475. Women with an educational attainment of college or associate's degree earn the most with the average annual earnings of $24,904, while those with less than high school education have the smallest earnings of $11,648.
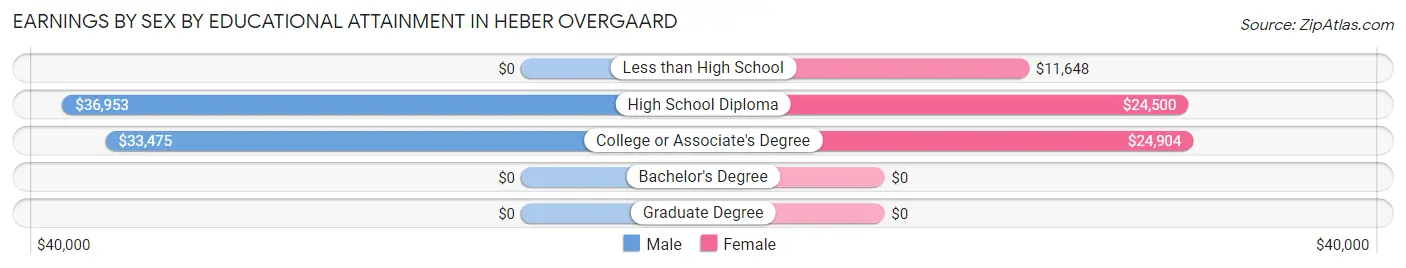
| Educational Attainment | Male Income | Female Income |
| Less than High School | - | - |
| High School Diploma | $36,953 | $24,500 |
| College or Associate's Degree | $33,475 | $24,904 |
| Bachelor's Degree | - | - |
| Graduate Degree | - | - |
| Total | $33,579 | $24,545 |
Family Income in Heber Overgaard
Family Income Brackets in Heber Overgaard
According to the Heber Overgaard family income data, there are 181 families falling into the $50,000 to $74,999 income range, which is the most common income bracket and makes up 27.8% of all families.
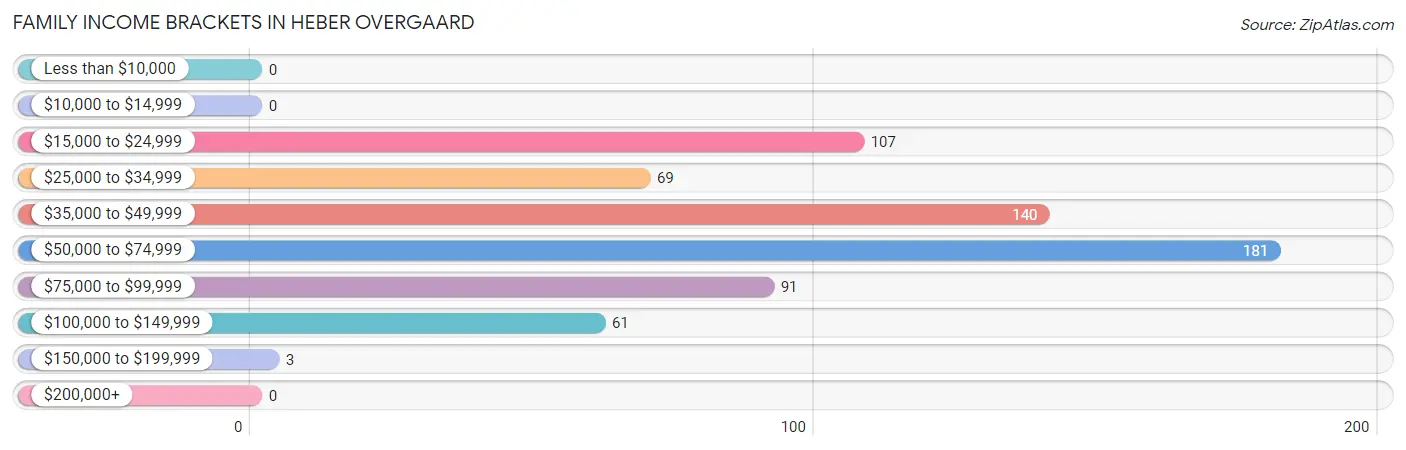
| Income Bracket | # Families | % Families |
| Less than $10,000 | 0 | 0.0% |
| $10,000 to $14,999 | 0 | 0.0% |
| $15,000 to $24,999 | 107 | 16.4% |
| $25,000 to $34,999 | 69 | 10.6% |
| $35,000 to $49,999 | 140 | 21.5% |
| $50,000 to $74,999 | 181 | 27.8% |
| $75,000 to $99,999 | 91 | 14.0% |
| $100,000 to $149,999 | 61 | 9.4% |
| $150,000 to $199,999 | 3 | 0.5% |
| $200,000+ | 0 | 0.0% |
Family Income by Famaliy Size in Heber Overgaard
3-person families (116 | 17.8%) account for the highest median family income in Heber Overgaard with $56,250 per family, while 2-person families (385 | 59.1%) have the highest median income of $21,988 per family member.
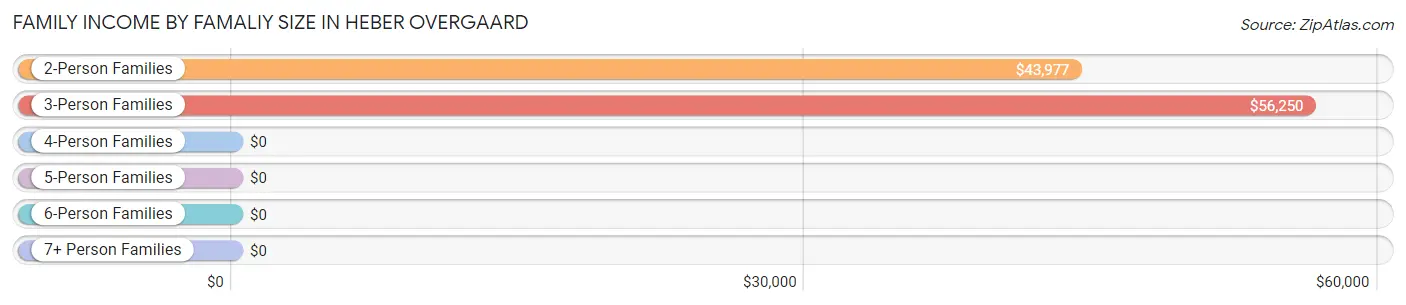
| Income Bracket | # Families | Median Income |
| 2-Person Families | 385 (59.1%) | $43,977 |
| 3-Person Families | 116 (17.8%) | $56,250 |
| 4-Person Families | 74 (11.4%) | $0 |
| 5-Person Families | 28 (4.3%) | $0 |
| 6-Person Families | 12 (1.8%) | $0 |
| 7+ Person Families | 37 (5.7%) | $0 |
| Total | 652 (100.0%) | $51,250 |
Family Income by Number of Earners in Heber Overgaard
The median family income in Heber Overgaard is $51,250, with families comprising 2 earners (168) having the highest median family income of $57,880, while families with no earners (271) have the lowest median family income of $38,802, accounting for 25.8% and 41.6% of families, respectively.
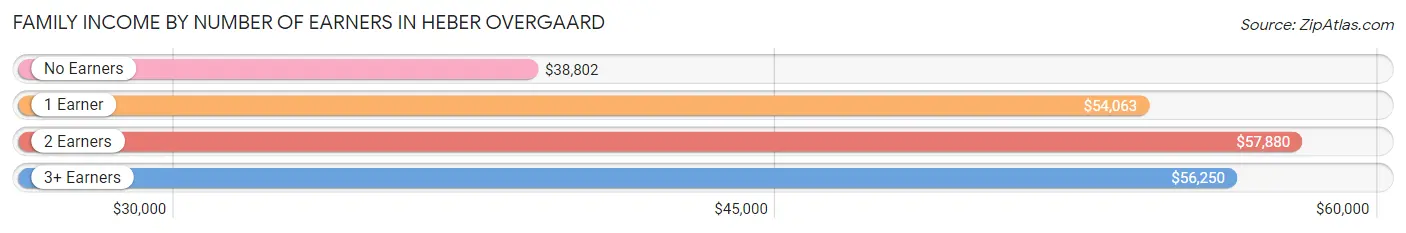
| Number of Earners | # Families | Median Income |
| No Earners | 271 (41.6%) | $38,802 |
| 1 Earner | 141 (21.6%) | $54,063 |
| 2 Earners | 168 (25.8%) | $57,880 |
| 3+ Earners | 72 (11.0%) | $56,250 |
| Total | 652 (100.0%) | $51,250 |
Household Income in Heber Overgaard
Household Income Brackets in Heber Overgaard
With 247 households falling in the category, the $35,000 to $49,999 income range is the most frequent in Heber Overgaard, accounting for 20.3% of all households.
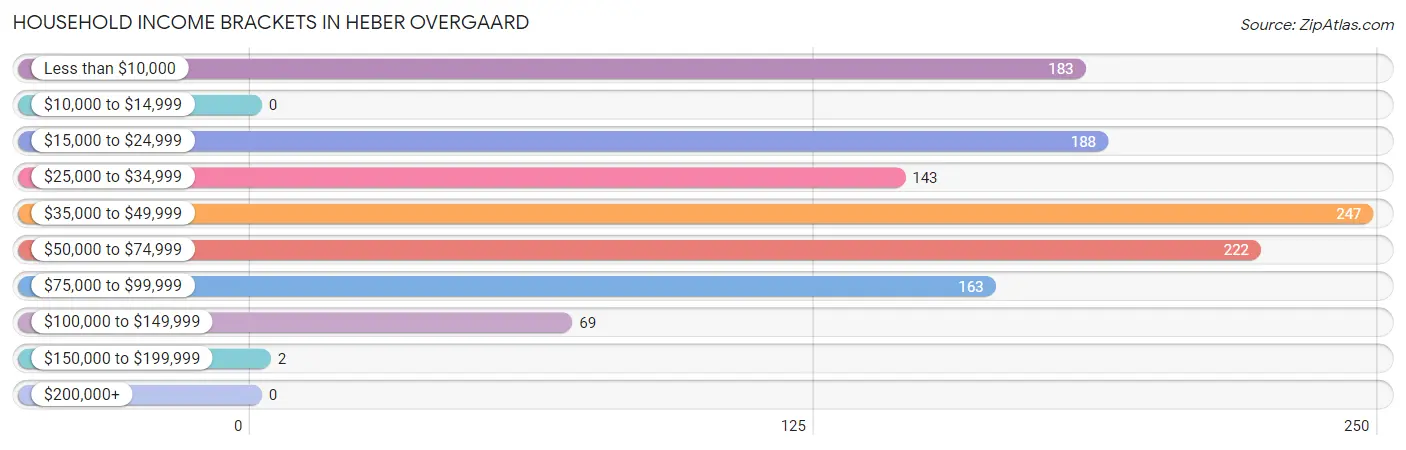
| Income Bracket | # Households | % Households |
| Less than $10,000 | 183 | 15.0% |
| $10,000 to $14,999 | 0 | 0.0% |
| $15,000 to $24,999 | 188 | 15.4% |
| $25,000 to $34,999 | 143 | 11.7% |
| $35,000 to $49,999 | 247 | 20.3% |
| $50,000 to $74,999 | 222 | 18.2% |
| $75,000 to $99,999 | 163 | 13.4% |
| $100,000 to $149,999 | 69 | 5.7% |
| $150,000 to $199,999 | 2 | 0.2% |
| $200,000+ | 0 | 0.0% |
Household Income by Householder Age in Heber Overgaard
The median household income in Heber Overgaard is $39,779, with the highest median household income of $42,813 found in the 45 to 64 years age bracket for the primary householder. A total of 342 households (28.1%) fall into this category. Meanwhile, the 15 to 24 years age bracket for the primary householder has the lowest median household income of $0, with 38 households (3.1%) in this group.
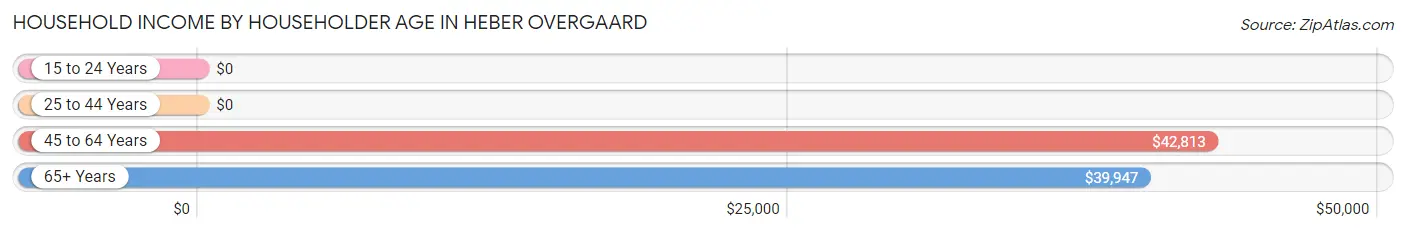
| Income Bracket | # Households | Median Income |
| 15 to 24 Years | 38 (3.1%) | $0 |
| 25 to 44 Years | 132 (10.8%) | $0 |
| 45 to 64 Years | 342 (28.1%) | $42,813 |
| 65+ Years | 706 (58.0%) | $39,947 |
| Total | 1,218 (100.0%) | $39,779 |
Poverty in Heber Overgaard
Income Below Poverty by Sex and Age in Heber Overgaard
With 29.0% poverty level for males and 21.7% for females among the residents of Heber Overgaard, 15 year old males and 35 to 44 year old females are the most vulnerable to poverty, with 30 males (100.0%) and 53 females (36.0%) in their respective age groups living below the poverty level.
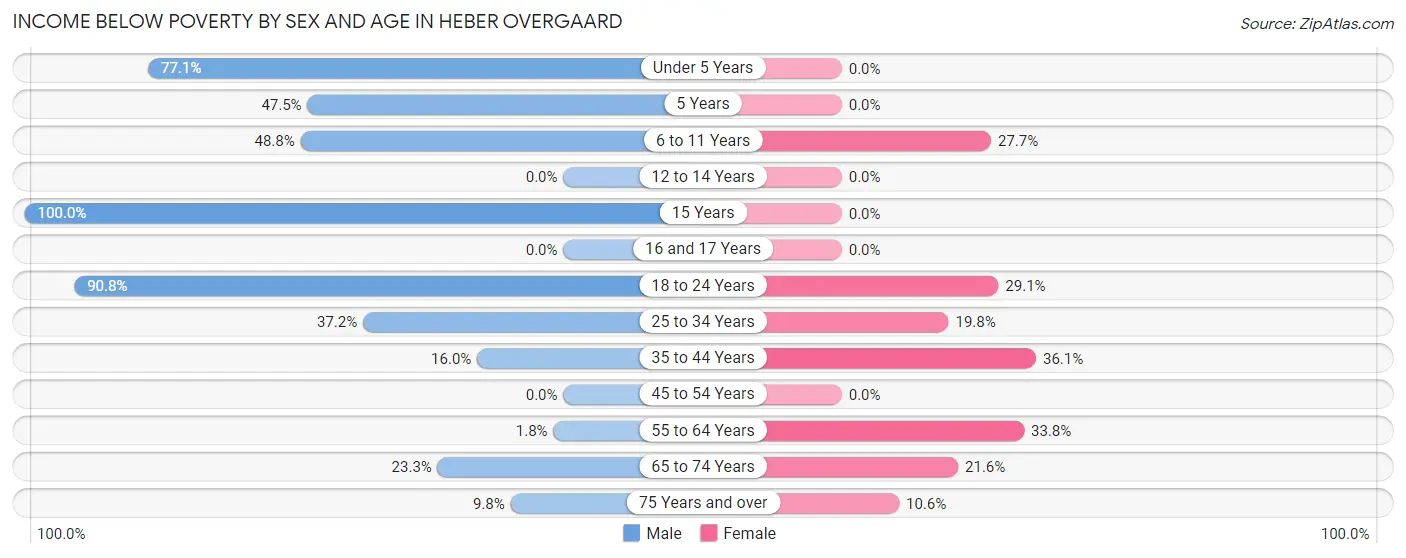
| Age Bracket | Male | Female |
| Under 5 Years | 37 (77.1%) | 0 (0.0%) |
| 5 Years | 19 (47.5%) | 0 (0.0%) |
| 6 to 11 Years | 20 (48.8%) | 23 (27.7%) |
| 12 to 14 Years | 0 (0.0%) | 0 (0.0%) |
| 15 Years | 30 (100.0%) | 0 (0.0%) |
| 16 and 17 Years | 0 (0.0%) | 0 (0.0%) |
| 18 to 24 Years | 138 (90.8%) | 25 (29.1%) |
| 25 to 34 Years | 58 (37.2%) | 21 (19.8%) |
| 35 to 44 Years | 16 (16.0%) | 53 (36.0%) |
| 45 to 54 Years | 0 (0.0%) | 0 (0.0%) |
| 55 to 64 Years | 3 (1.8%) | 67 (33.8%) |
| 65 to 74 Years | 77 (23.3%) | 49 (21.6%) |
| 75 Years and over | 23 (9.8%) | 22 (10.6%) |
| Total | 421 (29.0%) | 260 (21.7%) |
Income Above Poverty by Sex and Age in Heber Overgaard
According to the poverty statistics in Heber Overgaard, males aged 12 to 14 years and females aged 12 to 14 years are the age groups that are most secure financially, with 100.0% of males and 100.0% of females in these age groups living above the poverty line.
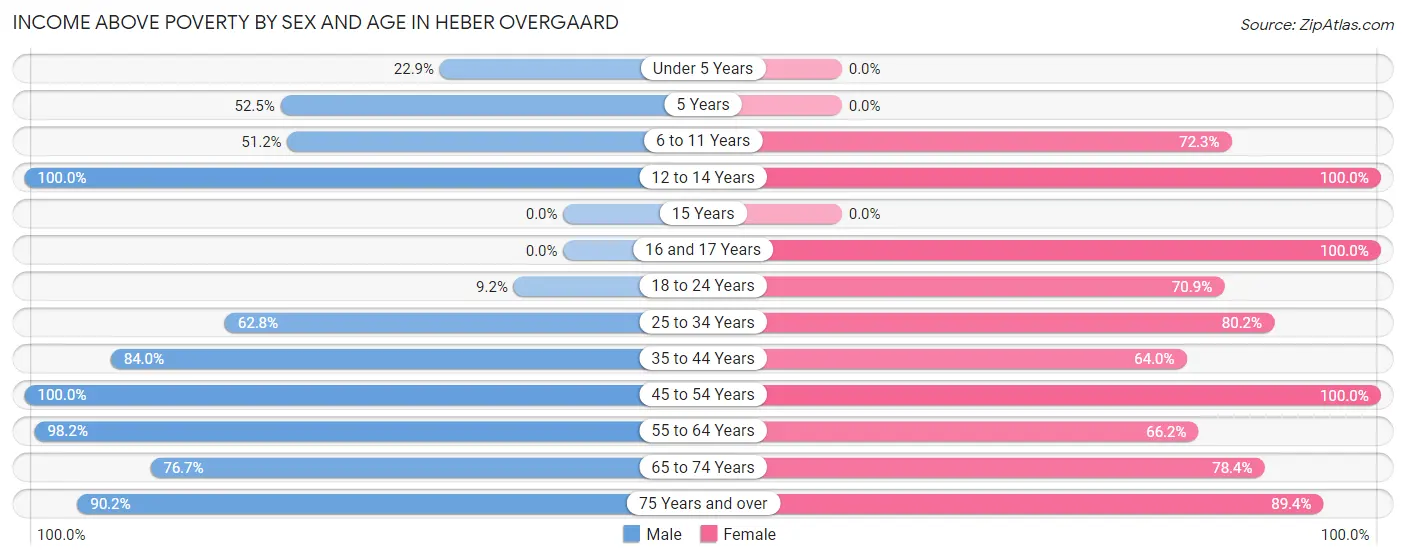
| Age Bracket | Male | Female |
| Under 5 Years | 11 (22.9%) | 0 (0.0%) |
| 5 Years | 21 (52.5%) | 0 (0.0%) |
| 6 to 11 Years | 21 (51.2%) | 60 (72.3%) |
| 12 to 14 Years | 59 (100.0%) | 16 (100.0%) |
| 15 Years | 0 (0.0%) | 0 (0.0%) |
| 16 and 17 Years | 0 (0.0%) | 25 (100.0%) |
| 18 to 24 Years | 14 (9.2%) | 61 (70.9%) |
| 25 to 34 Years | 98 (62.8%) | 85 (80.2%) |
| 35 to 44 Years | 84 (84.0%) | 94 (63.9%) |
| 45 to 54 Years | 97 (100.0%) | 105 (100.0%) |
| 55 to 64 Years | 160 (98.2%) | 131 (66.2%) |
| 65 to 74 Years | 253 (76.7%) | 178 (78.4%) |
| 75 Years and over | 212 (90.2%) | 185 (89.4%) |
| Total | 1,030 (71.0%) | 940 (78.3%) |
Income Below Poverty Among Married-Couple Families in Heber Overgaard
The poverty statistics for married-couple families in Heber Overgaard show that 14.2% or 68 of the total 478 families live below the poverty line. Families with 5 or more children have the highest poverty rate of 100.0%, comprising of 21 families. On the other hand, families with 3 or 4 children have the lowest poverty rate of 0.0%, which includes 0 families.
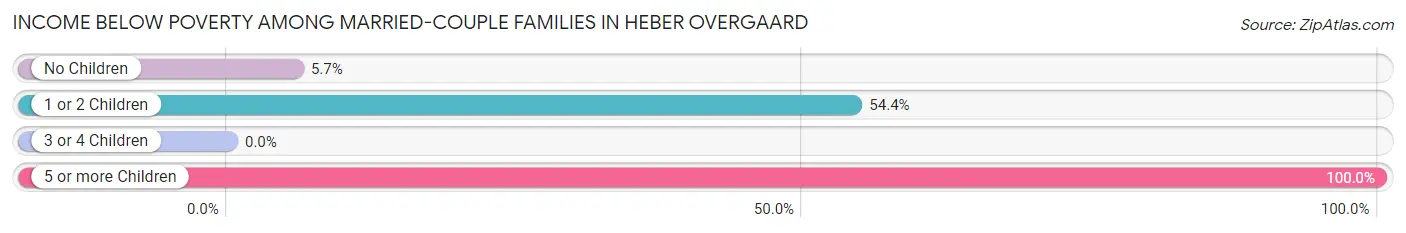
| Children | Above Poverty | Below Poverty |
| No Children | 361 (94.3%) | 22 (5.7%) |
| 1 or 2 Children | 21 (45.7%) | 25 (54.3%) |
| 3 or 4 Children | 28 (100.0%) | 0 (0.0%) |
| 5 or more Children | 0 (0.0%) | 21 (100.0%) |
| Total | 410 (85.8%) | 68 (14.2%) |
Income Below Poverty Among Single-Parent Households in Heber Overgaard
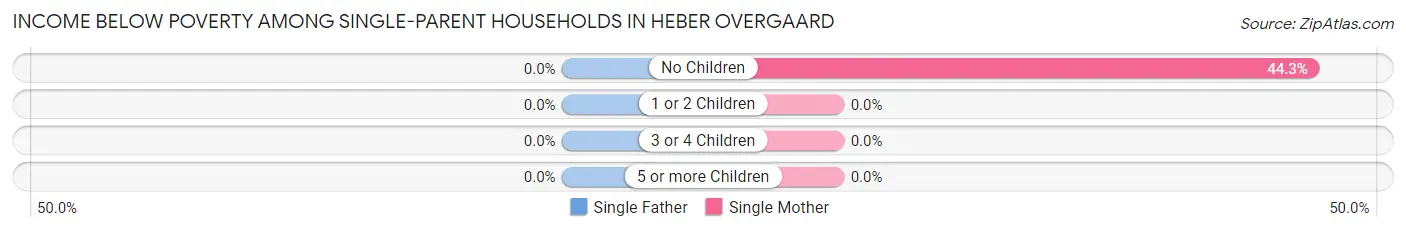
| Children | Single Father | Single Mother |
| No Children | 0 (0.0%) | 39 (44.3%) |
| 1 or 2 Children | 0 (0.0%) | 0 (0.0%) |
| 3 or 4 Children | 0 (0.0%) | 0 (0.0%) |
| 5 or more Children | 0 (0.0%) | 0 (0.0%) |
| Total | 0 (0.0%) | 39 (42.4%) |
Income Below Poverty Among Married-Couple vs Single-Parent Households in Heber Overgaard
The poverty data for Heber Overgaard shows that 68 of the married-couple family households (14.2%) and 39 of the single-parent households (22.4%) are living below the poverty level. Within the married-couple family households, those with 5 or more children have the highest poverty rate, with 21 households (100.0%) falling below the poverty line. Among the single-parent households, those with no children have the highest poverty rate, with 39 household (30.0%) living below poverty.
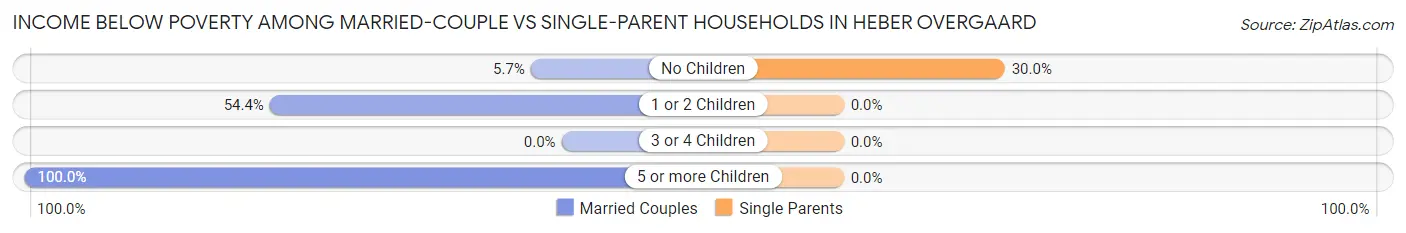
| Children | Married-Couple Families | Single-Parent Households |
| No Children | 22 (5.7%) | 39 (30.0%) |
| 1 or 2 Children | 25 (54.3%) | 0 (0.0%) |
| 3 or 4 Children | 0 (0.0%) | 0 (0.0%) |
| 5 or more Children | 21 (100.0%) | 0 (0.0%) |
| Total | 68 (14.2%) | 39 (22.4%) |
Employment Characteristics in Heber Overgaard
Employment by Class of Employer in Heber Overgaard
Among the 693 employed individuals in Heber Overgaard, private company employees (464 | 67.0%), self-employed (not incorporated) (172 | 24.8%), and local government employees (39 | 5.6%) make up the most common classes of employment.
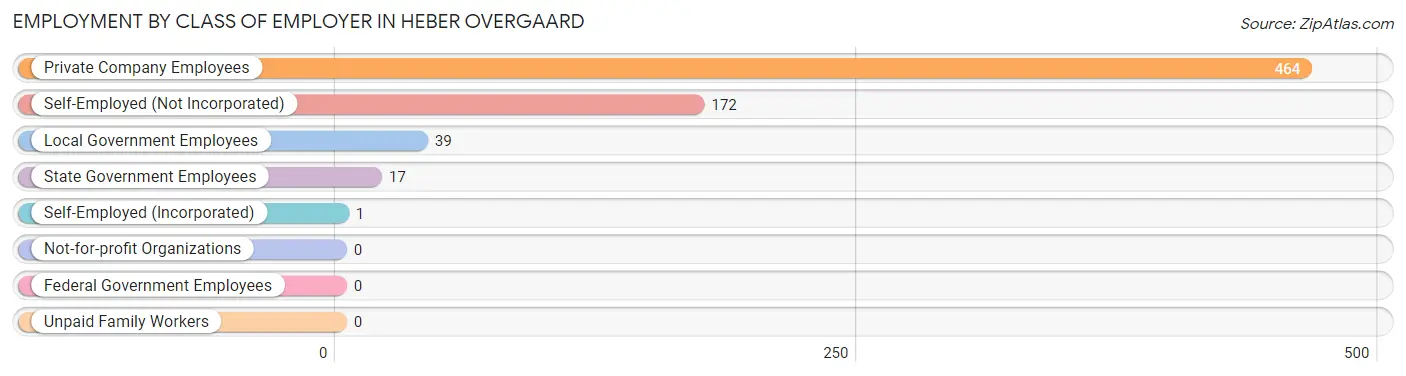
| Employer Class | # Employees | % Employees |
| Private Company Employees | 464 | 67.0% |
| Self-Employed (Incorporated) | 1 | 0.1% |
| Self-Employed (Not Incorporated) | 172 | 24.8% |
| Not-for-profit Organizations | 0 | 0.0% |
| Local Government Employees | 39 | 5.6% |
| State Government Employees | 17 | 2.5% |
| Federal Government Employees | 0 | 0.0% |
| Unpaid Family Workers | 0 | 0.0% |
| Total | 693 | 100.0% |
Employment Status by Age in Heber Overgaard
According to the labor force statistics for Heber Overgaard, out of the total population over 16 years of age (2,334), 40.5% or 945 individuals are in the labor force, with 26.7% or 252 of them unemployed. The age group with the highest labor force participation rate is 20 to 24 years, with 84.1% or 116 individuals in the labor force. Within the labor force, the 30 to 34 years age range has the highest percentage of unemployed individuals, with 51.7% or 45 of them being unemployed.
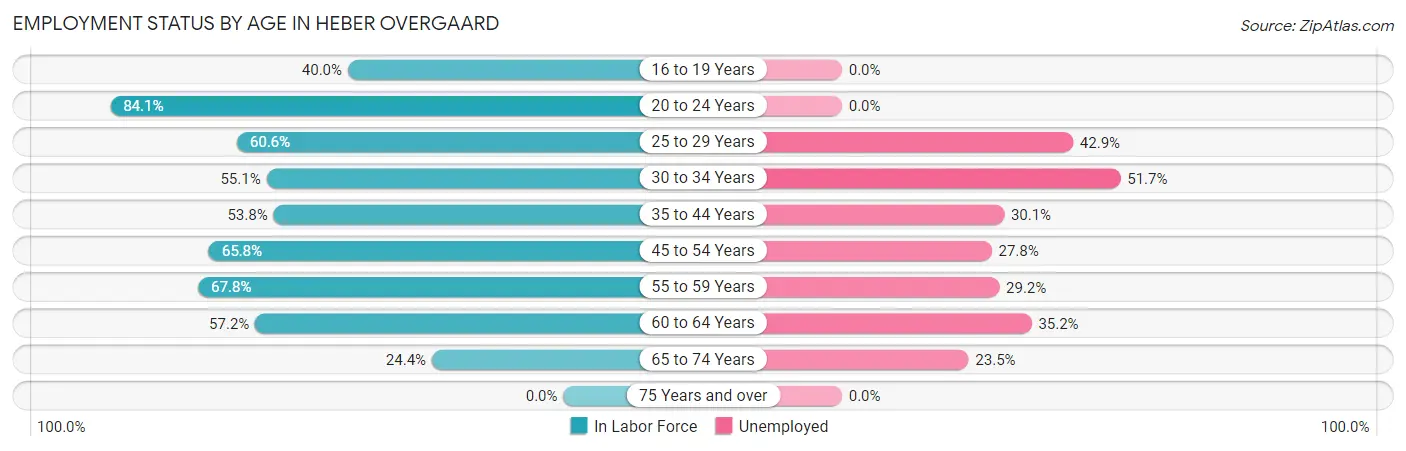
| Age Bracket | In Labor Force | Unemployed |
| 16 to 19 Years | 50 (40.0%) | 0 (0.0%) |
| 20 to 24 Years | 116 (84.1%) | 0 (0.0%) |
| 25 to 29 Years | 63 (60.6%) | 27 (42.9%) |
| 30 to 34 Years | 87 (55.1%) | 45 (51.7%) |
| 35 to 44 Years | 133 (53.8%) | 40 (30.1%) |
| 45 to 54 Years | 133 (65.8%) | 37 (27.8%) |
| 55 to 59 Years | 137 (67.8%) | 40 (29.2%) |
| 60 to 64 Years | 91 (57.2%) | 32 (35.2%) |
| 65 to 74 Years | 136 (24.4%) | 32 (23.5%) |
| 75 Years and over | 0 (0.0%) | 0 (0.0%) |
| Total | 945 (40.5%) | 252 (26.7%) |
Employment Status by Educational Attainment in Heber Overgaard
According to labor force statistics for Heber Overgaard, 60.1% of individuals (644) out of the total population between 25 and 64 years of age (1,072) are in the labor force, with 34.3% or 221 of them being unemployed. The group with the highest labor force participation rate are those with the educational attainment of college / associate degree, with 74.8% or 338 individuals in the labor force. Within the labor force, individuals with college / associate degree education have the highest percentage of unemployment, with 45.9% or 155 of them being unemployed.
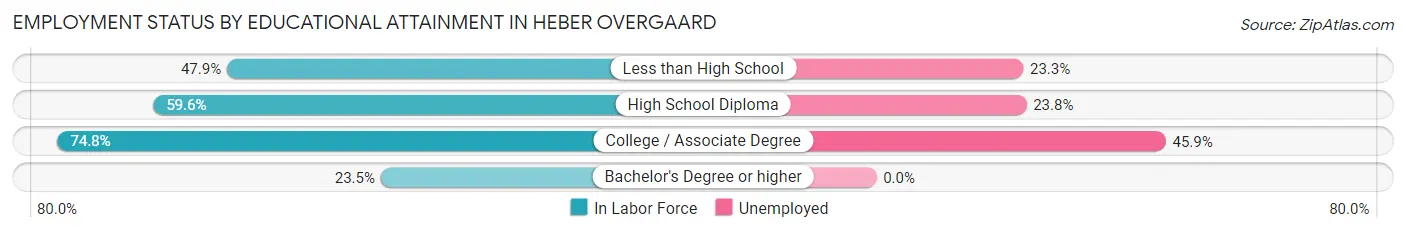
| Educational Attainment | In Labor Force | Unemployed |
| Less than High School | 90 (47.9%) | 44 (23.3%) |
| High School Diploma | 189 (59.6%) | 75 (23.8%) |
| College / Associate Degree | 338 (74.8%) | 207 (45.9%) |
| Bachelor's Degree or higher | 27 (23.5%) | 0 (0.0%) |
| Total | 644 (60.1%) | 368 (34.3%) |
Employment Occupations by Sex in Heber Overgaard
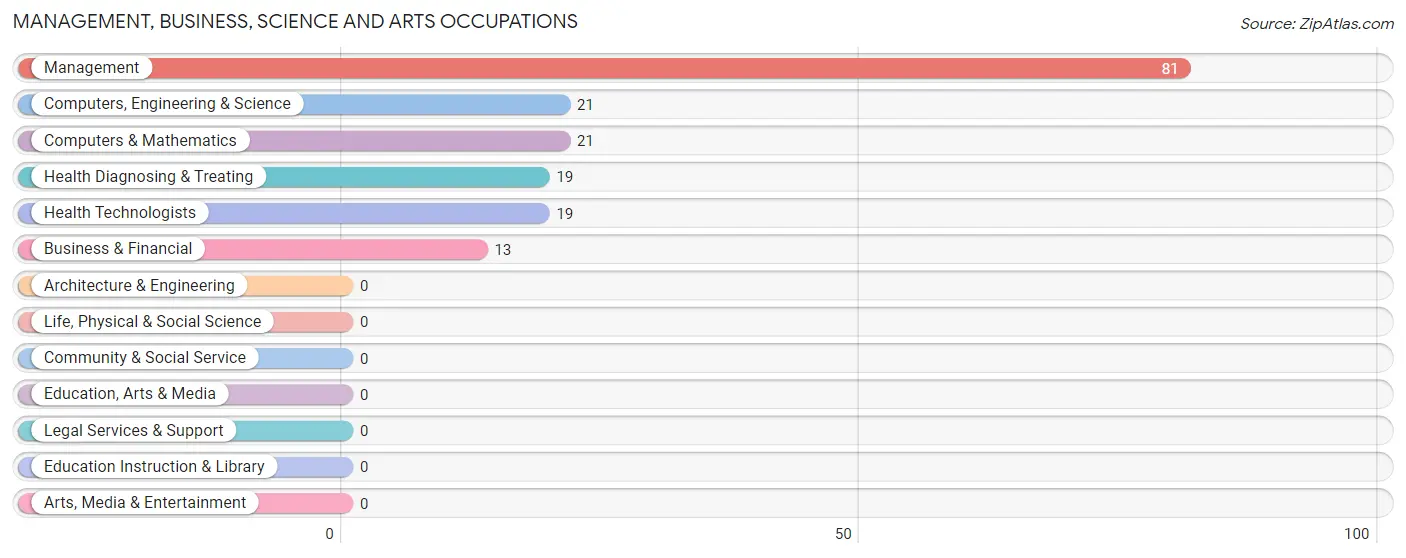
Management, Business, Science and Arts Occupations
The most common Management, Business, Science and Arts occupations in Heber Overgaard are Management (81 | 11.7%), Computers, Engineering & Science (21 | 3.0%), Computers & Mathematics (21 | 3.0%), Health Diagnosing & Treating (19 | 2.7%), and Health Technologists (19 | 2.7%).
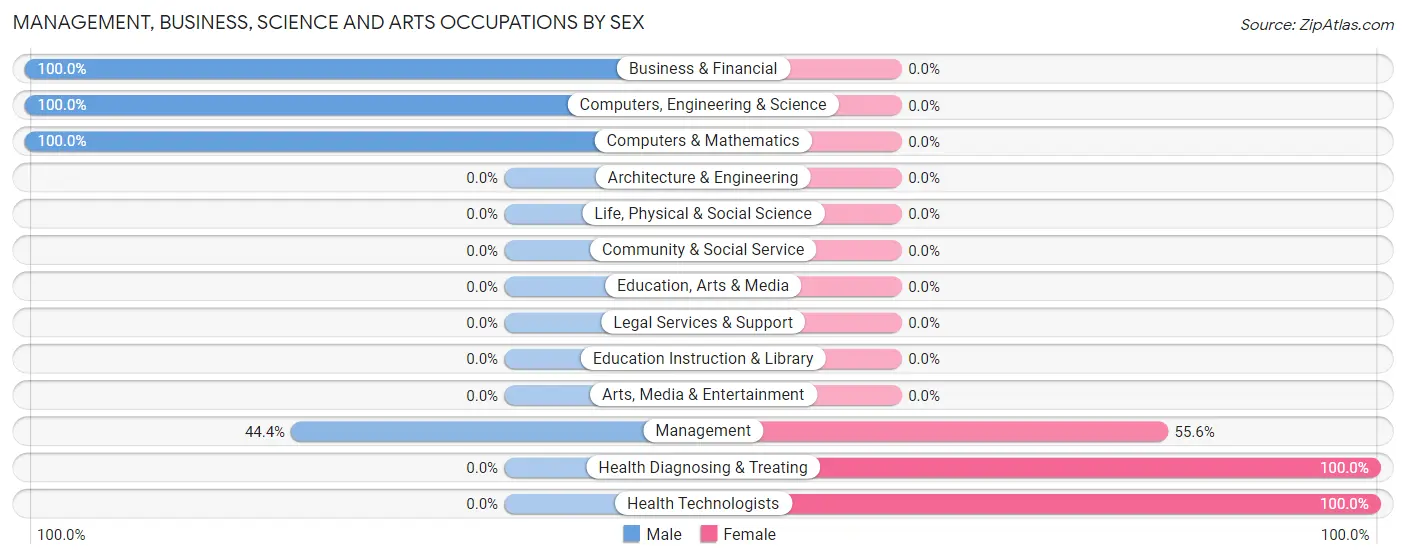
Management, Business, Science and Arts Occupations by Sex
Within the Management, Business, Science and Arts occupations in Heber Overgaard, the most male-oriented occupations are Business & Financial (100.0%), Computers, Engineering & Science (100.0%), and Computers & Mathematics (100.0%), while the most female-oriented occupations are Health Diagnosing & Treating (100.0%), Health Technologists (100.0%), and Management (55.6%).
| Occupation | Male | Female |
| Management | 36 (44.4%) | 45 (55.6%) |
| Business & Financial | 13 (100.0%) | 0 (0.0%) |
| Computers, Engineering & Science | 21 (100.0%) | 0 (0.0%) |
| Computers & Mathematics | 21 (100.0%) | 0 (0.0%) |
| Architecture & Engineering | 0 (0.0%) | 0 (0.0%) |
| Life, Physical & Social Science | 0 (0.0%) | 0 (0.0%) |
| Community & Social Service | 0 (0.0%) | 0 (0.0%) |
| Education, Arts & Media | 0 (0.0%) | 0 (0.0%) |
| Legal Services & Support | 0 (0.0%) | 0 (0.0%) |
| Education Instruction & Library | 0 (0.0%) | 0 (0.0%) |
| Arts, Media & Entertainment | 0 (0.0%) | 0 (0.0%) |
| Health Diagnosing & Treating | 0 (0.0%) | 19 (100.0%) |
| Health Technologists | 0 (0.0%) | 19 (100.0%) |
| Total (Category) | 70 (52.2%) | 64 (47.8%) |
| Total (Overall) | 404 (58.3%) | 289 (41.7%) |
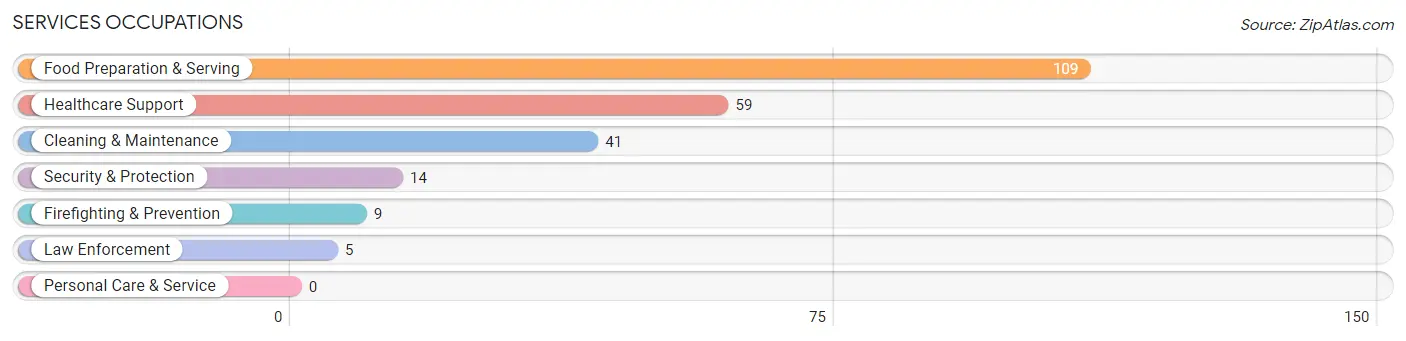
Services Occupations
The most common Services occupations in Heber Overgaard are Food Preparation & Serving (109 | 15.7%), Healthcare Support (59 | 8.5%), Cleaning & Maintenance (41 | 5.9%), Security & Protection (14 | 2.0%), and Firefighting & Prevention (9 | 1.3%).
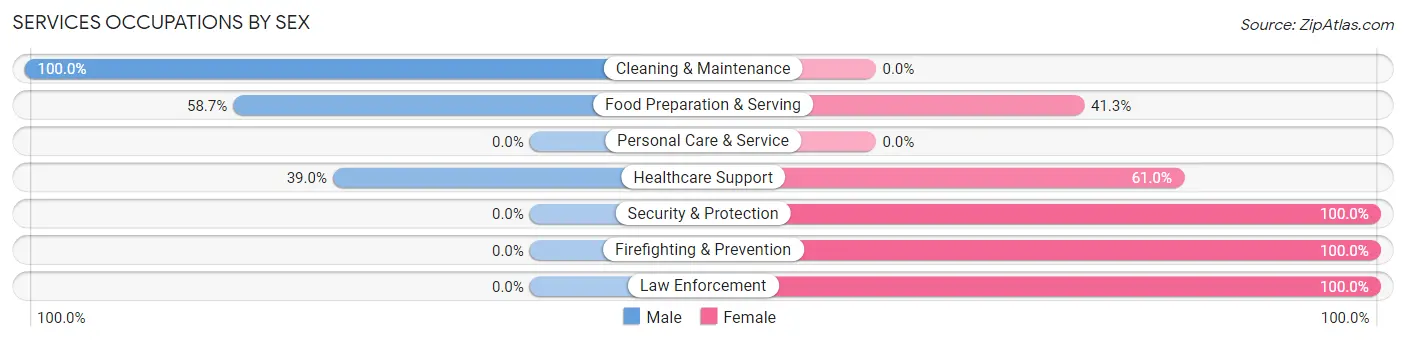
Services Occupations by Sex
Within the Services occupations in Heber Overgaard, the most male-oriented occupations are Cleaning & Maintenance (100.0%), Food Preparation & Serving (58.7%), and Healthcare Support (39.0%), while the most female-oriented occupations are Security & Protection (100.0%), Firefighting & Prevention (100.0%), and Law Enforcement (100.0%).
| Occupation | Male | Female |
| Healthcare Support | 23 (39.0%) | 36 (61.0%) |
| Security & Protection | 0 (0.0%) | 14 (100.0%) |
| Firefighting & Prevention | 0 (0.0%) | 9 (100.0%) |
| Law Enforcement | 0 (0.0%) | 5 (100.0%) |
| Food Preparation & Serving | 64 (58.7%) | 45 (41.3%) |
| Cleaning & Maintenance | 41 (100.0%) | 0 (0.0%) |
| Personal Care & Service | 0 (0.0%) | 0 (0.0%) |
| Total (Category) | 128 (57.4%) | 95 (42.6%) |
| Total (Overall) | 404 (58.3%) | 289 (41.7%) |
Sales and Office Occupations
The most common Sales and Office occupations in Heber Overgaard are Sales & Related (91 | 13.1%), and Office & Administration (52 | 7.5%).
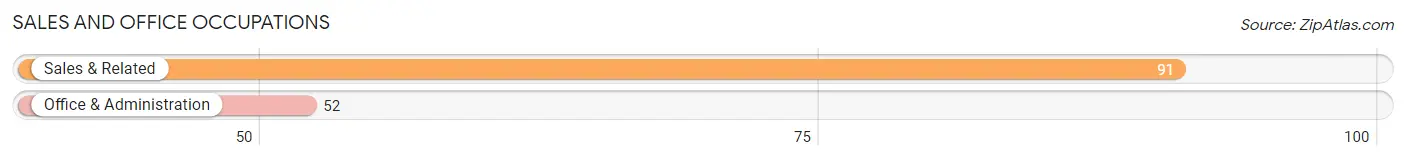
Sales and Office Occupations by Sex
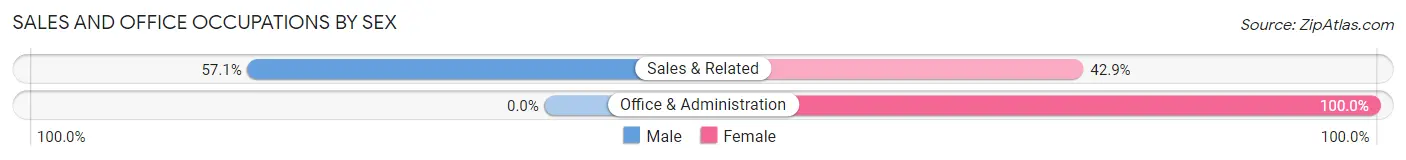
| Occupation | Male | Female |
| Sales & Related | 52 (57.1%) | 39 (42.9%) |
| Office & Administration | 0 (0.0%) | 52 (100.0%) |
| Total (Category) | 52 (36.4%) | 91 (63.6%) |
| Total (Overall) | 404 (58.3%) | 289 (41.7%) |
Natural Resources, Construction and Maintenance Occupations
The most common Natural Resources, Construction and Maintenance occupations in Heber Overgaard are Construction & Extraction (136 | 19.6%), and Installation, Maintenance & Repair (12 | 1.7%).
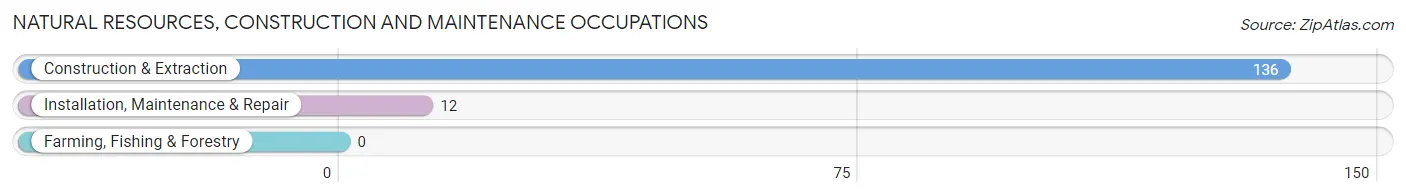
Natural Resources, Construction and Maintenance Occupations by Sex
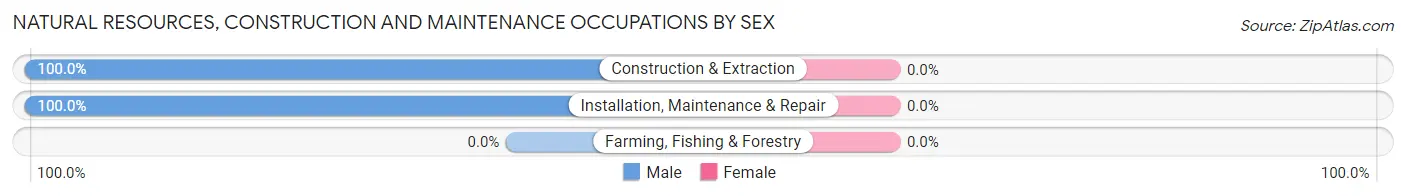
| Occupation | Male | Female |
| Farming, Fishing & Forestry | 0 (0.0%) | 0 (0.0%) |
| Construction & Extraction | 136 (100.0%) | 0 (0.0%) |
| Installation, Maintenance & Repair | 12 (100.0%) | 0 (0.0%) |
| Total (Category) | 148 (100.0%) | 0 (0.0%) |
| Total (Overall) | 404 (58.3%) | 289 (41.7%) |
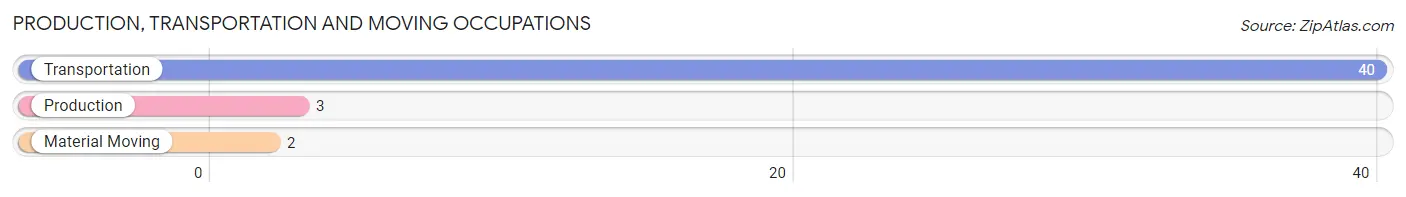
Production, Transportation and Moving Occupations
The most common Production, Transportation and Moving occupations in Heber Overgaard are Transportation (40 | 5.8%), Production (3 | 0.4%), and Material Moving (2 | 0.3%).
Production, Transportation and Moving Occupations by Sex
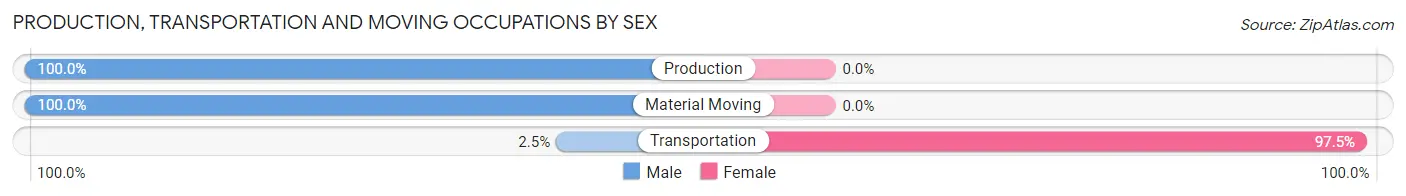
| Occupation | Male | Female |
| Production | 3 (100.0%) | 0 (0.0%) |
| Transportation | 1 (2.5%) | 39 (97.5%) |
| Material Moving | 2 (100.0%) | 0 (0.0%) |
| Total (Category) | 6 (13.3%) | 39 (86.7%) |
| Total (Overall) | 404 (58.3%) | 289 (41.7%) |
Employment Industries by Sex in Heber Overgaard
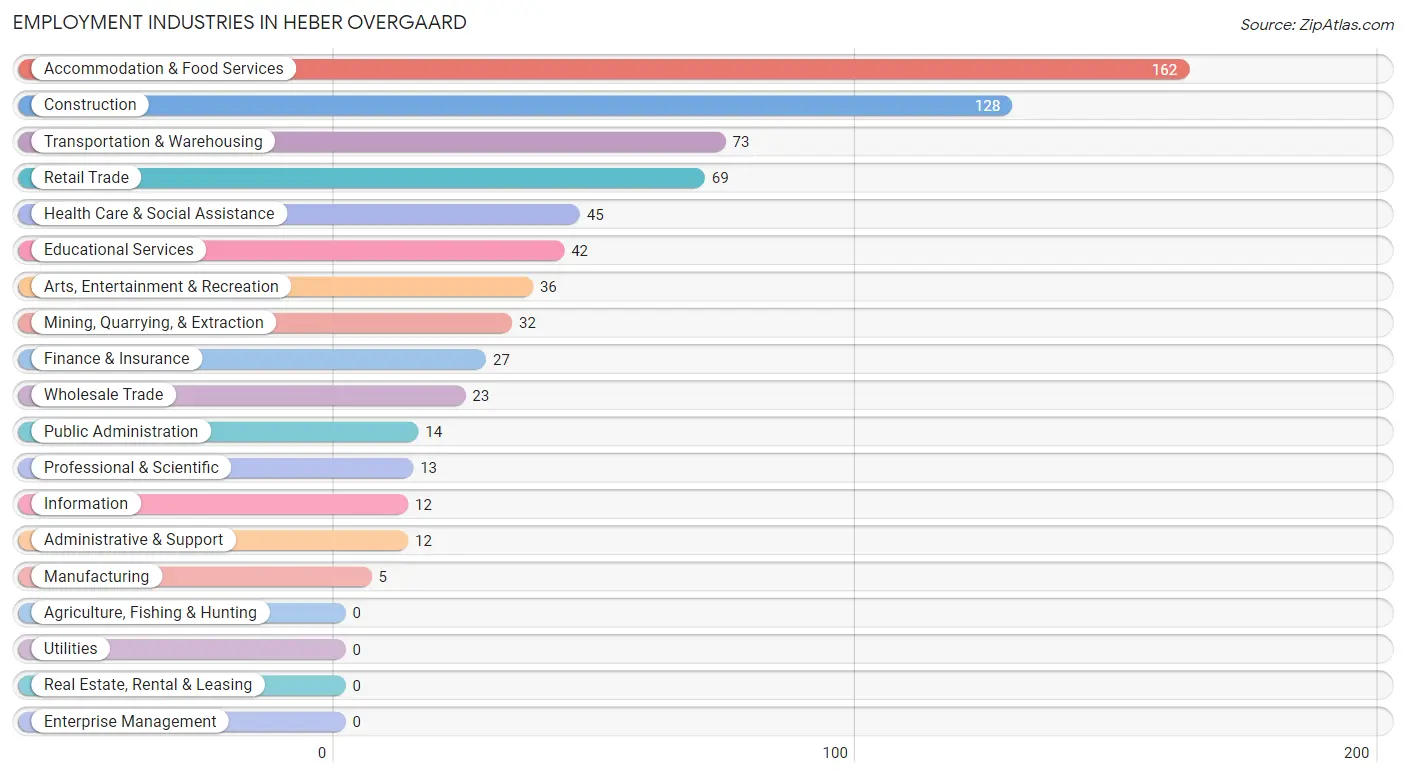
Employment Industries in Heber Overgaard
The major employment industries in Heber Overgaard include Accommodation & Food Services (162 | 23.4%), Construction (128 | 18.5%), Transportation & Warehousing (73 | 10.5%), Retail Trade (69 | 10.0%), and Health Care & Social Assistance (45 | 6.5%).
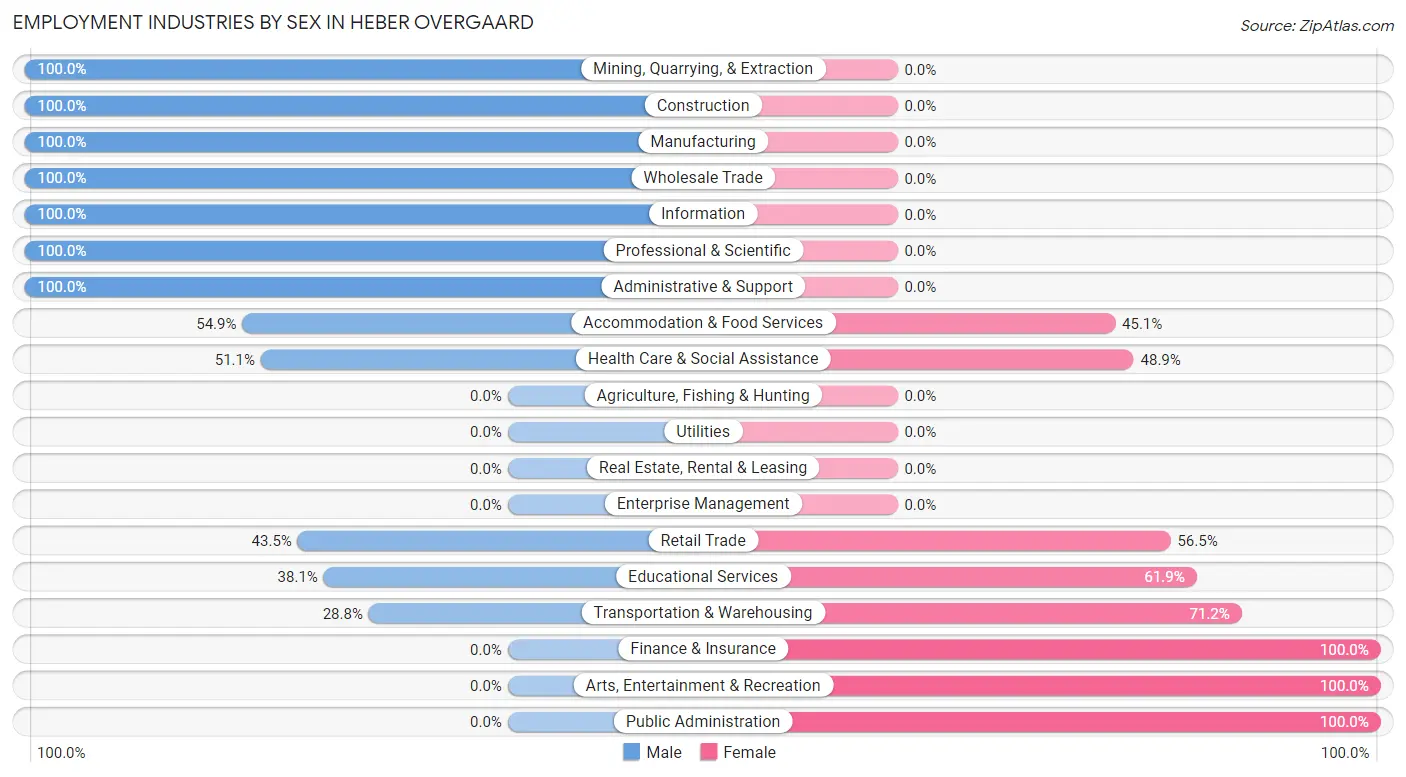
Employment Industries by Sex in Heber Overgaard
The Heber Overgaard industries that see more men than women are Mining, Quarrying, & Extraction (100.0%), Construction (100.0%), and Manufacturing (100.0%), whereas the industries that tend to have a higher number of women are Finance & Insurance (100.0%), Arts, Entertainment & Recreation (100.0%), and Public Administration (100.0%).
| Industry | Male | Female |
| Agriculture, Fishing & Hunting | 0 (0.0%) | 0 (0.0%) |
| Mining, Quarrying, & Extraction | 32 (100.0%) | 0 (0.0%) |
| Construction | 128 (100.0%) | 0 (0.0%) |
| Manufacturing | 5 (100.0%) | 0 (0.0%) |
| Wholesale Trade | 23 (100.0%) | 0 (0.0%) |
| Retail Trade | 30 (43.5%) | 39 (56.5%) |
| Transportation & Warehousing | 21 (28.8%) | 52 (71.2%) |
| Utilities | 0 (0.0%) | 0 (0.0%) |
| Information | 12 (100.0%) | 0 (0.0%) |
| Finance & Insurance | 0 (0.0%) | 27 (100.0%) |
| Real Estate, Rental & Leasing | 0 (0.0%) | 0 (0.0%) |
| Professional & Scientific | 13 (100.0%) | 0 (0.0%) |
| Enterprise Management | 0 (0.0%) | 0 (0.0%) |
| Administrative & Support | 12 (100.0%) | 0 (0.0%) |
| Educational Services | 16 (38.1%) | 26 (61.9%) |
| Health Care & Social Assistance | 23 (51.1%) | 22 (48.9%) |
| Arts, Entertainment & Recreation | 0 (0.0%) | 36 (100.0%) |
| Accommodation & Food Services | 89 (54.9%) | 73 (45.1%) |
| Public Administration | 0 (0.0%) | 14 (100.0%) |
| Total | 404 (58.3%) | 289 (41.7%) |
Education in Heber Overgaard
School Enrollment in Heber Overgaard
The most common levels of schooling among the 261 students in Heber Overgaard are elementary school (94 | 36.0%), high school (76 | 29.1%), and middle school (67 | 25.7%).
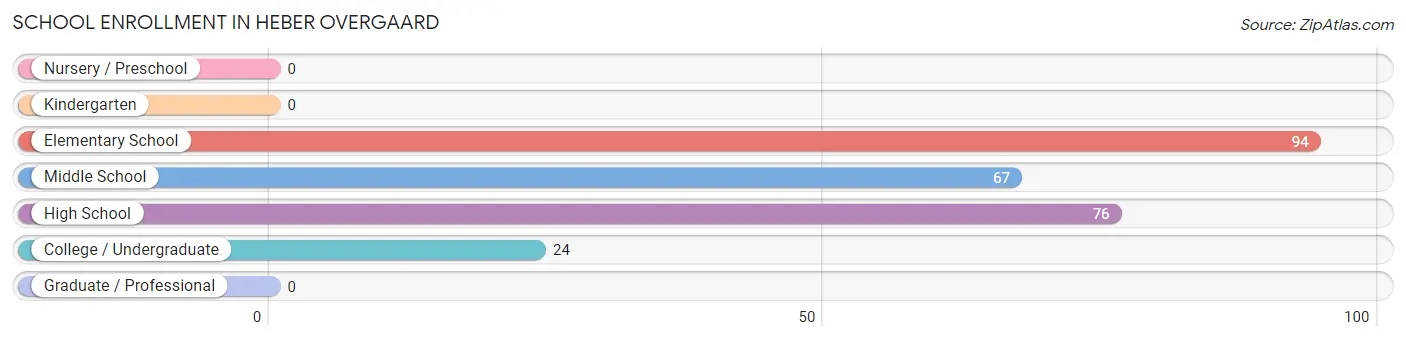
| School Level | # Students | % Students |
| Nursery / Preschool | 0 | 0.0% |
| Kindergarten | 0 | 0.0% |
| Elementary School | 94 | 36.0% |
| Middle School | 67 | 25.7% |
| High School | 76 | 29.1% |
| College / Undergraduate | 24 | 9.2% |
| Graduate / Professional | 0 | 0.0% |
| Total | 261 | 100.0% |
School Enrollment by Age by Funding Source in Heber Overgaard
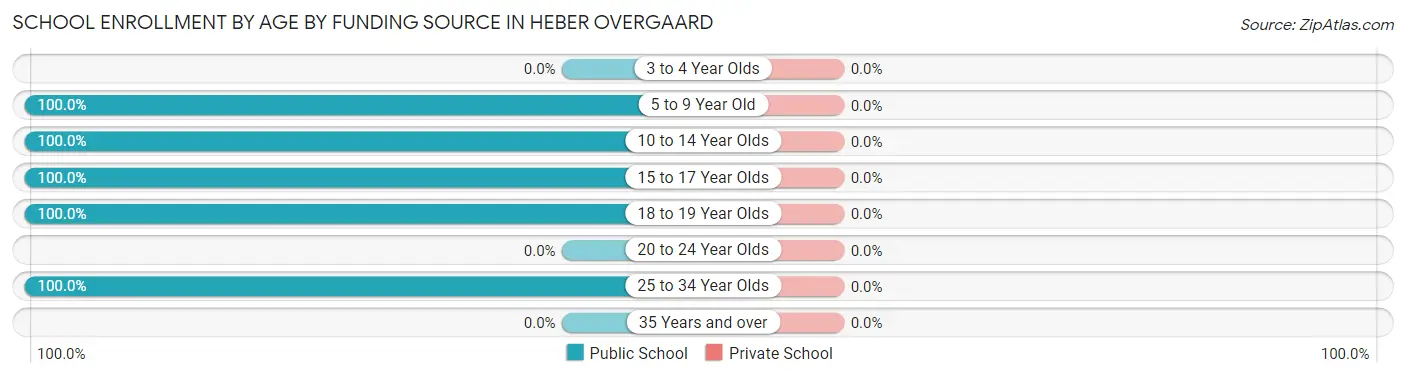
| Age Bracket | Public School | Private School |
| 3 to 4 Year Olds | 0 (0.0%) | 0 (0.0%) |
| 5 to 9 Year Old | 94 (100.0%) | 0 (0.0%) |
| 10 to 14 Year Olds | 105 (100.0%) | 0 (0.0%) |
| 15 to 17 Year Olds | 25 (100.0%) | 0 (0.0%) |
| 18 to 19 Year Olds | 13 (100.0%) | 0 (0.0%) |
| 20 to 24 Year Olds | 0 (0.0%) | 0 (0.0%) |
| 25 to 34 Year Olds | 24 (100.0%) | 0 (0.0%) |
| 35 Years and over | 0 (0.0%) | 0 (0.0%) |
| Total | 261 (100.0%) | 0 (0.0%) |
Educational Attainment by Field of Study in Heber Overgaard
Engineering (55 | 20.7%), business (54 | 20.4%), physical & health sciences (30 | 11.3%), social sciences (23 | 8.7%), and computers & mathematics (20 | 7.5%) are the most common fields of study among 265 individuals in Heber Overgaard who have obtained a bachelor's degree or higher.
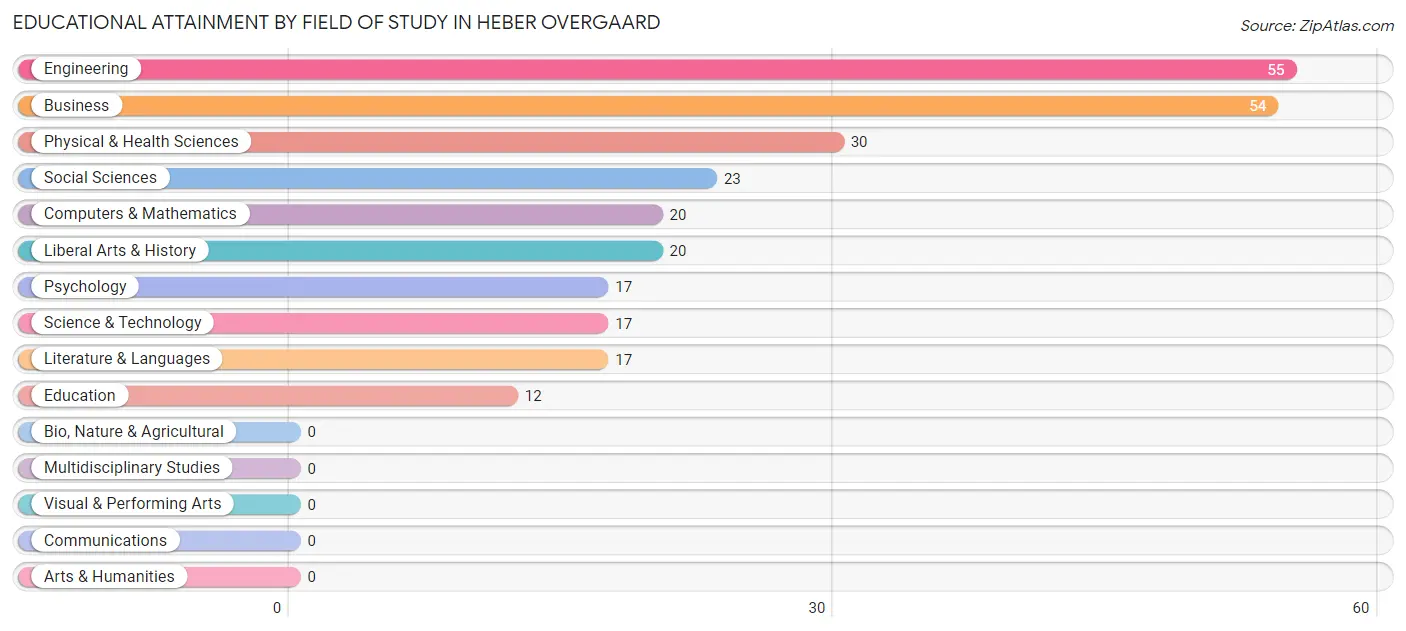
| Field of Study | # Graduates | % Graduates |
| Computers & Mathematics | 20 | 7.5% |
| Bio, Nature & Agricultural | 0 | 0.0% |
| Physical & Health Sciences | 30 | 11.3% |
| Psychology | 17 | 6.4% |
| Social Sciences | 23 | 8.7% |
| Engineering | 55 | 20.7% |
| Multidisciplinary Studies | 0 | 0.0% |
| Science & Technology | 17 | 6.4% |
| Business | 54 | 20.4% |
| Education | 12 | 4.5% |
| Literature & Languages | 17 | 6.4% |
| Liberal Arts & History | 20 | 7.5% |
| Visual & Performing Arts | 0 | 0.0% |
| Communications | 0 | 0.0% |
| Arts & Humanities | 0 | 0.0% |
| Total | 265 | 100.0% |
Transportation & Commute in Heber Overgaard
Vehicle Availability by Sex in Heber Overgaard
The most prevalent vehicle ownership categories in Heber Overgaard are males with 2 vehicles (222, accounting for 56.2%) and females with 2 vehicles (142, making up 76.8%).
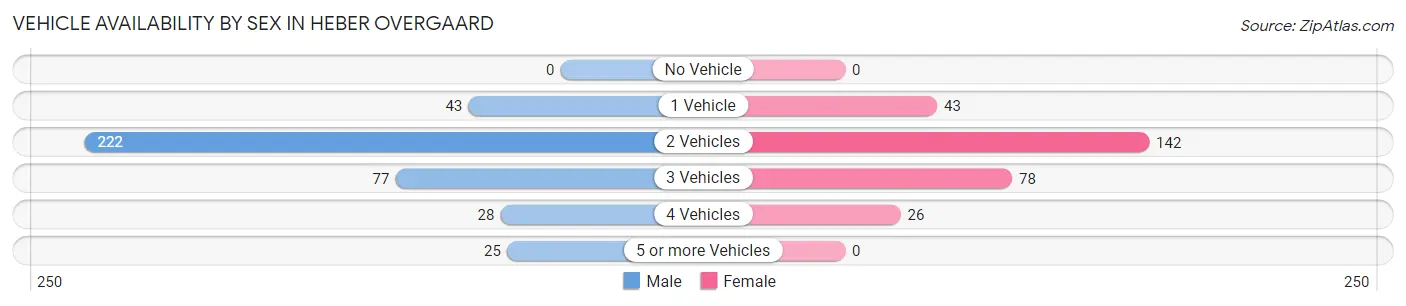
| Vehicles Available | Male | Female |
| No Vehicle | 0 (0.0%) | 0 (0.0%) |
| 1 Vehicle | 43 (10.9%) | 43 (14.9%) |
| 2 Vehicles | 222 (56.2%) | 142 (49.1%) |
| 3 Vehicles | 77 (19.5%) | 78 (27.0%) |
| 4 Vehicles | 28 (7.1%) | 26 (9.0%) |
| 5 or more Vehicles | 25 (6.3%) | 0 (0.0%) |
| Total | 395 (100.0%) | 289 (100.0%) |
Commute Time in Heber Overgaard
The most frequently occuring commute durations in Heber Overgaard are 5 to 9 minutes (228 commuters, 33.5%), less than 5 minutes (131 commuters, 19.3%), and 40 to 44 minutes (112 commuters, 16.5%).
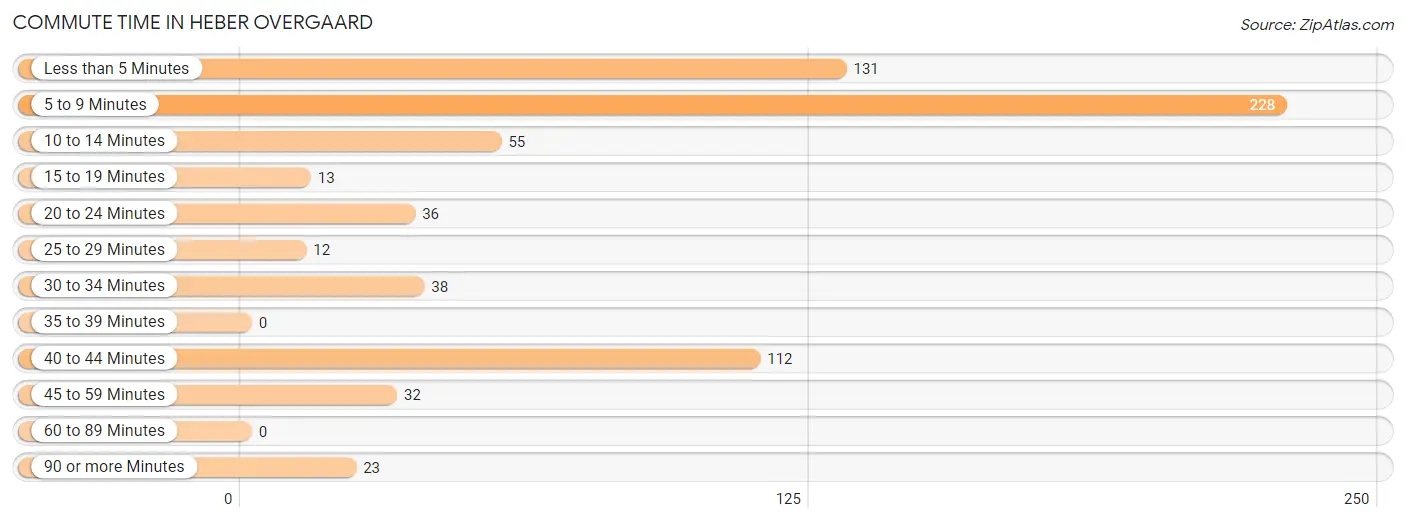
| Commute Time | # Commuters | % Commuters |
| Less than 5 Minutes | 131 | 19.3% |
| 5 to 9 Minutes | 228 | 33.5% |
| 10 to 14 Minutes | 55 | 8.1% |
| 15 to 19 Minutes | 13 | 1.9% |
| 20 to 24 Minutes | 36 | 5.3% |
| 25 to 29 Minutes | 12 | 1.8% |
| 30 to 34 Minutes | 38 | 5.6% |
| 35 to 39 Minutes | 0 | 0.0% |
| 40 to 44 Minutes | 112 | 16.5% |
| 45 to 59 Minutes | 32 | 4.7% |
| 60 to 89 Minutes | 0 | 0.0% |
| 90 or more Minutes | 23 | 3.4% |
Commute Time by Sex in Heber Overgaard
The most common commute times in Heber Overgaard are 5 to 9 minutes (128 commuters, 31.7%) for males and 5 to 9 minutes (100 commuters, 36.2%) for females.
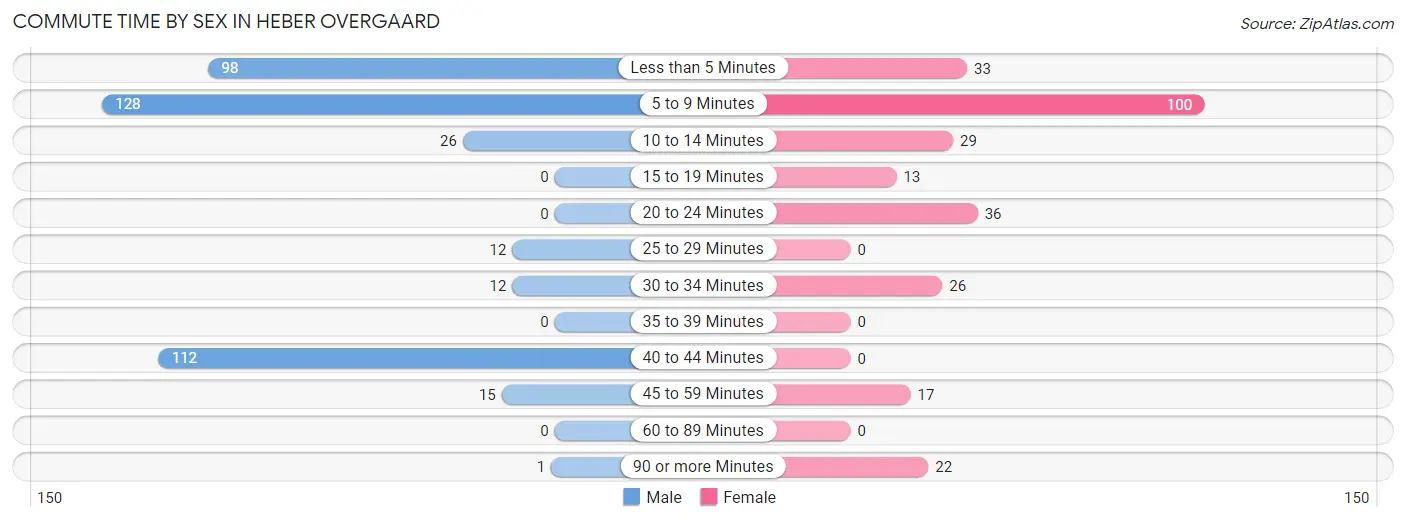
| Commute Time | Male | Female |
| Less than 5 Minutes | 98 (24.3%) | 33 (12.0%) |
| 5 to 9 Minutes | 128 (31.7%) | 100 (36.2%) |
| 10 to 14 Minutes | 26 (6.4%) | 29 (10.5%) |
| 15 to 19 Minutes | 0 (0.0%) | 13 (4.7%) |
| 20 to 24 Minutes | 0 (0.0%) | 36 (13.0%) |
| 25 to 29 Minutes | 12 (3.0%) | 0 (0.0%) |
| 30 to 34 Minutes | 12 (3.0%) | 26 (9.4%) |
| 35 to 39 Minutes | 0 (0.0%) | 0 (0.0%) |
| 40 to 44 Minutes | 112 (27.7%) | 0 (0.0%) |
| 45 to 59 Minutes | 15 (3.7%) | 17 (6.2%) |
| 60 to 89 Minutes | 0 (0.0%) | 0 (0.0%) |
| 90 or more Minutes | 1 (0.3%) | 22 (8.0%) |
Time of Departure to Work by Sex in Heber Overgaard
The most frequent times of departure to work in Heber Overgaard are 7:00 AM to 7:29 AM (101, 25.0%) for males and 6:00 AM to 6:29 AM (54, 19.6%) for females.
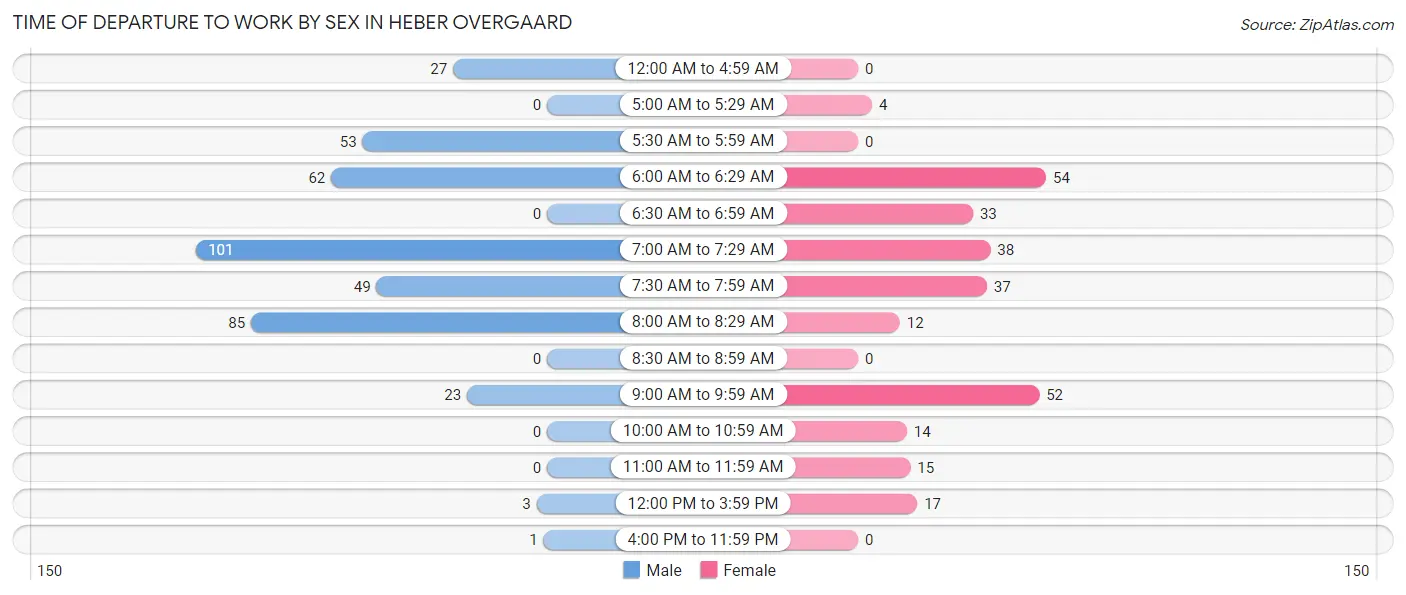
| Time of Departure | Male | Female |
| 12:00 AM to 4:59 AM | 27 (6.7%) | 0 (0.0%) |
| 5:00 AM to 5:29 AM | 0 (0.0%) | 4 (1.5%) |
| 5:30 AM to 5:59 AM | 53 (13.1%) | 0 (0.0%) |
| 6:00 AM to 6:29 AM | 62 (15.3%) | 54 (19.6%) |
| 6:30 AM to 6:59 AM | 0 (0.0%) | 33 (12.0%) |
| 7:00 AM to 7:29 AM | 101 (25.0%) | 38 (13.8%) |
| 7:30 AM to 7:59 AM | 49 (12.1%) | 37 (13.4%) |
| 8:00 AM to 8:29 AM | 85 (21.0%) | 12 (4.3%) |
| 8:30 AM to 8:59 AM | 0 (0.0%) | 0 (0.0%) |
| 9:00 AM to 9:59 AM | 23 (5.7%) | 52 (18.8%) |
| 10:00 AM to 10:59 AM | 0 (0.0%) | 14 (5.1%) |
| 11:00 AM to 11:59 AM | 0 (0.0%) | 15 (5.4%) |
| 12:00 PM to 3:59 PM | 3 (0.7%) | 17 (6.2%) |
| 4:00 PM to 11:59 PM | 1 (0.3%) | 0 (0.0%) |
| Total | 404 (100.0%) | 276 (100.0%) |
Housing Occupancy in Heber Overgaard
Occupancy by Ownership in Heber Overgaard
Of the total 1,218 dwellings in Heber Overgaard, owner-occupied units account for 960 (78.8%), while renter-occupied units make up 258 (21.2%).
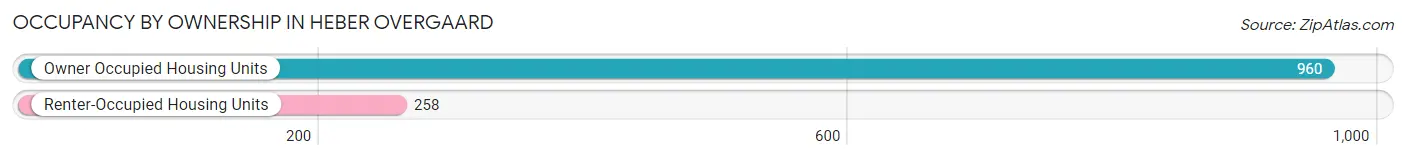
| Occupancy | # Housing Units | % Housing Units |
| Owner Occupied Housing Units | 960 | 78.8% |
| Renter-Occupied Housing Units | 258 | 21.2% |
| Total Occupied Housing Units | 1,218 | 100.0% |
Occupancy by Household Size in Heber Overgaard
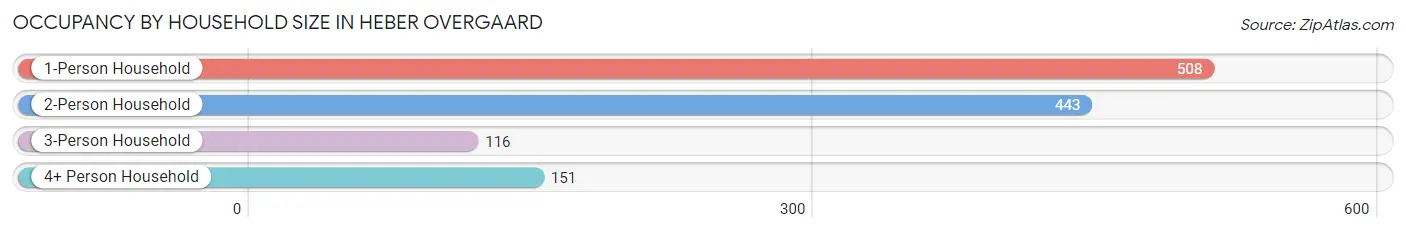
| Household Size | # Housing Units | % Housing Units |
| 1-Person Household | 508 | 41.7% |
| 2-Person Household | 443 | 36.4% |
| 3-Person Household | 116 | 9.5% |
| 4+ Person Household | 151 | 12.4% |
| Total Housing Units | 1,218 | 100.0% |
Occupancy by Ownership by Household Size in Heber Overgaard
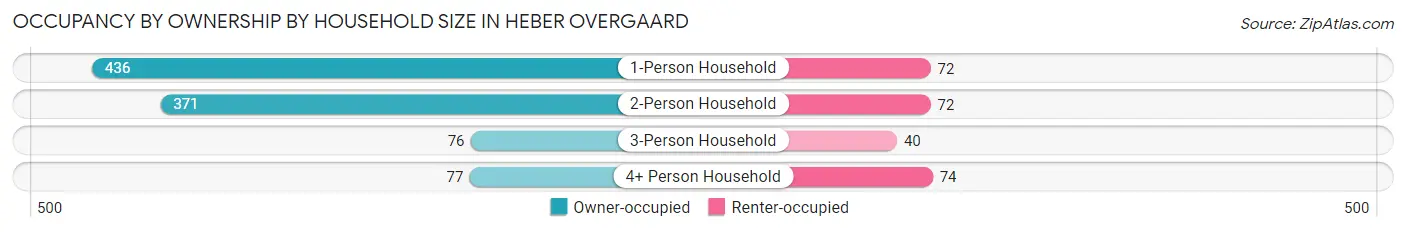
| Household Size | Owner-occupied | Renter-occupied |
| 1-Person Household | 436 (85.8%) | 72 (14.2%) |
| 2-Person Household | 371 (83.8%) | 72 (16.3%) |
| 3-Person Household | 76 (65.5%) | 40 (34.5%) |
| 4+ Person Household | 77 (51.0%) | 74 (49.0%) |
| Total Housing Units | 960 (78.8%) | 258 (21.2%) |
Occupancy by Educational Attainment in Heber Overgaard
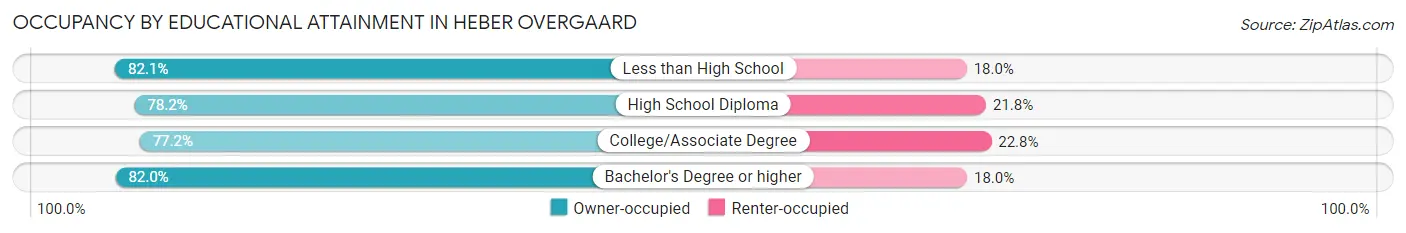
| Household Size | Owner-occupied | Renter-occupied |
| Less than High School | 96 (82.1%) | 21 (17.9%) |
| High School Diploma | 273 (78.2%) | 76 (21.8%) |
| College/Associate Degree | 409 (77.2%) | 121 (22.8%) |
| Bachelor's Degree or higher | 182 (82.0%) | 40 (18.0%) |
Occupancy by Age of Householder in Heber Overgaard
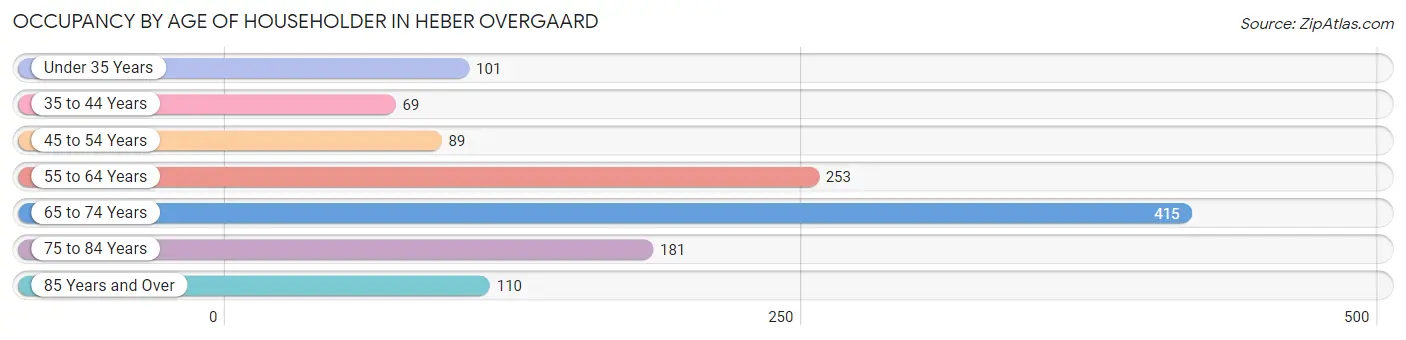
| Age Bracket | # Households | % Households |
| Under 35 Years | 101 | 8.3% |
| 35 to 44 Years | 69 | 5.7% |
| 45 to 54 Years | 89 | 7.3% |
| 55 to 64 Years | 253 | 20.8% |
| 65 to 74 Years | 415 | 34.1% |
| 75 to 84 Years | 181 | 14.9% |
| 85 Years and Over | 110 | 9.0% |
| Total | 1,218 | 100.0% |
Housing Finances in Heber Overgaard
Median Income by Occupancy in Heber Overgaard
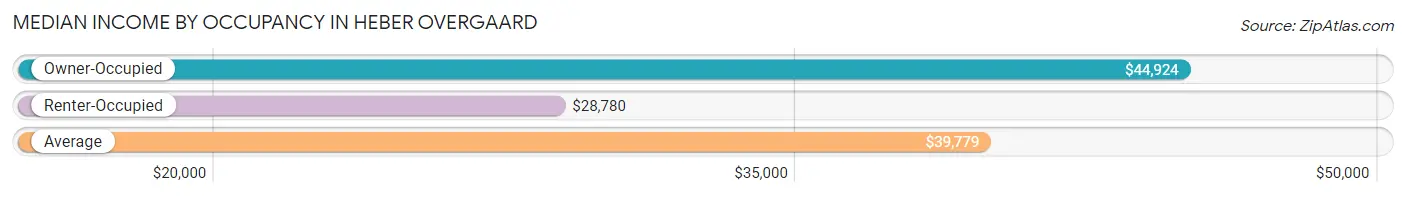
| Occupancy Type | # Households | Median Income |
| Owner-Occupied | 960 (78.8%) | $44,924 |
| Renter-Occupied | 258 (21.2%) | $28,780 |
| Average | 1,218 (100.0%) | $39,779 |
Occupancy by Householder Income Bracket in Heber Overgaard
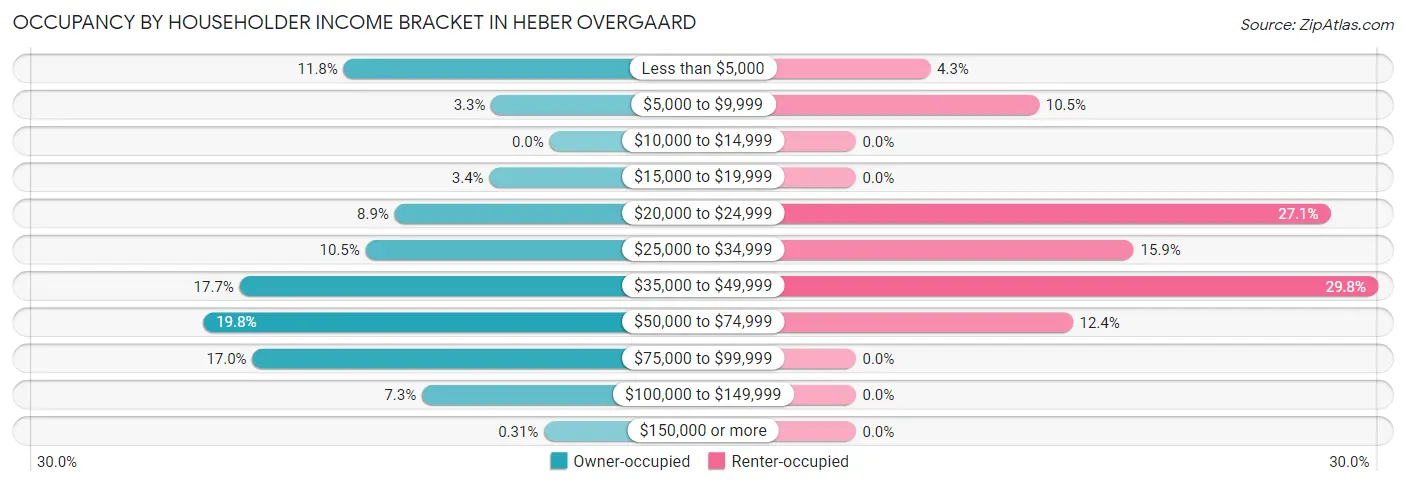
| Income Bracket | Owner-occupied | Renter-occupied |
| Less than $5,000 | 113 (11.8%) | 11 (4.3%) |
| $5,000 to $9,999 | 32 (3.3%) | 27 (10.5%) |
| $10,000 to $14,999 | 0 (0.0%) | 0 (0.0%) |
| $15,000 to $19,999 | 33 (3.4%) | 0 (0.0%) |
| $20,000 to $24,999 | 85 (8.8%) | 70 (27.1%) |
| $25,000 to $34,999 | 101 (10.5%) | 41 (15.9%) |
| $35,000 to $49,999 | 170 (17.7%) | 77 (29.8%) |
| $50,000 to $74,999 | 190 (19.8%) | 32 (12.4%) |
| $75,000 to $99,999 | 163 (17.0%) | 0 (0.0%) |
| $100,000 to $149,999 | 70 (7.3%) | 0 (0.0%) |
| $150,000 or more | 3 (0.3%) | 0 (0.0%) |
| Total | 960 (100.0%) | 258 (100.0%) |
Monthly Housing Cost Tiers in Heber Overgaard
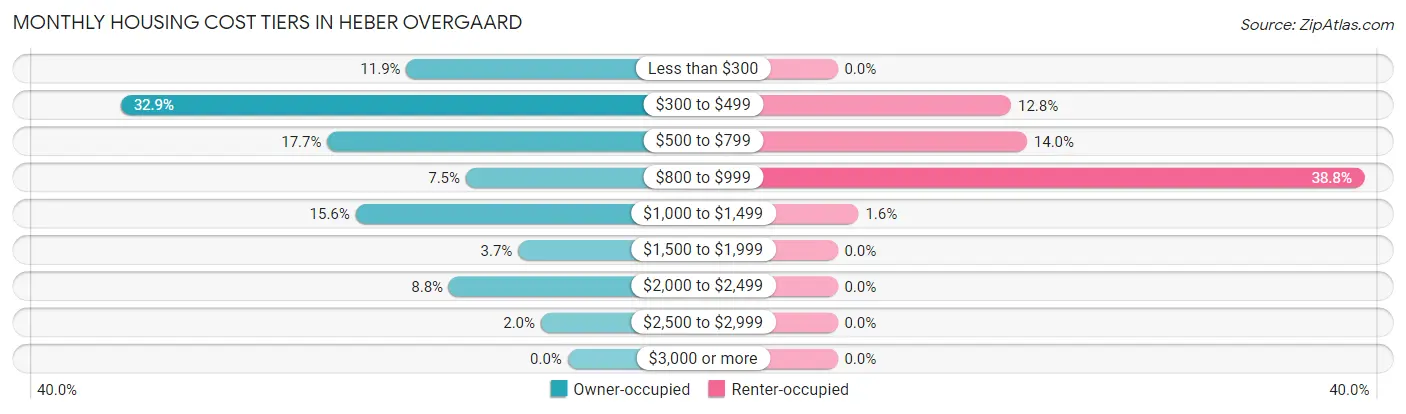
| Monthly Cost | Owner-occupied | Renter-occupied |
| Less than $300 | 114 (11.9%) | 0 (0.0%) |
| $300 to $499 | 316 (32.9%) | 33 (12.8%) |
| $500 to $799 | 170 (17.7%) | 36 (14.0%) |
| $800 to $999 | 72 (7.5%) | 100 (38.8%) |
| $1,000 to $1,499 | 150 (15.6%) | 4 (1.5%) |
| $1,500 to $1,999 | 35 (3.6%) | 0 (0.0%) |
| $2,000 to $2,499 | 84 (8.7%) | 0 (0.0%) |
| $2,500 to $2,999 | 19 (2.0%) | 0 (0.0%) |
| $3,000 or more | 0 (0.0%) | 0 (0.0%) |
| Total | 960 (100.0%) | 258 (100.0%) |
Physical Housing Characteristics in Heber Overgaard
Housing Structures in Heber Overgaard
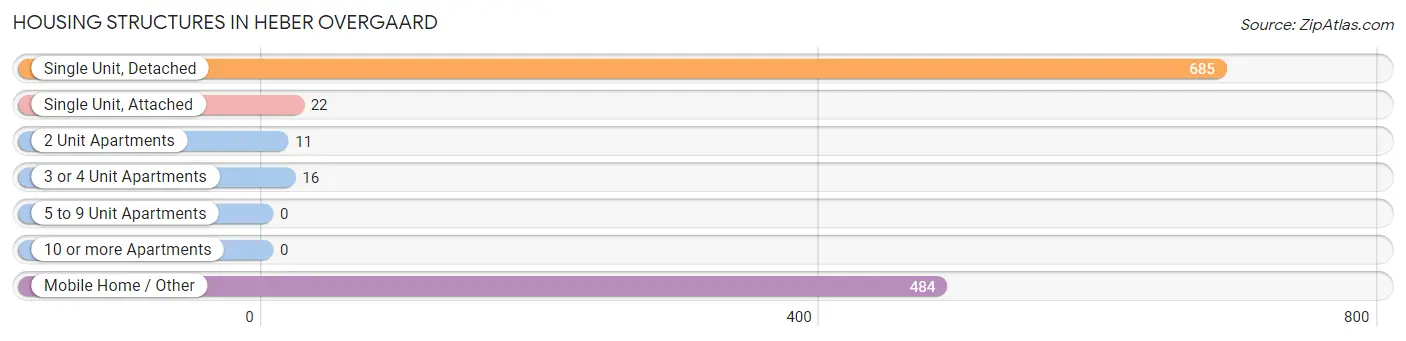
| Structure Type | # Housing Units | % Housing Units |
| Single Unit, Detached | 685 | 56.2% |
| Single Unit, Attached | 22 | 1.8% |
| 2 Unit Apartments | 11 | 0.9% |
| 3 or 4 Unit Apartments | 16 | 1.3% |
| 5 to 9 Unit Apartments | 0 | 0.0% |
| 10 or more Apartments | 0 | 0.0% |
| Mobile Home / Other | 484 | 39.7% |
| Total | 1,218 | 100.0% |
Housing Structures by Occupancy in Heber Overgaard
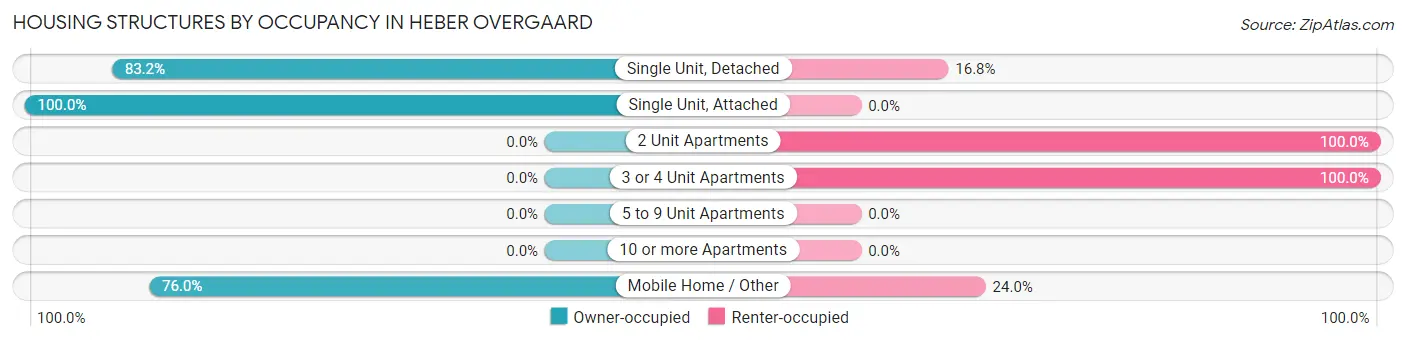
| Structure Type | Owner-occupied | Renter-occupied |
| Single Unit, Detached | 570 (83.2%) | 115 (16.8%) |
| Single Unit, Attached | 22 (100.0%) | 0 (0.0%) |
| 2 Unit Apartments | 0 (0.0%) | 11 (100.0%) |
| 3 or 4 Unit Apartments | 0 (0.0%) | 16 (100.0%) |
| 5 to 9 Unit Apartments | 0 (0.0%) | 0 (0.0%) |
| 10 or more Apartments | 0 (0.0%) | 0 (0.0%) |
| Mobile Home / Other | 368 (76.0%) | 116 (24.0%) |
| Total | 960 (78.8%) | 258 (21.2%) |
Housing Structures by Number of Rooms in Heber Overgaard
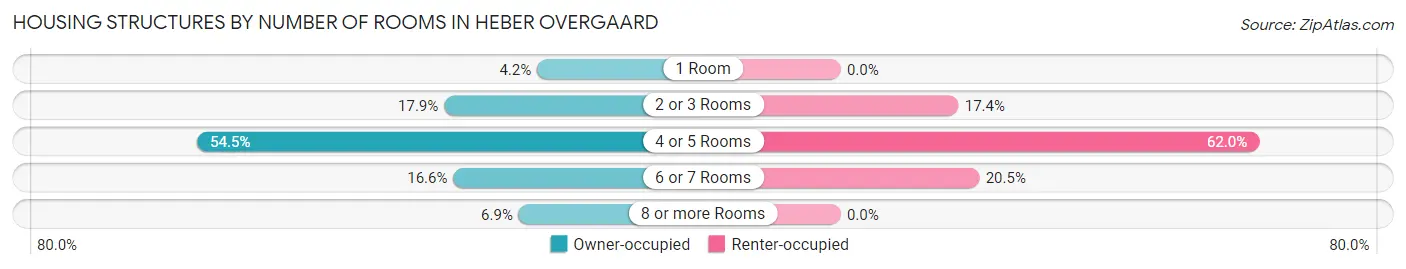
| Number of Rooms | Owner-occupied | Renter-occupied |
| 1 Room | 40 (4.2%) | 0 (0.0%) |
| 2 or 3 Rooms | 172 (17.9%) | 45 (17.4%) |
| 4 or 5 Rooms | 523 (54.5%) | 160 (62.0%) |
| 6 or 7 Rooms | 159 (16.6%) | 53 (20.5%) |
| 8 or more Rooms | 66 (6.9%) | 0 (0.0%) |
| Total | 960 (100.0%) | 258 (100.0%) |
Housing Structure by Heating Type in Heber Overgaard
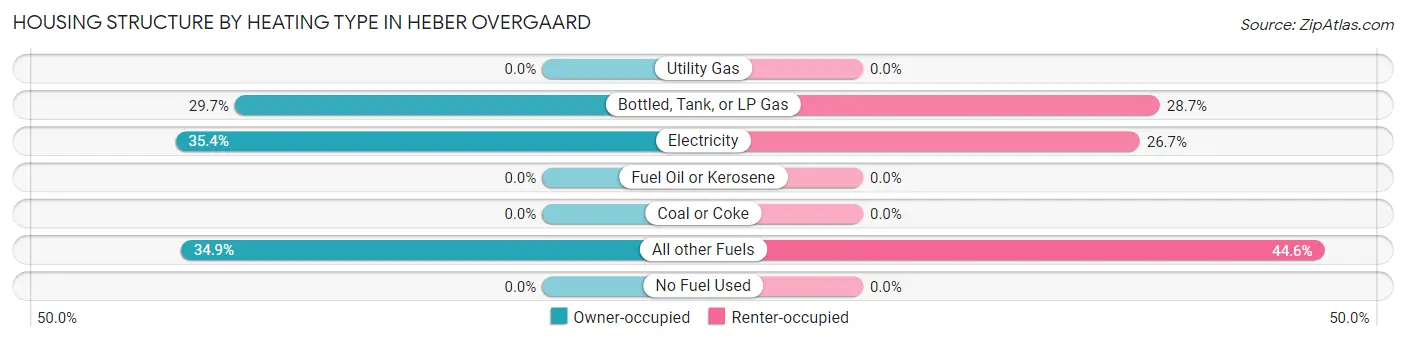
| Heating Type | Owner-occupied | Renter-occupied |
| Utility Gas | 0 (0.0%) | 0 (0.0%) |
| Bottled, Tank, or LP Gas | 285 (29.7%) | 74 (28.7%) |
| Electricity | 340 (35.4%) | 69 (26.7%) |
| Fuel Oil or Kerosene | 0 (0.0%) | 0 (0.0%) |
| Coal or Coke | 0 (0.0%) | 0 (0.0%) |
| All other Fuels | 335 (34.9%) | 115 (44.6%) |
| No Fuel Used | 0 (0.0%) | 0 (0.0%) |
| Total | 960 (100.0%) | 258 (100.0%) |
Household Vehicle Usage in Heber Overgaard
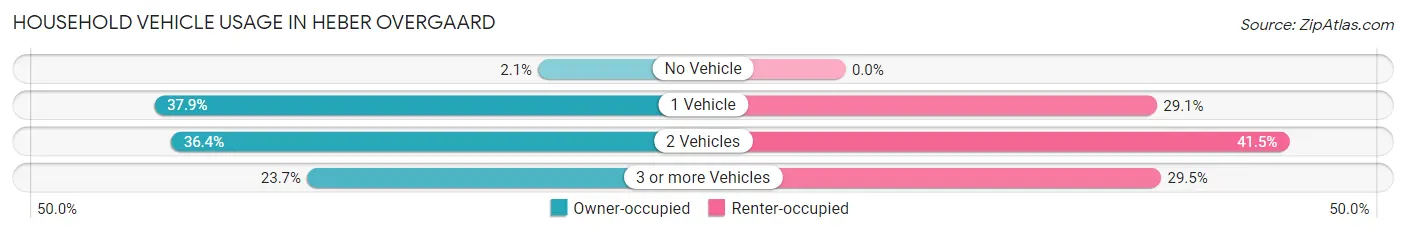
| Vehicles per Household | Owner-occupied | Renter-occupied |
| No Vehicle | 20 (2.1%) | 0 (0.0%) |
| 1 Vehicle | 364 (37.9%) | 75 (29.1%) |
| 2 Vehicles | 349 (36.3%) | 107 (41.5%) |
| 3 or more Vehicles | 227 (23.6%) | 76 (29.5%) |
| Total | 960 (100.0%) | 258 (100.0%) |
Real Estate & Mortgages in Heber Overgaard
Real Estate and Mortgage Overview in Heber Overgaard
| Characteristic | Without Mortgage | With Mortgage |
| Housing Units | 505 | 455 |
| Median Property Value | $200,200 | $237,700 |
| Median Household Income | $39,441 | $0 |
| Monthly Housing Costs | $374 | $0 |
| Real Estate Taxes | $960 | $0 |
Property Value by Mortgage Status in Heber Overgaard
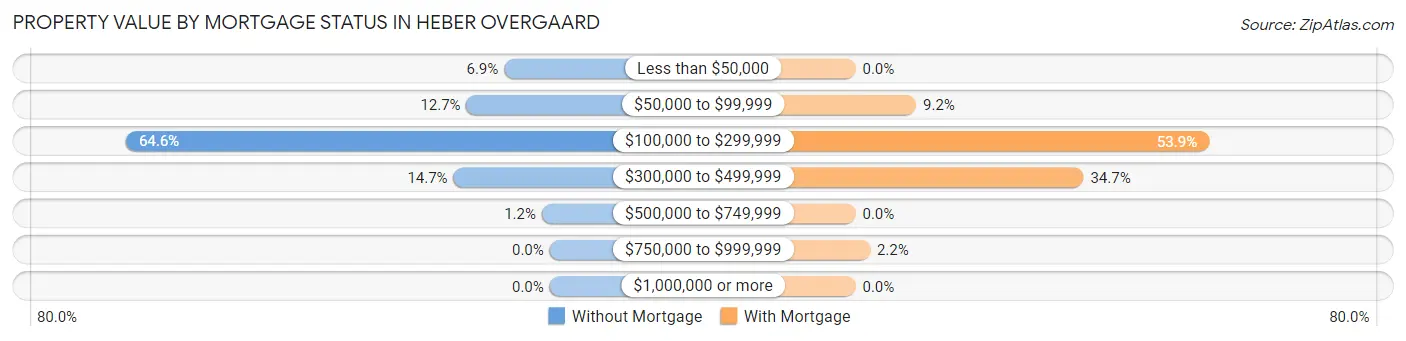
| Property Value | Without Mortgage | With Mortgage |
| Less than $50,000 | 35 (6.9%) | 0 (0.0%) |
| $50,000 to $99,999 | 64 (12.7%) | 42 (9.2%) |
| $100,000 to $299,999 | 326 (64.5%) | 245 (53.8%) |
| $300,000 to $499,999 | 74 (14.6%) | 158 (34.7%) |
| $500,000 to $749,999 | 6 (1.2%) | 0 (0.0%) |
| $750,000 to $999,999 | 0 (0.0%) | 10 (2.2%) |
| $1,000,000 or more | 0 (0.0%) | 0 (0.0%) |
| Total | 505 (100.0%) | 455 (100.0%) |
Household Income by Mortgage Status in Heber Overgaard
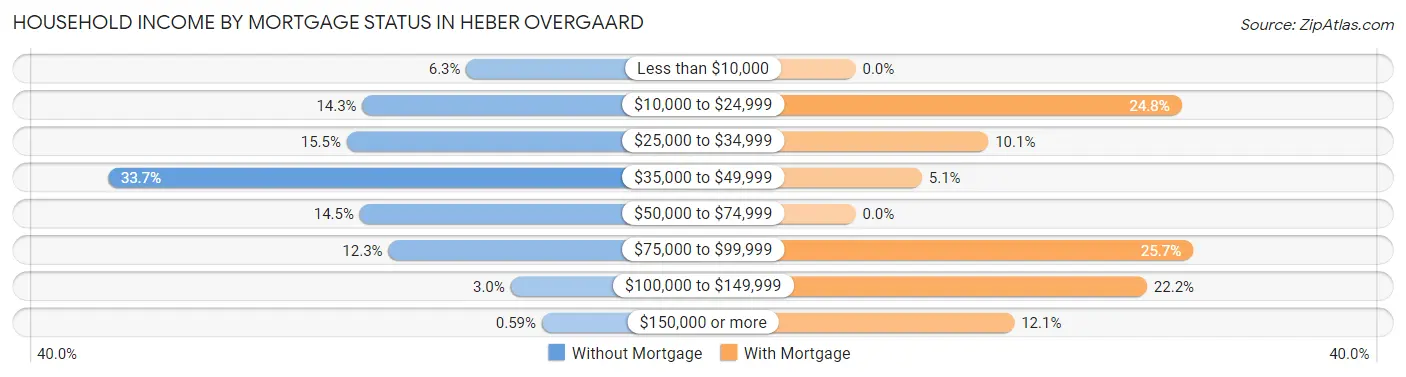
| Household Income | Without Mortgage | With Mortgage |
| Less than $10,000 | 32 (6.3%) | 0 (0.0%) |
| $10,000 to $24,999 | 72 (14.3%) | 113 (24.8%) |
| $25,000 to $34,999 | 78 (15.4%) | 46 (10.1%) |
| $35,000 to $49,999 | 170 (33.7%) | 23 (5.1%) |
| $50,000 to $74,999 | 73 (14.5%) | 0 (0.0%) |
| $75,000 to $99,999 | 62 (12.3%) | 117 (25.7%) |
| $100,000 to $149,999 | 15 (3.0%) | 101 (22.2%) |
| $150,000 or more | 3 (0.6%) | 55 (12.1%) |
| Total | 505 (100.0%) | 455 (100.0%) |
Property Value to Household Income Ratio in Heber Overgaard
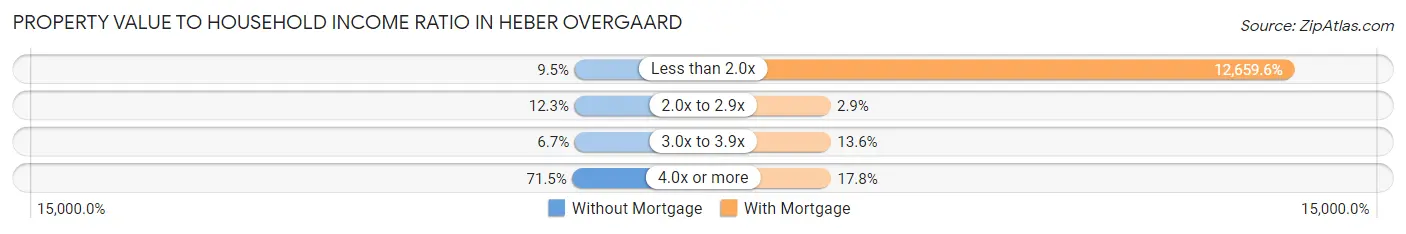
| Value-to-Income Ratio | Without Mortgage | With Mortgage |
| Less than 2.0x | 48 (9.5%) | 57,601 (12,659.6%) |
| 2.0x to 2.9x | 62 (12.3%) | 13 (2.9%) |
| 3.0x to 3.9x | 34 (6.7%) | 62 (13.6%) |
| 4.0x or more | 361 (71.5%) | 81 (17.8%) |
| Total | 505 (100.0%) | 455 (100.0%) |
Real Estate Taxes by Mortgage Status in Heber Overgaard
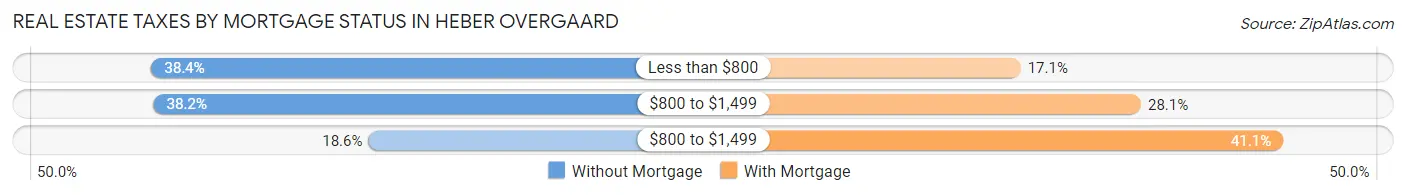
| Property Taxes | Without Mortgage | With Mortgage |
| Less than $800 | 194 (38.4%) | 78 (17.1%) |
| $800 to $1,499 | 193 (38.2%) | 128 (28.1%) |
| $800 to $1,499 | 94 (18.6%) | 187 (41.1%) |
| Total | 505 (100.0%) | 455 (100.0%) |
Health & Disability in Heber Overgaard
Health Insurance Coverage by Age in Heber Overgaard
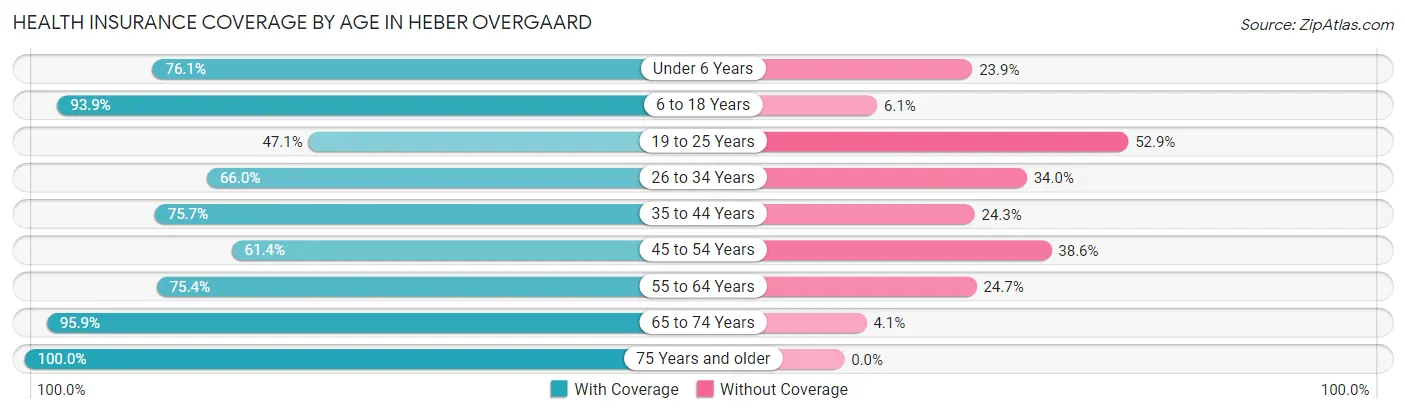
| Age Bracket | With Coverage | Without Coverage |
| Under 6 Years | 67 (76.1%) | 21 (23.9%) |
| 6 to 18 Years | 322 (93.9%) | 21 (6.1%) |
| 19 to 25 Years | 80 (47.1%) | 90 (52.9%) |
| 26 to 34 Years | 159 (66.0%) | 82 (34.0%) |
| 35 to 44 Years | 187 (75.7%) | 60 (24.3%) |
| 45 to 54 Years | 124 (61.4%) | 78 (38.6%) |
| 55 to 64 Years | 272 (75.3%) | 89 (24.6%) |
| 65 to 74 Years | 534 (95.9%) | 23 (4.1%) |
| 75 Years and older | 442 (100.0%) | 0 (0.0%) |
| Total | 2,187 (82.5%) | 464 (17.5%) |
Health Insurance Coverage by Citizenship Status in Heber Overgaard
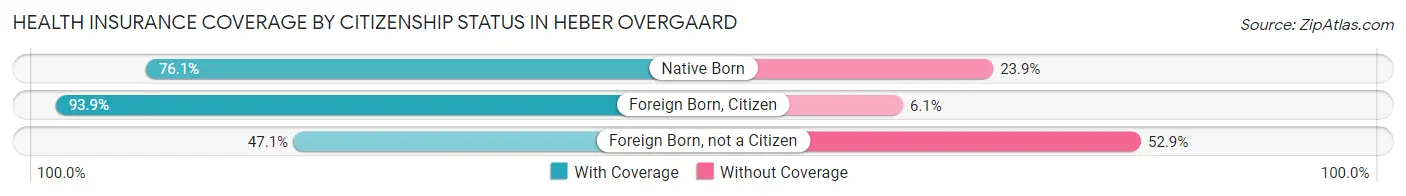
| Citizenship Status | With Coverage | Without Coverage |
| Native Born | 67 (76.1%) | 21 (23.9%) |
| Foreign Born, Citizen | 322 (93.9%) | 21 (6.1%) |
| Foreign Born, not a Citizen | 80 (47.1%) | 90 (52.9%) |
Health Insurance Coverage by Household Income in Heber Overgaard
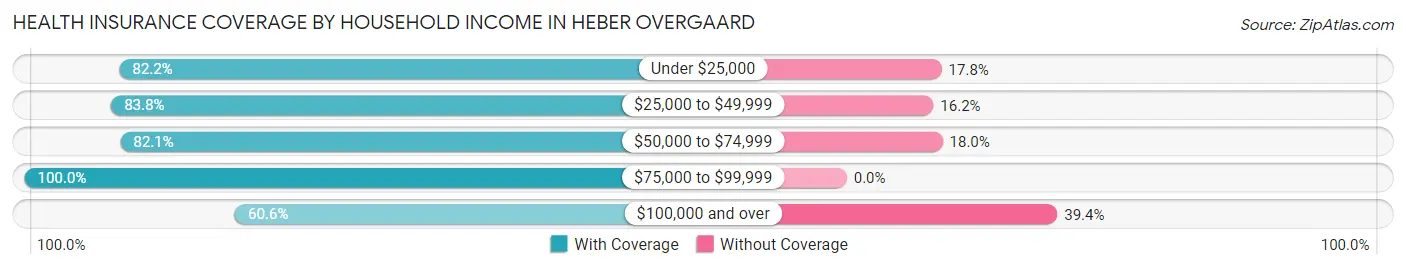
| Household Income | With Coverage | Without Coverage |
| Under $25,000 | 532 (82.2%) | 115 (17.8%) |
| $25,000 to $49,999 | 666 (83.8%) | 129 (16.2%) |
| $50,000 to $74,999 | 489 (82.1%) | 107 (17.9%) |
| $75,000 to $99,999 | 318 (100.0%) | 0 (0.0%) |
| $100,000 and over | 172 (60.6%) | 112 (39.4%) |
Public vs Private Health Insurance Coverage by Age in Heber Overgaard
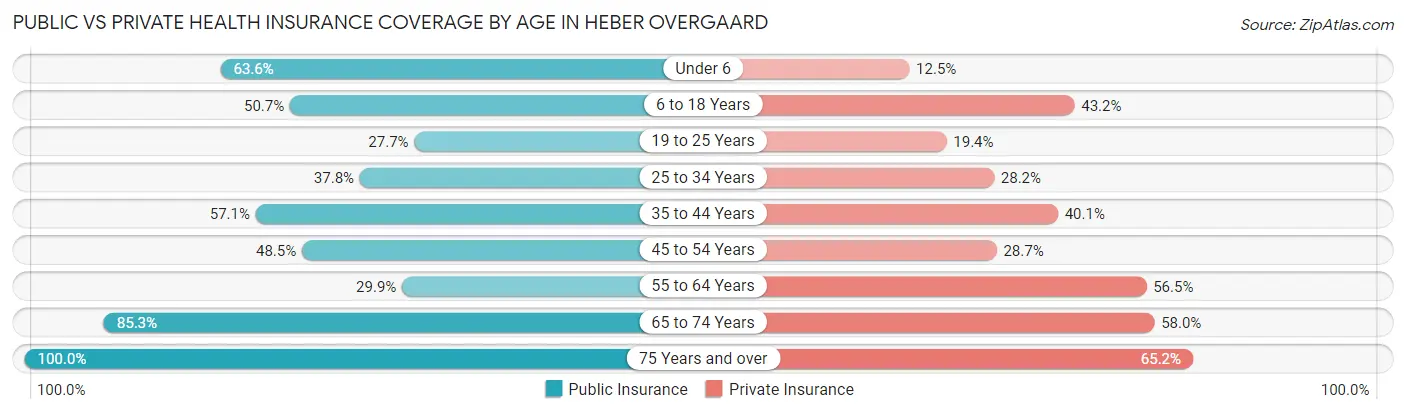
| Age Bracket | Public Insurance | Private Insurance |
| Under 6 | 56 (63.6%) | 11 (12.5%) |
| 6 to 18 Years | 174 (50.7%) | 148 (43.1%) |
| 19 to 25 Years | 47 (27.7%) | 33 (19.4%) |
| 25 to 34 Years | 91 (37.8%) | 68 (28.2%) |
| 35 to 44 Years | 141 (57.1%) | 99 (40.1%) |
| 45 to 54 Years | 98 (48.5%) | 58 (28.7%) |
| 55 to 64 Years | 108 (29.9%) | 204 (56.5%) |
| 65 to 74 Years | 475 (85.3%) | 323 (58.0%) |
| 75 Years and over | 442 (100.0%) | 288 (65.2%) |
| Total | 1,632 (61.6%) | 1,232 (46.5%) |
Disability Status by Sex by Age in Heber Overgaard
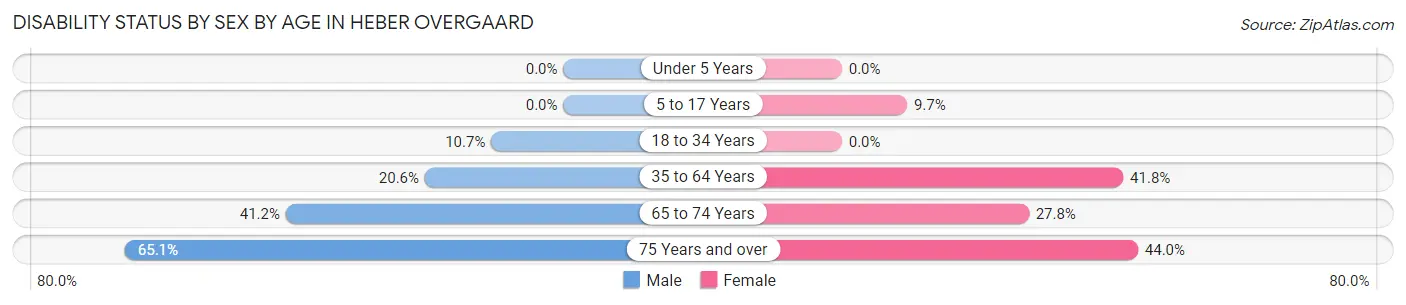
| Age Bracket | Male | Female |
| Under 5 Years | 0 (0.0%) | 0 (0.0%) |
| 5 to 17 Years | 0 (0.0%) | 12 (9.7%) |
| 18 to 34 Years | 33 (10.7%) | 0 (0.0%) |
| 35 to 64 Years | 74 (20.6%) | 188 (41.8%) |
| 65 to 74 Years | 136 (41.2%) | 63 (27.8%) |
| 75 Years and over | 153 (65.1%) | 91 (44.0%) |
Disability Class by Sex by Age in Heber Overgaard
Disability Class: Hearing Difficulty
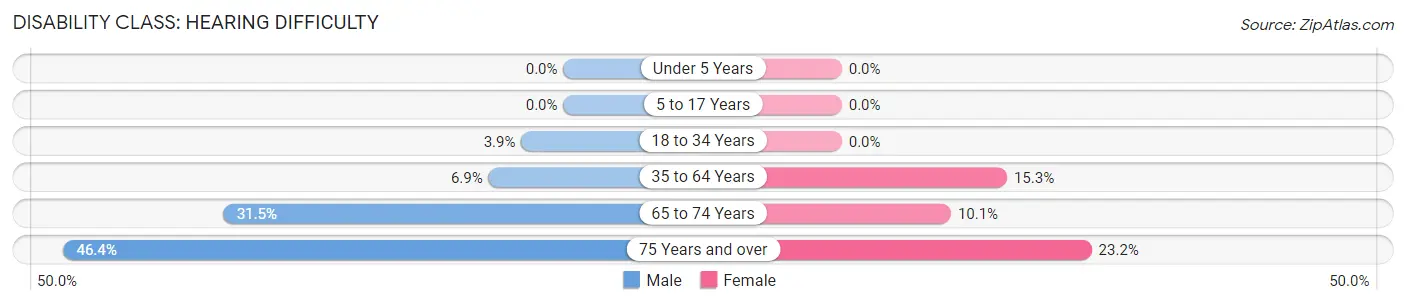
| Age Bracket | Male | Female |
| Under 5 Years | 0 (0.0%) | 0 (0.0%) |
| 5 to 17 Years | 0 (0.0%) | 0 (0.0%) |
| 18 to 34 Years | 12 (3.9%) | 0 (0.0%) |
| 35 to 64 Years | 25 (6.9%) | 69 (15.3%) |
| 65 to 74 Years | 104 (31.5%) | 23 (10.1%) |
| 75 Years and over | 109 (46.4%) | 48 (23.2%) |
Disability Class: Vision Difficulty
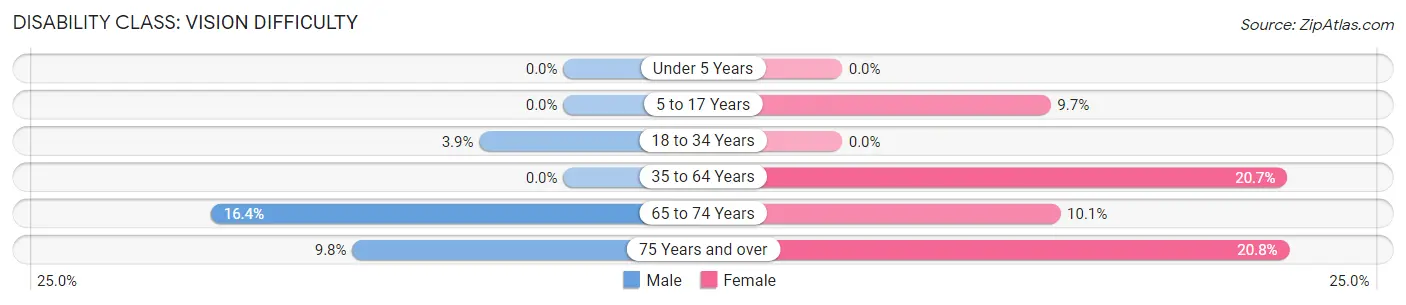
| Age Bracket | Male | Female |
| Under 5 Years | 0 (0.0%) | 0 (0.0%) |
| 5 to 17 Years | 0 (0.0%) | 12 (9.7%) |
| 18 to 34 Years | 12 (3.9%) | 0 (0.0%) |
| 35 to 64 Years | 0 (0.0%) | 93 (20.7%) |
| 65 to 74 Years | 54 (16.4%) | 23 (10.1%) |
| 75 Years and over | 23 (9.8%) | 43 (20.8%) |
Disability Class: Cognitive Difficulty
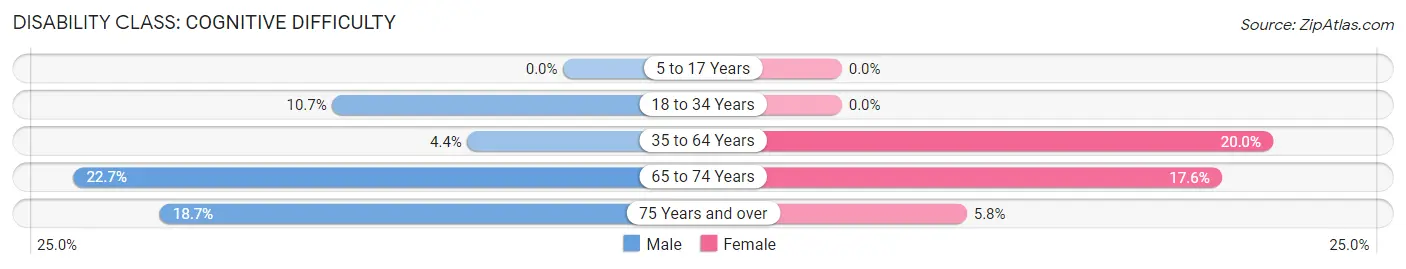
| Age Bracket | Male | Female |
| 5 to 17 Years | 0 (0.0%) | 0 (0.0%) |
| 18 to 34 Years | 33 (10.7%) | 0 (0.0%) |
| 35 to 64 Years | 16 (4.4%) | 90 (20.0%) |
| 65 to 74 Years | 75 (22.7%) | 40 (17.6%) |
| 75 Years and over | 44 (18.7%) | 12 (5.8%) |
Disability Class: Ambulatory Difficulty
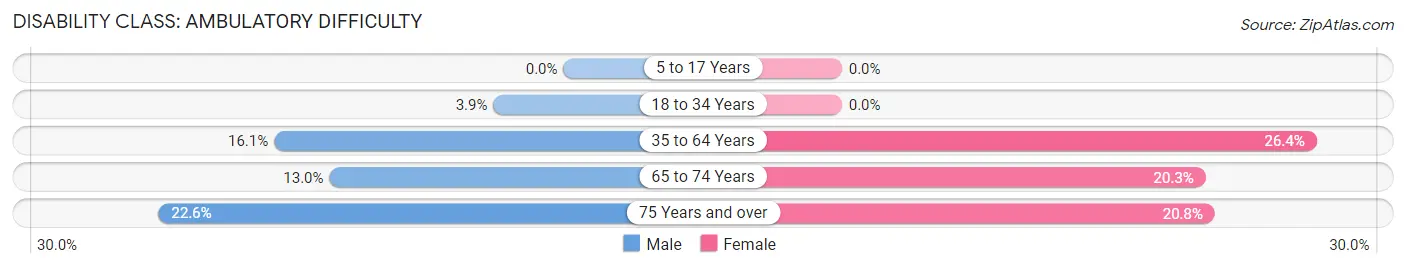
| Age Bracket | Male | Female |
| 5 to 17 Years | 0 (0.0%) | 0 (0.0%) |
| 18 to 34 Years | 12 (3.9%) | 0 (0.0%) |
| 35 to 64 Years | 58 (16.1%) | 119 (26.4%) |
| 65 to 74 Years | 43 (13.0%) | 46 (20.3%) |
| 75 Years and over | 53 (22.6%) | 43 (20.8%) |
Disability Class: Self-Care Difficulty
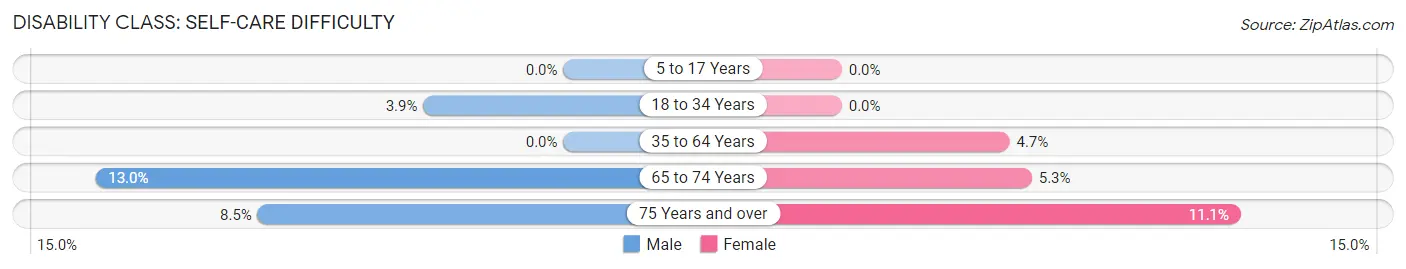
| Age Bracket | Male | Female |
| 5 to 17 Years | 0 (0.0%) | 0 (0.0%) |
| 18 to 34 Years | 12 (3.9%) | 0 (0.0%) |
| 35 to 64 Years | 0 (0.0%) | 21 (4.7%) |
| 65 to 74 Years | 43 (13.0%) | 12 (5.3%) |
| 75 Years and over | 20 (8.5%) | 23 (11.1%) |
Technology Access in Heber Overgaard
Computing Device Access in Heber Overgaard
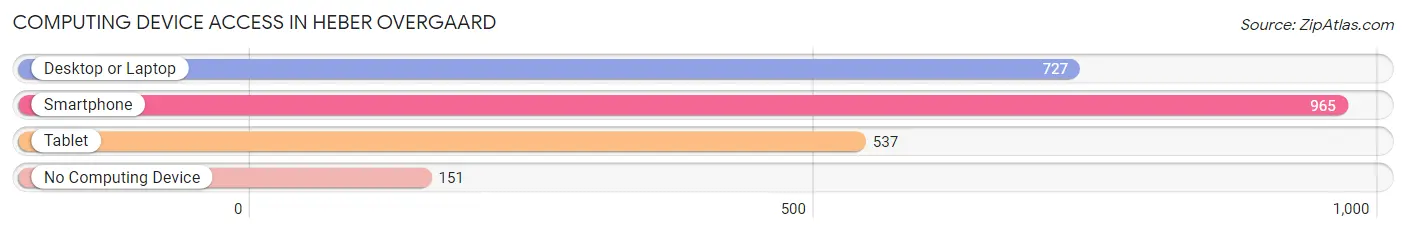
| Device Type | # Households | % Households |
| Desktop or Laptop | 727 | 59.7% |
| Smartphone | 965 | 79.2% |
| Tablet | 537 | 44.1% |
| No Computing Device | 151 | 12.4% |
| Total | 1,218 | 100.0% |
Internet Access in Heber Overgaard
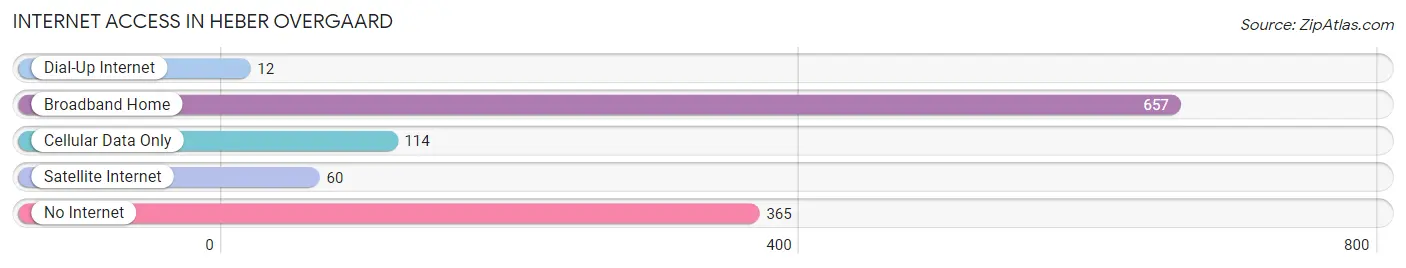
| Internet Type | # Households | % Households |
| Dial-Up Internet | 12 | 1.0% |
| Broadband Home | 657 | 53.9% |
| Cellular Data Only | 114 | 9.4% |
| Satellite Internet | 60 | 4.9% |
| No Internet | 365 | 30.0% |
| Total | 1,218 | 100.0% |
Heber Overgaard Summary
Heber-Overgaard is a census-designated place (CDP) located in Navajo County, Arizona. It is situated in the White Mountains of Arizona, at an elevation of 6,627 feet. The population was 2,822 at the 2010 census.
Geography
Heber-Overgaard is located at 34°20'45" North, 110°41'45" West (34.3458, -110.6958). It is located in the White Mountains of Arizona, at an elevation of 6,627 feet. The area is surrounded by the Apache-Sitgreaves National Forest.
Climate
Heber-Overgaard has a humid continental climate, with cold winters and hot summers. The average annual temperature is 52°F, with an average high of 73°F in July and an average low of 28°F in January. The average annual precipitation is 18.5 inches, with an average of 2.5 inches of snowfall per year.
Demographics
As of the 2010 census, there were 2,822 people, 1,093 households, and 790 families residing in the CDP. The population density was 79.3 people per square mile. The racial makeup of the CDP was 92.2% White, 0.2% African American, 0.9% Native American, 0.2% Asian, 0.1% Pacific Islander, 4.2% from other races, and 2.2% from two or more races. Hispanic or Latino of any race were 8.7% of the population.
Economy
Heber-Overgaard is a rural community with a primarily agricultural economy. The area is home to a variety of small businesses, including restaurants, retail stores, and service providers. The area is also home to a number of tourist attractions, including the Mogollon Rim, the White Mountains, and the Apache-Sitgreaves National Forest.
History
Heber-Overgaard was founded in the early 1900s as a logging camp. The area was named after two of the first settlers, Heber and Overgaard. The area was incorporated as a town in 1948. In the 1950s, the area began to develop as a tourist destination, and the population began to grow. In the 1970s, the area was designated as a census-designated place (CDP).
Today, Heber-Overgaard is a popular tourist destination, with a variety of outdoor activities, including camping, fishing, hunting, and hiking. The area is also home to a number of annual events, including the White Mountain Festival and the Heber-Overgaard Rodeo.
Common Questions
What is the Total Population of Heber Overgaard?
Total Population of Heber Overgaard is 2,651.
What is the Total Male Population of Heber Overgaard?
Total Male Population of Heber Overgaard is 1,451.
What is the Total Female Population of Heber Overgaard?
Total Female Population of Heber Overgaard is 1,200.
What is the Ratio of Males per 100 Females in Heber Overgaard?
There are 120.92 Males per 100 Females in Heber Overgaard.
What is the Ratio of Females per 100 Males in Heber Overgaard?
There are 82.70 Females per 100 Males in Heber Overgaard.
What is the Median Population Age in Heber Overgaard?
Median Population Age in Heber Overgaard is 55.8 Years.
What is the Average Family Size in Heber Overgaard
Average Family Size in Heber Overgaard is 3.1 People.
What is the Average Household Size in Heber Overgaard
Average Household Size in Heber Overgaard is 2.2 People.
What is Per Capita Income in Heber Overgaard?
Per Capita income in Heber Overgaard is $21,211.
What is the Median Family Income in Heber Overgaard?
Median Family Income in Heber Overgaard is $51,250.
What is the Median Household income in Heber Overgaard?
Median Household Income in Heber Overgaard is $39,779.
What is Income or Wage Gap in Heber Overgaard?
Income or Wage Gap in Heber Overgaard is 3.4%.
Women in Heber Overgaard earn 96.6 cents for every dollar earned by a man.
What is Inequality or Gini Index in Heber Overgaard?
Inequality or Gini Index in Heber Overgaard is 0.39.
How Large is the Labor Force in Heber Overgaard?
There are 945 People in the Labor Forcein in Heber Overgaard.
What is the Percentage of People in the Labor Force in Heber Overgaard?
40.5% of People are in the Labor Force in Heber Overgaard.
What is the Unemployment Rate in Heber Overgaard?
Unemployment Rate in Heber Overgaard is 26.7%.