Grand Canyon Village, AZ
Grand Canyon Village Map
Grand Canyon Village Overview
1,914
TOTAL POPULATION
675
MALE POPULATION
1,239
FEMALE POPULATION
54.48
MALES / 100 FEMALES
183.56
FEMALES / 100 MALES
30.9
MEDIAN AGE
4.5
AVG FAMILY SIZE
2.4
AVG HOUSEHOLD SIZE
$34,986
PER CAPITA INCOME
$100,791
AVG FAMILY INCOME
$67,256
AVG HOUSEHOLD INCOME
23.5%
WAGE / INCOME GAP [ % ]
76.5¢/ $1
WAGE / INCOME GAP [ $ ]
0.36
INEQUALITY / GINI INDEX
1,349
LABOR FORCE [ PEOPLE ]
88.1%
PERCENT IN LABOR FORCE
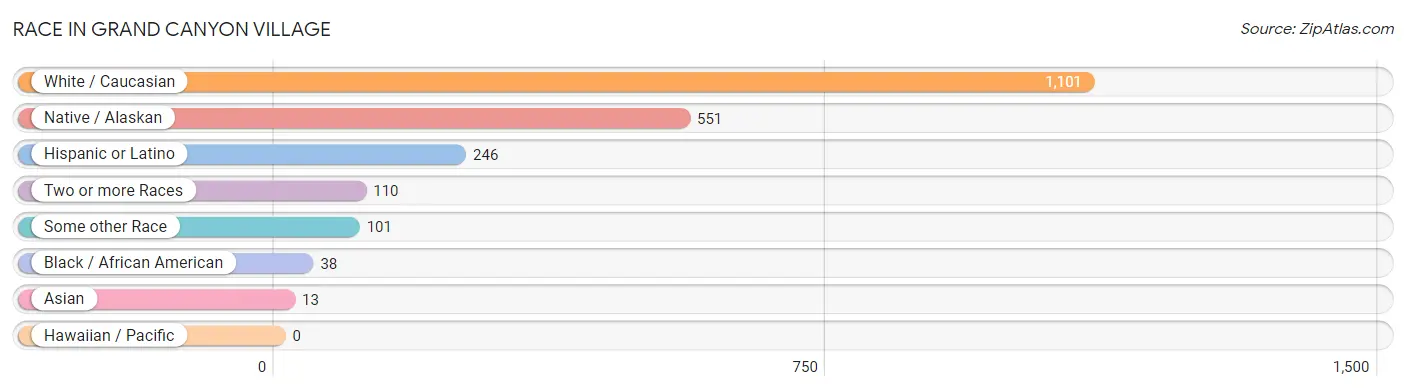
Race in Grand Canyon Village
The most populous races in Grand Canyon Village are White / Caucasian (1,101 | 57.5%), Native / Alaskan (551 | 28.8%), and Hispanic or Latino (246 | 12.9%).
| Race | # Population | % Population |
| Asian | 13 | 0.7% |
| Black / African American | 38 | 2.0% |
| Hawaiian / Pacific | 0 | 0.0% |
| Hispanic or Latino | 246 | 12.9% |
| Native / Alaskan | 551 | 28.8% |
| White / Caucasian | 1,101 | 57.5% |
| Two or more Races | 110 | 5.8% |
| Some other Race | 101 | 5.3% |
| Total | 1,914 | 100.0% |
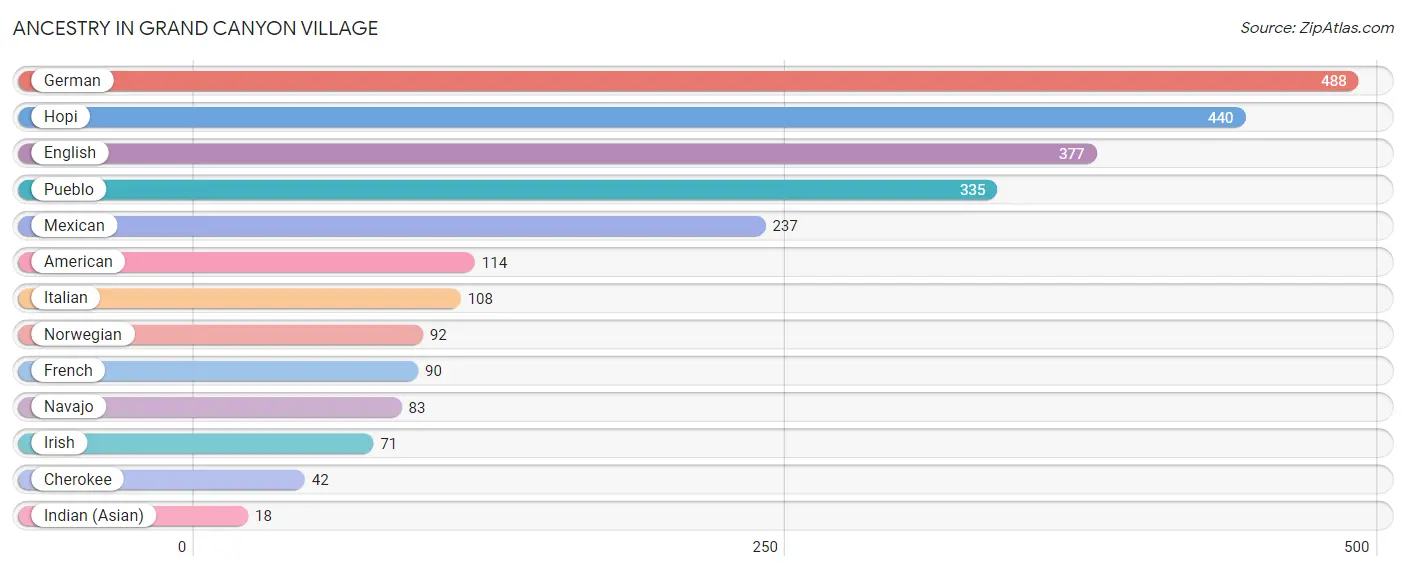
Ancestry in Grand Canyon Village
The most populous ancestries reported in Grand Canyon Village are German (488 | 25.5%), Hopi (440 | 23.0%), English (377 | 19.7%), Pueblo (335 | 17.5%), and Mexican (237 | 12.4%), together accounting for 98.1% of all Grand Canyon Village residents.
| Ancestry | # Population | % Population |
| American | 114 | 6.0% |
| Cherokee | 42 | 2.2% |
| English | 377 | 19.7% |
| French | 90 | 4.7% |
| German | 488 | 25.5% |
| Hopi | 440 | 23.0% |
| Indian (Asian) | 18 | 0.9% |
| Irish | 71 | 3.7% |
| Italian | 108 | 5.6% |
| Mexican | 237 | 12.4% |
| Navajo | 83 | 4.3% |
| Norwegian | 92 | 4.8% |
| Pueblo | 335 | 17.5% | View All 13 Rows |
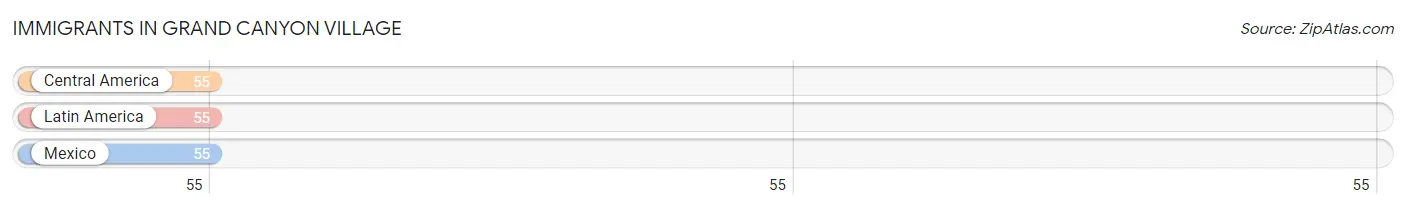
Immigrants in Grand Canyon Village
The most numerous immigrant groups reported in Grand Canyon Village came from Central America (55 | 2.9%), Latin America (55 | 2.9%), and Mexico (55 | 2.9%), together accounting for 8.6% of all Grand Canyon Village residents.
| Immigration Origin | # Population | % Population |
| Central America | 55 | 2.9% |
| Latin America | 55 | 2.9% |
| Mexico | 55 | 2.9% | View All 3 Rows |
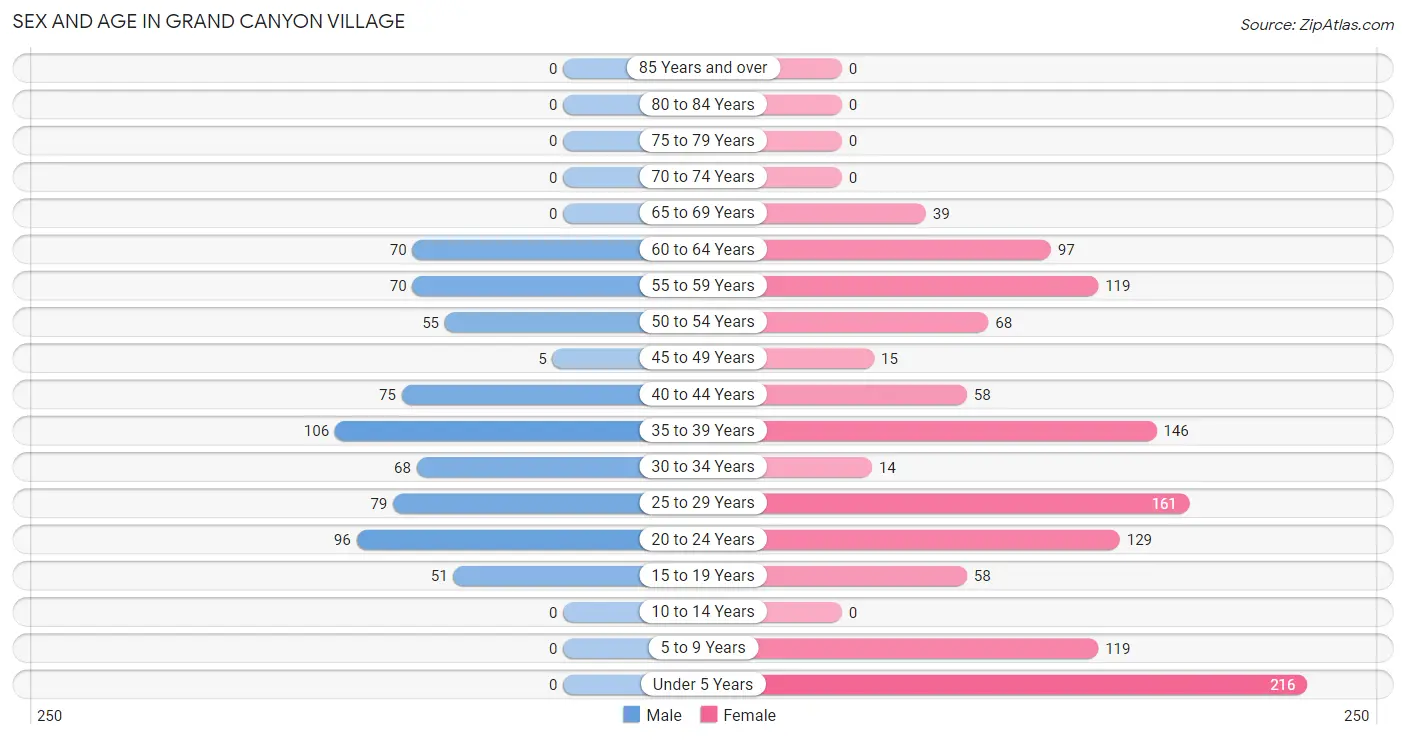
Sex and Age in Grand Canyon Village
Sex and Age in Grand Canyon Village
The most populous age groups in Grand Canyon Village are 35 to 39 Years (106 | 15.7%) for men and Under 5 Years (216 | 17.4%) for women.
| Age Bracket | Male | Female |
| Under 5 Years | 0 (0.0%) | 216 (17.4%) |
| 5 to 9 Years | 0 (0.0%) | 119 (9.6%) |
| 10 to 14 Years | 0 (0.0%) | 0 (0.0%) |
| 15 to 19 Years | 51 (7.6%) | 58 (4.7%) |
| 20 to 24 Years | 96 (14.2%) | 129 (10.4%) |
| 25 to 29 Years | 79 (11.7%) | 161 (13.0%) |
| 30 to 34 Years | 68 (10.1%) | 14 (1.1%) |
| 35 to 39 Years | 106 (15.7%) | 146 (11.8%) |
| 40 to 44 Years | 75 (11.1%) | 58 (4.7%) |
| 45 to 49 Years | 5 (0.7%) | 15 (1.2%) |
| 50 to 54 Years | 55 (8.2%) | 68 (5.5%) |
| 55 to 59 Years | 70 (10.4%) | 119 (9.6%) |
| 60 to 64 Years | 70 (10.4%) | 97 (7.8%) |
| 65 to 69 Years | 0 (0.0%) | 39 (3.2%) |
| 70 to 74 Years | 0 (0.0%) | 0 (0.0%) |
| 75 to 79 Years | 0 (0.0%) | 0 (0.0%) |
| 80 to 84 Years | 0 (0.0%) | 0 (0.0%) |
| 85 Years and over | 0 (0.0%) | 0 (0.0%) |
| Total | 675 (100.0%) | 1,239 (100.0%) |
Families and Households in Grand Canyon Village
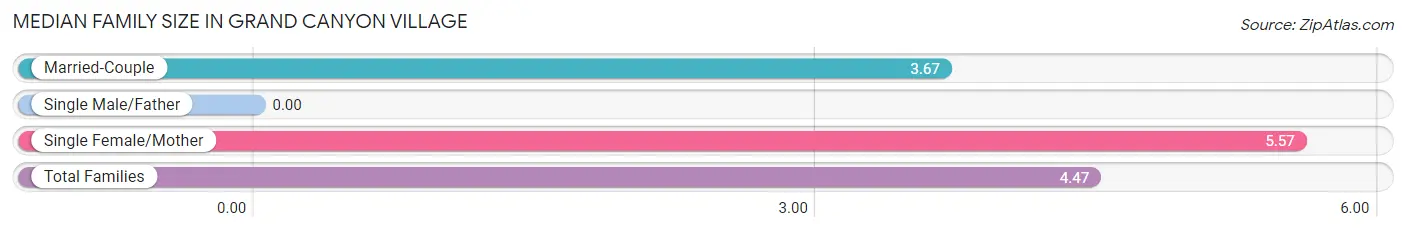
Median Family Size in Grand Canyon Village
| Family Type | # Families | Family Size |
| Married-Couple | 110 (58.2%) | 3.67 |
| Single Male/Father | 0 (0.0%) | - |
| Single Female/Mother | 79 (41.8%) | 5.57 |
| Total Families | 189 (100.0%) | 4.47 |
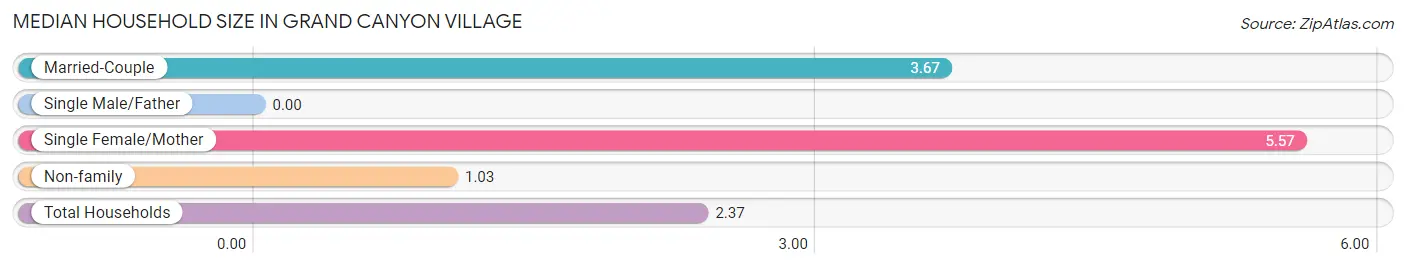
Median Household Size in Grand Canyon Village
| Household Type | # Households | Household Size |
| Married-Couple | 110 (22.6%) | 3.67 |
| Single Male/Father | 0 (0.0%) | - |
| Single Female/Mother | 79 (16.3%) | 5.57 |
| Non-family | 297 (61.1%) | 1.03 |
| Total Households | 486 (100.0%) | 2.37 |
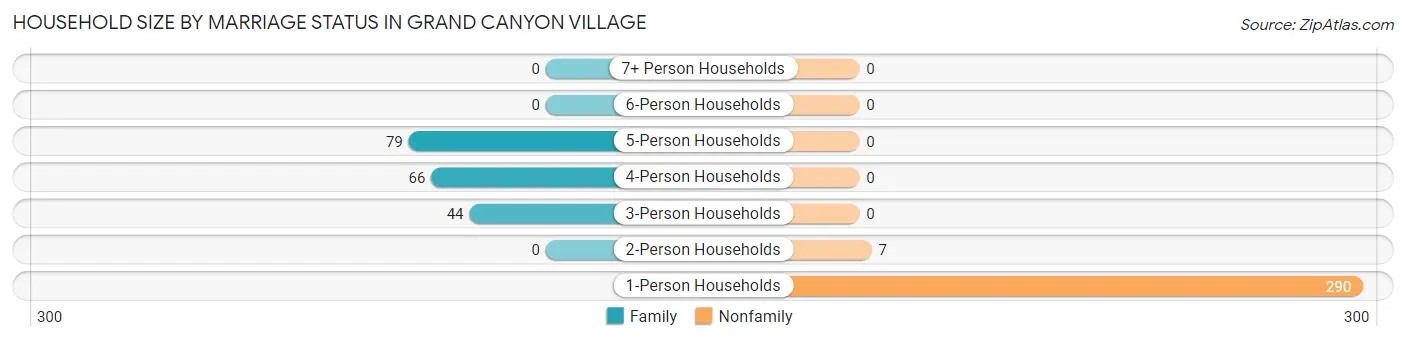
Household Size by Marriage Status in Grand Canyon Village
Out of a total of 486 households in Grand Canyon Village, 189 (38.9%) are family households, while 297 (61.1%) are nonfamily households. The most numerous type of family households are 5-person households, comprising 79, and the most common type of nonfamily households are 1-person households, comprising 290.
| Household Size | Family Households | Nonfamily Households |
| 1-Person Households | - | 290 (59.7%) |
| 2-Person Households | 0 (0.0%) | 7 (1.4%) |
| 3-Person Households | 44 (9.0%) | 0 (0.0%) |
| 4-Person Households | 66 (13.6%) | 0 (0.0%) |
| 5-Person Households | 79 (16.3%) | 0 (0.0%) |
| 6-Person Households | 0 (0.0%) | 0 (0.0%) |
| 7+ Person Households | 0 (0.0%) | 0 (0.0%) |
| Total | 189 (38.9%) | 297 (61.1%) |
Female Fertility in Grand Canyon Village
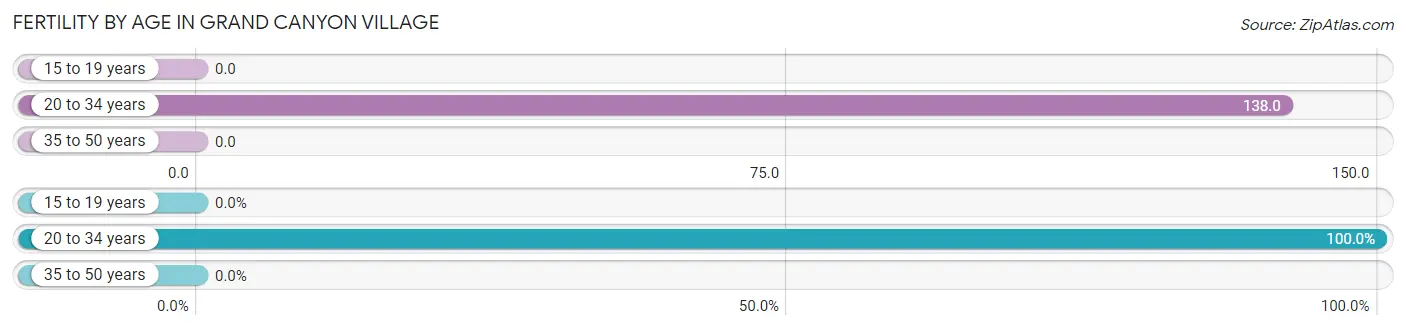
Fertility by Age in Grand Canyon Village
Average fertility rate in Grand Canyon Village is 66.0 births per 1,000 women. Women in the age bracket of 20 to 34 years have the highest fertility rate with 138.0 births per 1,000 women. Women in the age bracket of 20 to 34 years acount for 100.0% of all women with births.
| Age Bracket | Women with Births | Births / 1,000 Women |
| 15 to 19 years | 0 (0.0%) | 0.0 |
| 20 to 34 years | 42 (100.0%) | 138.0 |
| 35 to 50 years | 0 (0.0%) | 0.0 |
| Total | 42 (100.0%) | 66.0 |
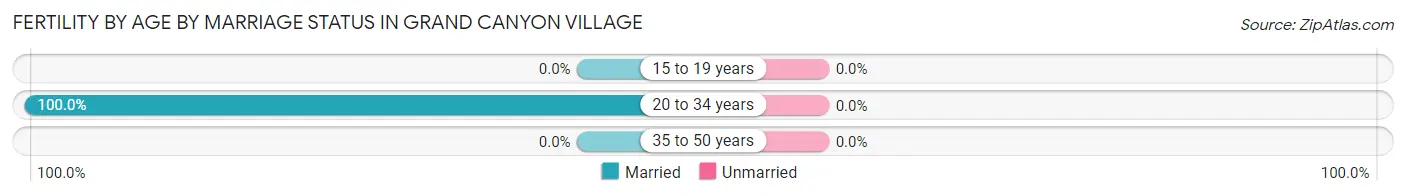
Fertility by Age by Marriage Status in Grand Canyon Village
| Age Bracket | Married | Unmarried |
| 15 to 19 years | 0 (0.0%) | 0 (0.0%) |
| 20 to 34 years | 42 (100.0%) | 0 (0.0%) |
| 35 to 50 years | 0 (0.0%) | 0 (0.0%) |
| Total | 42 (100.0%) | 0 (0.0%) |
Fertility by Education in Grand Canyon Village
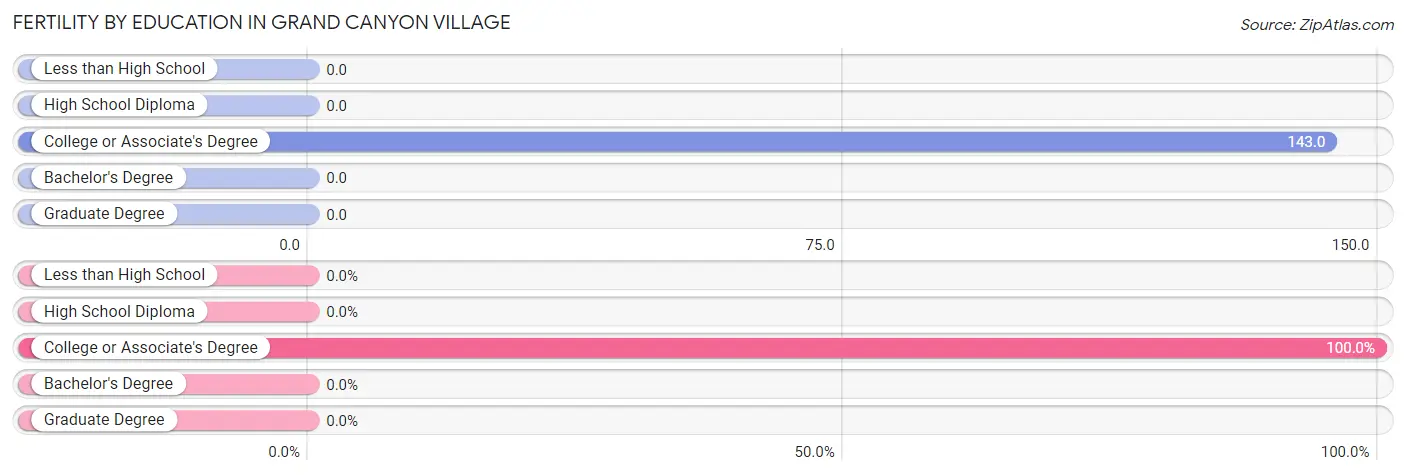
| Educational Attainment | Women with Births | Births / 1,000 Women |
| Less than High School | 0 (0.0%) | 0.0 |
| High School Diploma | 0 (0.0%) | 0.0 |
| College or Associate's Degree | 42 (100.0%) | 143.0 |
| Bachelor's Degree | 0 (0.0%) | 0.0 |
| Graduate Degree | 0 (0.0%) | 0.0 |
| Total | 42 (100.0%) | 66.0 |
Fertility by Education by Marriage Status in Grand Canyon Village
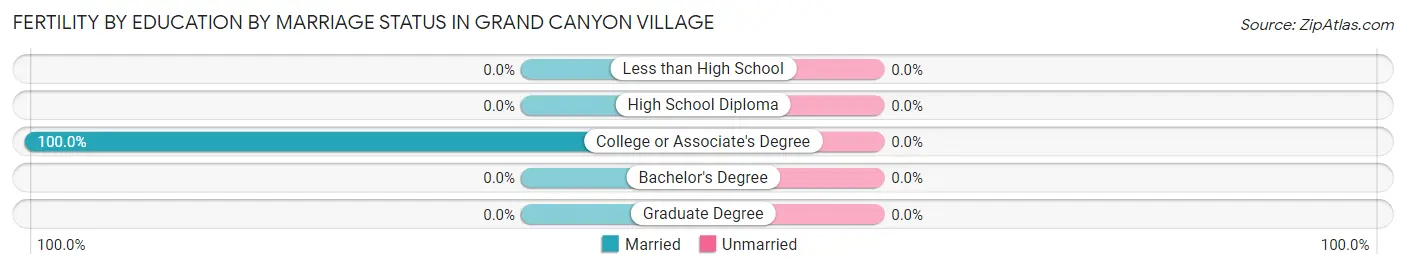
| Educational Attainment | Married | Unmarried |
| Less than High School | 0 (0.0%) | 0 (0.0%) |
| High School Diploma | 0 (0.0%) | 0 (0.0%) |
| College or Associate's Degree | 42 (100.0%) | 0 (0.0%) |
| Bachelor's Degree | 0 (0.0%) | 0 (0.0%) |
| Graduate Degree | 0 (0.0%) | 0 (0.0%) |
| Total | 42 (100.0%) | 0 (0.0%) |
Income in Grand Canyon Village
Income Overview in Grand Canyon Village
Per Capita Income in Grand Canyon Village is $34,986, while median incomes of families and households are $100,791 and $67,256 respectively.
| Characteristic | Number | Measure |
| Per Capita Income | 1,914 | $34,986 |
| Median Family Income | 189 | $100,791 |
| Mean Family Income | 189 | $120,890 |
| Median Household Income | 486 | $67,256 |
| Mean Household Income | 486 | $89,516 |
| Income Deficit | 189 | $0 |
| Wage / Income Gap (%) | 1,914 | 23.47% |
| Wage / Income Gap ($) | 1,914 | 76.53¢ per $1 |
| Gini / Inequality Index | 1,914 | 0.36 |
Earnings by Sex in Grand Canyon Village
Average Earnings in Grand Canyon Village are $33,708, $40,680 for men and $31,134 for women, a difference of 23.5%.
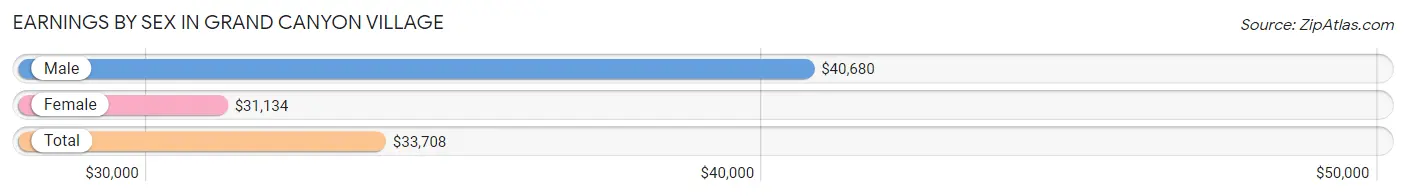
| Sex | Number | Average Earnings |
| Male | 631 (46.2%) | $40,680 |
| Female | 736 (53.8%) | $31,134 |
| Total | 1,367 (100.0%) | $33,708 |
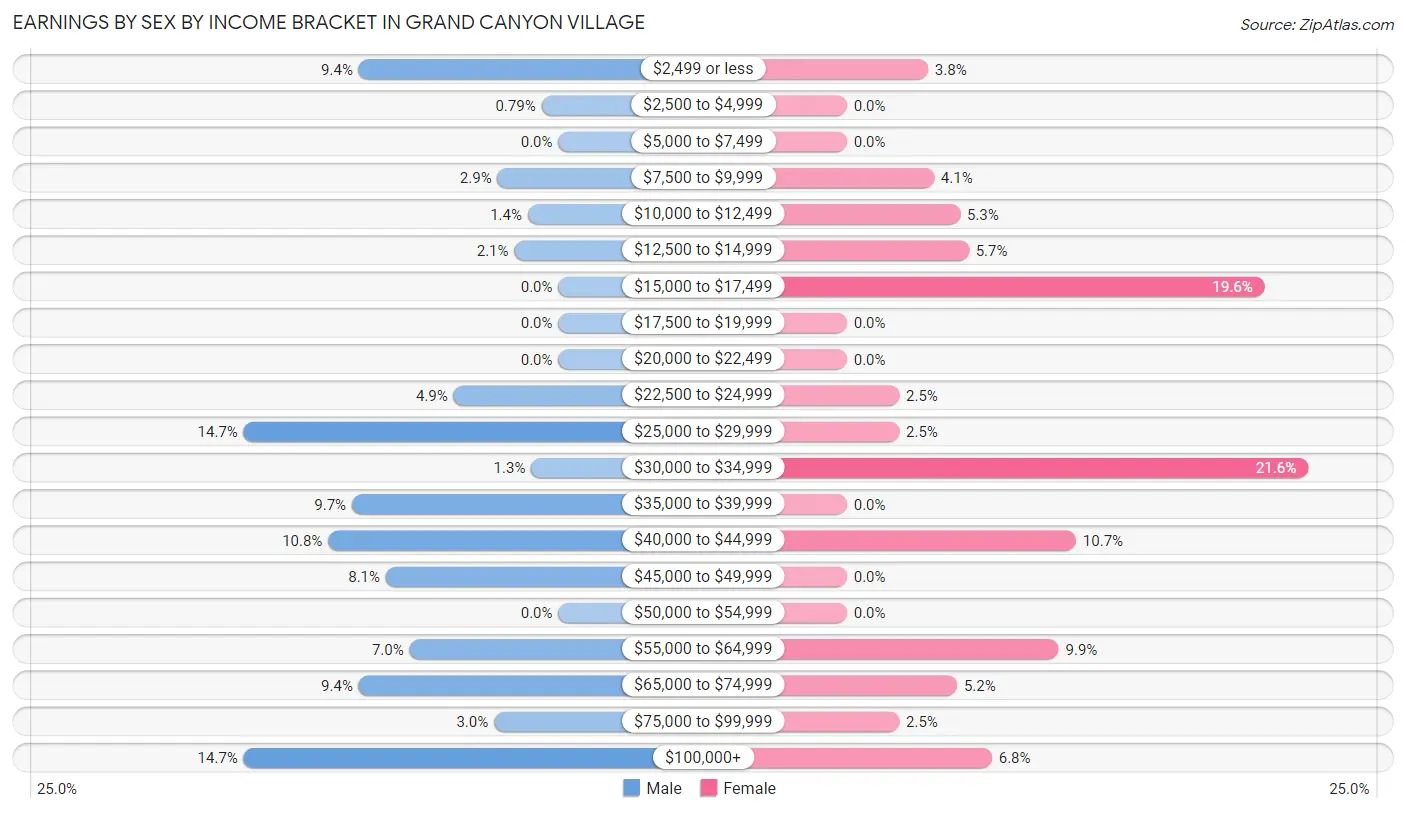
Earnings by Sex by Income Bracket in Grand Canyon Village
The most common earnings brackets in Grand Canyon Village are $25,000 to $29,999 for men (93 | 14.7%) and $30,000 to $34,999 for women (159 | 21.6%).
| Income | Male | Female |
| $2,499 or less | 59 (9.3%) | 28 (3.8%) |
| $2,500 to $4,999 | 5 (0.8%) | 0 (0.0%) |
| $5,000 to $7,499 | 0 (0.0%) | 0 (0.0%) |
| $7,500 to $9,999 | 18 (2.9%) | 30 (4.1%) |
| $10,000 to $12,499 | 9 (1.4%) | 39 (5.3%) |
| $12,500 to $14,999 | 13 (2.1%) | 42 (5.7%) |
| $15,000 to $17,499 | 0 (0.0%) | 144 (19.6%) |
| $17,500 to $19,999 | 0 (0.0%) | 0 (0.0%) |
| $20,000 to $22,499 | 0 (0.0%) | 0 (0.0%) |
| $22,500 to $24,999 | 31 (4.9%) | 18 (2.5%) |
| $25,000 to $29,999 | 93 (14.7%) | 18 (2.5%) |
| $30,000 to $34,999 | 8 (1.3%) | 159 (21.6%) |
| $35,000 to $39,999 | 61 (9.7%) | 0 (0.0%) |
| $40,000 to $44,999 | 68 (10.8%) | 79 (10.7%) |
| $45,000 to $49,999 | 51 (8.1%) | 0 (0.0%) |
| $50,000 to $54,999 | 0 (0.0%) | 0 (0.0%) |
| $55,000 to $64,999 | 44 (7.0%) | 73 (9.9%) |
| $65,000 to $74,999 | 59 (9.3%) | 38 (5.2%) |
| $75,000 to $99,999 | 19 (3.0%) | 18 (2.5%) |
| $100,000+ | 93 (14.7%) | 50 (6.8%) |
| Total | 631 (100.0%) | 736 (100.0%) |
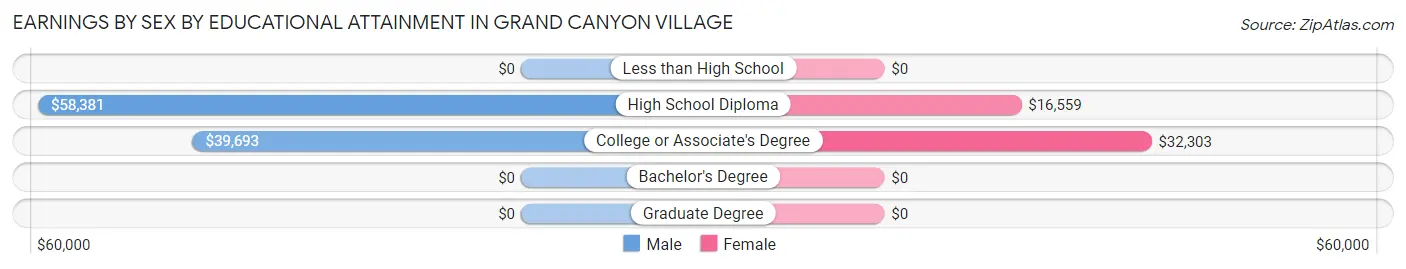
Earnings by Sex by Educational Attainment in Grand Canyon Village
Average earnings in Grand Canyon Village are $40,956 for men and $32,303 for women, a difference of 21.1%. Men with an educational attainment of high school diploma enjoy the highest average annual earnings of $58,381, while those with college or associate's degree education earn the least with $39,693. Women with an educational attainment of college or associate's degree earn the most with the average annual earnings of $32,303, while those with high school diploma education have the smallest earnings of $16,559.
| Educational Attainment | Male Income | Female Income |
| Less than High School | - | - |
| High School Diploma | $58,381 | $16,559 |
| College or Associate's Degree | $39,693 | $32,303 |
| Bachelor's Degree | - | - |
| Graduate Degree | - | - |
| Total | $40,956 | $32,303 |
Family Income in Grand Canyon Village
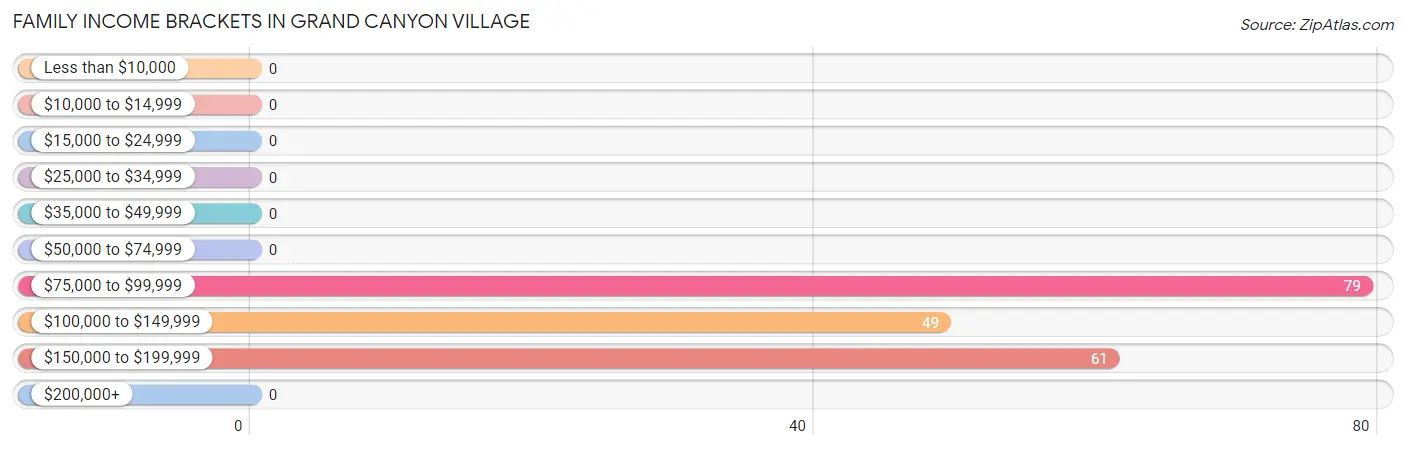
Family Income Brackets in Grand Canyon Village
According to the Grand Canyon Village family income data, there are 79 families falling into the $75,000 to $99,999 income range, which is the most common income bracket and makes up 41.8% of all families.
| Income Bracket | # Families | % Families |
| Less than $10,000 | 0 | 0.0% |
| $10,000 to $14,999 | 0 | 0.0% |
| $15,000 to $24,999 | 0 | 0.0% |
| $25,000 to $34,999 | 0 | 0.0% |
| $35,000 to $49,999 | 0 | 0.0% |
| $50,000 to $74,999 | 0 | 0.0% |
| $75,000 to $99,999 | 79 | 41.8% |
| $100,000 to $149,999 | 49 | 25.9% |
| $150,000 to $199,999 | 61 | 32.3% |
| $200,000+ | 0 | 0.0% |
Family Income by Famaliy Size in Grand Canyon Village
| Income Bracket | # Families | Median Income |
| 2-Person Families | 0 (0.0%) | $0 |
| 3-Person Families | 44 (23.3%) | $0 |
| 4-Person Families | 66 (34.9%) | $0 |
| 5-Person Families | 79 (41.8%) | $0 |
| 6-Person Families | 0 (0.0%) | $0 |
| 7+ Person Families | 0 (0.0%) | $0 |
| Total | 189 (100.0%) | $100,791 |
Family Income by Number of Earners in Grand Canyon Village
| Number of Earners | # Families | Median Income |
| No Earners | 0 (0.0%) | $0 |
| 1 Earner | 49 (25.9%) | $0 |
| 2 Earners | 61 (32.3%) | $0 |
| 3+ Earners | 79 (41.8%) | $0 |
| Total | 189 (100.0%) | $100,791 |
Household Income in Grand Canyon Village
Household Income Brackets in Grand Canyon Village
With 149 households falling in the category, the $25,000 to $34,999 income range is the most frequent in Grand Canyon Village, accounting for 30.7% of all households.
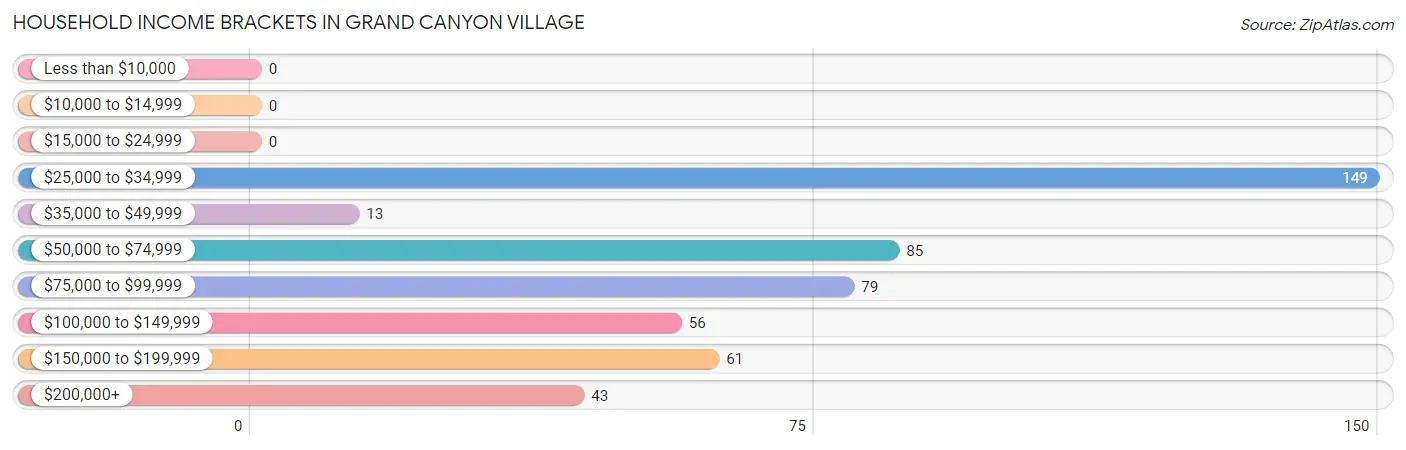
| Income Bracket | # Households | % Households |
| Less than $10,000 | 0 | 0.0% |
| $10,000 to $14,999 | 0 | 0.0% |
| $15,000 to $24,999 | 0 | 0.0% |
| $25,000 to $34,999 | 149 | 30.7% |
| $35,000 to $49,999 | 13 | 2.7% |
| $50,000 to $74,999 | 85 | 17.5% |
| $75,000 to $99,999 | 79 | 16.3% |
| $100,000 to $149,999 | 56 | 11.5% |
| $150,000 to $199,999 | 61 | 12.6% |
| $200,000+ | 43 | 8.8% |
Household Income by Householder Age in Grand Canyon Village
The median household income in Grand Canyon Village is $67,256, with the highest median household income of $93,766 found in the 45 to 64 years age bracket for the primary householder. A total of 276 households (56.8%) fall into this category.
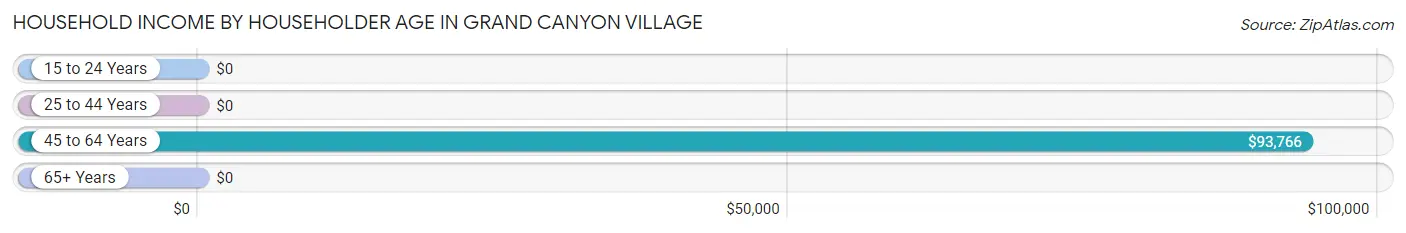
| Income Bracket | # Households | Median Income |
| 15 to 24 Years | 0 (0.0%) | $0 |
| 25 to 44 Years | 210 (43.2%) | $0 |
| 45 to 64 Years | 276 (56.8%) | $93,766 |
| 65+ Years | 0 (0.0%) | $0 |
| Total | 486 (100.0%) | $67,256 |
Poverty in Grand Canyon Village
Income Below Poverty by Sex and Age in Grand Canyon Village
With 21.9% poverty level for males and 9.4% for females among the residents of Grand Canyon Village, 16 and 17 year old males and 18 to 24 year old females are the most vulnerable to poverty, with 30 males (100.0%) and 39 females (39.0%) in their respective age groups living below the poverty level.
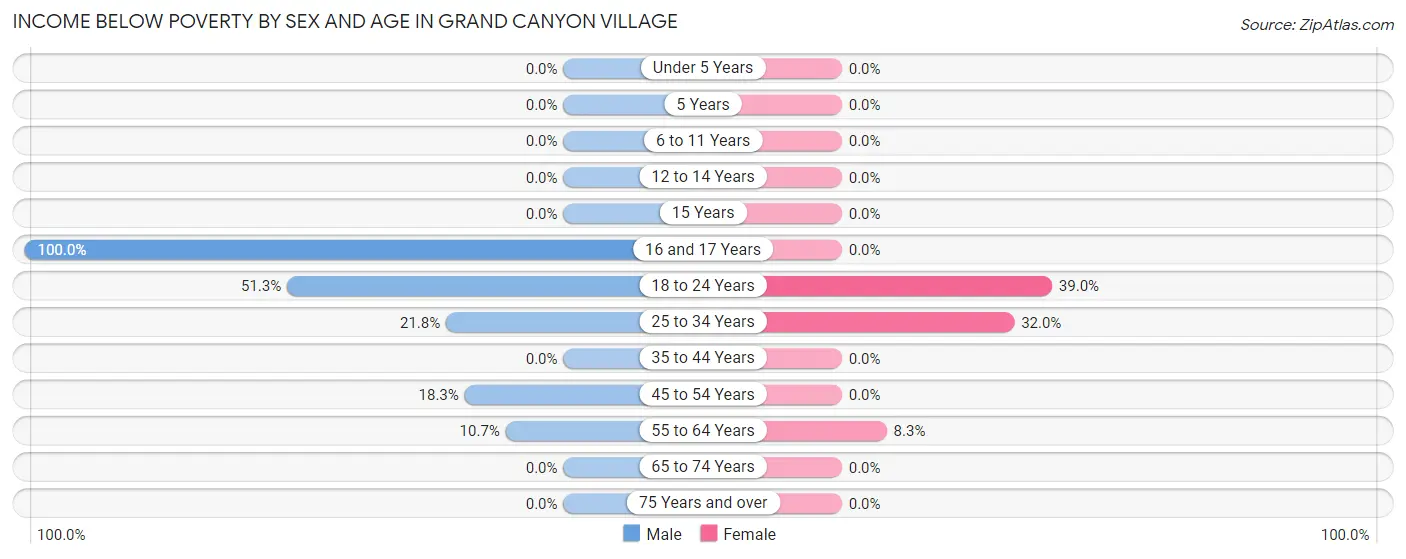
| Age Bracket | Male | Female |
| Under 5 Years | 0 (0.0%) | 0 (0.0%) |
| 5 Years | 0 (0.0%) | 0 (0.0%) |
| 6 to 11 Years | 0 (0.0%) | 0 (0.0%) |
| 12 to 14 Years | 0 (0.0%) | 0 (0.0%) |
| 15 Years | 0 (0.0%) | 0 (0.0%) |
| 16 and 17 Years | 30 (100.0%) | 0 (0.0%) |
| 18 to 24 Years | 60 (51.3%) | 39 (39.0%) |
| 25 to 34 Years | 32 (21.8%) | 56 (32.0%) |
| 35 to 44 Years | 0 (0.0%) | 0 (0.0%) |
| 45 to 54 Years | 11 (18.3%) | 0 (0.0%) |
| 55 to 64 Years | 15 (10.7%) | 18 (8.3%) |
| 65 to 74 Years | 0 (0.0%) | 0 (0.0%) |
| 75 Years and over | 0 (0.0%) | 0 (0.0%) |
| Total | 148 (21.9%) | 113 (9.4%) |
Income Above Poverty by Sex and Age in Grand Canyon Village
According to the poverty statistics in Grand Canyon Village, males aged 35 to 44 years and females aged under 5 years are the age groups that are most secure financially, with 100.0% of males and 100.0% of females in these age groups living above the poverty line.
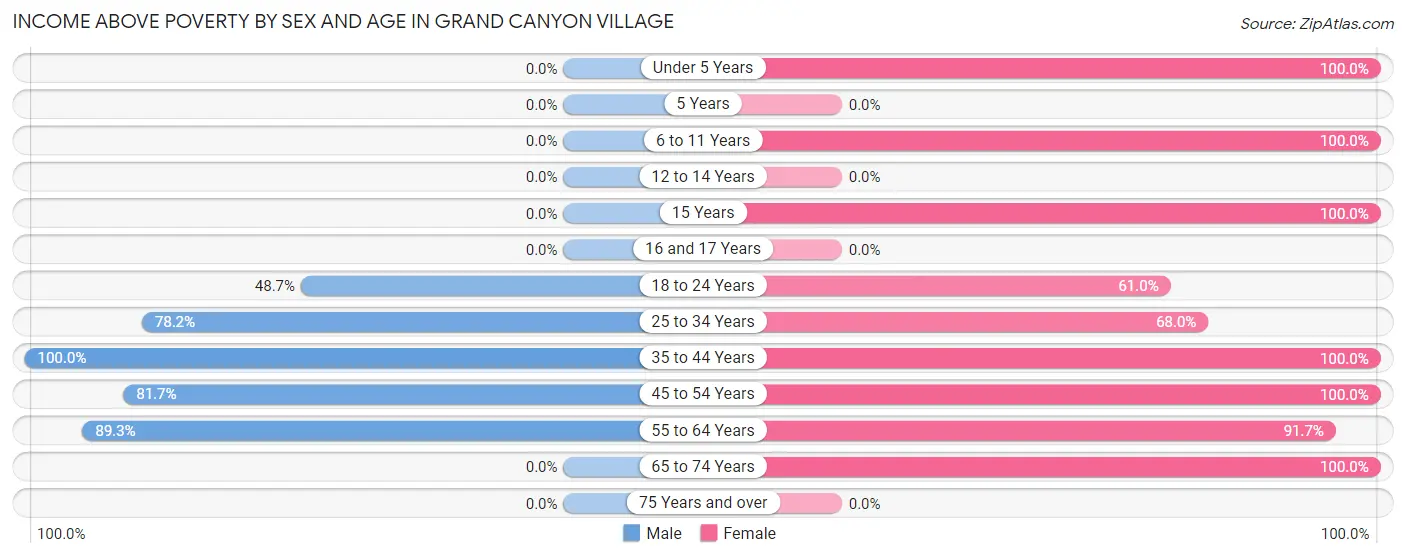
| Age Bracket | Male | Female |
| Under 5 Years | 0 (0.0%) | 216 (100.0%) |
| 5 Years | 0 (0.0%) | 0 (0.0%) |
| 6 to 11 Years | 0 (0.0%) | 119 (100.0%) |
| 12 to 14 Years | 0 (0.0%) | 0 (0.0%) |
| 15 Years | 0 (0.0%) | 48 (100.0%) |
| 16 and 17 Years | 0 (0.0%) | 0 (0.0%) |
| 18 to 24 Years | 57 (48.7%) | 61 (61.0%) |
| 25 to 34 Years | 115 (78.2%) | 119 (68.0%) |
| 35 to 44 Years | 181 (100.0%) | 204 (100.0%) |
| 45 to 54 Years | 49 (81.7%) | 83 (100.0%) |
| 55 to 64 Years | 125 (89.3%) | 198 (91.7%) |
| 65 to 74 Years | 0 (0.0%) | 39 (100.0%) |
| 75 Years and over | 0 (0.0%) | 0 (0.0%) |
| Total | 527 (78.1%) | 1,087 (90.6%) |
Income Below Poverty Among Married-Couple Families in Grand Canyon Village
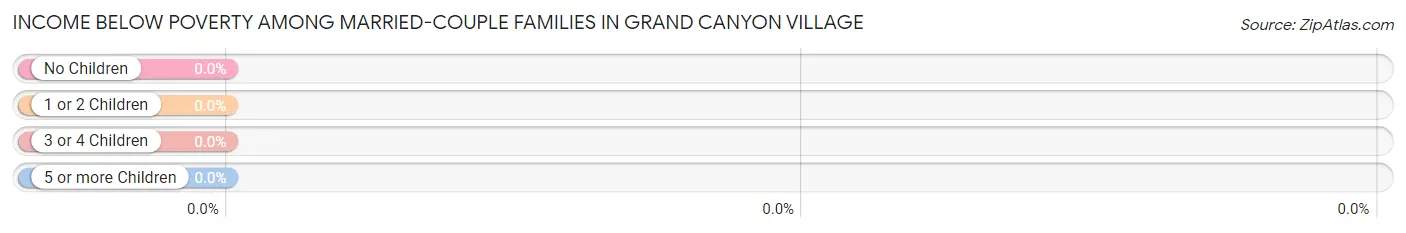
| Children | Above Poverty | Below Poverty |
| No Children | 0 (0.0%) | 0 (0.0%) |
| 1 or 2 Children | 110 (100.0%) | 0 (0.0%) |
| 3 or 4 Children | 0 (0.0%) | 0 (0.0%) |
| 5 or more Children | 0 (0.0%) | 0 (0.0%) |
| Total | 110 (100.0%) | 0 (0.0%) |
Income Below Poverty Among Single-Parent Households in Grand Canyon Village
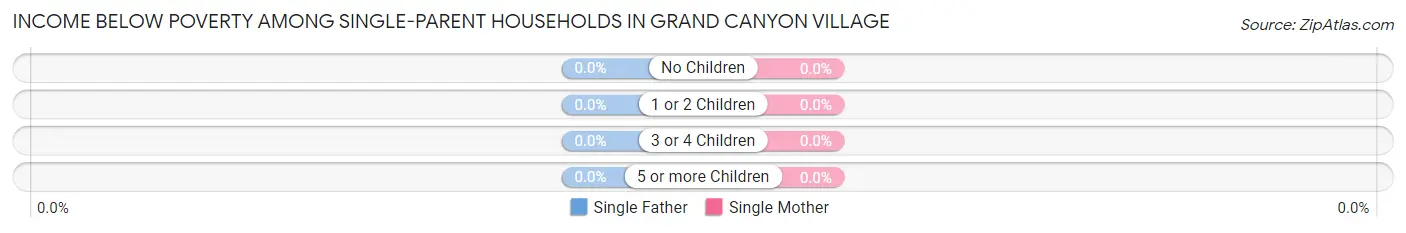
| Children | Single Father | Single Mother |
| No Children | 0 (0.0%) | 0 (0.0%) |
| 1 or 2 Children | 0 (0.0%) | 0 (0.0%) |
| 3 or 4 Children | 0 (0.0%) | 0 (0.0%) |
| 5 or more Children | 0 (0.0%) | 0 (0.0%) |
| Total | 0 (0.0%) | 0 (0.0%) |
Income Below Poverty Among Married-Couple vs Single-Parent Households in Grand Canyon Village
| Children | Married-Couple Families | Single-Parent Households |
| No Children | 0 (0.0%) | 0 (0.0%) |
| 1 or 2 Children | 0 (0.0%) | 0 (0.0%) |
| 3 or 4 Children | 0 (0.0%) | 0 (0.0%) |
| 5 or more Children | 0 (0.0%) | 0 (0.0%) |
| Total | 0 (0.0%) | 0 (0.0%) |
Employment Characteristics in Grand Canyon Village
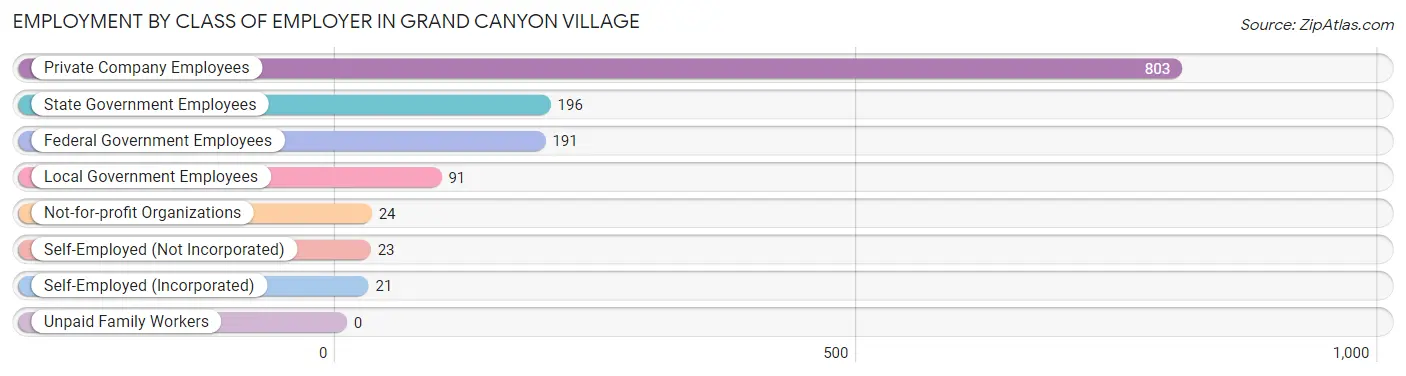
Employment by Class of Employer in Grand Canyon Village
Among the 1,349 employed individuals in Grand Canyon Village, private company employees (803 | 59.5%), state government employees (196 | 14.5%), and federal government employees (191 | 14.2%) make up the most common classes of employment.
| Employer Class | # Employees | % Employees |
| Private Company Employees | 803 | 59.5% |
| Self-Employed (Incorporated) | 21 | 1.6% |
| Self-Employed (Not Incorporated) | 23 | 1.7% |
| Not-for-profit Organizations | 24 | 1.8% |
| Local Government Employees | 91 | 6.8% |
| State Government Employees | 196 | 14.5% |
| Federal Government Employees | 191 | 14.2% |
| Unpaid Family Workers | 0 | 0.0% |
| Total | 1,349 | 100.0% |
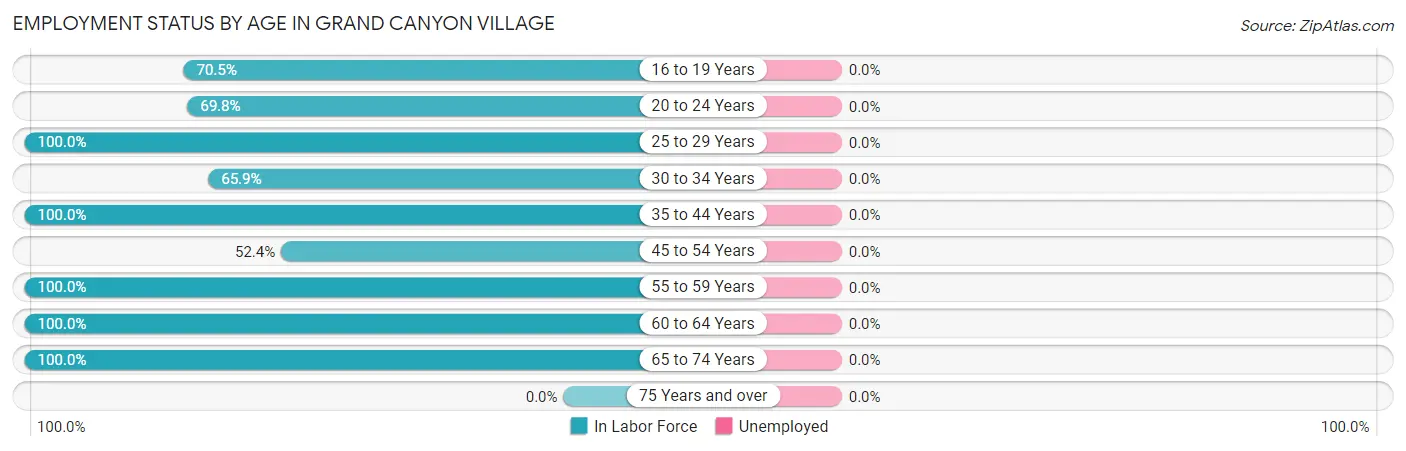
Employment Status by Age in Grand Canyon Village
| Age Bracket | In Labor Force | Unemployed |
| 16 to 19 Years | 43 (70.5%) | 0 (0.0%) |
| 20 to 24 Years | 157 (69.8%) | 0 (0.0%) |
| 25 to 29 Years | 240 (100.0%) | 0 (0.0%) |
| 30 to 34 Years | 54 (65.9%) | 0 (0.0%) |
| 35 to 44 Years | 385 (100.0%) | 0 (0.0%) |
| 45 to 54 Years | 75 (52.4%) | 0 (0.0%) |
| 55 to 59 Years | 189 (100.0%) | 0 (0.0%) |
| 60 to 64 Years | 167 (100.0%) | 0 (0.0%) |
| 65 to 74 Years | 39 (100.0%) | 0 (0.0%) |
| 75 Years and over | 0 (0.0%) | 0 (0.0%) |
| Total | 1,349 (88.1%) | 0 (0.0%) |
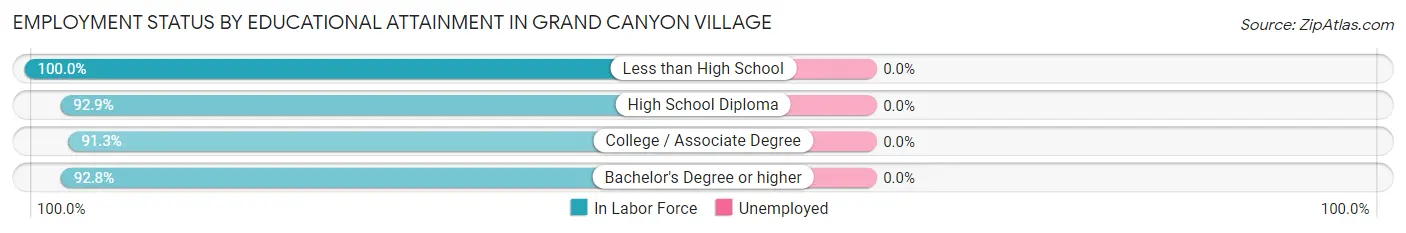
Employment Status by Educational Attainment in Grand Canyon Village
| Educational Attainment | In Labor Force | Unemployed |
| Less than High School | 31 (100.0%) | 0 (0.0%) |
| High School Diploma | 183 (92.9%) | 0 (0.0%) |
| College / Associate Degree | 678 (91.3%) | 0 (0.0%) |
| Bachelor's Degree or higher | 218 (92.8%) | 0 (0.0%) |
| Total | 1,110 (92.0%) | 0 (0.0%) |
Employment Occupations by Sex in Grand Canyon Village
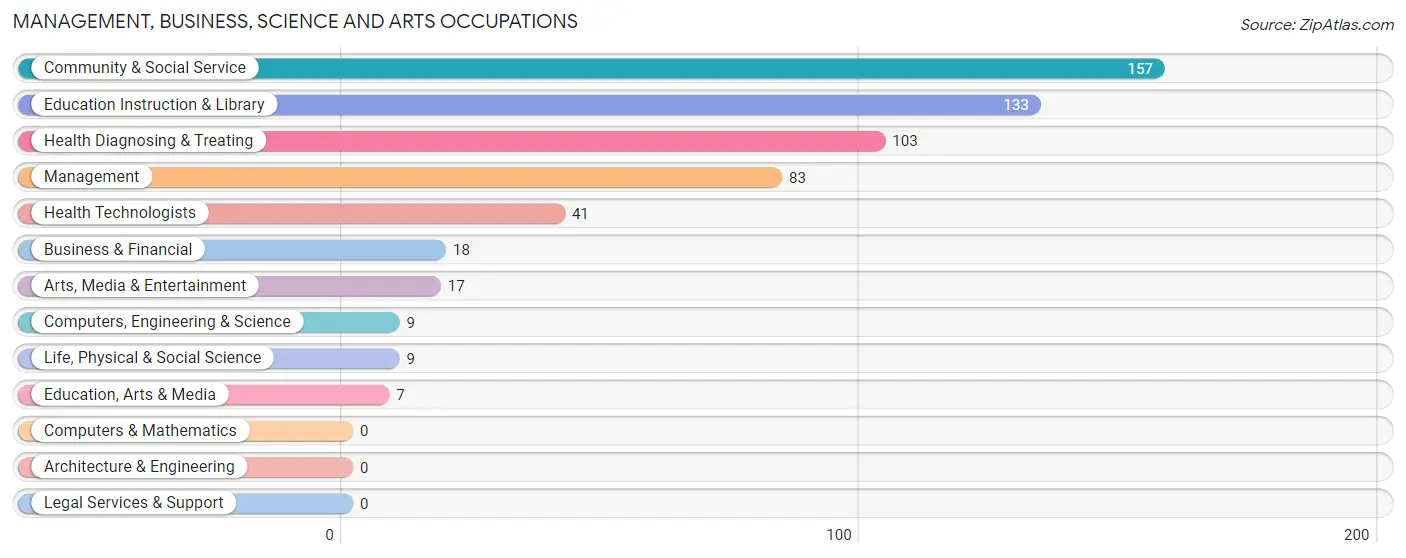
Management, Business, Science and Arts Occupations
The most common Management, Business, Science and Arts occupations in Grand Canyon Village are Community & Social Service (157 | 11.6%), Education Instruction & Library (133 | 9.9%), Health Diagnosing & Treating (103 | 7.6%), Management (83 | 6.1%), and Health Technologists (41 | 3.0%).
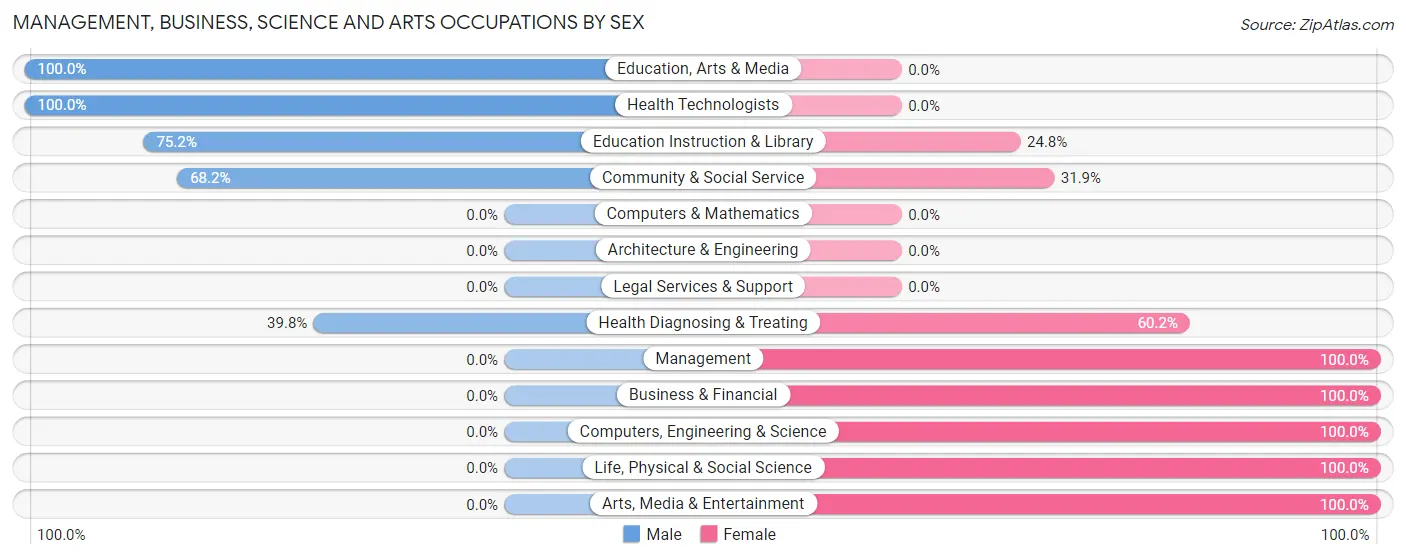
Management, Business, Science and Arts Occupations by Sex
Within the Management, Business, Science and Arts occupations in Grand Canyon Village, the most male-oriented occupations are Education, Arts & Media (100.0%), Health Technologists (100.0%), and Education Instruction & Library (75.2%), while the most female-oriented occupations are Management (100.0%), Business & Financial (100.0%), and Computers, Engineering & Science (100.0%).
| Occupation | Male | Female |
| Management | 0 (0.0%) | 83 (100.0%) |
| Business & Financial | 0 (0.0%) | 18 (100.0%) |
| Computers, Engineering & Science | 0 (0.0%) | 9 (100.0%) |
| Computers & Mathematics | 0 (0.0%) | 0 (0.0%) |
| Architecture & Engineering | 0 (0.0%) | 0 (0.0%) |
| Life, Physical & Social Science | 0 (0.0%) | 9 (100.0%) |
| Community & Social Service | 107 (68.1%) | 50 (31.9%) |
| Education, Arts & Media | 7 (100.0%) | 0 (0.0%) |
| Legal Services & Support | 0 (0.0%) | 0 (0.0%) |
| Education Instruction & Library | 100 (75.2%) | 33 (24.8%) |
| Arts, Media & Entertainment | 0 (0.0%) | 17 (100.0%) |
| Health Diagnosing & Treating | 41 (39.8%) | 62 (60.2%) |
| Health Technologists | 41 (100.0%) | 0 (0.0%) |
| Total (Category) | 148 (40.0%) | 222 (60.0%) |
| Total (Overall) | 623 (46.2%) | 726 (53.8%) |
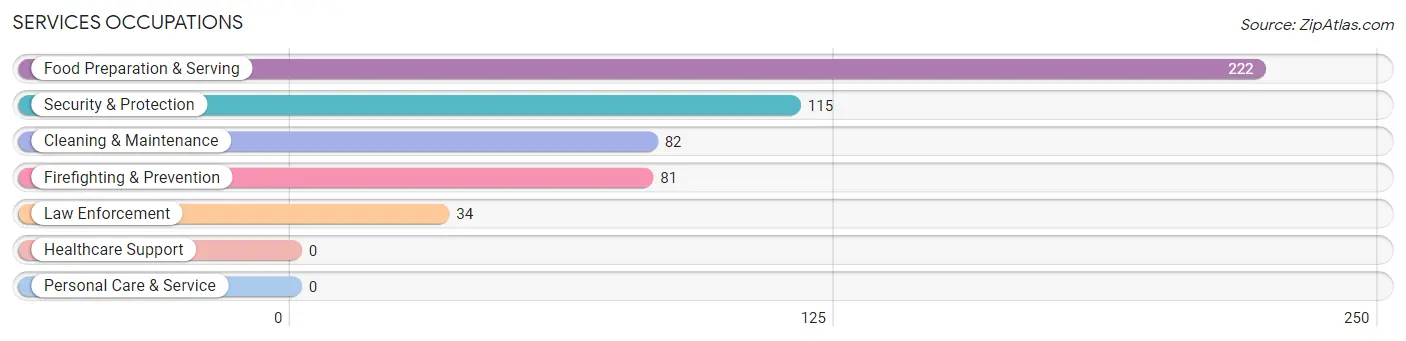
Services Occupations
The most common Services occupations in Grand Canyon Village are Food Preparation & Serving (222 | 16.5%), Security & Protection (115 | 8.5%), Cleaning & Maintenance (82 | 6.1%), Firefighting & Prevention (81 | 6.0%), and Law Enforcement (34 | 2.5%).
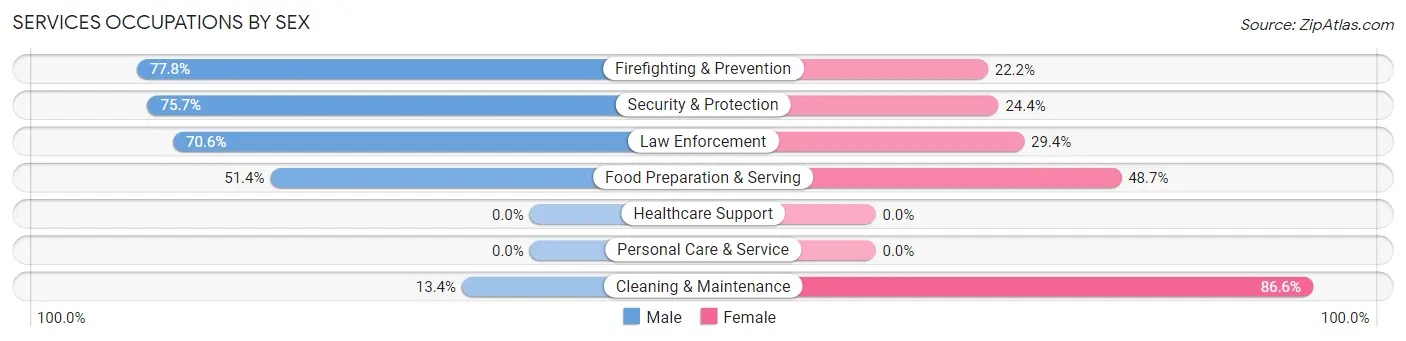
Services Occupations by Sex
Within the Services occupations in Grand Canyon Village, the most male-oriented occupations are Firefighting & Prevention (77.8%), Security & Protection (75.6%), and Law Enforcement (70.6%), while the most female-oriented occupations are Cleaning & Maintenance (86.6%), Food Preparation & Serving (48.6%), and Law Enforcement (29.4%).
| Occupation | Male | Female |
| Healthcare Support | 0 (0.0%) | 0 (0.0%) |
| Security & Protection | 87 (75.6%) | 28 (24.3%) |
| Firefighting & Prevention | 63 (77.8%) | 18 (22.2%) |
| Law Enforcement | 24 (70.6%) | 10 (29.4%) |
| Food Preparation & Serving | 114 (51.3%) | 108 (48.6%) |
| Cleaning & Maintenance | 11 (13.4%) | 71 (86.6%) |
| Personal Care & Service | 0 (0.0%) | 0 (0.0%) |
| Total (Category) | 212 (50.6%) | 207 (49.4%) |
| Total (Overall) | 623 (46.2%) | 726 (53.8%) |
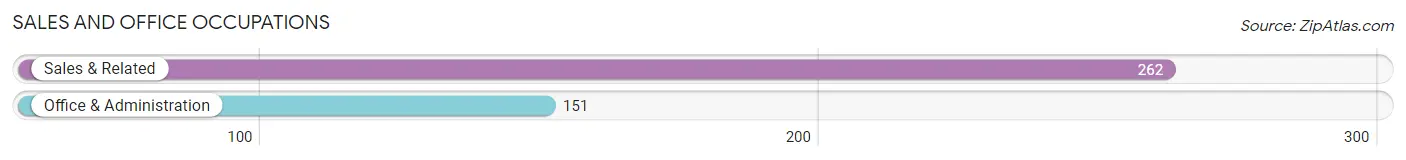
Sales and Office Occupations
The most common Sales and Office occupations in Grand Canyon Village are Sales & Related (262 | 19.4%), and Office & Administration (151 | 11.2%).
Sales and Office Occupations by Sex
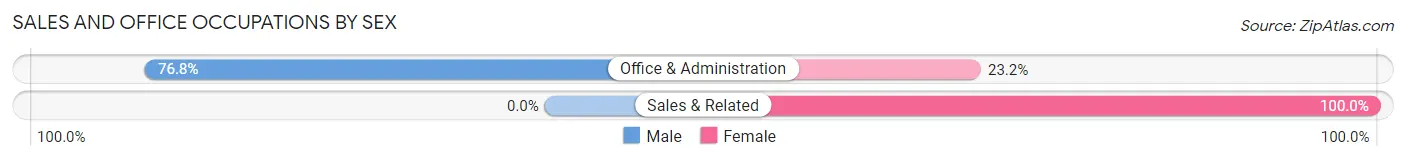
| Occupation | Male | Female |
| Sales & Related | 0 (0.0%) | 262 (100.0%) |
| Office & Administration | 116 (76.8%) | 35 (23.2%) |
| Total (Category) | 116 (28.1%) | 297 (71.9%) |
| Total (Overall) | 623 (46.2%) | 726 (53.8%) |
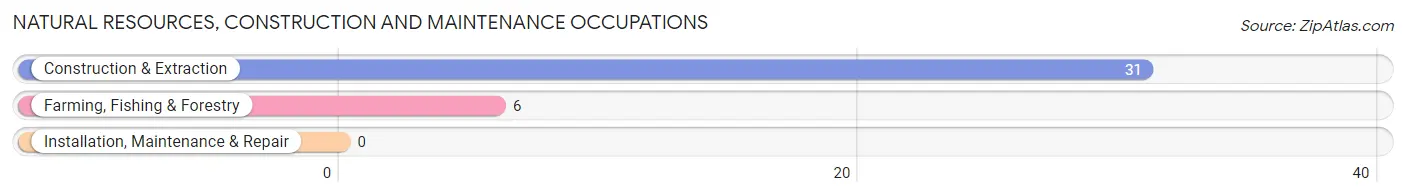
Natural Resources, Construction and Maintenance Occupations
The most common Natural Resources, Construction and Maintenance occupations in Grand Canyon Village are Construction & Extraction (31 | 2.3%), and Farming, Fishing & Forestry (6 | 0.4%).
Natural Resources, Construction and Maintenance Occupations by Sex
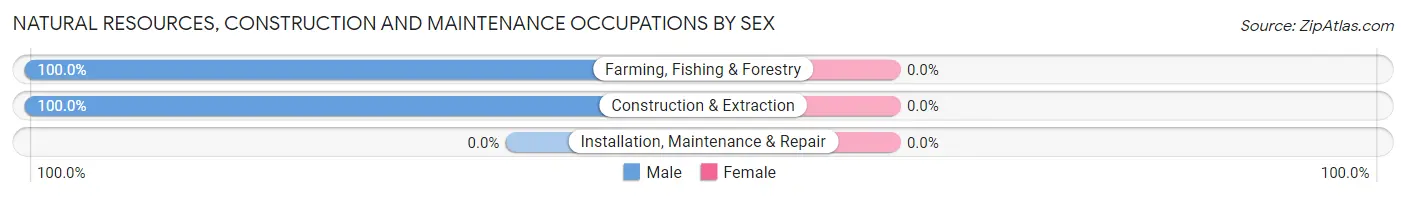
| Occupation | Male | Female |
| Farming, Fishing & Forestry | 6 (100.0%) | 0 (0.0%) |
| Construction & Extraction | 31 (100.0%) | 0 (0.0%) |
| Installation, Maintenance & Repair | 0 (0.0%) | 0 (0.0%) |
| Total (Category) | 37 (100.0%) | 0 (0.0%) |
| Total (Overall) | 623 (46.2%) | 726 (53.8%) |
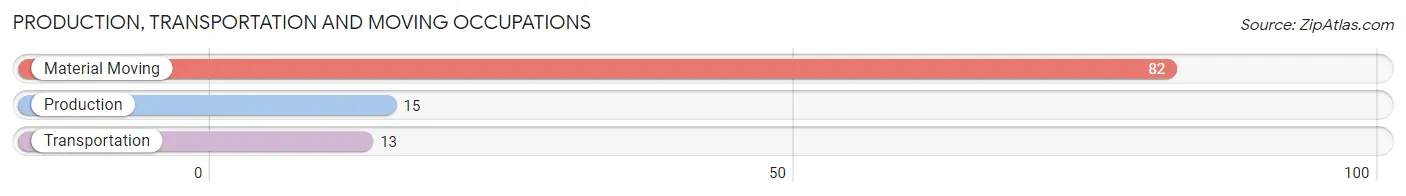
Production, Transportation and Moving Occupations
The most common Production, Transportation and Moving occupations in Grand Canyon Village are Material Moving (82 | 6.1%), Production (15 | 1.1%), and Transportation (13 | 1.0%).
Production, Transportation and Moving Occupations by Sex
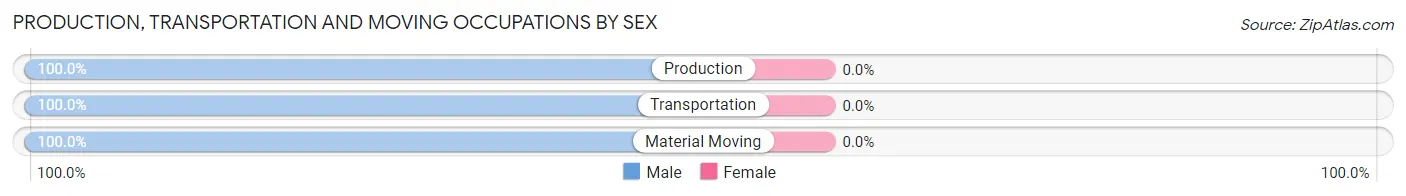
| Occupation | Male | Female |
| Production | 15 (100.0%) | 0 (0.0%) |
| Transportation | 13 (100.0%) | 0 (0.0%) |
| Material Moving | 82 (100.0%) | 0 (0.0%) |
| Total (Category) | 110 (100.0%) | 0 (0.0%) |
| Total (Overall) | 623 (46.2%) | 726 (53.8%) |
Employment Industries by Sex in Grand Canyon Village
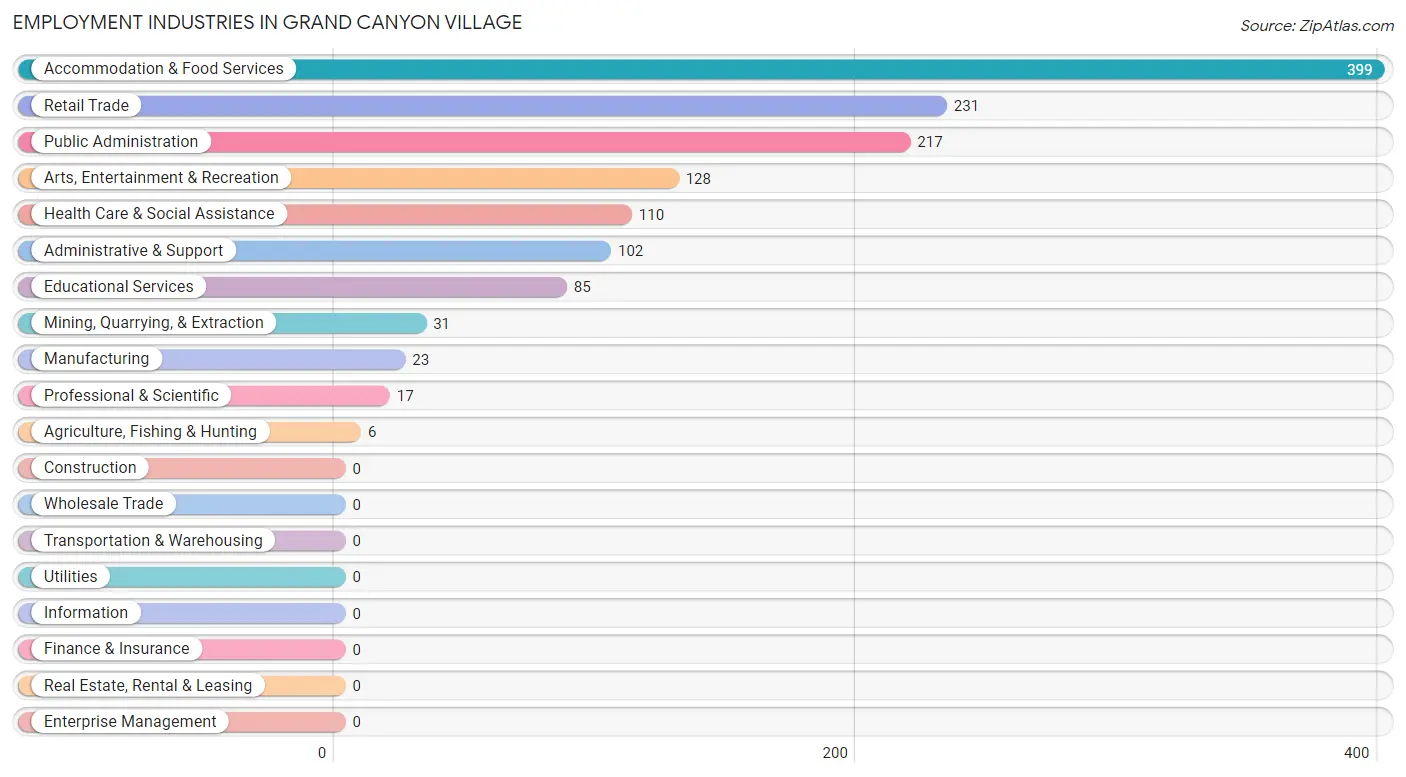
Employment Industries in Grand Canyon Village
The major employment industries in Grand Canyon Village include Accommodation & Food Services (399 | 29.6%), Retail Trade (231 | 17.1%), Public Administration (217 | 16.1%), Arts, Entertainment & Recreation (128 | 9.5%), and Health Care & Social Assistance (110 | 8.2%).
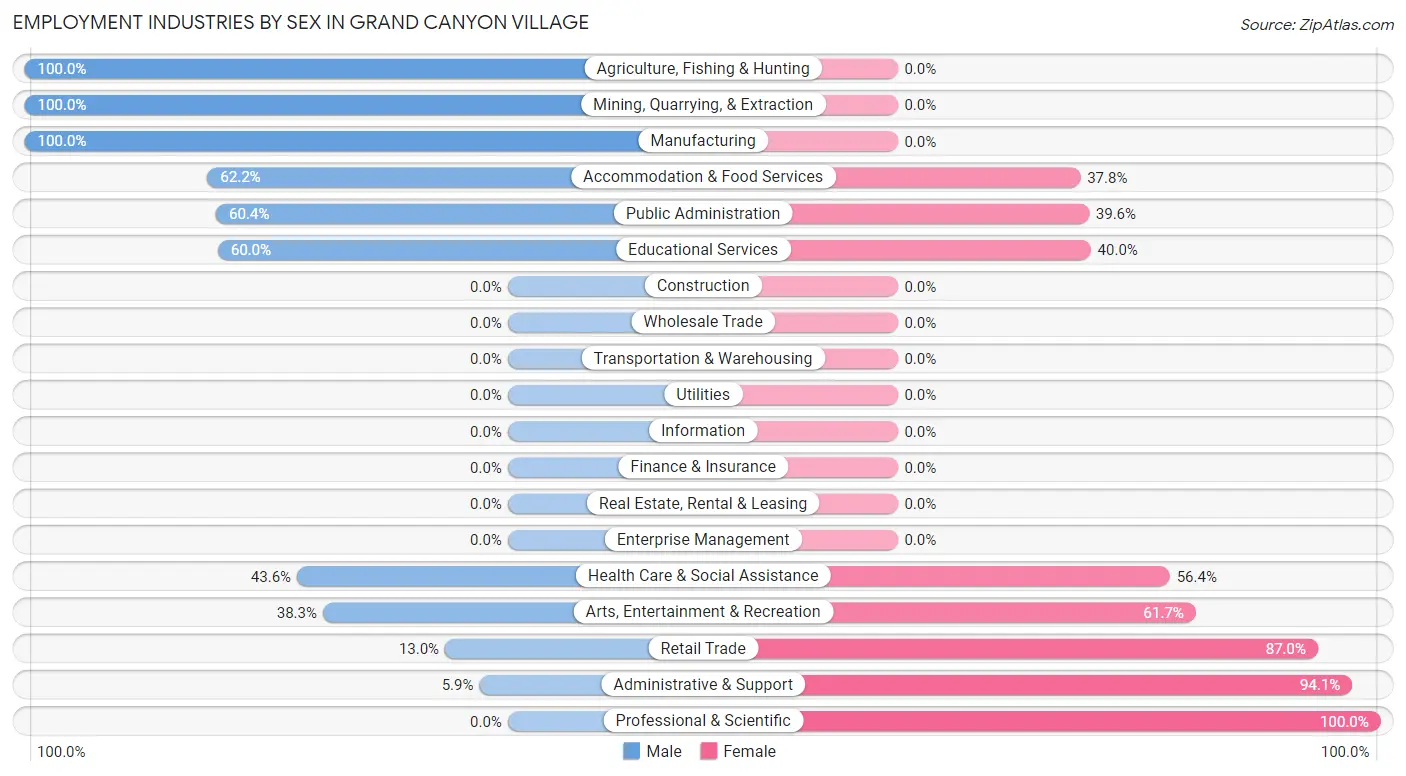
Employment Industries by Sex in Grand Canyon Village
The Grand Canyon Village industries that see more men than women are Agriculture, Fishing & Hunting (100.0%), Mining, Quarrying, & Extraction (100.0%), and Manufacturing (100.0%), whereas the industries that tend to have a higher number of women are Professional & Scientific (100.0%), Administrative & Support (94.1%), and Retail Trade (87.0%).
| Industry | Male | Female |
| Agriculture, Fishing & Hunting | 6 (100.0%) | 0 (0.0%) |
| Mining, Quarrying, & Extraction | 31 (100.0%) | 0 (0.0%) |
| Construction | 0 (0.0%) | 0 (0.0%) |
| Manufacturing | 23 (100.0%) | 0 (0.0%) |
| Wholesale Trade | 0 (0.0%) | 0 (0.0%) |
| Retail Trade | 30 (13.0%) | 201 (87.0%) |
| Transportation & Warehousing | 0 (0.0%) | 0 (0.0%) |
| Utilities | 0 (0.0%) | 0 (0.0%) |
| Information | 0 (0.0%) | 0 (0.0%) |
| Finance & Insurance | 0 (0.0%) | 0 (0.0%) |
| Real Estate, Rental & Leasing | 0 (0.0%) | 0 (0.0%) |
| Professional & Scientific | 0 (0.0%) | 17 (100.0%) |
| Enterprise Management | 0 (0.0%) | 0 (0.0%) |
| Administrative & Support | 6 (5.9%) | 96 (94.1%) |
| Educational Services | 51 (60.0%) | 34 (40.0%) |
| Health Care & Social Assistance | 48 (43.6%) | 62 (56.4%) |
| Arts, Entertainment & Recreation | 49 (38.3%) | 79 (61.7%) |
| Accommodation & Food Services | 248 (62.2%) | 151 (37.8%) |
| Public Administration | 131 (60.4%) | 86 (39.6%) |
| Total | 623 (46.2%) | 726 (53.8%) |
Education in Grand Canyon Village
School Enrollment in Grand Canyon Village
The most common levels of schooling among the 342 students in Grand Canyon Village are elementary school (119 | 34.8%), nursery / preschool (116 | 33.9%), and college / undergraduate (81 | 23.7%).
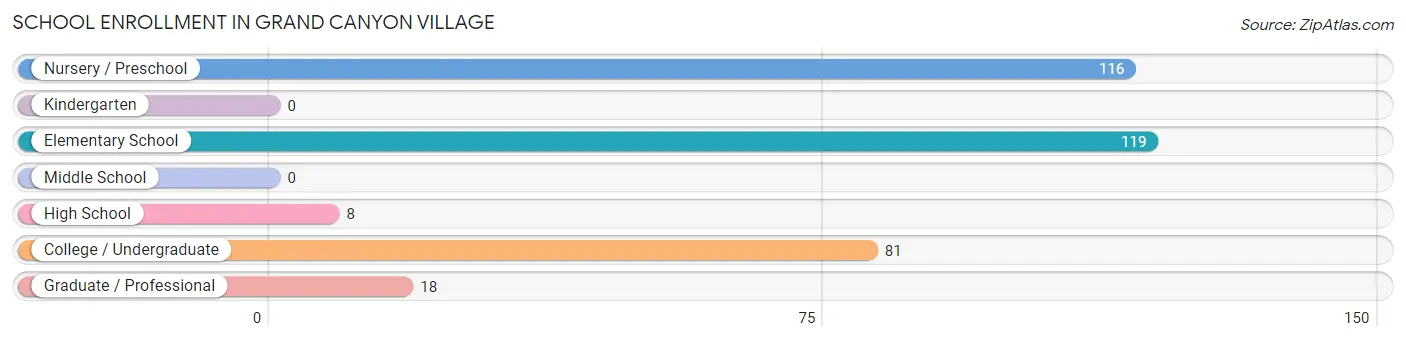
| School Level | # Students | % Students |
| Nursery / Preschool | 116 | 33.9% |
| Kindergarten | 0 | 0.0% |
| Elementary School | 119 | 34.8% |
| Middle School | 0 | 0.0% |
| High School | 8 | 2.3% |
| College / Undergraduate | 81 | 23.7% |
| Graduate / Professional | 18 | 5.3% |
| Total | 342 | 100.0% |
School Enrollment by Age by Funding Source in Grand Canyon Village
Out of a total of 342 students who are enrolled in schools in Grand Canyon Village, 88 (25.7%) attend a private institution, while the remaining 254 (74.3%) are enrolled in public schools. The age group of 35 years and over has the highest likelihood of being enrolled in private schools, with 18 (100.0% in the age bracket) enrolled. Conversely, the age group of 18 to 19 year olds has the lowest likelihood of being enrolled in a private school, with 18 (100.0% in the age bracket) attending a public institution.
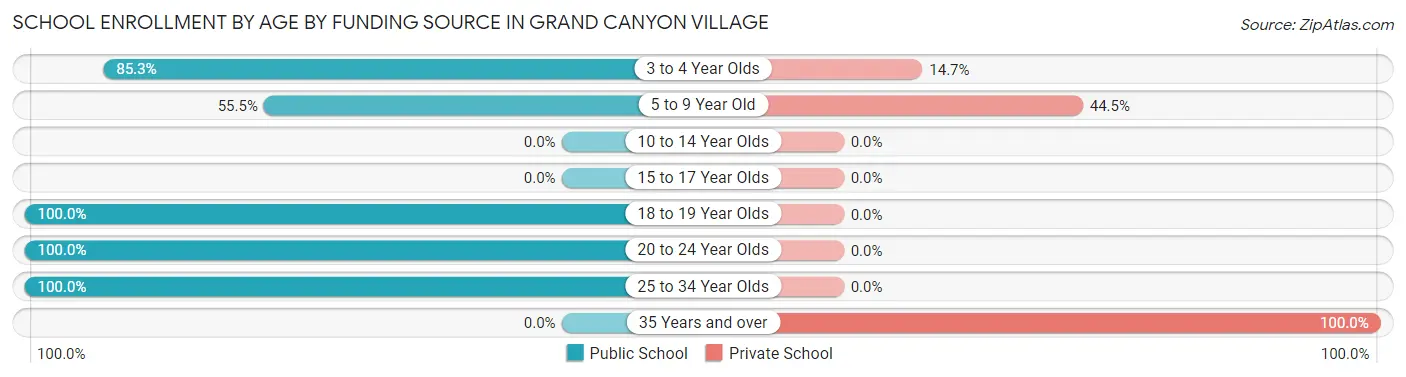
| Age Bracket | Public School | Private School |
| 3 to 4 Year Olds | 99 (85.3%) | 17 (14.7%) |
| 5 to 9 Year Old | 66 (55.5%) | 53 (44.5%) |
| 10 to 14 Year Olds | 0 (0.0%) | 0 (0.0%) |
| 15 to 17 Year Olds | 0 (0.0%) | 0 (0.0%) |
| 18 to 19 Year Olds | 18 (100.0%) | 0 (0.0%) |
| 20 to 24 Year Olds | 29 (100.0%) | 0 (0.0%) |
| 25 to 34 Year Olds | 42 (100.0%) | 0 (0.0%) |
| 35 Years and over | 0 (0.0%) | 18 (100.0%) |
| Total | 254 (74.3%) | 88 (25.7%) |
Educational Attainment by Field of Study in Grand Canyon Village
Science & technology (58 | 18.0%), bio, nature & agricultural (56 | 17.3%), business (43 | 13.3%), communications (39 | 12.1%), and arts & humanities (36 | 11.2%) are the most common fields of study among 323 individuals in Grand Canyon Village who have obtained a bachelor's degree or higher.
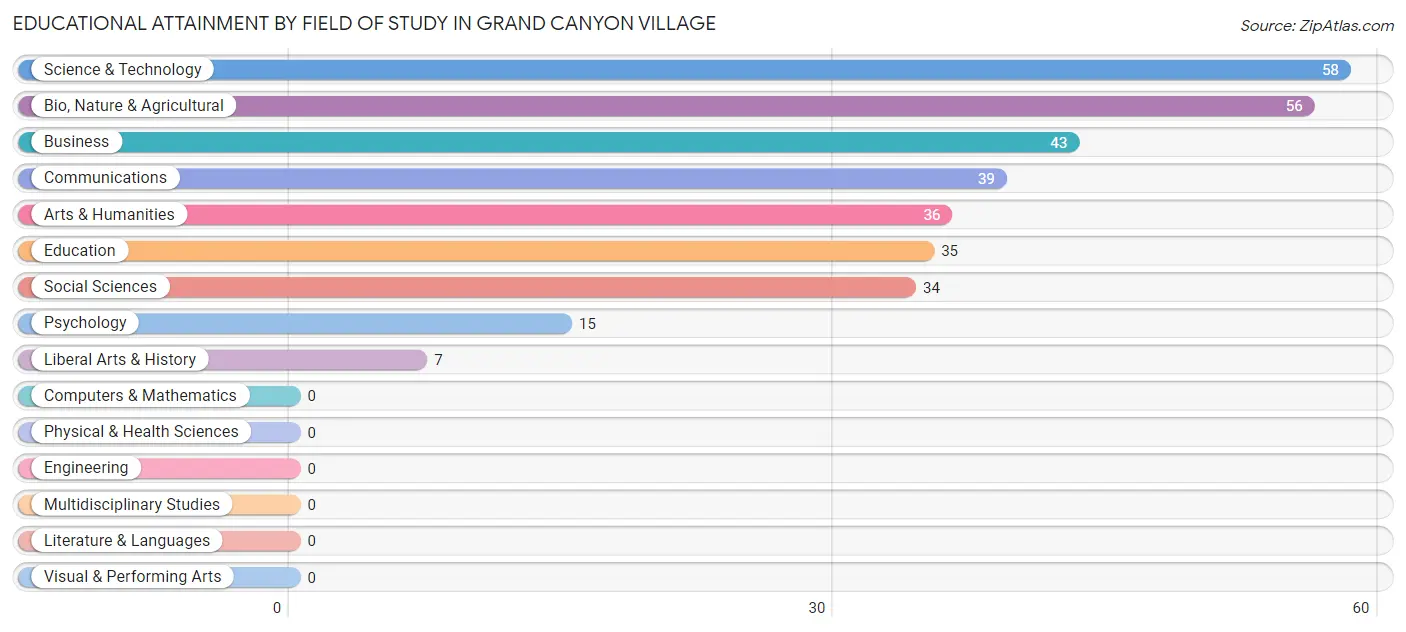
| Field of Study | # Graduates | % Graduates |
| Computers & Mathematics | 0 | 0.0% |
| Bio, Nature & Agricultural | 56 | 17.3% |
| Physical & Health Sciences | 0 | 0.0% |
| Psychology | 15 | 4.6% |
| Social Sciences | 34 | 10.5% |
| Engineering | 0 | 0.0% |
| Multidisciplinary Studies | 0 | 0.0% |
| Science & Technology | 58 | 18.0% |
| Business | 43 | 13.3% |
| Education | 35 | 10.8% |
| Literature & Languages | 0 | 0.0% |
| Liberal Arts & History | 7 | 2.2% |
| Visual & Performing Arts | 0 | 0.0% |
| Communications | 39 | 12.1% |
| Arts & Humanities | 36 | 11.2% |
| Total | 323 | 100.0% |
Transportation & Commute in Grand Canyon Village
Vehicle Availability by Sex in Grand Canyon Village
The most prevalent vehicle ownership categories in Grand Canyon Village are males with 1 vehicle (166, accounting for 59.7%) and females with 1 vehicle (206, making up 37.8%).
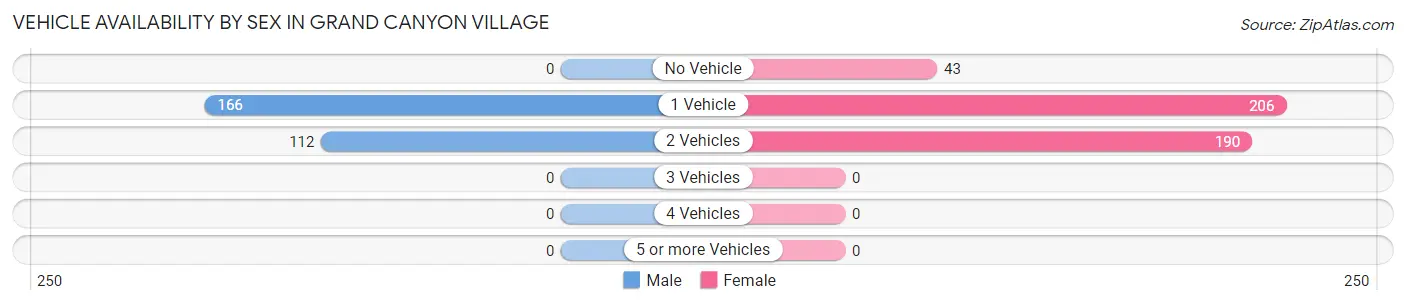
| Vehicles Available | Male | Female |
| No Vehicle | 0 (0.0%) | 43 (9.8%) |
| 1 Vehicle | 166 (59.7%) | 206 (46.9%) |
| 2 Vehicles | 112 (40.3%) | 190 (43.3%) |
| 3 Vehicles | 0 (0.0%) | 0 (0.0%) |
| 4 Vehicles | 0 (0.0%) | 0 (0.0%) |
| 5 or more Vehicles | 0 (0.0%) | 0 (0.0%) |
| Total | 278 (100.0%) | 439 (100.0%) |
Commute Time in Grand Canyon Village
The most frequently occuring commute durations in Grand Canyon Village are 10 to 14 minutes (433 commuters, 35.4%), 5 to 9 minutes (409 commuters, 33.4%), and 15 to 19 minutes (170 commuters, 13.9%).
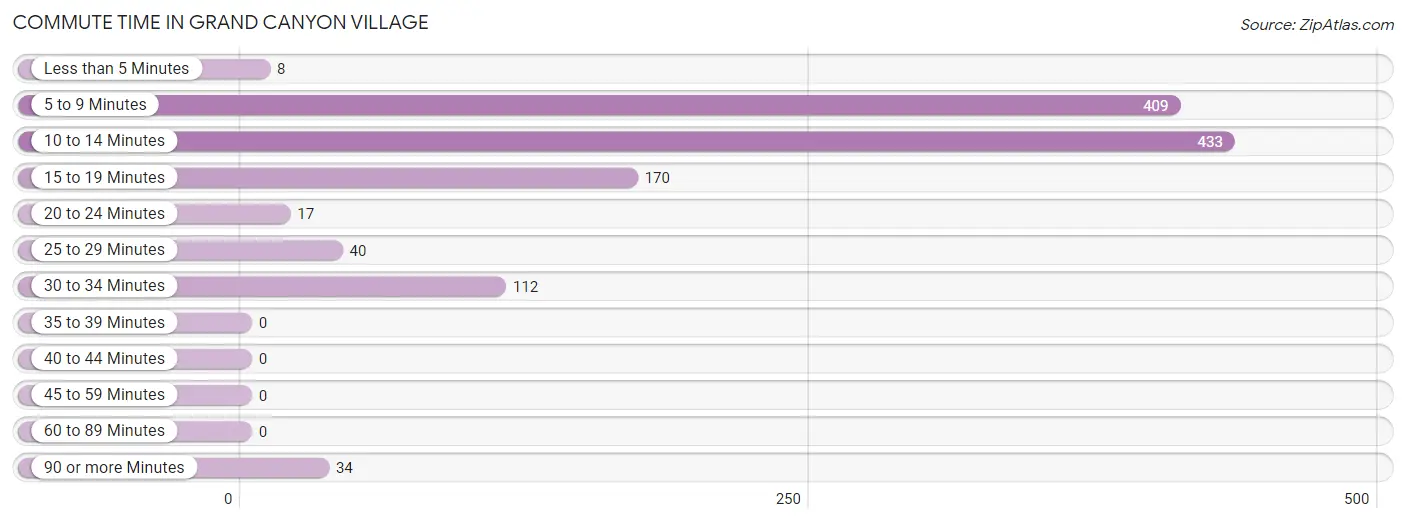
| Commute Time | # Commuters | % Commuters |
| Less than 5 Minutes | 8 | 0.6% |
| 5 to 9 Minutes | 409 | 33.4% |
| 10 to 14 Minutes | 433 | 35.4% |
| 15 to 19 Minutes | 170 | 13.9% |
| 20 to 24 Minutes | 17 | 1.4% |
| 25 to 29 Minutes | 40 | 3.3% |
| 30 to 34 Minutes | 112 | 9.2% |
| 35 to 39 Minutes | 0 | 0.0% |
| 40 to 44 Minutes | 0 | 0.0% |
| 45 to 59 Minutes | 0 | 0.0% |
| 60 to 89 Minutes | 0 | 0.0% |
| 90 or more Minutes | 34 | 2.8% |
Commute Time by Sex in Grand Canyon Village
The most common commute times in Grand Canyon Village are 10 to 14 minutes (208 commuters, 40.2%) for males and 10 to 14 minutes (225 commuters, 31.9%) for females.
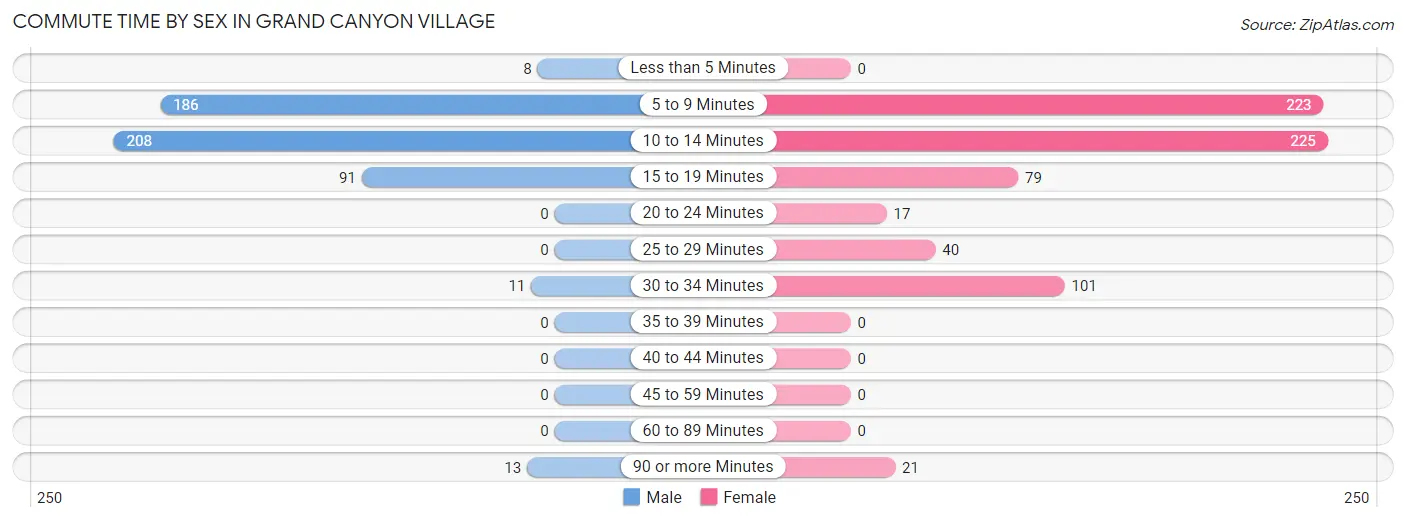
| Commute Time | Male | Female |
| Less than 5 Minutes | 8 (1.5%) | 0 (0.0%) |
| 5 to 9 Minutes | 186 (36.0%) | 223 (31.6%) |
| 10 to 14 Minutes | 208 (40.2%) | 225 (31.9%) |
| 15 to 19 Minutes | 91 (17.6%) | 79 (11.2%) |
| 20 to 24 Minutes | 0 (0.0%) | 17 (2.4%) |
| 25 to 29 Minutes | 0 (0.0%) | 40 (5.7%) |
| 30 to 34 Minutes | 11 (2.1%) | 101 (14.3%) |
| 35 to 39 Minutes | 0 (0.0%) | 0 (0.0%) |
| 40 to 44 Minutes | 0 (0.0%) | 0 (0.0%) |
| 45 to 59 Minutes | 0 (0.0%) | 0 (0.0%) |
| 60 to 89 Minutes | 0 (0.0%) | 0 (0.0%) |
| 90 or more Minutes | 13 (2.5%) | 21 (3.0%) |
Time of Departure to Work by Sex in Grand Canyon Village
The most frequent times of departure to work in Grand Canyon Village are 7:00 AM to 7:29 AM (213, 41.2%) for males and 8:00 AM to 8:29 AM (139, 19.7%) for females.
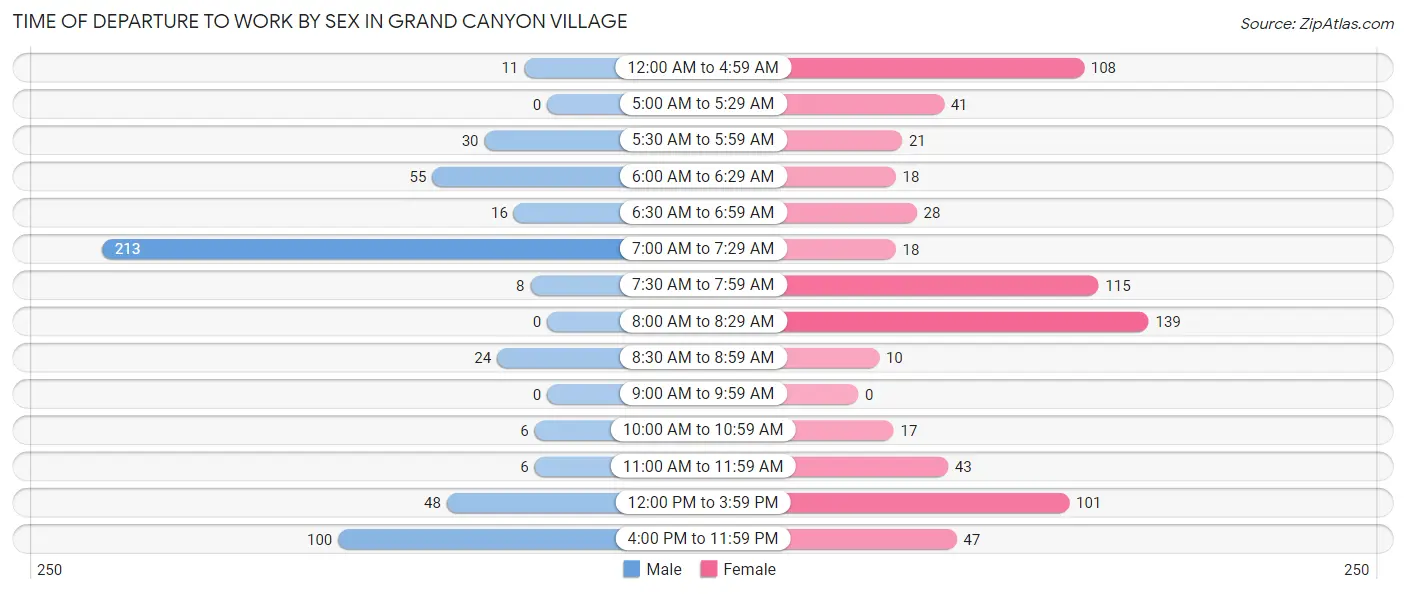
| Time of Departure | Male | Female |
| 12:00 AM to 4:59 AM | 11 (2.1%) | 108 (15.3%) |
| 5:00 AM to 5:29 AM | 0 (0.0%) | 41 (5.8%) |
| 5:30 AM to 5:59 AM | 30 (5.8%) | 21 (3.0%) |
| 6:00 AM to 6:29 AM | 55 (10.6%) | 18 (2.5%) |
| 6:30 AM to 6:59 AM | 16 (3.1%) | 28 (4.0%) |
| 7:00 AM to 7:29 AM | 213 (41.2%) | 18 (2.5%) |
| 7:30 AM to 7:59 AM | 8 (1.5%) | 115 (16.3%) |
| 8:00 AM to 8:29 AM | 0 (0.0%) | 139 (19.7%) |
| 8:30 AM to 8:59 AM | 24 (4.6%) | 10 (1.4%) |
| 9:00 AM to 9:59 AM | 0 (0.0%) | 0 (0.0%) |
| 10:00 AM to 10:59 AM | 6 (1.2%) | 17 (2.4%) |
| 11:00 AM to 11:59 AM | 6 (1.2%) | 43 (6.1%) |
| 12:00 PM to 3:59 PM | 48 (9.3%) | 101 (14.3%) |
| 4:00 PM to 11:59 PM | 100 (19.3%) | 47 (6.7%) |
| Total | 517 (100.0%) | 706 (100.0%) |
Housing Occupancy in Grand Canyon Village
Occupancy by Ownership in Grand Canyon Village
Of the total 486 dwellings in Grand Canyon Village, owner-occupied units account for 92 (18.9%), while renter-occupied units make up 394 (81.1%).
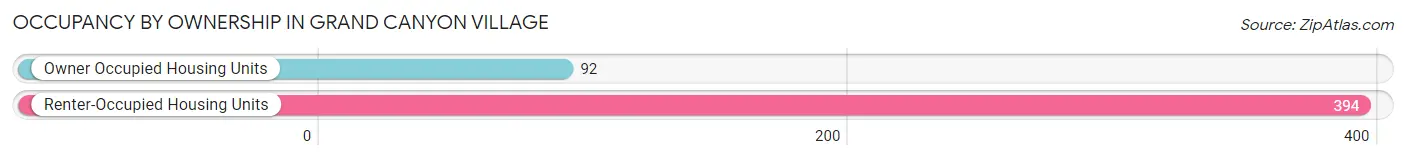
| Occupancy | # Housing Units | % Housing Units |
| Owner Occupied Housing Units | 92 | 18.9% |
| Renter-Occupied Housing Units | 394 | 81.1% |
| Total Occupied Housing Units | 486 | 100.0% |
Occupancy by Household Size in Grand Canyon Village
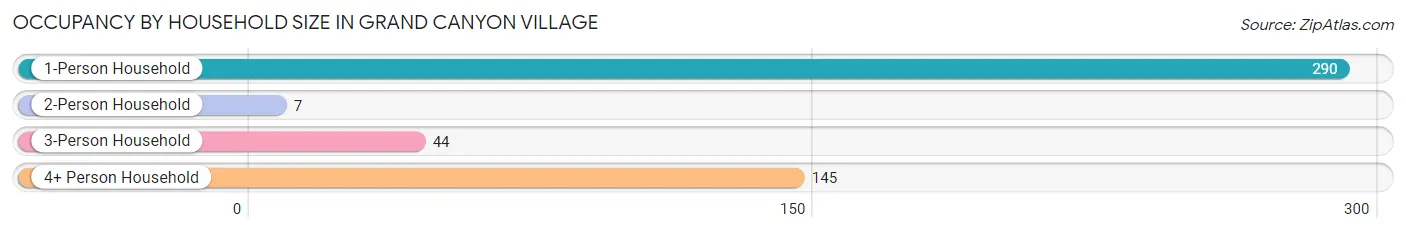
| Household Size | # Housing Units | % Housing Units |
| 1-Person Household | 290 | 59.7% |
| 2-Person Household | 7 | 1.4% |
| 3-Person Household | 44 | 9.0% |
| 4+ Person Household | 145 | 29.8% |
| Total Housing Units | 486 | 100.0% |
Occupancy by Ownership by Household Size in Grand Canyon Village
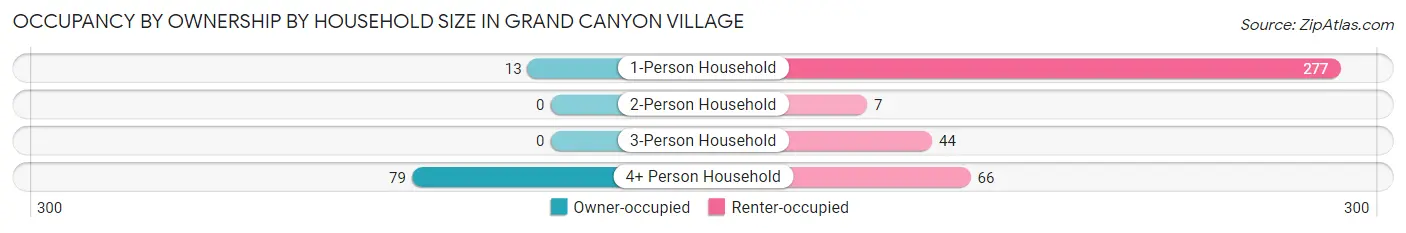
| Household Size | Owner-occupied | Renter-occupied |
| 1-Person Household | 13 (4.5%) | 277 (95.5%) |
| 2-Person Household | 0 (0.0%) | 7 (100.0%) |
| 3-Person Household | 0 (0.0%) | 44 (100.0%) |
| 4+ Person Household | 79 (54.5%) | 66 (45.5%) |
| Total Housing Units | 92 (18.9%) | 394 (81.1%) |
Occupancy by Educational Attainment in Grand Canyon Village
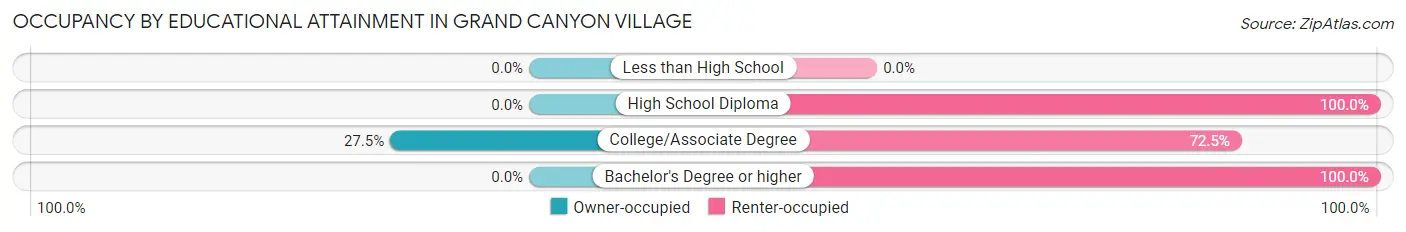
| Household Size | Owner-occupied | Renter-occupied |
| Less than High School | 0 (0.0%) | 0 (0.0%) |
| High School Diploma | 0 (0.0%) | 44 (100.0%) |
| College/Associate Degree | 92 (27.5%) | 242 (72.5%) |
| Bachelor's Degree or higher | 0 (0.0%) | 108 (100.0%) |
Occupancy by Age of Householder in Grand Canyon Village
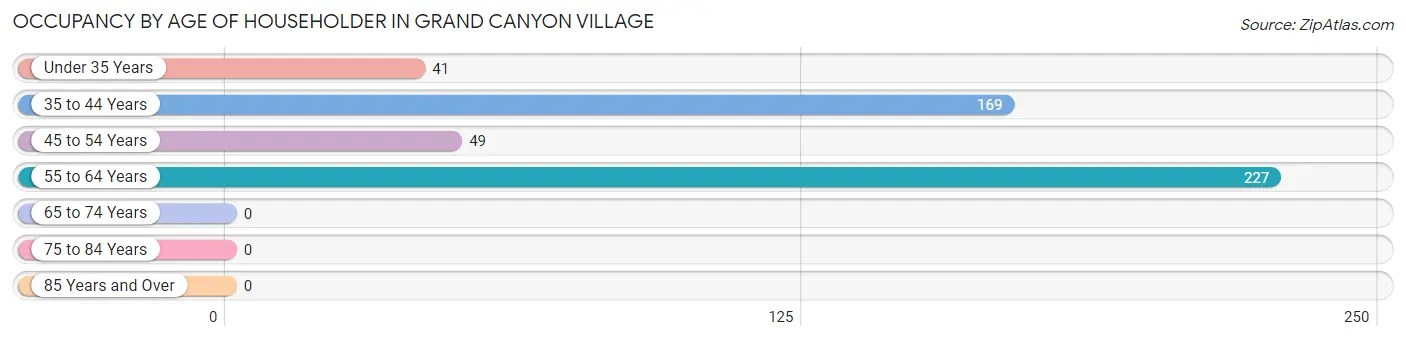
| Age Bracket | # Households | % Households |
| Under 35 Years | 41 | 8.4% |
| 35 to 44 Years | 169 | 34.8% |
| 45 to 54 Years | 49 | 10.1% |
| 55 to 64 Years | 227 | 46.7% |
| 65 to 74 Years | 0 | 0.0% |
| 75 to 84 Years | 0 | 0.0% |
| 85 Years and Over | 0 | 0.0% |
| Total | 486 | 100.0% |
Housing Finances in Grand Canyon Village
Median Income by Occupancy in Grand Canyon Village
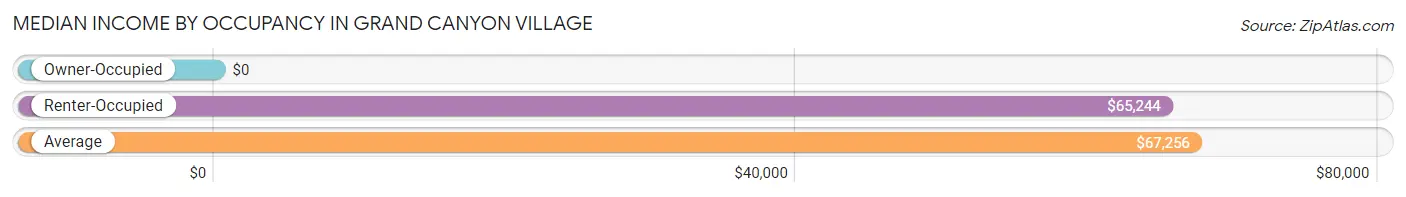
| Occupancy Type | # Households | Median Income |
| Owner-Occupied | 92 (18.9%) | $0 |
| Renter-Occupied | 394 (81.1%) | $65,244 |
| Average | 486 (100.0%) | $67,256 |
Occupancy by Householder Income Bracket in Grand Canyon Village
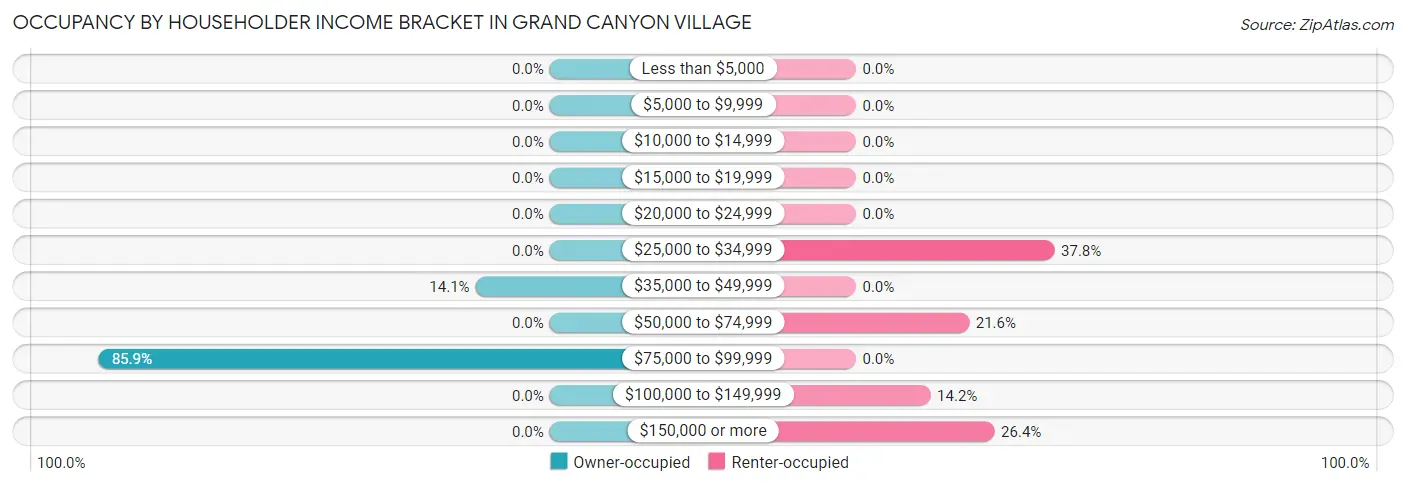
| Income Bracket | Owner-occupied | Renter-occupied |
| Less than $5,000 | 0 (0.0%) | 0 (0.0%) |
| $5,000 to $9,999 | 0 (0.0%) | 0 (0.0%) |
| $10,000 to $14,999 | 0 (0.0%) | 0 (0.0%) |
| $15,000 to $19,999 | 0 (0.0%) | 0 (0.0%) |
| $20,000 to $24,999 | 0 (0.0%) | 0 (0.0%) |
| $25,000 to $34,999 | 0 (0.0%) | 149 (37.8%) |
| $35,000 to $49,999 | 13 (14.1%) | 0 (0.0%) |
| $50,000 to $74,999 | 0 (0.0%) | 85 (21.6%) |
| $75,000 to $99,999 | 79 (85.9%) | 0 (0.0%) |
| $100,000 to $149,999 | 0 (0.0%) | 56 (14.2%) |
| $150,000 or more | 0 (0.0%) | 104 (26.4%) |
| Total | 92 (100.0%) | 394 (100.0%) |
Monthly Housing Cost Tiers in Grand Canyon Village
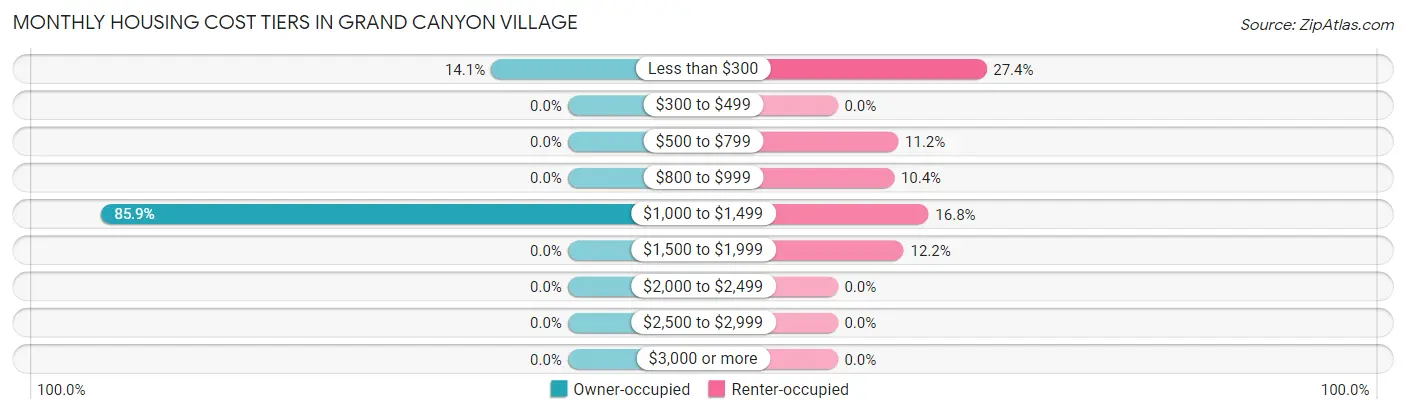
| Monthly Cost | Owner-occupied | Renter-occupied |
| Less than $300 | 13 (14.1%) | 108 (27.4%) |
| $300 to $499 | 0 (0.0%) | 0 (0.0%) |
| $500 to $799 | 0 (0.0%) | 44 (11.2%) |
| $800 to $999 | 0 (0.0%) | 41 (10.4%) |
| $1,000 to $1,499 | 79 (85.9%) | 66 (16.8%) |
| $1,500 to $1,999 | 0 (0.0%) | 48 (12.2%) |
| $2,000 to $2,499 | 0 (0.0%) | 0 (0.0%) |
| $2,500 to $2,999 | 0 (0.0%) | 0 (0.0%) |
| $3,000 or more | 0 (0.0%) | 0 (0.0%) |
| Total | 92 (100.0%) | 394 (100.0%) |
Physical Housing Characteristics in Grand Canyon Village
Housing Structures in Grand Canyon Village
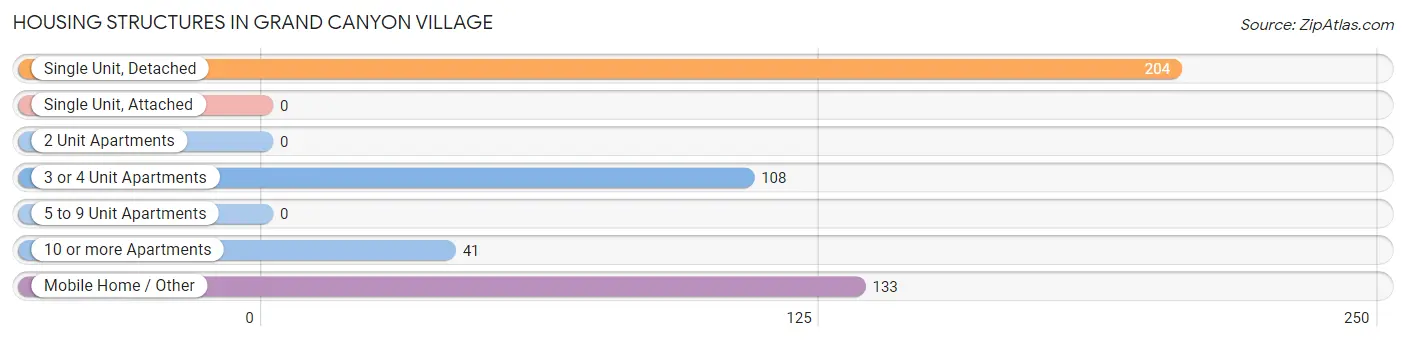
| Structure Type | # Housing Units | % Housing Units |
| Single Unit, Detached | 204 | 42.0% |
| Single Unit, Attached | 0 | 0.0% |
| 2 Unit Apartments | 0 | 0.0% |
| 3 or 4 Unit Apartments | 108 | 22.2% |
| 5 to 9 Unit Apartments | 0 | 0.0% |
| 10 or more Apartments | 41 | 8.4% |
| Mobile Home / Other | 133 | 27.4% |
| Total | 486 | 100.0% |
Housing Structures by Occupancy in Grand Canyon Village
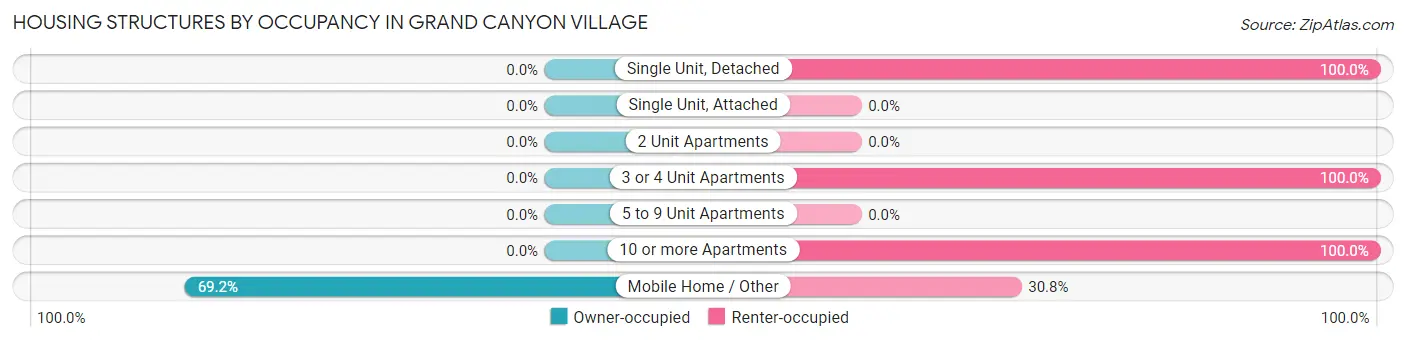
| Structure Type | Owner-occupied | Renter-occupied |
| Single Unit, Detached | 0 (0.0%) | 204 (100.0%) |
| Single Unit, Attached | 0 (0.0%) | 0 (0.0%) |
| 2 Unit Apartments | 0 (0.0%) | 0 (0.0%) |
| 3 or 4 Unit Apartments | 0 (0.0%) | 108 (100.0%) |
| 5 to 9 Unit Apartments | 0 (0.0%) | 0 (0.0%) |
| 10 or more Apartments | 0 (0.0%) | 41 (100.0%) |
| Mobile Home / Other | 92 (69.2%) | 41 (30.8%) |
| Total | 92 (18.9%) | 394 (81.1%) |
Housing Structures by Number of Rooms in Grand Canyon Village
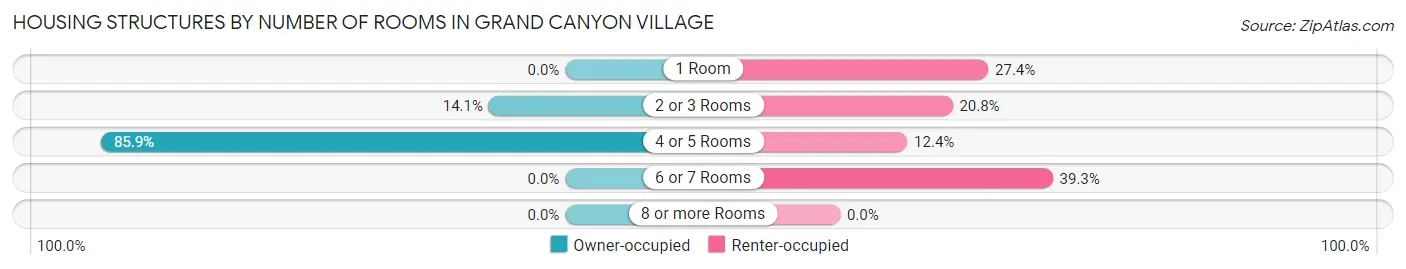
| Number of Rooms | Owner-occupied | Renter-occupied |
| 1 Room | 0 (0.0%) | 108 (27.4%) |
| 2 or 3 Rooms | 13 (14.1%) | 82 (20.8%) |
| 4 or 5 Rooms | 79 (85.9%) | 49 (12.4%) |
| 6 or 7 Rooms | 0 (0.0%) | 155 (39.3%) |
| 8 or more Rooms | 0 (0.0%) | 0 (0.0%) |
| Total | 92 (100.0%) | 394 (100.0%) |
Housing Structure by Heating Type in Grand Canyon Village
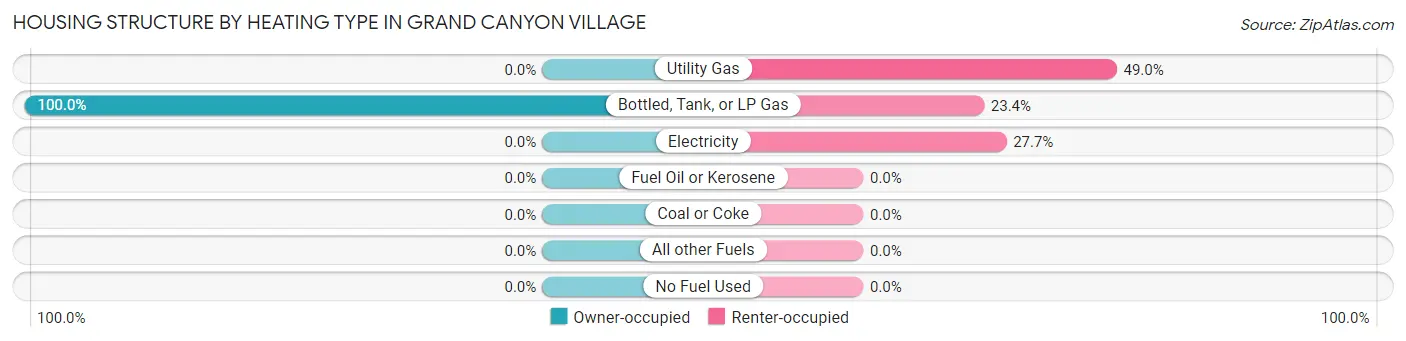
| Heating Type | Owner-occupied | Renter-occupied |
| Utility Gas | 0 (0.0%) | 193 (49.0%) |
| Bottled, Tank, or LP Gas | 92 (100.0%) | 92 (23.4%) |
| Electricity | 0 (0.0%) | 109 (27.7%) |
| Fuel Oil or Kerosene | 0 (0.0%) | 0 (0.0%) |
| Coal or Coke | 0 (0.0%) | 0 (0.0%) |
| All other Fuels | 0 (0.0%) | 0 (0.0%) |
| No Fuel Used | 0 (0.0%) | 0 (0.0%) |
| Total | 92 (100.0%) | 394 (100.0%) |
Household Vehicle Usage in Grand Canyon Village
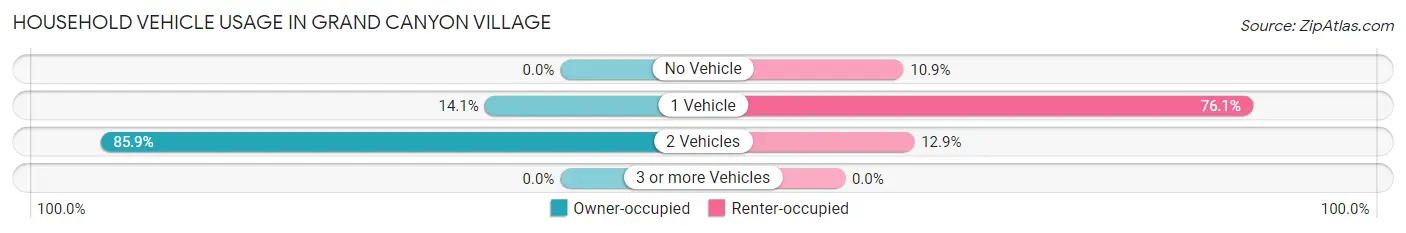
| Vehicles per Household | Owner-occupied | Renter-occupied |
| No Vehicle | 0 (0.0%) | 43 (10.9%) |
| 1 Vehicle | 13 (14.1%) | 300 (76.1%) |
| 2 Vehicles | 79 (85.9%) | 51 (12.9%) |
| 3 or more Vehicles | 0 (0.0%) | 0 (0.0%) |
| Total | 92 (100.0%) | 394 (100.0%) |
Real Estate & Mortgages in Grand Canyon Village
Real Estate and Mortgage Overview in Grand Canyon Village
| Characteristic | Without Mortgage | With Mortgage |
| Housing Units | 13 | 79 |
| Median Property Value | - | - |
| Median Household Income | - | - |
| Monthly Housing Costs | - | - |
| Real Estate Taxes | - | - |
Property Value by Mortgage Status in Grand Canyon Village
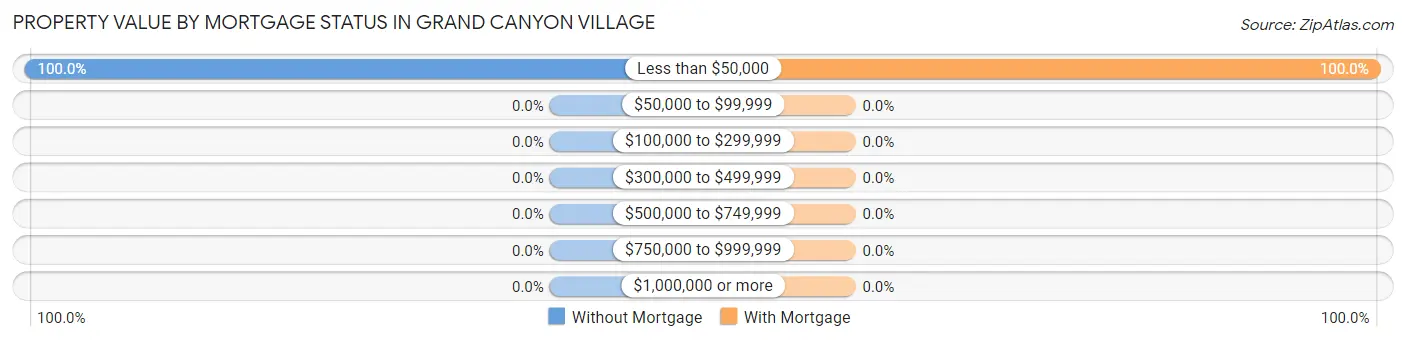
| Property Value | Without Mortgage | With Mortgage |
| Less than $50,000 | 13 (100.0%) | 79 (100.0%) |
| $50,000 to $99,999 | 0 (0.0%) | 0 (0.0%) |
| $100,000 to $299,999 | 0 (0.0%) | 0 (0.0%) |
| $300,000 to $499,999 | 0 (0.0%) | 0 (0.0%) |
| $500,000 to $749,999 | 0 (0.0%) | 0 (0.0%) |
| $750,000 to $999,999 | 0 (0.0%) | 0 (0.0%) |
| $1,000,000 or more | 0 (0.0%) | 0 (0.0%) |
| Total | 13 (100.0%) | 79 (100.0%) |
Household Income by Mortgage Status in Grand Canyon Village
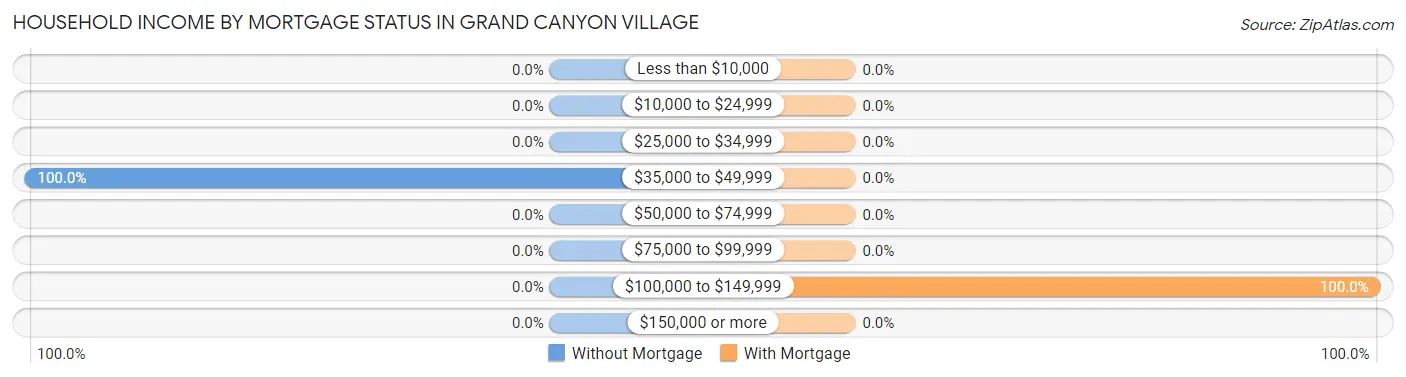
| Household Income | Without Mortgage | With Mortgage |
| Less than $10,000 | 0 (0.0%) | 0 (0.0%) |
| $10,000 to $24,999 | 0 (0.0%) | 0 (0.0%) |
| $25,000 to $34,999 | 0 (0.0%) | 0 (0.0%) |
| $35,000 to $49,999 | 13 (100.0%) | 0 (0.0%) |
| $50,000 to $74,999 | 0 (0.0%) | 0 (0.0%) |
| $75,000 to $99,999 | 0 (0.0%) | 0 (0.0%) |
| $100,000 to $149,999 | 0 (0.0%) | 79 (100.0%) |
| $150,000 or more | 0 (0.0%) | 0 (0.0%) |
| Total | 13 (100.0%) | 79 (100.0%) |
Property Value to Household Income Ratio in Grand Canyon Village
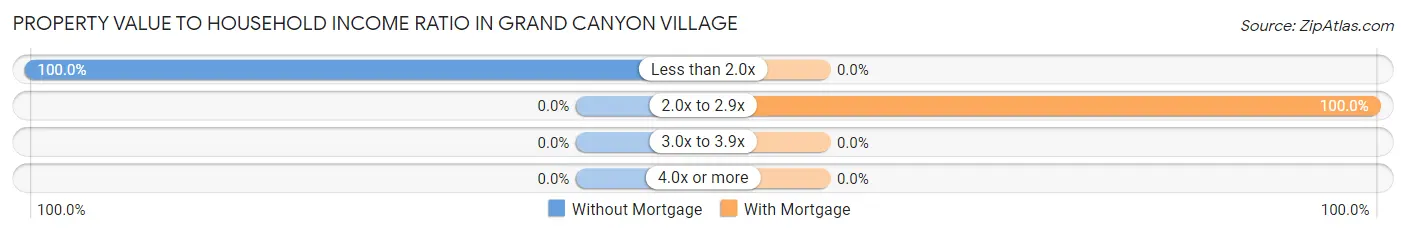
| Value-to-Income Ratio | Without Mortgage | With Mortgage |
| Less than 2.0x | 13 (100.0%) | 0 (0.0%) |
| 2.0x to 2.9x | 0 (0.0%) | 79 (100.0%) |
| 3.0x to 3.9x | 0 (0.0%) | 0 (0.0%) |
| 4.0x or more | 0 (0.0%) | 0 (0.0%) |
| Total | 13 (100.0%) | 79 (100.0%) |
Real Estate Taxes by Mortgage Status in Grand Canyon Village
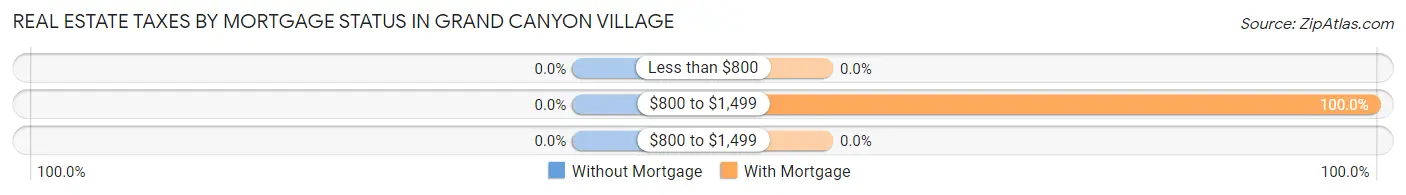
| Property Taxes | Without Mortgage | With Mortgage |
| Less than $800 | 0 (0.0%) | 0 (0.0%) |
| $800 to $1,499 | 0 (0.0%) | 79 (100.0%) |
| $800 to $1,499 | 0 (0.0%) | 0 (0.0%) |
| Total | 13 (100.0%) | 79 (100.0%) |
Health & Disability in Grand Canyon Village
Health Insurance Coverage by Age in Grand Canyon Village
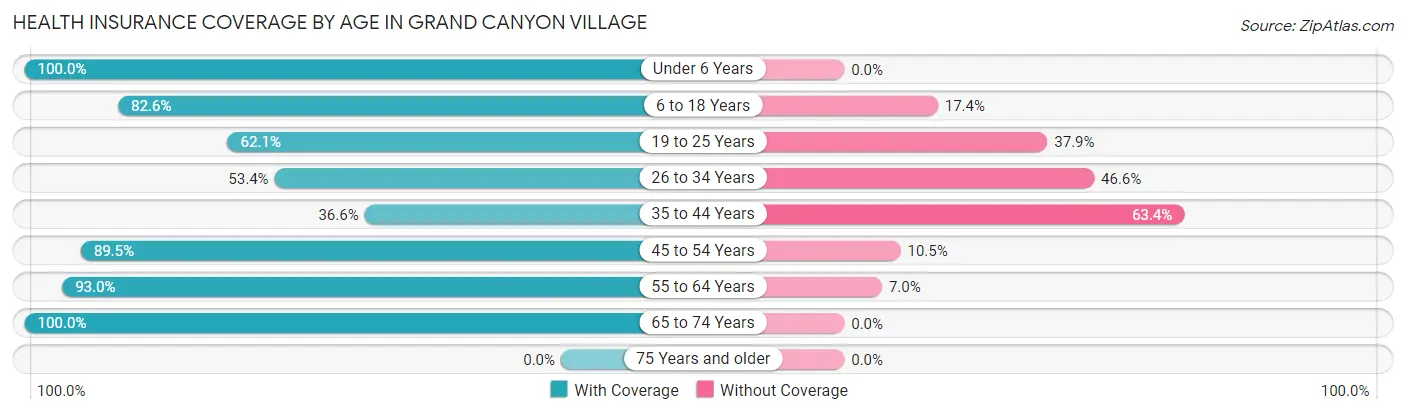
| Age Bracket | With Coverage | Without Coverage |
| Under 6 Years | 216 (100.0%) | 0 (0.0%) |
| 6 to 18 Years | 180 (82.6%) | 38 (17.4%) |
| 19 to 25 Years | 146 (62.1%) | 89 (37.9%) |
| 26 to 34 Years | 172 (53.4%) | 150 (46.6%) |
| 35 to 44 Years | 141 (36.6%) | 244 (63.4%) |
| 45 to 54 Years | 128 (89.5%) | 15 (10.5%) |
| 55 to 64 Years | 331 (93.0%) | 25 (7.0%) |
| 65 to 74 Years | 39 (100.0%) | 0 (0.0%) |
| 75 Years and older | 0 (0.0%) | 0 (0.0%) |
| Total | 1,353 (70.7%) | 561 (29.3%) |
Health Insurance Coverage by Citizenship Status in Grand Canyon Village
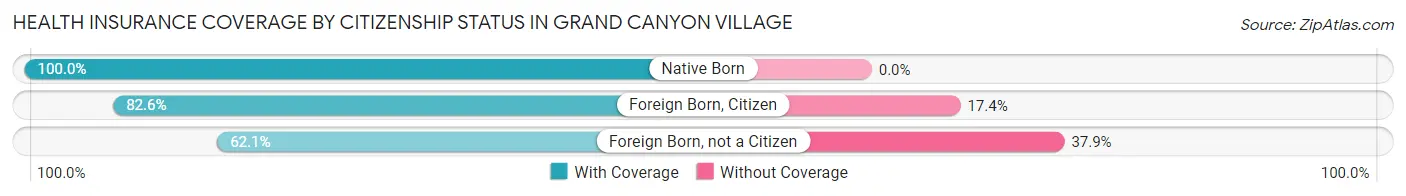
| Citizenship Status | With Coverage | Without Coverage |
| Native Born | 216 (100.0%) | 0 (0.0%) |
| Foreign Born, Citizen | 180 (82.6%) | 38 (17.4%) |
| Foreign Born, not a Citizen | 146 (62.1%) | 89 (37.9%) |
Health Insurance Coverage by Household Income in Grand Canyon Village
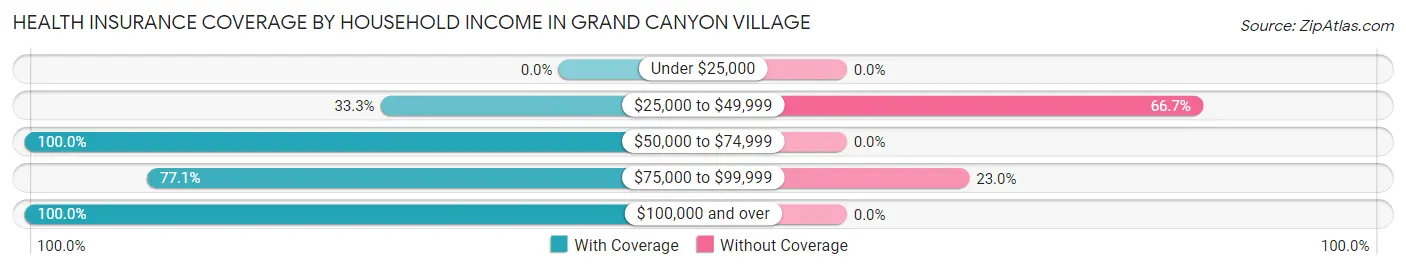
| Household Income | With Coverage | Without Coverage |
| Under $25,000 | 0 (0.0%) | 0 (0.0%) |
| $25,000 to $49,999 | 54 (33.3%) | 108 (66.7%) |
| $50,000 to $74,999 | 85 (100.0%) | 0 (0.0%) |
| $75,000 to $99,999 | 339 (77.0%) | 101 (23.0%) |
| $100,000 and over | 464 (100.0%) | 0 (0.0%) |
Public vs Private Health Insurance Coverage by Age in Grand Canyon Village
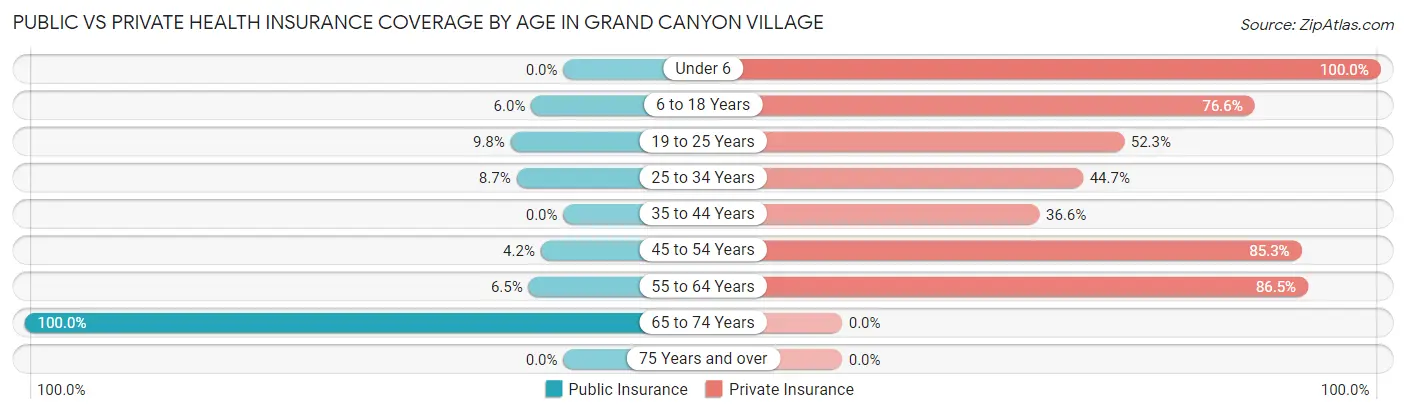
| Age Bracket | Public Insurance | Private Insurance |
| Under 6 | 0 (0.0%) | 216 (100.0%) |
| 6 to 18 Years | 13 (6.0%) | 167 (76.6%) |
| 19 to 25 Years | 23 (9.8%) | 123 (52.3%) |
| 25 to 34 Years | 28 (8.7%) | 144 (44.7%) |
| 35 to 44 Years | 0 (0.0%) | 141 (36.6%) |
| 45 to 54 Years | 6 (4.2%) | 122 (85.3%) |
| 55 to 64 Years | 23 (6.5%) | 308 (86.5%) |
| 65 to 74 Years | 39 (100.0%) | 0 (0.0%) |
| 75 Years and over | 0 (0.0%) | 0 (0.0%) |
| Total | 132 (6.9%) | 1,221 (63.8%) |
Disability Status by Sex by Age in Grand Canyon Village
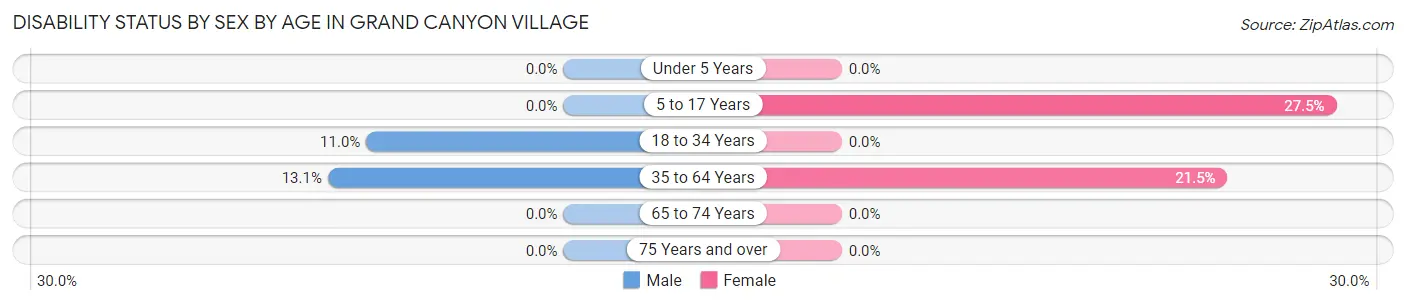
| Age Bracket | Male | Female |
| Under 5 Years | 0 (0.0%) | 0 (0.0%) |
| 5 to 17 Years | 0 (0.0%) | 46 (27.5%) |
| 18 to 34 Years | 29 (11.0%) | 0 (0.0%) |
| 35 to 64 Years | 50 (13.1%) | 108 (21.5%) |
| 65 to 74 Years | 0 (0.0%) | 0 (0.0%) |
| 75 Years and over | 0 (0.0%) | 0 (0.0%) |
Disability Class by Sex by Age in Grand Canyon Village
Disability Class: Hearing Difficulty
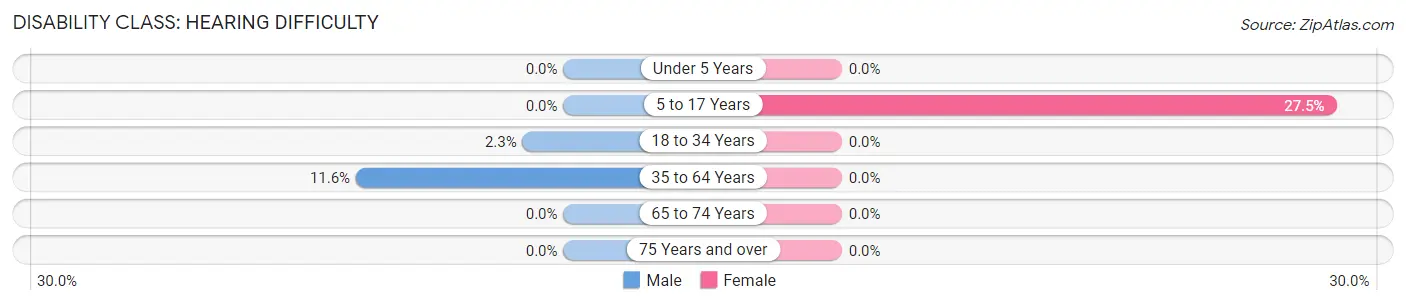
| Age Bracket | Male | Female |
| Under 5 Years | 0 (0.0%) | 0 (0.0%) |
| 5 to 17 Years | 0 (0.0%) | 46 (27.5%) |
| 18 to 34 Years | 6 (2.3%) | 0 (0.0%) |
| 35 to 64 Years | 44 (11.6%) | 0 (0.0%) |
| 65 to 74 Years | 0 (0.0%) | 0 (0.0%) |
| 75 Years and over | 0 (0.0%) | 0 (0.0%) |
Disability Class: Vision Difficulty
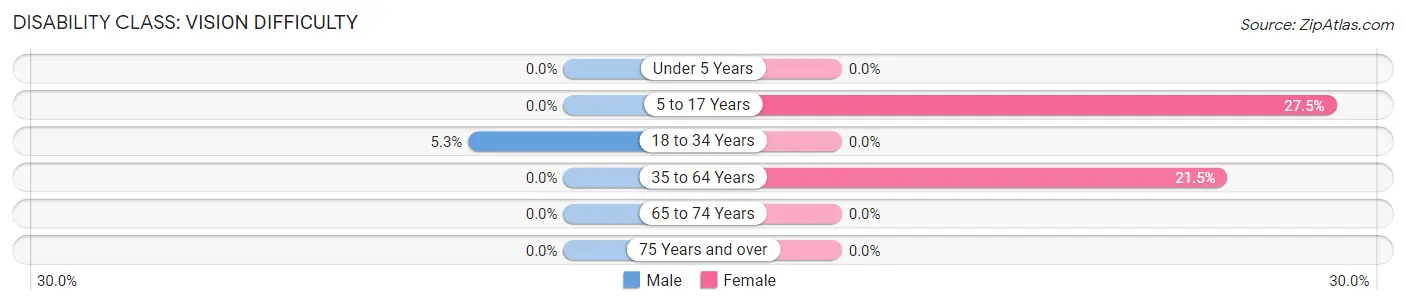
| Age Bracket | Male | Female |
| Under 5 Years | 0 (0.0%) | 0 (0.0%) |
| 5 to 17 Years | 0 (0.0%) | 46 (27.5%) |
| 18 to 34 Years | 14 (5.3%) | 0 (0.0%) |
| 35 to 64 Years | 0 (0.0%) | 108 (21.5%) |
| 65 to 74 Years | 0 (0.0%) | 0 (0.0%) |
| 75 Years and over | 0 (0.0%) | 0 (0.0%) |
Disability Class: Cognitive Difficulty
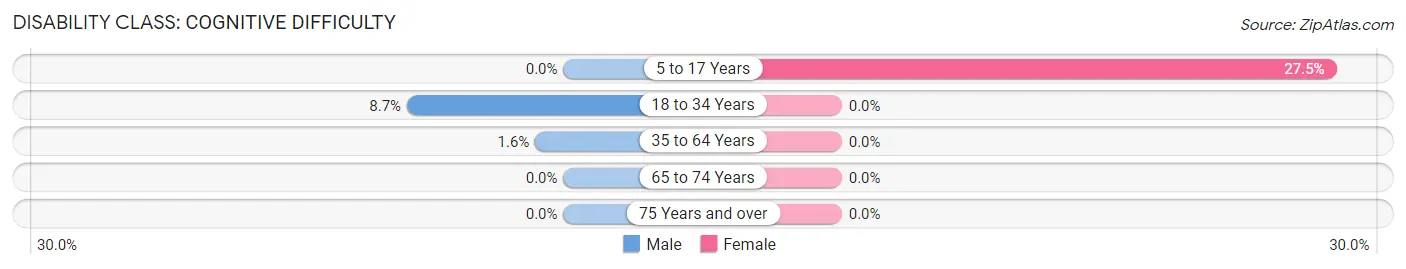
| Age Bracket | Male | Female |
| 5 to 17 Years | 0 (0.0%) | 46 (27.5%) |
| 18 to 34 Years | 23 (8.7%) | 0 (0.0%) |
| 35 to 64 Years | 6 (1.6%) | 0 (0.0%) |
| 65 to 74 Years | 0 (0.0%) | 0 (0.0%) |
| 75 Years and over | 0 (0.0%) | 0 (0.0%) |
Disability Class: Ambulatory Difficulty
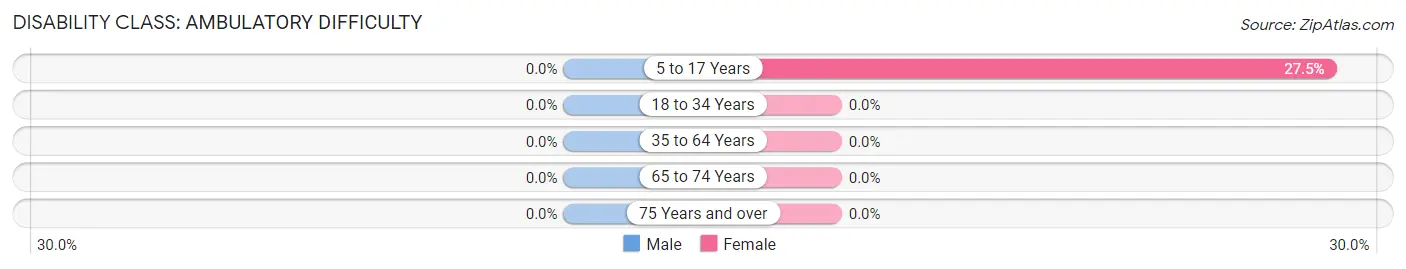
| Age Bracket | Male | Female |
| 5 to 17 Years | 0 (0.0%) | 46 (27.5%) |
| 18 to 34 Years | 0 (0.0%) | 0 (0.0%) |
| 35 to 64 Years | 0 (0.0%) | 0 (0.0%) |
| 65 to 74 Years | 0 (0.0%) | 0 (0.0%) |
| 75 Years and over | 0 (0.0%) | 0 (0.0%) |
Disability Class: Self-Care Difficulty
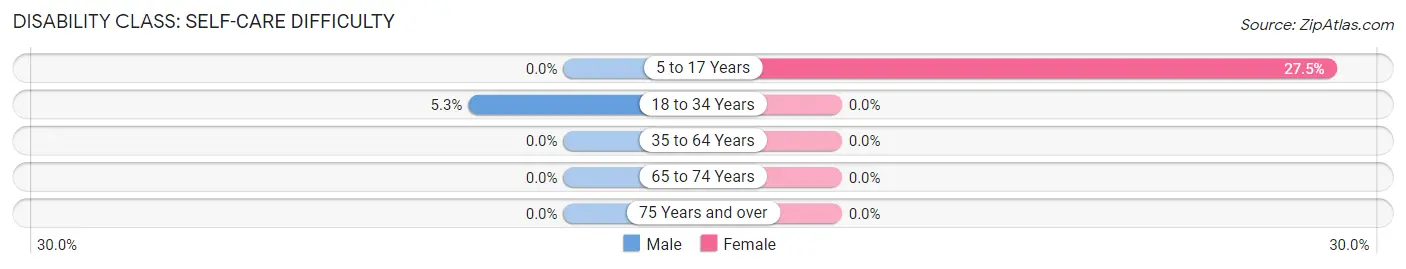
| Age Bracket | Male | Female |
| 5 to 17 Years | 0 (0.0%) | 46 (27.5%) |
| 18 to 34 Years | 14 (5.3%) | 0 (0.0%) |
| 35 to 64 Years | 0 (0.0%) | 0 (0.0%) |
| 65 to 74 Years | 0 (0.0%) | 0 (0.0%) |
| 75 Years and over | 0 (0.0%) | 0 (0.0%) |
Technology Access in Grand Canyon Village
Computing Device Access in Grand Canyon Village
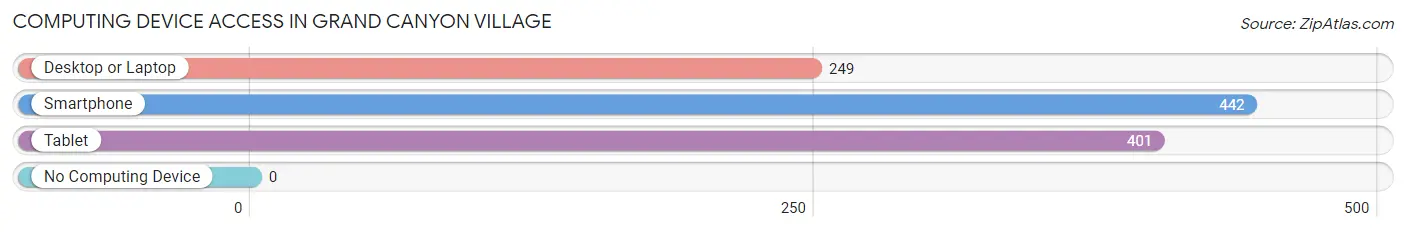
| Device Type | # Households | % Households |
| Desktop or Laptop | 249 | 51.2% |
| Smartphone | 442 | 90.9% |
| Tablet | 401 | 82.5% |
| No Computing Device | 0 | 0.0% |
| Total | 486 | 100.0% |
Internet Access in Grand Canyon Village
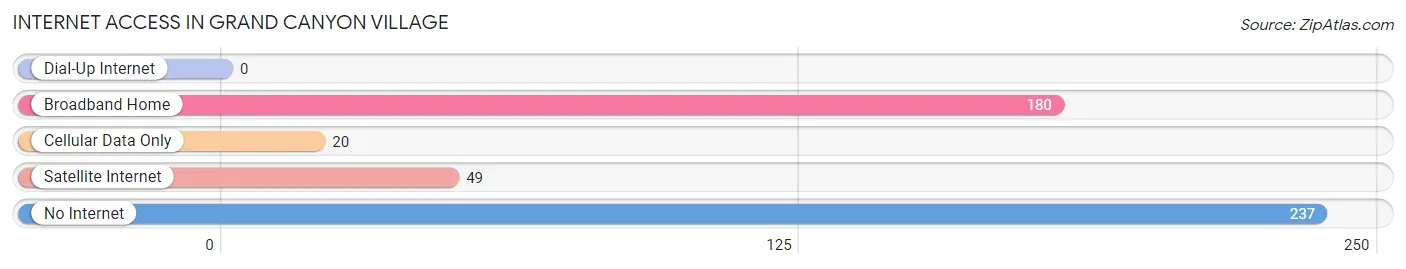
| Internet Type | # Households | % Households |
| Dial-Up Internet | 0 | 0.0% |
| Broadband Home | 180 | 37.0% |
| Cellular Data Only | 20 | 4.1% |
| Satellite Internet | 49 | 10.1% |
| No Internet | 237 | 48.8% |
| Total | 486 | 100.0% |
Grand Canyon Village Summary
Introduction
Grand Canyon Village is a census-designated place located in Coconino County, Arizona. It is located within the Grand Canyon National Park and is the most populous settlement in the park. The village is located on the South Rim of the Grand Canyon and is the primary tourist destination for visitors to the park. The village is home to a variety of businesses, services, and attractions, including the Grand Canyon Visitor Center, the Grand Canyon Railway, and the Grand Canyon Lodge.
History
The Grand Canyon Village was established in the late 19th century as a tourist destination for visitors to the Grand Canyon. The first permanent settlement in the area was established in 1883 by the Santa Fe Railroad, which built a hotel and a train station in the area. The village was initially known as Grand Canyon Depot, but the name was changed to Grand Canyon Village in the early 20th century.
The village was initially a small settlement, but it grew rapidly in the early 20th century as the Grand Canyon became a popular tourist destination. The village was incorporated in 1925 and was home to a variety of businesses, including hotels, restaurants, and stores. The village was also home to the Grand Canyon Lodge, which was built in 1928 and is still in operation today.
Geography
Grand Canyon Village is located in Coconino County, Arizona, within the Grand Canyon National Park. The village is located on the South Rim of the Grand Canyon, at an elevation of 6,800 feet. The village is located approximately 80 miles north of Flagstaff, Arizona, and is accessible via State Route 64.
The village is located in a desert climate, with hot summers and mild winters. The average annual temperature is 57°F, with an average high of 85°F in the summer and an average low of 32°F in the winter. The village receives an average of 12 inches of precipitation per year, with most of the precipitation occurring in the summer months.
Economy
The economy of Grand Canyon Village is largely based on tourism. The village is home to a variety of businesses, services, and attractions, including the Grand Canyon Visitor Center, the Grand Canyon Railway, and the Grand Canyon Lodge. The village is also home to a variety of restaurants, stores, and hotels, which cater to the large number of tourists who visit the area each year.
The village is also home to a variety of government services, including the Grand Canyon National Park Service, the Grand Canyon Trust, and the Grand Canyon Association. These organizations are responsible for the preservation and protection of the Grand Canyon and its surrounding areas.
Demographics
As of the 2010 census, the population of Grand Canyon Village was 2,004. The population is primarily white (90.2%), with a small percentage of Native American (2.2%), African American (1.2%), and Asian (1.1%) residents. The median household income in the village is $45,000, and the median age is 44.
Conclusion
Grand Canyon Village is a census-designated place located in Coconino County, Arizona. It is located within the Grand Canyon National Park and is the most populous settlement in the park. The village is home to a variety of businesses, services, and attractions, including the Grand Canyon Visitor Center, the Grand Canyon Railway, and the Grand Canyon Lodge. The economy of the village is largely based on tourism, and the population is primarily white. Grand Canyon Village is an important tourist destination for visitors to the Grand Canyon and is an important part of the local economy.
Common Questions
What is the Total Population of Grand Canyon Village?
Total Population of Grand Canyon Village is 1,914.
What is the Total Male Population of Grand Canyon Village?
Total Male Population of Grand Canyon Village is 675.
What is the Total Female Population of Grand Canyon Village?
Total Female Population of Grand Canyon Village is 1,239.
What is the Ratio of Males per 100 Females in Grand Canyon Village?
There are 54.48 Males per 100 Females in Grand Canyon Village.
What is the Ratio of Females per 100 Males in Grand Canyon Village?
There are 183.56 Females per 100 Males in Grand Canyon Village.
What is the Median Population Age in Grand Canyon Village?
Median Population Age in Grand Canyon Village is 30.9 Years.
What is the Average Family Size in Grand Canyon Village
Average Family Size in Grand Canyon Village is 4.5 People.
What is the Average Household Size in Grand Canyon Village
Average Household Size in Grand Canyon Village is 2.4 People.
What is Per Capita Income in Grand Canyon Village?
Per Capita income in Grand Canyon Village is $34,986.
What is the Median Family Income in Grand Canyon Village?
Median Family Income in Grand Canyon Village is $100,791.
What is the Median Household income in Grand Canyon Village?
Median Household Income in Grand Canyon Village is $67,256.
What is Income or Wage Gap in Grand Canyon Village?
Income or Wage Gap in Grand Canyon Village is 23.5%.
Women in Grand Canyon Village earn 76.5 cents for every dollar earned by a man.
What is Inequality or Gini Index in Grand Canyon Village?
Inequality or Gini Index in Grand Canyon Village is 0.36.
How Large is the Labor Force in Grand Canyon Village?
There are 1,349 People in the Labor Forcein in Grand Canyon Village.
What is the Percentage of People in the Labor Force in Grand Canyon Village?
88.1% of People are in the Labor Force in Grand Canyon Village.