Fort Valley, AZ
Fort Valley Map
Fort Valley Overview
1,734
TOTAL POPULATION
898
MALE POPULATION
836
FEMALE POPULATION
107.42
MALES / 100 FEMALES
93.10
FEMALES / 100 MALES
48.3
MEDIAN AGE
2.7
AVG FAMILY SIZE
2.4
AVG HOUSEHOLD SIZE
$80,256
PER CAPITA INCOME
$152,976
AVG FAMILY INCOME
$138,824
AVG HOUSEHOLD INCOME
55.1%
WAGE / INCOME GAP [ % ]
44.9¢/ $1
WAGE / INCOME GAP [ $ ]
0.48
INEQUALITY / GINI INDEX
715
LABOR FORCE [ PEOPLE ]
51.3%
PERCENT IN LABOR FORCE
3.1%
UNEMPLOYMENT RATE
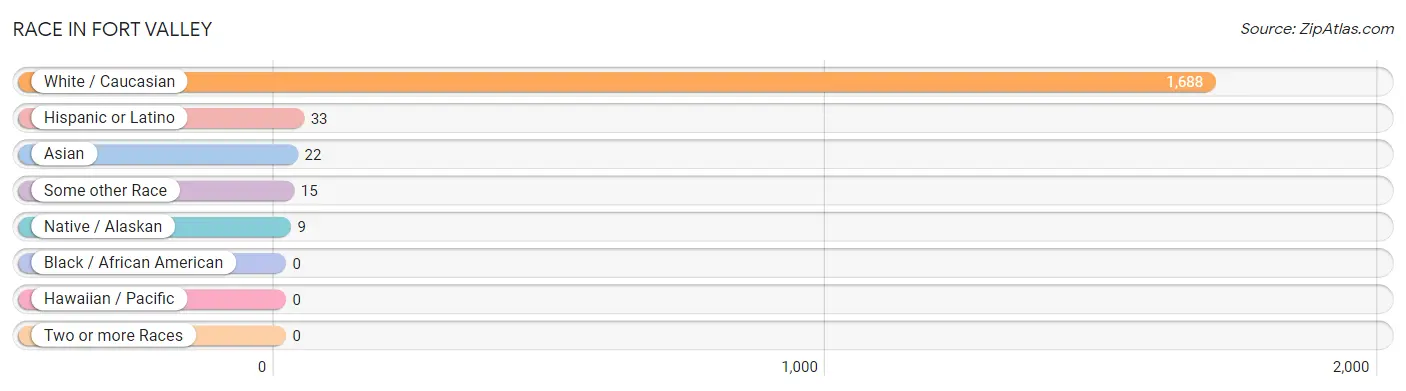
Race in Fort Valley
The most populous races in Fort Valley are White / Caucasian (1,688 | 97.4%), Hispanic or Latino (33 | 1.9%), and Asian (22 | 1.3%).
| Race | # Population | % Population |
| Asian | 22 | 1.3% |
| Black / African American | 0 | 0.0% |
| Hawaiian / Pacific | 0 | 0.0% |
| Hispanic or Latino | 33 | 1.9% |
| Native / Alaskan | 9 | 0.5% |
| White / Caucasian | 1,688 | 97.4% |
| Two or more Races | 0 | 0.0% |
| Some other Race | 15 | 0.9% |
| Total | 1,734 | 100.0% |
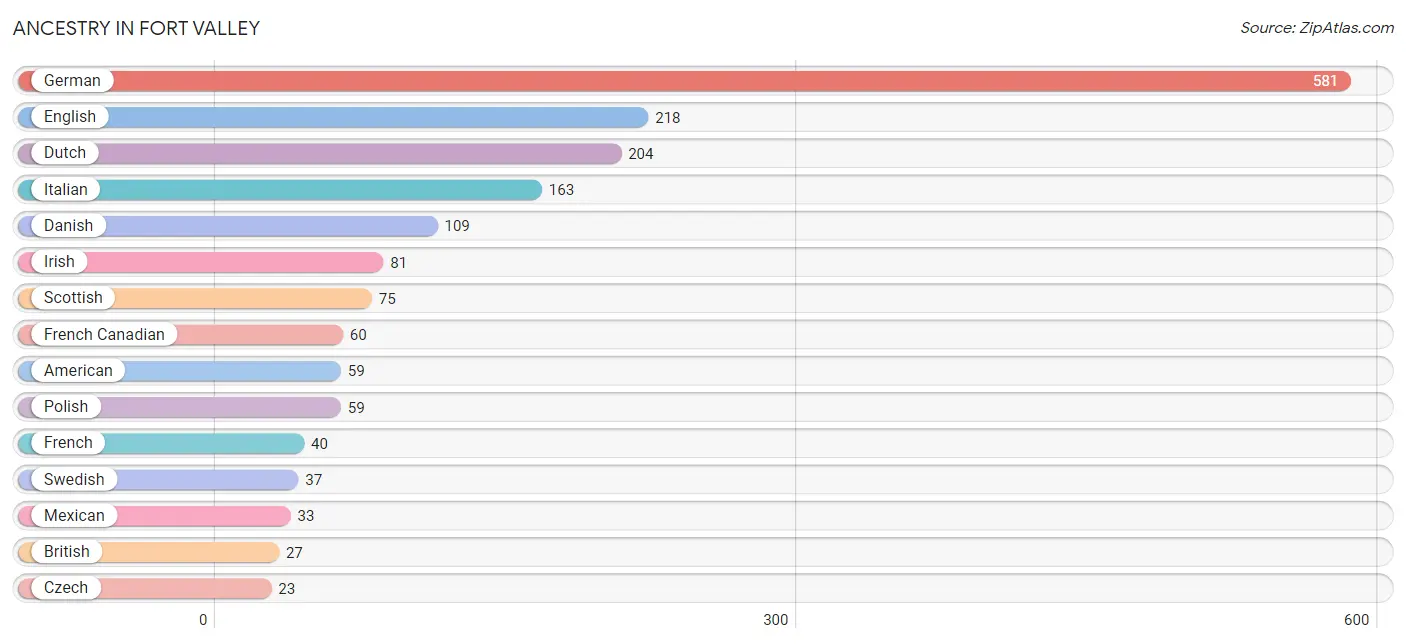
Ancestry in Fort Valley
The most populous ancestries reported in Fort Valley are German (581 | 33.5%), English (218 | 12.6%), Dutch (204 | 11.8%), Italian (163 | 9.4%), and Danish (109 | 6.3%), together accounting for 73.5% of all Fort Valley residents.
| Ancestry | # Population | % Population |
| Alaskan Athabascan | 9 | 0.5% |
| American | 59 | 3.4% |
| Bhutanese | 22 | 1.3% |
| British | 27 | 1.6% |
| Canadian | 10 | 0.6% |
| Czech | 23 | 1.3% |
| Danish | 109 | 6.3% |
| Dutch | 204 | 11.8% |
| Eastern European | 19 | 1.1% |
| English | 218 | 12.6% |
| European | 9 | 0.5% |
| French | 40 | 2.3% |
| French Canadian | 60 | 3.5% |
| German | 581 | 33.5% |
| Irish | 81 | 4.7% |
| Italian | 163 | 9.4% |
| Lithuanian | 10 | 0.6% |
| Mexican | 33 | 1.9% |
| Polish | 59 | 3.4% |
| Scottish | 75 | 4.3% |
| Slovene | 15 | 0.9% |
| Swedish | 37 | 2.1% |
| Welsh | 7 | 0.4% | View All 23 Rows |
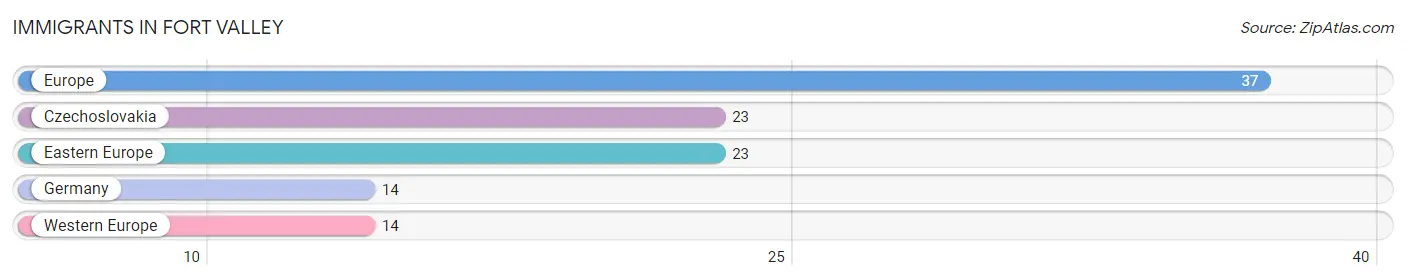
Immigrants in Fort Valley
The most numerous immigrant groups reported in Fort Valley came from Europe (37 | 2.1%), Czechoslovakia (23 | 1.3%), Eastern Europe (23 | 1.3%), Germany (14 | 0.8%), and Western Europe (14 | 0.8%), together accounting for 6.4% of all Fort Valley residents.
| Immigration Origin | # Population | % Population |
| Czechoslovakia | 23 | 1.3% |
| Eastern Europe | 23 | 1.3% |
| Europe | 37 | 2.1% |
| Germany | 14 | 0.8% |
| Western Europe | 14 | 0.8% | View All 5 Rows |
Sex and Age in Fort Valley
Sex and Age in Fort Valley
The most populous age groups in Fort Valley are 5 to 9 Years (160 | 17.8%) for men and 60 to 64 Years (173 | 20.7%) for women.
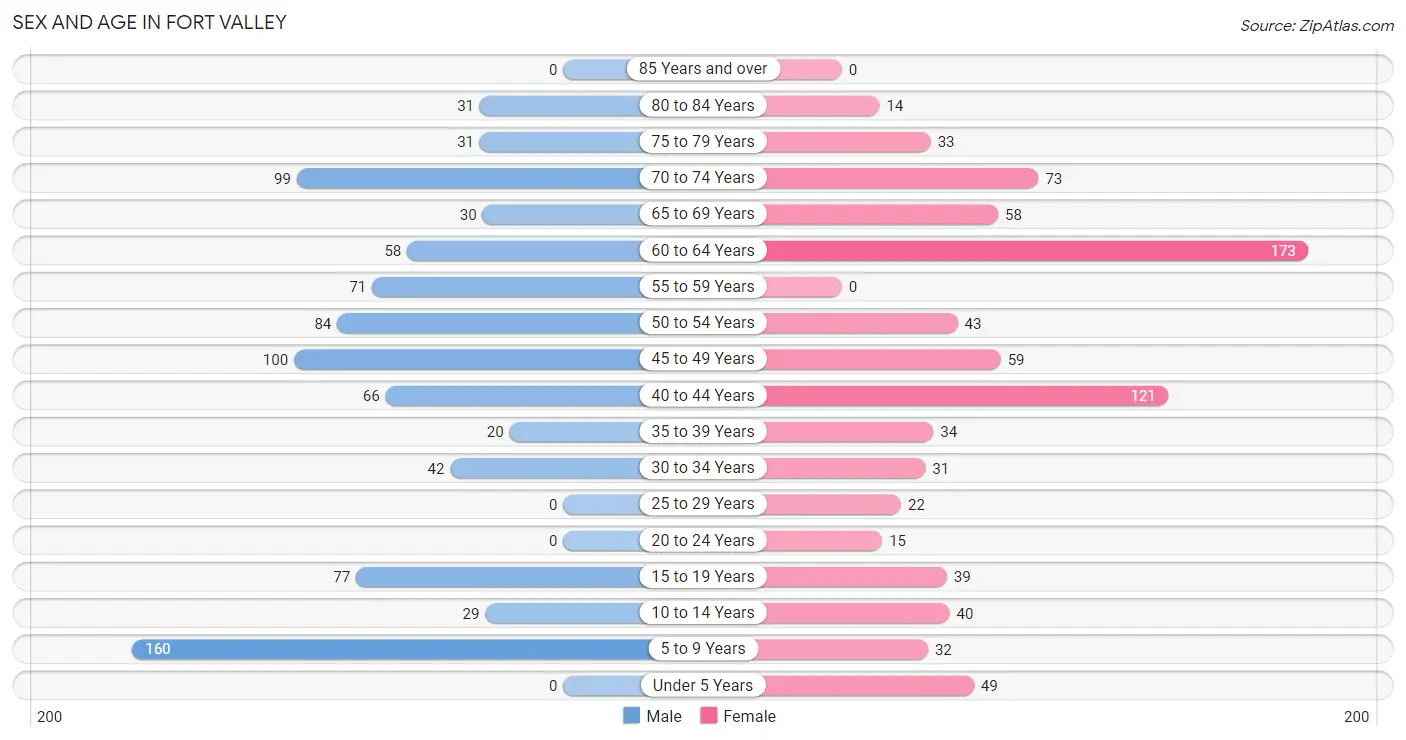
| Age Bracket | Male | Female |
| Under 5 Years | 0 (0.0%) | 49 (5.9%) |
| 5 to 9 Years | 160 (17.8%) | 32 (3.8%) |
| 10 to 14 Years | 29 (3.2%) | 40 (4.8%) |
| 15 to 19 Years | 77 (8.6%) | 39 (4.7%) |
| 20 to 24 Years | 0 (0.0%) | 15 (1.8%) |
| 25 to 29 Years | 0 (0.0%) | 22 (2.6%) |
| 30 to 34 Years | 42 (4.7%) | 31 (3.7%) |
| 35 to 39 Years | 20 (2.2%) | 34 (4.1%) |
| 40 to 44 Years | 66 (7.3%) | 121 (14.5%) |
| 45 to 49 Years | 100 (11.1%) | 59 (7.1%) |
| 50 to 54 Years | 84 (9.3%) | 43 (5.1%) |
| 55 to 59 Years | 71 (7.9%) | 0 (0.0%) |
| 60 to 64 Years | 58 (6.5%) | 173 (20.7%) |
| 65 to 69 Years | 30 (3.3%) | 58 (6.9%) |
| 70 to 74 Years | 99 (11.0%) | 73 (8.7%) |
| 75 to 79 Years | 31 (3.5%) | 33 (4.0%) |
| 80 to 84 Years | 31 (3.5%) | 14 (1.7%) |
| 85 Years and over | 0 (0.0%) | 0 (0.0%) |
| Total | 898 (100.0%) | 836 (100.0%) |
Families and Households in Fort Valley
Median Family Size in Fort Valley
The median family size in Fort Valley is 2.71 persons per family, with married-couple families (497 | 83.7%) accounting for the largest median family size of 2.78 persons per family. On the other hand, single female/mother families (22 | 3.7%) represent the smallest median family size with 1.68 persons per family.
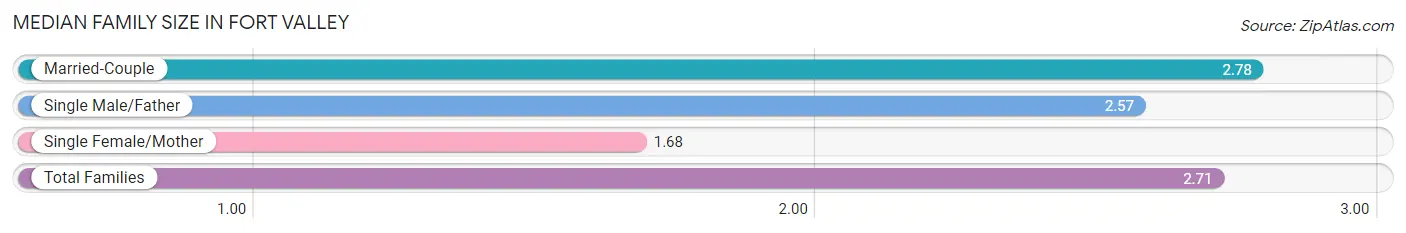
| Family Type | # Families | Family Size |
| Married-Couple | 497 (83.7%) | 2.78 |
| Single Male/Father | 75 (12.6%) | 2.57 |
| Single Female/Mother | 22 (3.7%) | 1.68 |
| Total Families | 594 (100.0%) | 2.71 |
Median Household Size in Fort Valley
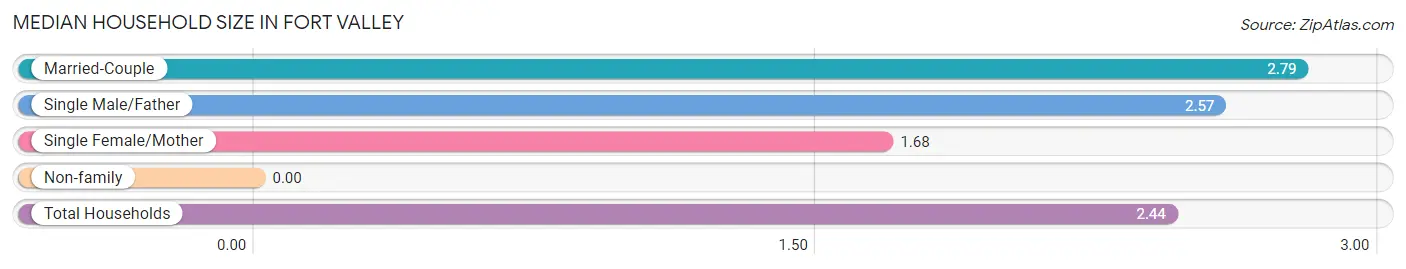
| Household Type | # Households | Household Size |
| Married-Couple | 497 (69.8%) | 2.79 |
| Single Male/Father | 75 (10.5%) | 2.57 |
| Single Female/Mother | 22 (3.1%) | 1.68 |
| Non-family | 118 (16.6%) | - |
| Total Households | 712 (100.0%) | 2.44 |
Household Size by Marriage Status in Fort Valley
Out of a total of 712 households in Fort Valley, 594 (83.4%) are family households, while 118 (16.6%) are nonfamily households. The most numerous type of family households are 2-person households, comprising 371, and the most common type of nonfamily households are 1-person households, comprising 118.
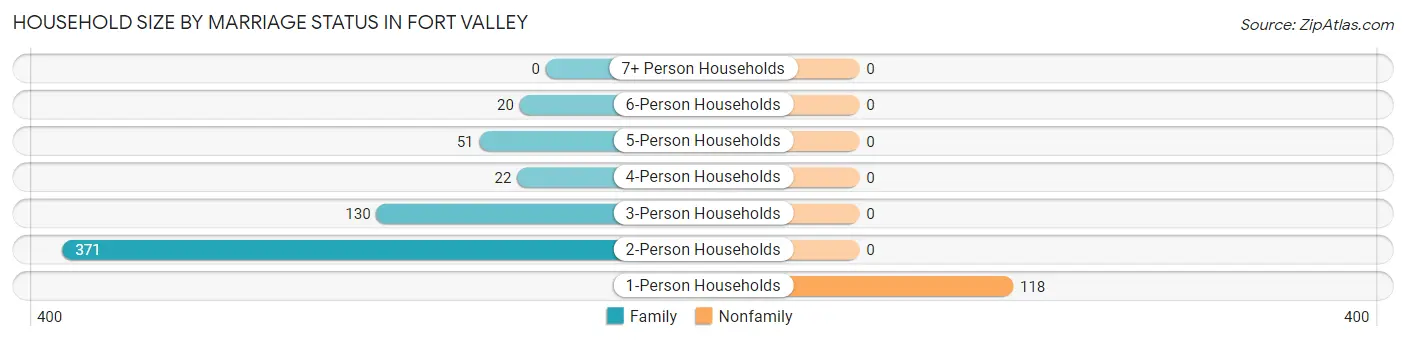
| Household Size | Family Households | Nonfamily Households |
| 1-Person Households | - | 118 (16.6%) |
| 2-Person Households | 371 (52.1%) | 0 (0.0%) |
| 3-Person Households | 130 (18.3%) | 0 (0.0%) |
| 4-Person Households | 22 (3.1%) | 0 (0.0%) |
| 5-Person Households | 51 (7.2%) | 0 (0.0%) |
| 6-Person Households | 20 (2.8%) | 0 (0.0%) |
| 7+ Person Households | 0 (0.0%) | 0 (0.0%) |
| Total | 594 (83.4%) | 118 (16.6%) |
Female Fertility in Fort Valley
Fertility by Age in Fort Valley
| Age Bracket | Women with Births | Births / 1,000 Women |
| 15 to 19 years | 0 (0.0%) | 0.0 |
| 20 to 34 years | 0 (0.0%) | 0.0 |
| 35 to 50 years | 0 (0.0%) | 0.0 |
| Total | 0 (0.0%) | 0.0 |
Fertility by Age by Marriage Status in Fort Valley
| Age Bracket | Married | Unmarried |
| 15 to 19 years | 0 (0.0%) | 0 (0.0%) |
| 20 to 34 years | 0 (0.0%) | 0 (0.0%) |
| 35 to 50 years | 0 (0.0%) | 0 (0.0%) |
| Total | 0 (0.0%) | 0 (0.0%) |
Fertility by Education in Fort Valley
| Educational Attainment | Women with Births | Births / 1,000 Women |
| Less than High School | 0 (0.0%) | 0.0 |
| High School Diploma | 0 (0.0%) | 0.0 |
| College or Associate's Degree | 0 (0.0%) | 0.0 |
| Bachelor's Degree | 0 (0.0%) | 0.0 |
| Graduate Degree | 0 (0.0%) | 0.0 |
| Total | 0 (0.0%) | 0.0 |
Fertility by Education by Marriage Status in Fort Valley
| Educational Attainment | Married | Unmarried |
| Less than High School | 0 (0.0%) | 0 (0.0%) |
| High School Diploma | 0 (0.0%) | 0 (0.0%) |
| College or Associate's Degree | 0 (0.0%) | 0 (0.0%) |
| Bachelor's Degree | 0 (0.0%) | 0 (0.0%) |
| Graduate Degree | 0 (0.0%) | 0 (0.0%) |
| Total | 0 (0.0%) | 0 (0.0%) |
Income in Fort Valley
Income Overview in Fort Valley
Per Capita Income in Fort Valley is $80,256, while median incomes of families and households are $152,976 and $138,824 respectively.
| Characteristic | Number | Measure |
| Per Capita Income | 1,734 | $80,256 |
| Median Family Income | 594 | $152,976 |
| Mean Family Income | 594 | $215,841 |
| Median Household Income | 712 | $138,824 |
| Mean Household Income | 712 | $190,754 |
| Income Deficit | 594 | $0 |
| Wage / Income Gap (%) | 1,734 | 55.11% |
| Wage / Income Gap ($) | 1,734 | 44.89¢ per $1 |
| Gini / Inequality Index | 1,734 | 0.48 |
Earnings by Sex in Fort Valley
Average Earnings in Fort Valley are $113,920, $117,340 for men and $52,679 for women, a difference of 55.1%.
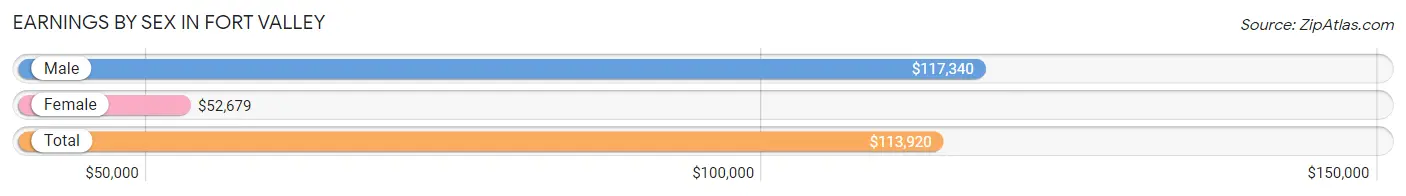
| Sex | Number | Average Earnings |
| Male | 430 (56.5%) | $117,340 |
| Female | 331 (43.5%) | $52,679 |
| Total | 761 (100.0%) | $113,920 |
Earnings by Sex by Income Bracket in Fort Valley
The most common earnings brackets in Fort Valley are $100,000+ for men (288 | 67.0%) and $100,000+ for women (105 | 31.7%).
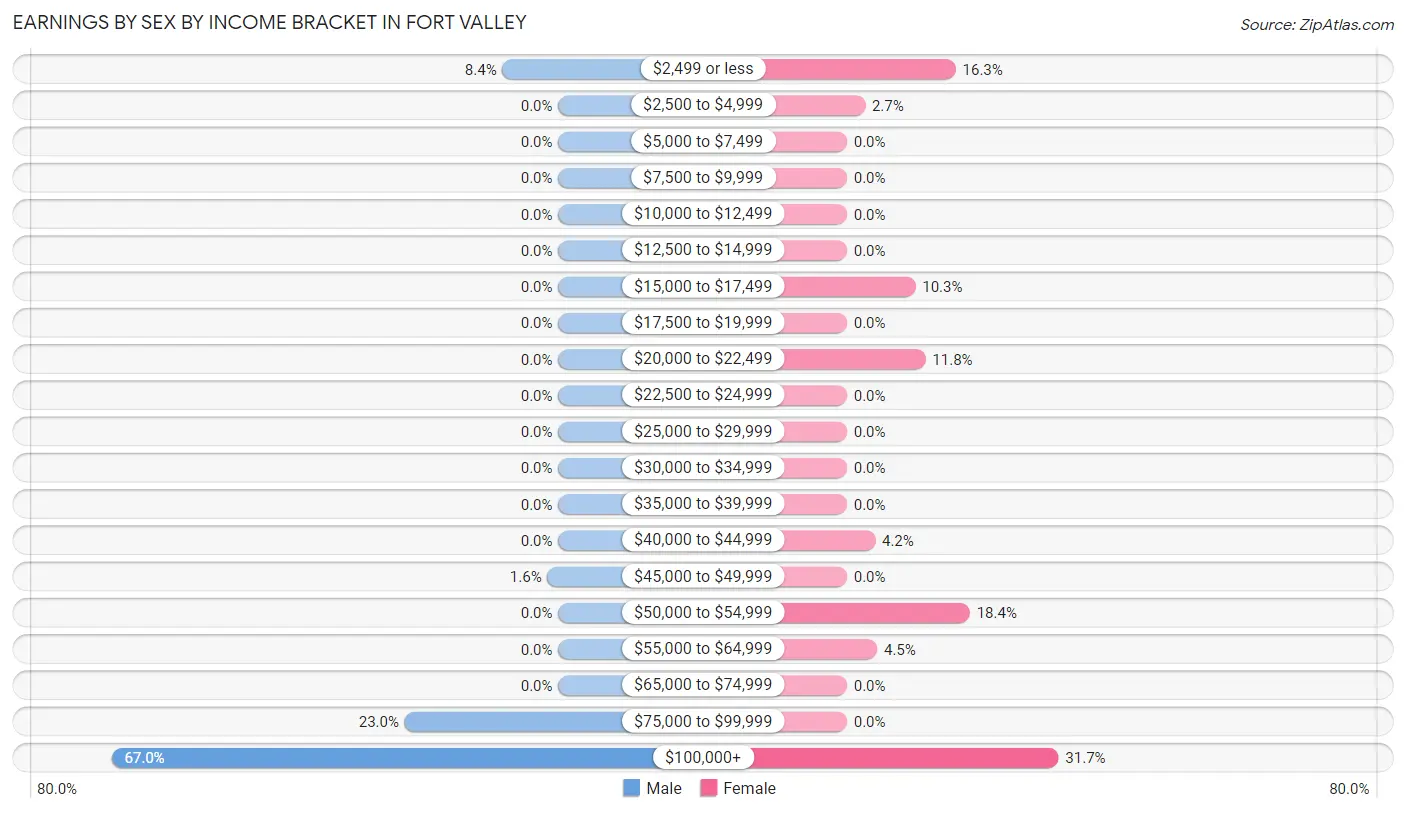
| Income | Male | Female |
| $2,499 or less | 36 (8.4%) | 54 (16.3%) |
| $2,500 to $4,999 | 0 (0.0%) | 9 (2.7%) |
| $5,000 to $7,499 | 0 (0.0%) | 0 (0.0%) |
| $7,500 to $9,999 | 0 (0.0%) | 0 (0.0%) |
| $10,000 to $12,499 | 0 (0.0%) | 0 (0.0%) |
| $12,500 to $14,999 | 0 (0.0%) | 0 (0.0%) |
| $15,000 to $17,499 | 0 (0.0%) | 34 (10.3%) |
| $17,500 to $19,999 | 0 (0.0%) | 0 (0.0%) |
| $20,000 to $22,499 | 0 (0.0%) | 39 (11.8%) |
| $22,500 to $24,999 | 0 (0.0%) | 0 (0.0%) |
| $25,000 to $29,999 | 0 (0.0%) | 0 (0.0%) |
| $30,000 to $34,999 | 0 (0.0%) | 0 (0.0%) |
| $35,000 to $39,999 | 0 (0.0%) | 0 (0.0%) |
| $40,000 to $44,999 | 0 (0.0%) | 14 (4.2%) |
| $45,000 to $49,999 | 7 (1.6%) | 0 (0.0%) |
| $50,000 to $54,999 | 0 (0.0%) | 61 (18.4%) |
| $55,000 to $64,999 | 0 (0.0%) | 15 (4.5%) |
| $65,000 to $74,999 | 0 (0.0%) | 0 (0.0%) |
| $75,000 to $99,999 | 99 (23.0%) | 0 (0.0%) |
| $100,000+ | 288 (67.0%) | 105 (31.7%) |
| Total | 430 (100.0%) | 331 (100.0%) |
Earnings by Sex by Educational Attainment in Fort Valley
Average earnings in Fort Valley are $118,250 for men and $53,291 for women, a difference of 54.9%. Men with an educational attainment of college or associate's degree enjoy the highest average annual earnings of $136,507, while those with bachelor's degree education earn the least with $115,144. Women with an educational attainment of graduate degree earn the most with the average annual earnings of $53,546, while those with graduate degree education have the smallest earnings of $53,546.
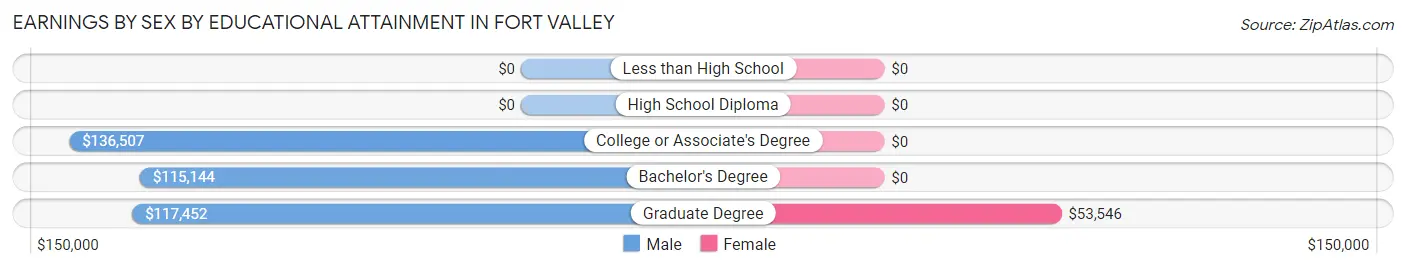
| Educational Attainment | Male Income | Female Income |
| Less than High School | - | - |
| High School Diploma | - | - |
| College or Associate's Degree | $136,507 | $0 |
| Bachelor's Degree | $115,144 | $0 |
| Graduate Degree | $117,452 | $53,546 |
| Total | $118,250 | $53,291 |
Family Income in Fort Valley
Family Income Brackets in Fort Valley
According to the Fort Valley family income data, there are 253 families falling into the $200,000+ income range, which is the most common income bracket and makes up 42.6% of all families.
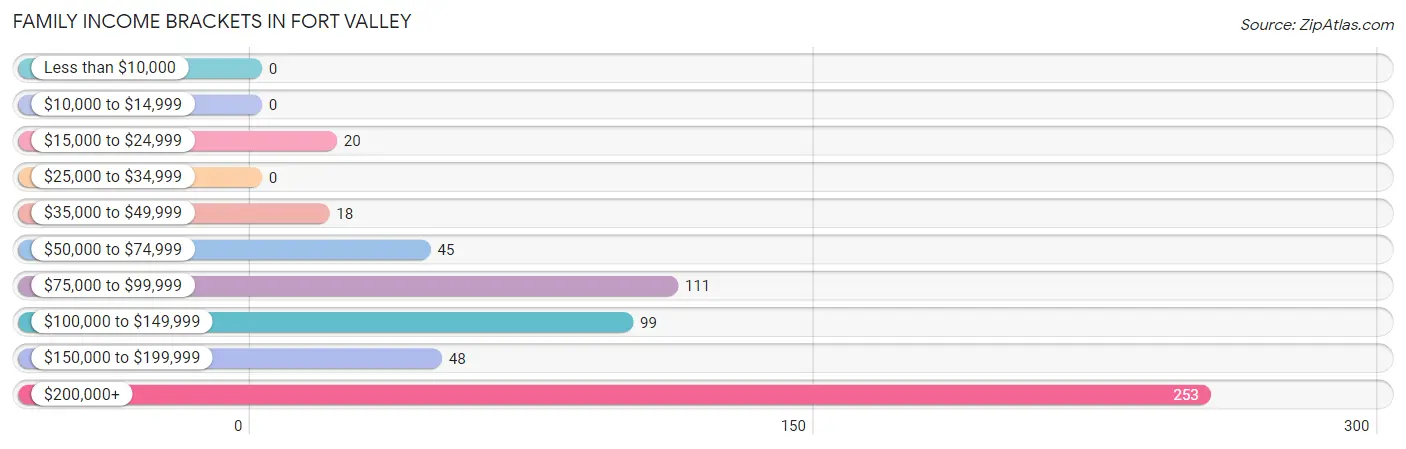
| Income Bracket | # Families | % Families |
| Less than $10,000 | 0 | 0.0% |
| $10,000 to $14,999 | 0 | 0.0% |
| $15,000 to $24,999 | 20 | 3.4% |
| $25,000 to $34,999 | 0 | 0.0% |
| $35,000 to $49,999 | 18 | 3.0% |
| $50,000 to $74,999 | 45 | 7.6% |
| $75,000 to $99,999 | 111 | 18.7% |
| $100,000 to $149,999 | 99 | 16.7% |
| $150,000 to $199,999 | 48 | 8.1% |
| $200,000+ | 253 | 42.6% |
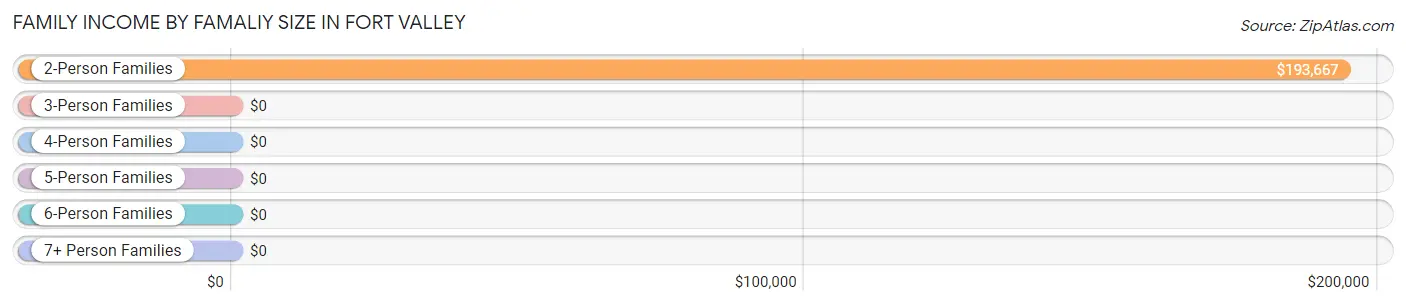
Family Income by Famaliy Size in Fort Valley
2-person families (378 | 63.6%) account for the highest median family income in Fort Valley with $193,667 per family, while 2-person families (378 | 63.6%) have the highest median income of $96,834 per family member.
| Income Bracket | # Families | Median Income |
| 2-Person Families | 378 (63.6%) | $193,667 |
| 3-Person Families | 123 (20.7%) | $0 |
| 4-Person Families | 22 (3.7%) | $0 |
| 5-Person Families | 51 (8.6%) | $0 |
| 6-Person Families | 20 (3.4%) | $0 |
| 7+ Person Families | 0 (0.0%) | $0 |
| Total | 594 (100.0%) | $152,976 |
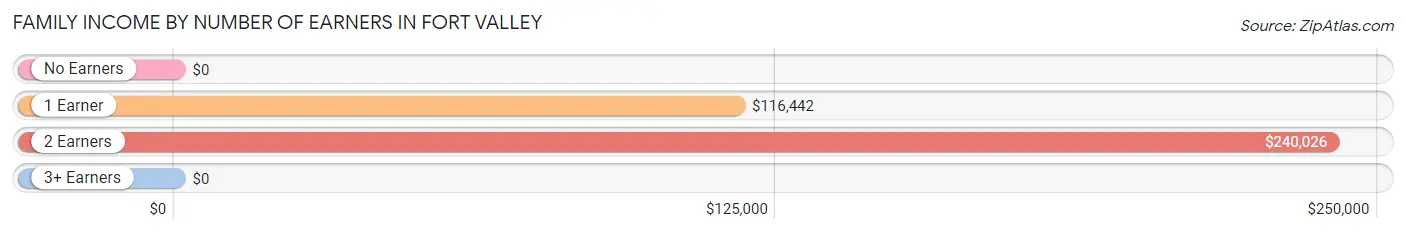
Family Income by Number of Earners in Fort Valley
| Number of Earners | # Families | Median Income |
| No Earners | 145 (24.4%) | $0 |
| 1 Earner | 226 (38.1%) | $116,442 |
| 2 Earners | 211 (35.5%) | $240,026 |
| 3+ Earners | 12 (2.0%) | $0 |
| Total | 594 (100.0%) | $152,976 |
Household Income in Fort Valley
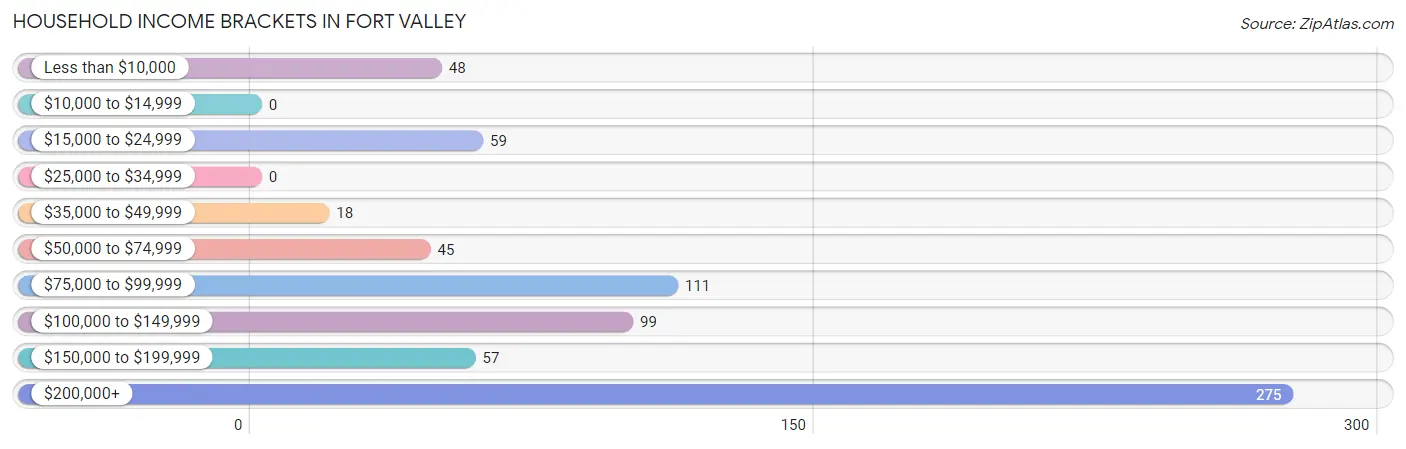
Household Income Brackets in Fort Valley
With 275 households falling in the category, the $200,000+ income range is the most frequent in Fort Valley, accounting for 38.6% of all households.
| Income Bracket | # Households | % Households |
| Less than $10,000 | 48 | 6.7% |
| $10,000 to $14,999 | 0 | 0.0% |
| $15,000 to $24,999 | 59 | 8.3% |
| $25,000 to $34,999 | 0 | 0.0% |
| $35,000 to $49,999 | 18 | 2.5% |
| $50,000 to $74,999 | 45 | 6.3% |
| $75,000 to $99,999 | 111 | 15.6% |
| $100,000 to $149,999 | 99 | 13.9% |
| $150,000 to $199,999 | 57 | 8.0% |
| $200,000+ | 275 | 38.6% |
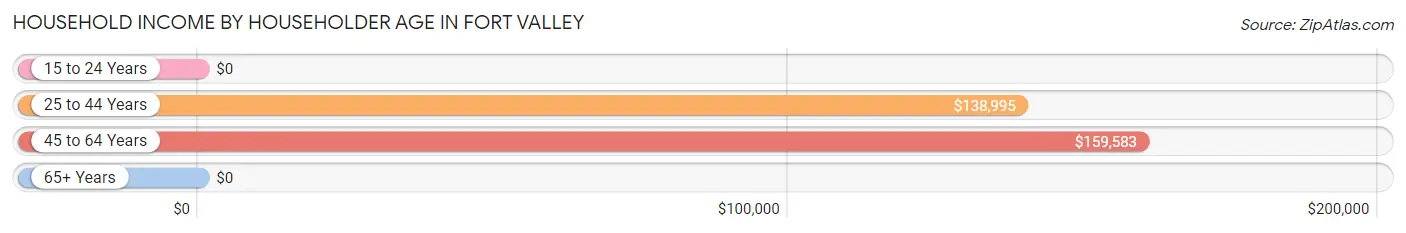
Household Income by Householder Age in Fort Valley
The median household income in Fort Valley is $138,824, with the highest median household income of $159,583 found in the 45 to 64 years age bracket for the primary householder. A total of 348 households (48.9%) fall into this category.
| Income Bracket | # Households | Median Income |
| 15 to 24 Years | 0 (0.0%) | $0 |
| 25 to 44 Years | 179 (25.1%) | $138,995 |
| 45 to 64 Years | 348 (48.9%) | $159,583 |
| 65+ Years | 185 (26.0%) | $0 |
| Total | 712 (100.0%) | $138,824 |
Poverty in Fort Valley
Income Below Poverty by Sex and Age in Fort Valley
With 2.9% poverty level for males and 8.4% for females among the residents of Fort Valley, 25 to 34 year old males and 25 to 34 year old females are the most vulnerable to poverty, with 20 males (47.6%) and 22 females (41.5%) in their respective age groups living below the poverty level.
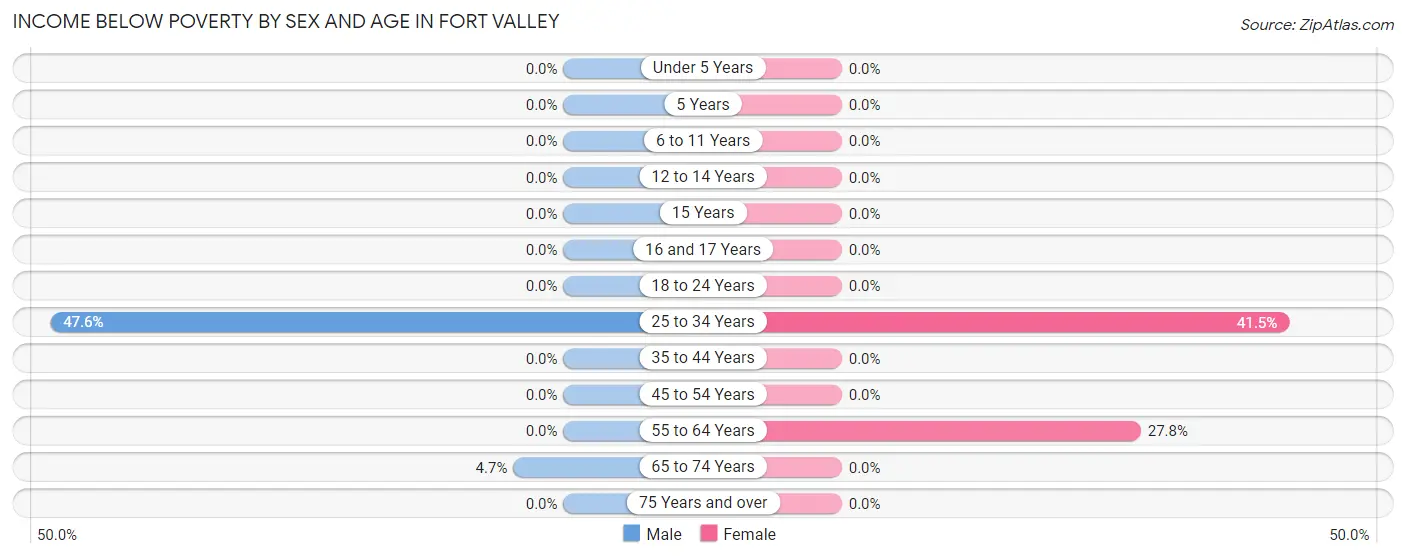
| Age Bracket | Male | Female |
| Under 5 Years | 0 (0.0%) | 0 (0.0%) |
| 5 Years | 0 (0.0%) | 0 (0.0%) |
| 6 to 11 Years | 0 (0.0%) | 0 (0.0%) |
| 12 to 14 Years | 0 (0.0%) | 0 (0.0%) |
| 15 Years | 0 (0.0%) | 0 (0.0%) |
| 16 and 17 Years | 0 (0.0%) | 0 (0.0%) |
| 18 to 24 Years | 0 (0.0%) | 0 (0.0%) |
| 25 to 34 Years | 20 (47.6%) | 22 (41.5%) |
| 35 to 44 Years | 0 (0.0%) | 0 (0.0%) |
| 45 to 54 Years | 0 (0.0%) | 0 (0.0%) |
| 55 to 64 Years | 0 (0.0%) | 48 (27.8%) |
| 65 to 74 Years | 6 (4.6%) | 0 (0.0%) |
| 75 Years and over | 0 (0.0%) | 0 (0.0%) |
| Total | 26 (2.9%) | 70 (8.4%) |
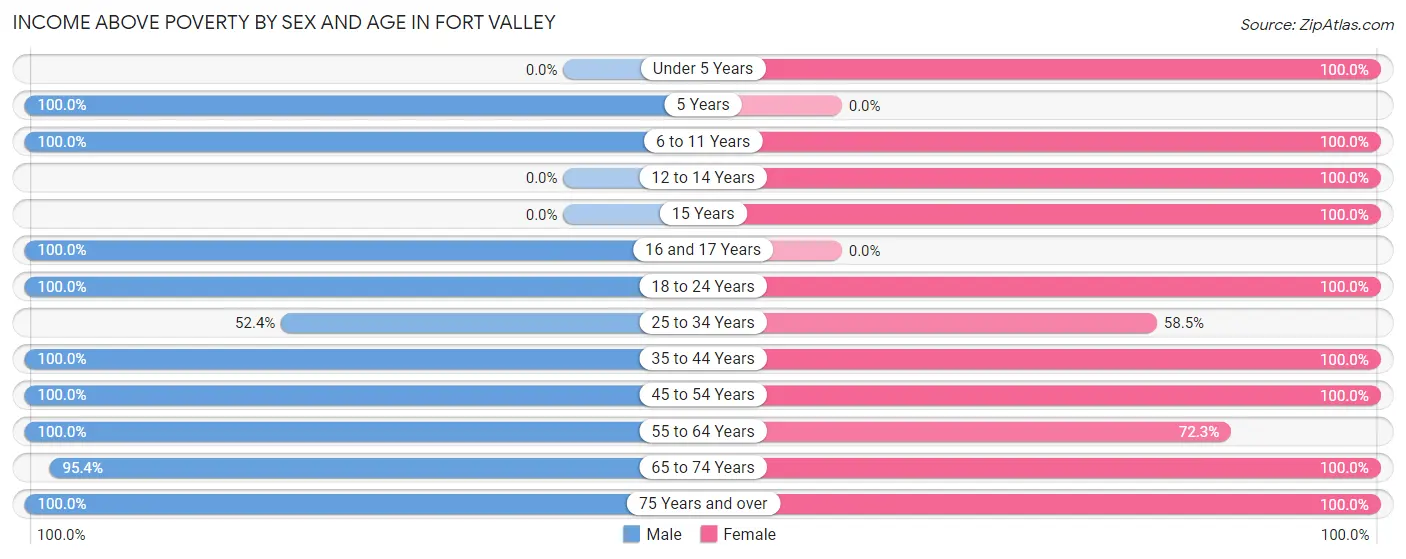
Income Above Poverty by Sex and Age in Fort Valley
According to the poverty statistics in Fort Valley, males aged 5 years and females aged under 5 years are the age groups that are most secure financially, with 100.0% of males and 100.0% of females in these age groups living above the poverty line.
| Age Bracket | Male | Female |
| Under 5 Years | 0 (0.0%) | 49 (100.0%) |
| 5 Years | 37 (100.0%) | 0 (0.0%) |
| 6 to 11 Years | 152 (100.0%) | 32 (100.0%) |
| 12 to 14 Years | 0 (0.0%) | 40 (100.0%) |
| 15 Years | 0 (0.0%) | 30 (100.0%) |
| 16 and 17 Years | 53 (100.0%) | 0 (0.0%) |
| 18 to 24 Years | 24 (100.0%) | 24 (100.0%) |
| 25 to 34 Years | 22 (52.4%) | 31 (58.5%) |
| 35 to 44 Years | 86 (100.0%) | 155 (100.0%) |
| 45 to 54 Years | 184 (100.0%) | 102 (100.0%) |
| 55 to 64 Years | 129 (100.0%) | 125 (72.3%) |
| 65 to 74 Years | 123 (95.4%) | 131 (100.0%) |
| 75 Years and over | 62 (100.0%) | 47 (100.0%) |
| Total | 872 (97.1%) | 766 (91.6%) |
Income Below Poverty Among Married-Couple Families in Fort Valley
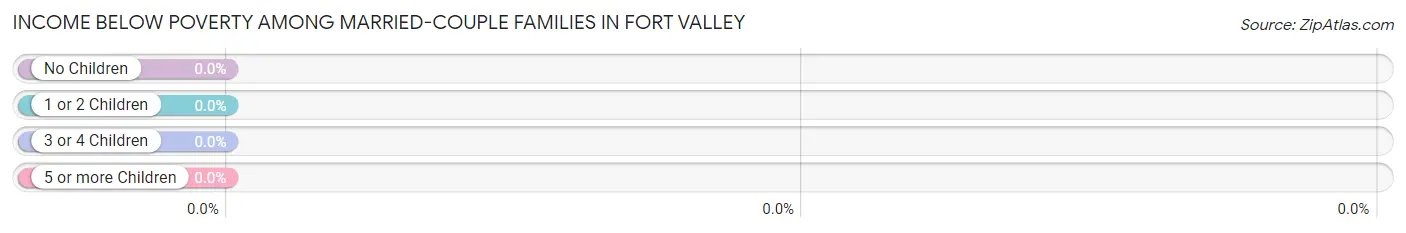
| Children | Above Poverty | Below Poverty |
| No Children | 375 (100.0%) | 0 (0.0%) |
| 1 or 2 Children | 51 (100.0%) | 0 (0.0%) |
| 3 or 4 Children | 71 (100.0%) | 0 (0.0%) |
| 5 or more Children | 0 (0.0%) | 0 (0.0%) |
| Total | 497 (100.0%) | 0 (0.0%) |
Income Below Poverty Among Single-Parent Households in Fort Valley
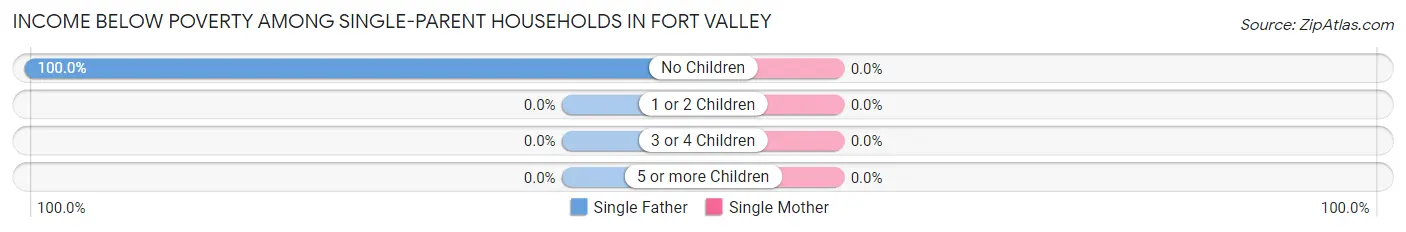
| Children | Single Father | Single Mother |
| No Children | 20 (100.0%) | 0 (0.0%) |
| 1 or 2 Children | 0 (0.0%) | 0 (0.0%) |
| 3 or 4 Children | 0 (0.0%) | 0 (0.0%) |
| 5 or more Children | 0 (0.0%) | 0 (0.0%) |
| Total | 20 (26.7%) | 0 (0.0%) |
Income Below Poverty Among Married-Couple vs Single-Parent Households in Fort Valley
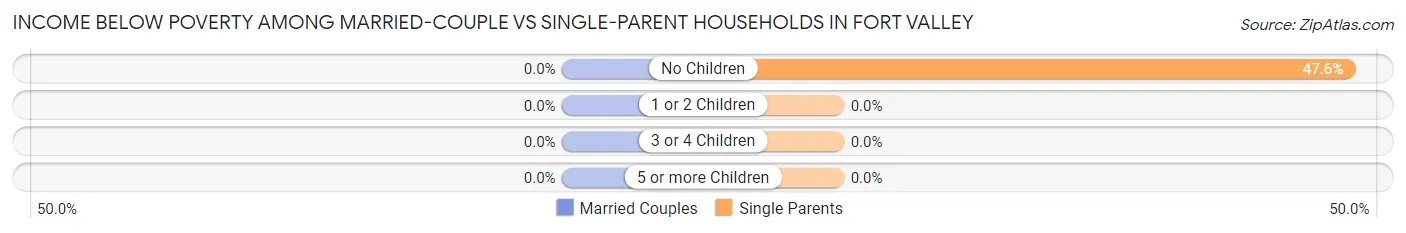
| Children | Married-Couple Families | Single-Parent Households |
| No Children | 0 (0.0%) | 20 (47.6%) |
| 1 or 2 Children | 0 (0.0%) | 0 (0.0%) |
| 3 or 4 Children | 0 (0.0%) | 0 (0.0%) |
| 5 or more Children | 0 (0.0%) | 0 (0.0%) |
| Total | 0 (0.0%) | 20 (20.6%) |
Employment Characteristics in Fort Valley
Employment by Class of Employer in Fort Valley
Among the 661 employed individuals in Fort Valley, private company employees (249 | 37.7%), state government employees (153 | 23.2%), and not-for-profit organizations (138 | 20.9%) make up the most common classes of employment.
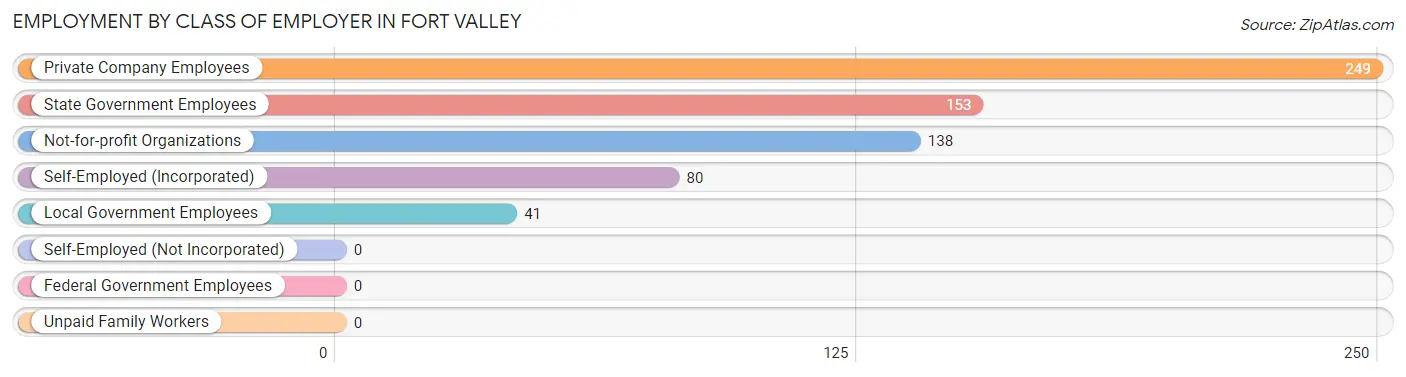
| Employer Class | # Employees | % Employees |
| Private Company Employees | 249 | 37.7% |
| Self-Employed (Incorporated) | 80 | 12.1% |
| Self-Employed (Not Incorporated) | 0 | 0.0% |
| Not-for-profit Organizations | 138 | 20.9% |
| Local Government Employees | 41 | 6.2% |
| State Government Employees | 153 | 23.2% |
| Federal Government Employees | 0 | 0.0% |
| Unpaid Family Workers | 0 | 0.0% |
| Total | 661 | 100.0% |
Employment Status by Age in Fort Valley
According to the labor force statistics for Fort Valley, out of the total population over 16 years of age (1,394), 51.3% or 715 individuals are in the labor force, with 3.1% or 22 of them unemployed. The age group with the highest labor force participation rate is 20 to 24 years, with 100.0% or 15 individuals in the labor force. Within the labor force, the 25 to 29 years age range has the highest percentage of unemployed individuals, with 100.0% or 22 of them being unemployed.
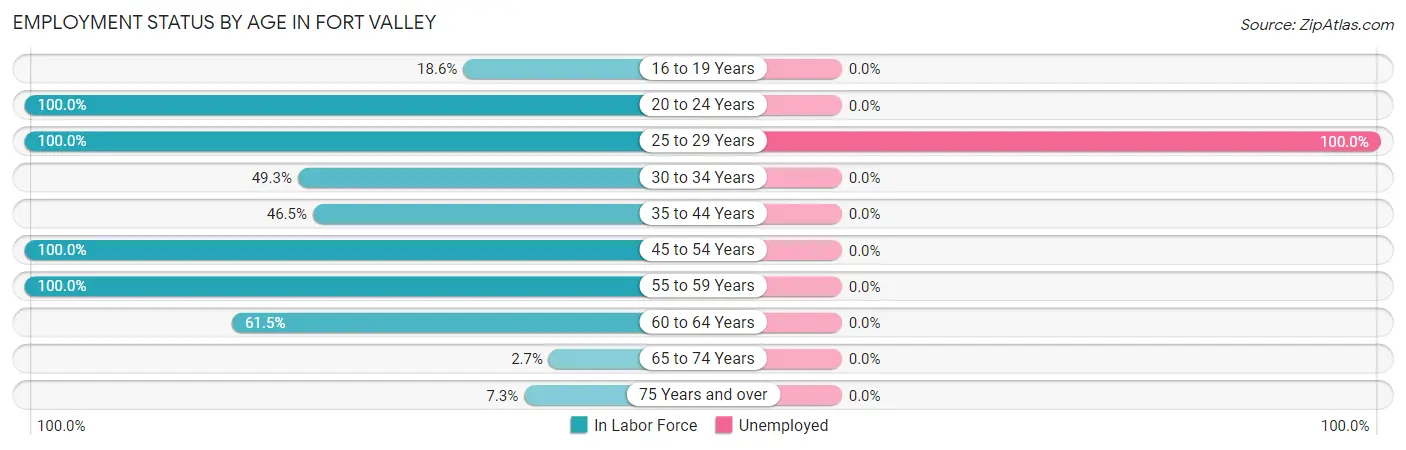
| Age Bracket | In Labor Force | Unemployed |
| 16 to 19 Years | 16 (18.6%) | 0 (0.0%) |
| 20 to 24 Years | 15 (100.0%) | 0 (0.0%) |
| 25 to 29 Years | 22 (100.0%) | 22 (100.0%) |
| 30 to 34 Years | 36 (49.3%) | 0 (0.0%) |
| 35 to 44 Years | 112 (46.5%) | 0 (0.0%) |
| 45 to 54 Years | 286 (100.0%) | 0 (0.0%) |
| 55 to 59 Years | 71 (100.0%) | 0 (0.0%) |
| 60 to 64 Years | 142 (61.5%) | 0 (0.0%) |
| 65 to 74 Years | 7 (2.7%) | 0 (0.0%) |
| 75 Years and over | 8 (7.3%) | 0 (0.0%) |
| Total | 715 (51.3%) | 22 (3.1%) |
Employment Status by Educational Attainment in Fort Valley
According to labor force statistics for Fort Valley, 72.4% of individuals (669) out of the total population between 25 and 64 years of age (924) are in the labor force, with 3.3% or 22 of them being unemployed. The group with the highest labor force participation rate are those with the educational attainment of college / associate degree, with 82.6% or 90 individuals in the labor force. Within the labor force, individuals with bachelor's degree or higher education have the highest percentage of unemployment, with 4.4% or 22 of them being unemployed.
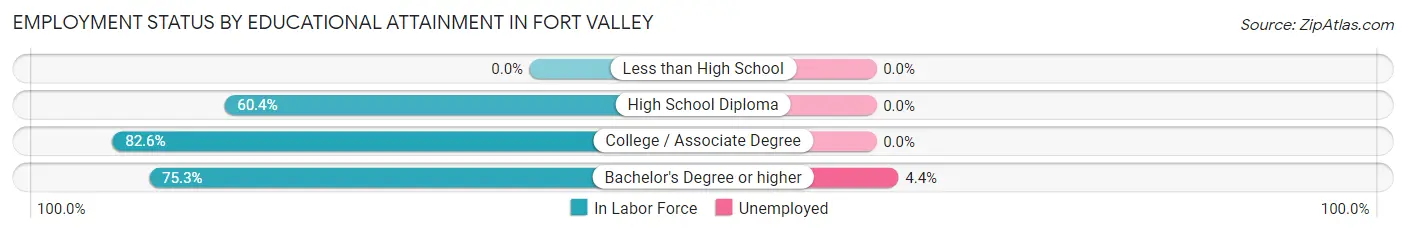
| Educational Attainment | In Labor Force | Unemployed |
| Less than High School | 0 (0.0%) | 0 (0.0%) |
| High School Diploma | 81 (60.4%) | 0 (0.0%) |
| College / Associate Degree | 90 (82.6%) | 0 (0.0%) |
| Bachelor's Degree or higher | 498 (75.3%) | 29 (4.4%) |
| Total | 669 (72.4%) | 30 (3.3%) |
Employment Occupations by Sex in Fort Valley
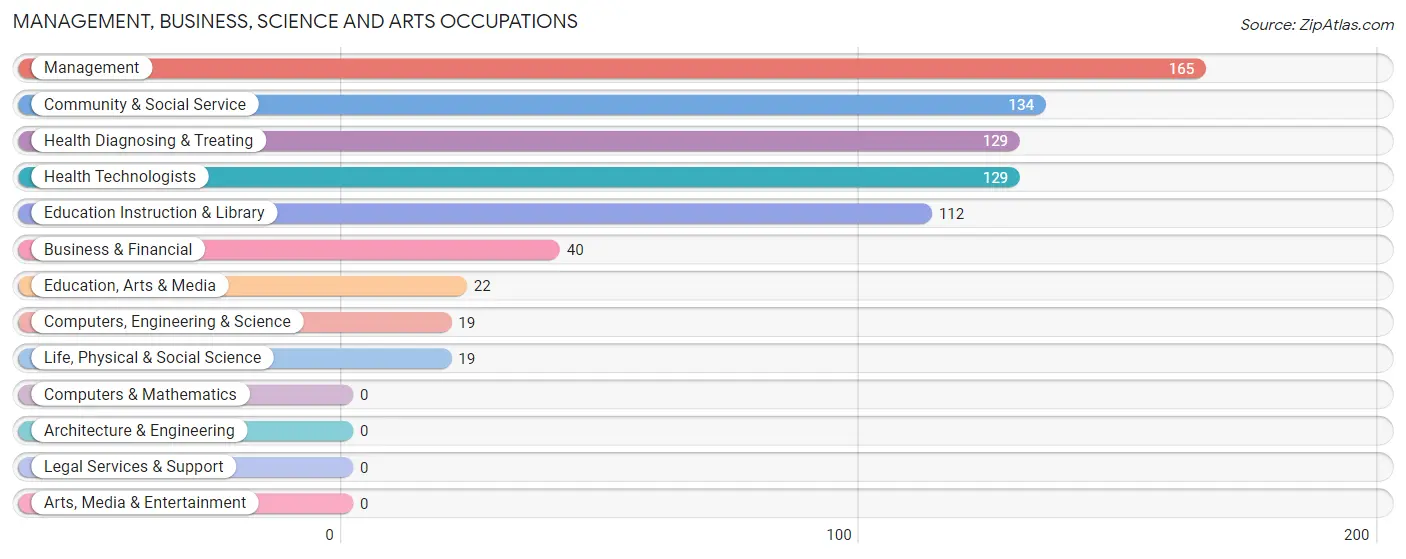
Management, Business, Science and Arts Occupations
The most common Management, Business, Science and Arts occupations in Fort Valley are Management (165 | 23.8%), Community & Social Service (134 | 19.3%), Health Diagnosing & Treating (129 | 18.6%), Health Technologists (129 | 18.6%), and Education Instruction & Library (112 | 16.2%).
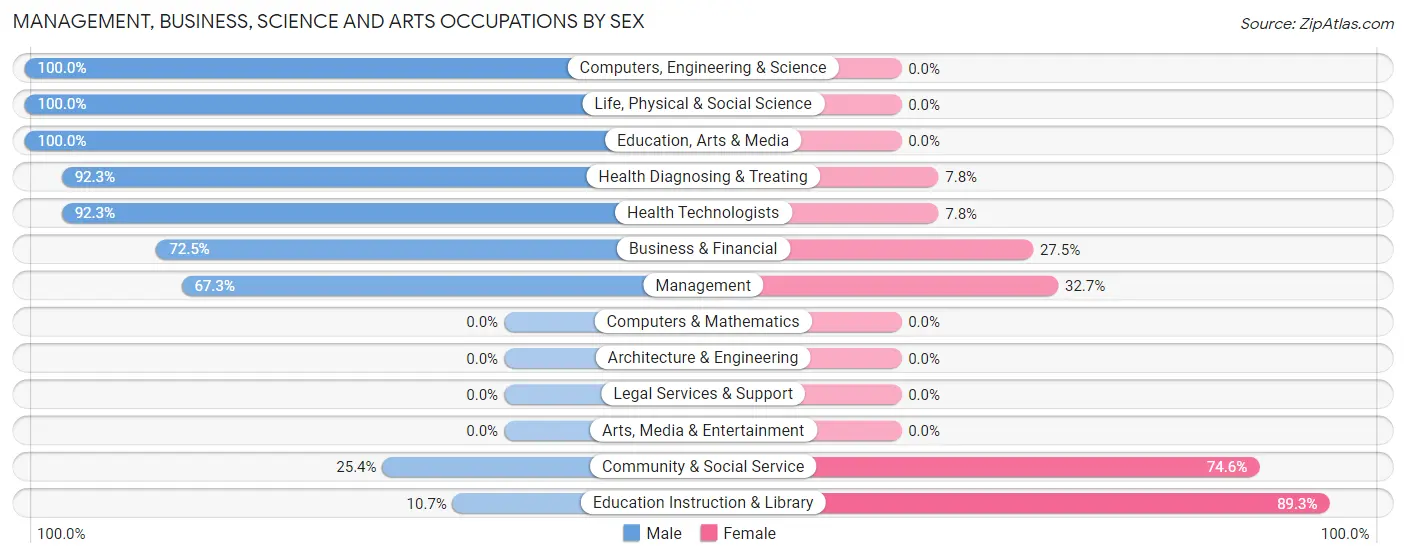
Management, Business, Science and Arts Occupations by Sex
Within the Management, Business, Science and Arts occupations in Fort Valley, the most male-oriented occupations are Computers, Engineering & Science (100.0%), Life, Physical & Social Science (100.0%), and Education, Arts & Media (100.0%), while the most female-oriented occupations are Education Instruction & Library (89.3%), Community & Social Service (74.6%), and Management (32.7%).
| Occupation | Male | Female |
| Management | 111 (67.3%) | 54 (32.7%) |
| Business & Financial | 29 (72.5%) | 11 (27.5%) |
| Computers, Engineering & Science | 19 (100.0%) | 0 (0.0%) |
| Computers & Mathematics | 0 (0.0%) | 0 (0.0%) |
| Architecture & Engineering | 0 (0.0%) | 0 (0.0%) |
| Life, Physical & Social Science | 19 (100.0%) | 0 (0.0%) |
| Community & Social Service | 34 (25.4%) | 100 (74.6%) |
| Education, Arts & Media | 22 (100.0%) | 0 (0.0%) |
| Legal Services & Support | 0 (0.0%) | 0 (0.0%) |
| Education Instruction & Library | 12 (10.7%) | 100 (89.3%) |
| Arts, Media & Entertainment | 0 (0.0%) | 0 (0.0%) |
| Health Diagnosing & Treating | 119 (92.2%) | 10 (7.7%) |
| Health Technologists | 119 (92.2%) | 10 (7.7%) |
| Total (Category) | 312 (64.1%) | 175 (35.9%) |
| Total (Overall) | 410 (59.2%) | 283 (40.8%) |
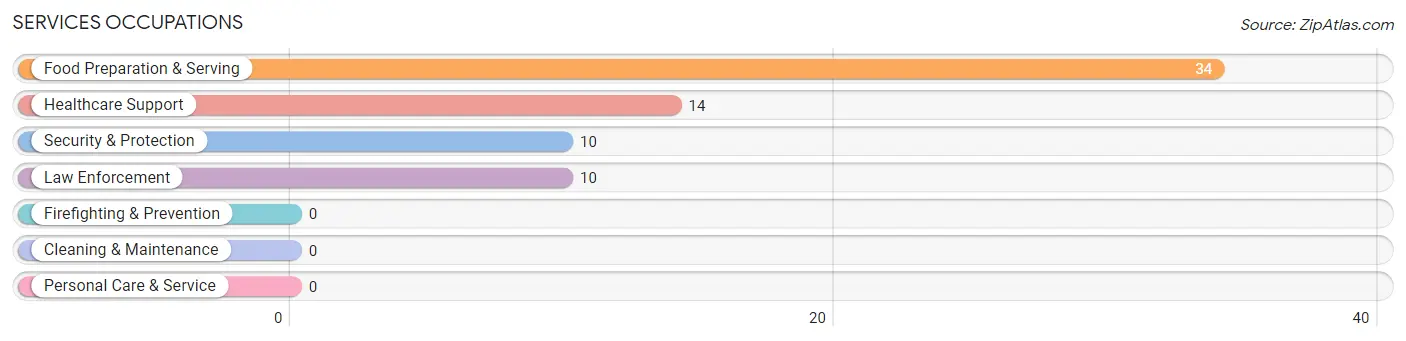
Services Occupations
The most common Services occupations in Fort Valley are Food Preparation & Serving (34 | 4.9%), Healthcare Support (14 | 2.0%), Security & Protection (10 | 1.4%), and Law Enforcement (10 | 1.4%).
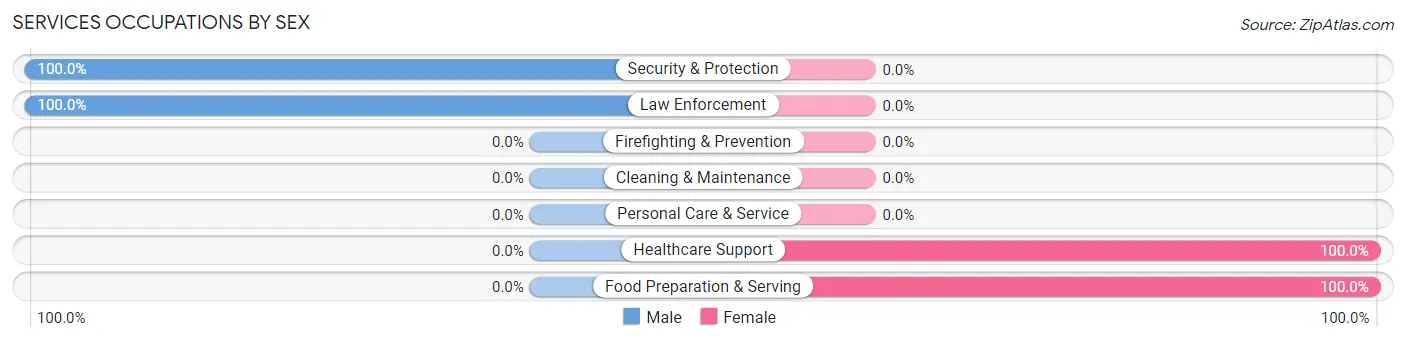
Services Occupations by Sex
Within the Services occupations in Fort Valley, the most male-oriented occupations are Security & Protection (100.0%), and Law Enforcement (100.0%), while the most female-oriented occupations are Healthcare Support (100.0%), and Food Preparation & Serving (100.0%).
| Occupation | Male | Female |
| Healthcare Support | 0 (0.0%) | 14 (100.0%) |
| Security & Protection | 10 (100.0%) | 0 (0.0%) |
| Firefighting & Prevention | 0 (0.0%) | 0 (0.0%) |
| Law Enforcement | 10 (100.0%) | 0 (0.0%) |
| Food Preparation & Serving | 0 (0.0%) | 34 (100.0%) |
| Cleaning & Maintenance | 0 (0.0%) | 0 (0.0%) |
| Personal Care & Service | 0 (0.0%) | 0 (0.0%) |
| Total (Category) | 10 (17.2%) | 48 (82.8%) |
| Total (Overall) | 410 (59.2%) | 283 (40.8%) |
Sales and Office Occupations
The most common Sales and Office occupations in Fort Valley are Sales & Related (46 | 6.6%), and Office & Administration (45 | 6.5%).
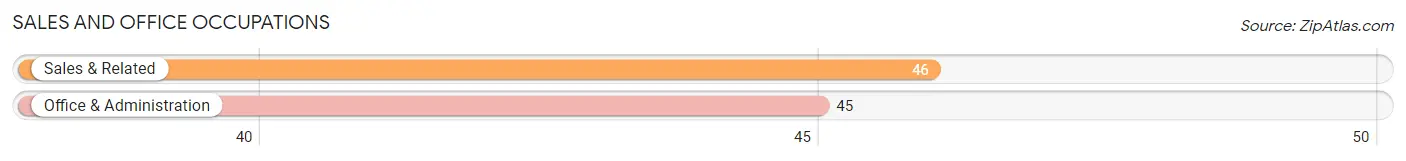
Sales and Office Occupations by Sex
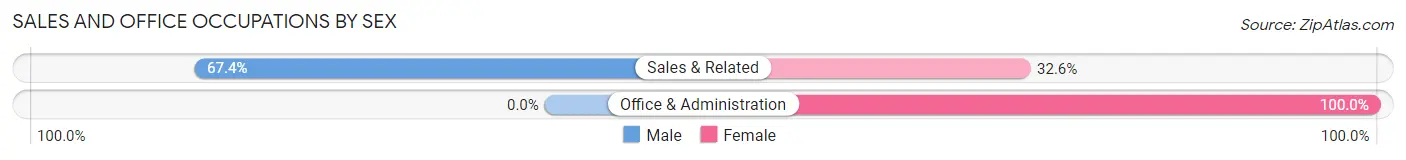
| Occupation | Male | Female |
| Sales & Related | 31 (67.4%) | 15 (32.6%) |
| Office & Administration | 0 (0.0%) | 45 (100.0%) |
| Total (Category) | 31 (34.1%) | 60 (65.9%) |
| Total (Overall) | 410 (59.2%) | 283 (40.8%) |
Natural Resources, Construction and Maintenance Occupations
The most common Natural Resources, Construction and Maintenance occupations in Fort Valley are , and Construction & Extraction (34 | 4.9%).
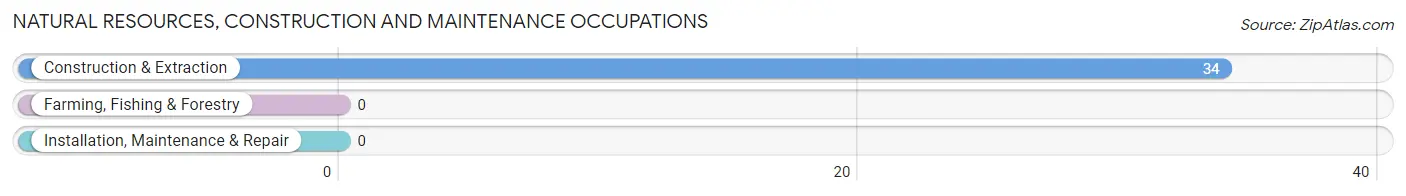
Natural Resources, Construction and Maintenance Occupations by Sex
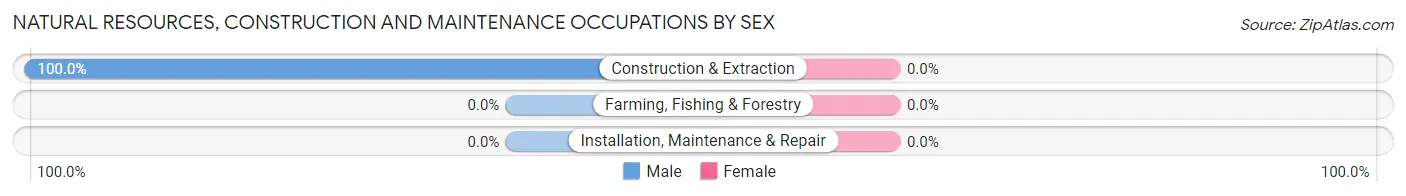
| Occupation | Male | Female |
| Farming, Fishing & Forestry | 0 (0.0%) | 0 (0.0%) |
| Construction & Extraction | 34 (100.0%) | 0 (0.0%) |
| Installation, Maintenance & Repair | 0 (0.0%) | 0 (0.0%) |
| Total (Category) | 34 (100.0%) | 0 (0.0%) |
| Total (Overall) | 410 (59.2%) | 283 (40.8%) |
Production, Transportation and Moving Occupations
The most common Production, Transportation and Moving occupations in Fort Valley are Production (16 | 2.3%), and Transportation (7 | 1.0%).
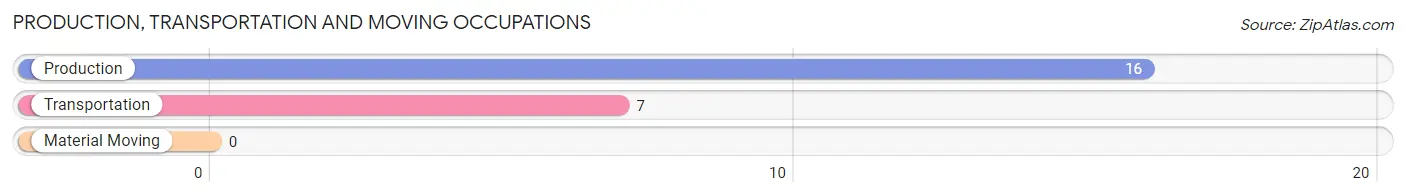
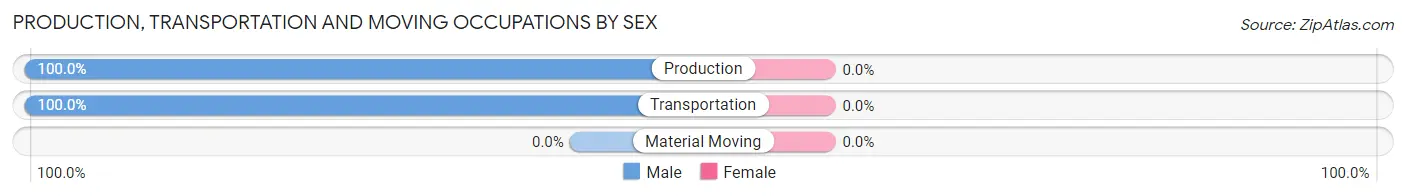
Production, Transportation and Moving Occupations by Sex
| Occupation | Male | Female |
| Production | 16 (100.0%) | 0 (0.0%) |
| Transportation | 7 (100.0%) | 0 (0.0%) |
| Material Moving | 0 (0.0%) | 0 (0.0%) |
| Total (Category) | 23 (100.0%) | 0 (0.0%) |
| Total (Overall) | 410 (59.2%) | 283 (40.8%) |
Employment Industries by Sex in Fort Valley
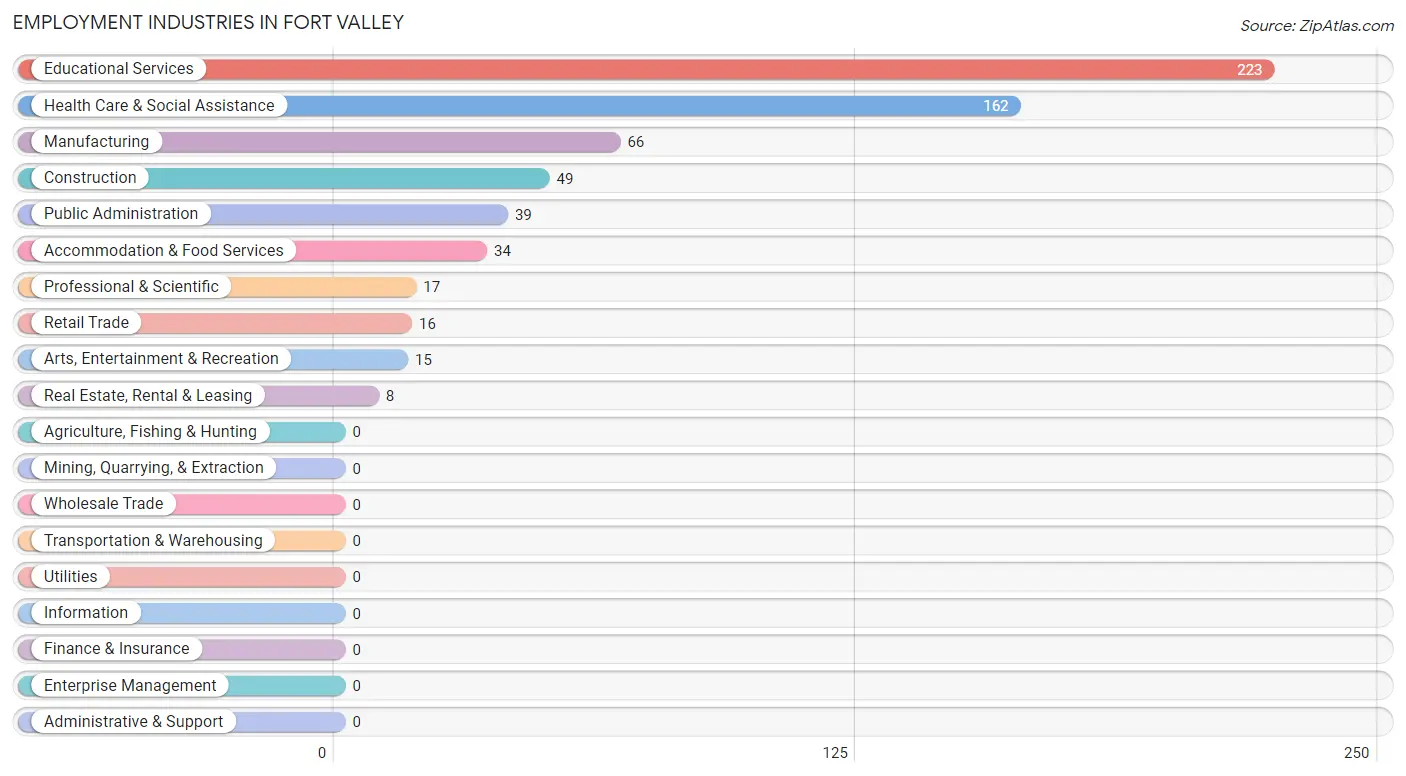
Employment Industries in Fort Valley
The major employment industries in Fort Valley include Educational Services (223 | 32.2%), Health Care & Social Assistance (162 | 23.4%), Manufacturing (66 | 9.5%), Construction (49 | 7.1%), and Public Administration (39 | 5.6%).
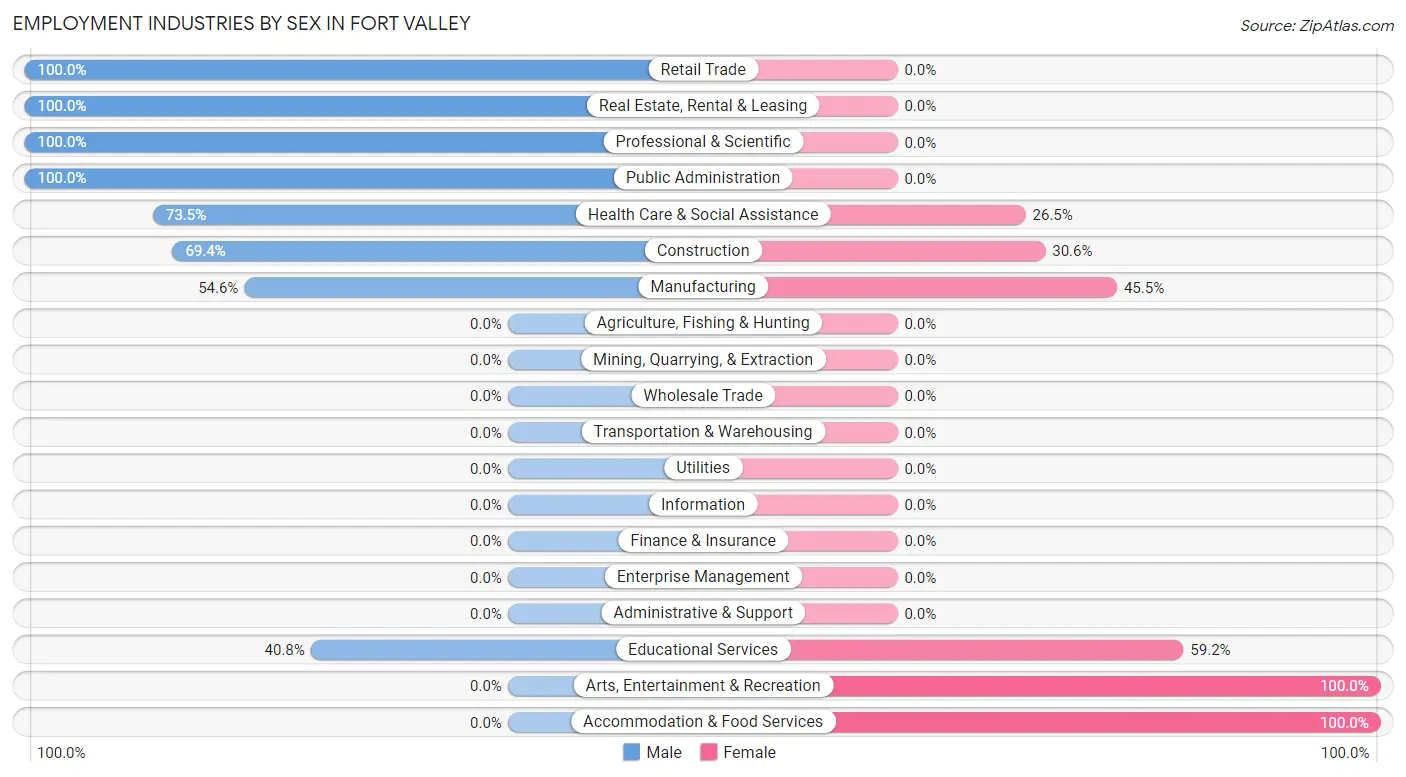
Employment Industries by Sex in Fort Valley
The Fort Valley industries that see more men than women are Retail Trade (100.0%), Real Estate, Rental & Leasing (100.0%), and Professional & Scientific (100.0%), whereas the industries that tend to have a higher number of women are Arts, Entertainment & Recreation (100.0%), Accommodation & Food Services (100.0%), and Educational Services (59.2%).
| Industry | Male | Female |
| Agriculture, Fishing & Hunting | 0 (0.0%) | 0 (0.0%) |
| Mining, Quarrying, & Extraction | 0 (0.0%) | 0 (0.0%) |
| Construction | 34 (69.4%) | 15 (30.6%) |
| Manufacturing | 36 (54.5%) | 30 (45.5%) |
| Wholesale Trade | 0 (0.0%) | 0 (0.0%) |
| Retail Trade | 16 (100.0%) | 0 (0.0%) |
| Transportation & Warehousing | 0 (0.0%) | 0 (0.0%) |
| Utilities | 0 (0.0%) | 0 (0.0%) |
| Information | 0 (0.0%) | 0 (0.0%) |
| Finance & Insurance | 0 (0.0%) | 0 (0.0%) |
| Real Estate, Rental & Leasing | 8 (100.0%) | 0 (0.0%) |
| Professional & Scientific | 17 (100.0%) | 0 (0.0%) |
| Enterprise Management | 0 (0.0%) | 0 (0.0%) |
| Administrative & Support | 0 (0.0%) | 0 (0.0%) |
| Educational Services | 91 (40.8%) | 132 (59.2%) |
| Health Care & Social Assistance | 119 (73.5%) | 43 (26.5%) |
| Arts, Entertainment & Recreation | 0 (0.0%) | 15 (100.0%) |
| Accommodation & Food Services | 0 (0.0%) | 34 (100.0%) |
| Public Administration | 39 (100.0%) | 0 (0.0%) |
| Total | 410 (59.2%) | 283 (40.8%) |
Education in Fort Valley
School Enrollment in Fort Valley
The most common levels of schooling among the 437 students in Fort Valley are elementary school (122 | 27.9%), high school (116 | 26.5%), and middle school (102 | 23.3%).
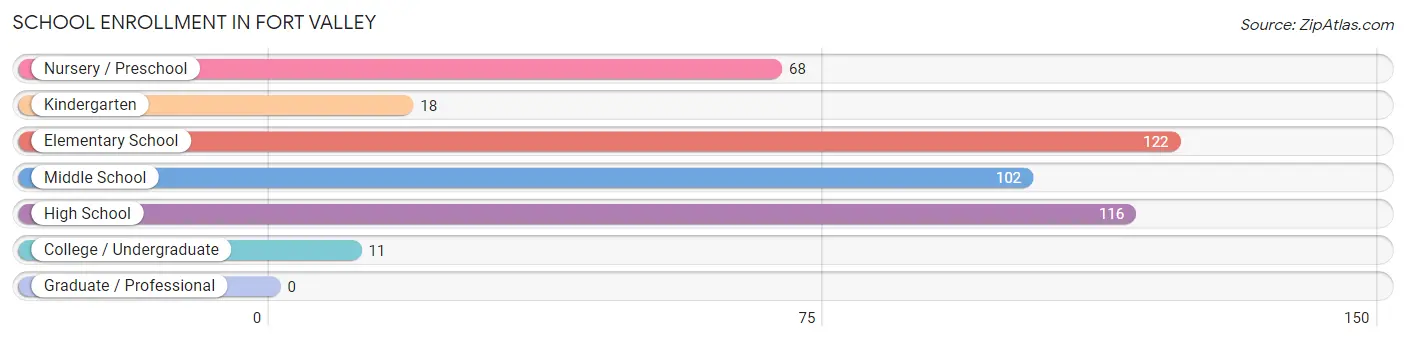
| School Level | # Students | % Students |
| Nursery / Preschool | 68 | 15.6% |
| Kindergarten | 18 | 4.1% |
| Elementary School | 122 | 27.9% |
| Middle School | 102 | 23.3% |
| High School | 116 | 26.5% |
| College / Undergraduate | 11 | 2.5% |
| Graduate / Professional | 0 | 0.0% |
| Total | 437 | 100.0% |
School Enrollment by Age by Funding Source in Fort Valley
Out of a total of 437 students who are enrolled in schools in Fort Valley, 145 (33.2%) attend a private institution, while the remaining 292 (66.8%) are enrolled in public schools. The age group of 3 to 4 year olds has the highest likelihood of being enrolled in private schools, with 49 (100.0% in the age bracket) enrolled. Conversely, the age group of 15 to 17 year olds has the lowest likelihood of being enrolled in a private school, with 83 (100.0% in the age bracket) attending a public institution.
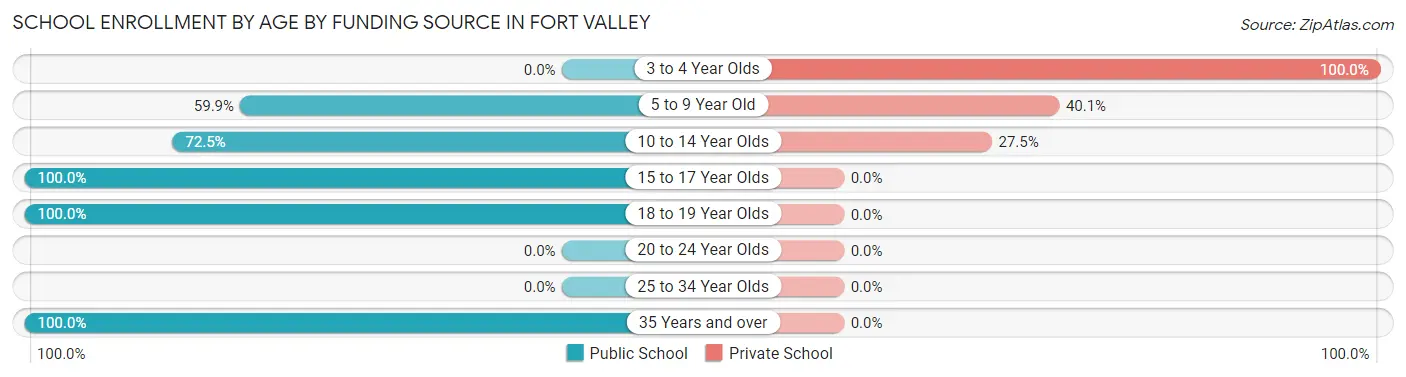
| Age Bracket | Public School | Private School |
| 3 to 4 Year Olds | 0 (0.0%) | 49 (100.0%) |
| 5 to 9 Year Old | 115 (59.9%) | 77 (40.1%) |
| 10 to 14 Year Olds | 50 (72.5%) | 19 (27.5%) |
| 15 to 17 Year Olds | 83 (100.0%) | 0 (0.0%) |
| 18 to 19 Year Olds | 33 (100.0%) | 0 (0.0%) |
| 20 to 24 Year Olds | 0 (0.0%) | 0 (0.0%) |
| 25 to 34 Year Olds | 0 (0.0%) | 0 (0.0%) |
| 35 Years and over | 11 (100.0%) | 0 (0.0%) |
| Total | 292 (66.8%) | 145 (33.2%) |
Educational Attainment by Field of Study in Fort Valley
Bio, nature & agricultural (191 | 19.3%), social sciences (181 | 18.3%), business (122 | 12.3%), science & technology (113 | 11.4%), and liberal arts & history (104 | 10.5%) are the most common fields of study among 989 individuals in Fort Valley who have obtained a bachelor's degree or higher.
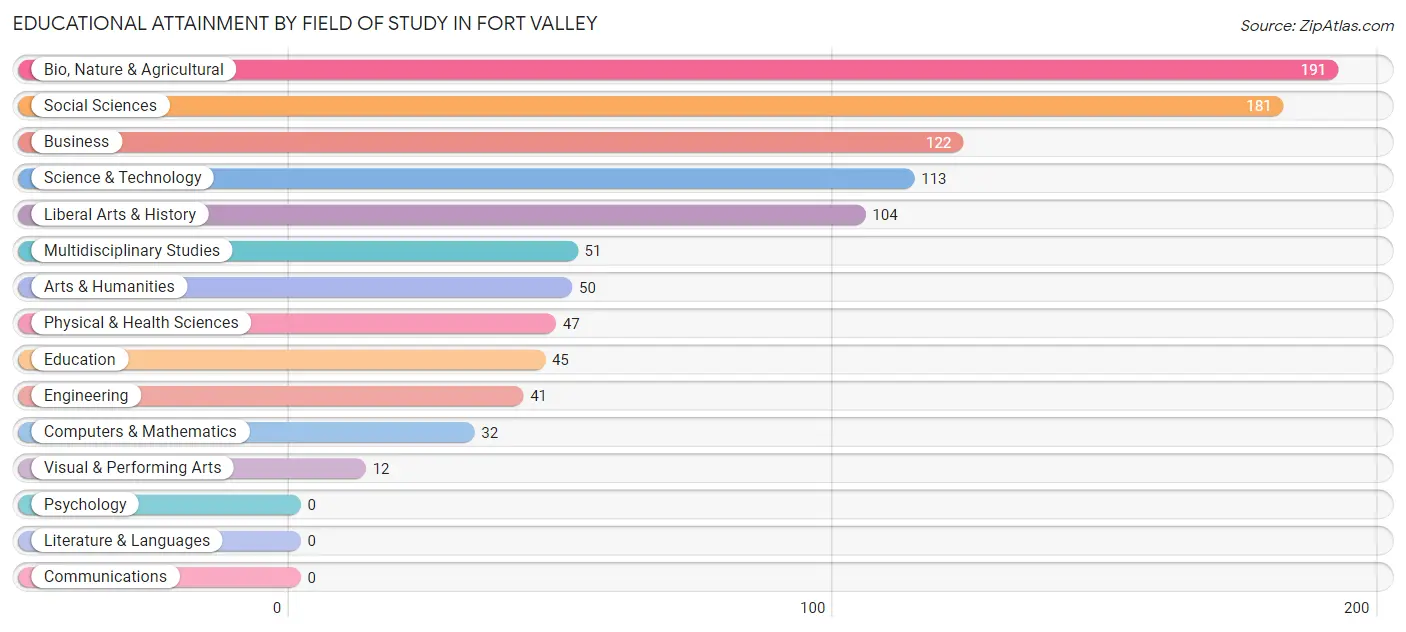
| Field of Study | # Graduates | % Graduates |
| Computers & Mathematics | 32 | 3.2% |
| Bio, Nature & Agricultural | 191 | 19.3% |
| Physical & Health Sciences | 47 | 4.8% |
| Psychology | 0 | 0.0% |
| Social Sciences | 181 | 18.3% |
| Engineering | 41 | 4.2% |
| Multidisciplinary Studies | 51 | 5.2% |
| Science & Technology | 113 | 11.4% |
| Business | 122 | 12.3% |
| Education | 45 | 4.5% |
| Literature & Languages | 0 | 0.0% |
| Liberal Arts & History | 104 | 10.5% |
| Visual & Performing Arts | 12 | 1.2% |
| Communications | 0 | 0.0% |
| Arts & Humanities | 50 | 5.1% |
| Total | 989 | 100.0% |
Transportation & Commute in Fort Valley
Vehicle Availability by Sex in Fort Valley
The most prevalent vehicle ownership categories in Fort Valley are males with 3 vehicles (132, accounting for 33.6%) and females with 3 vehicles (118, making up 49.2%).
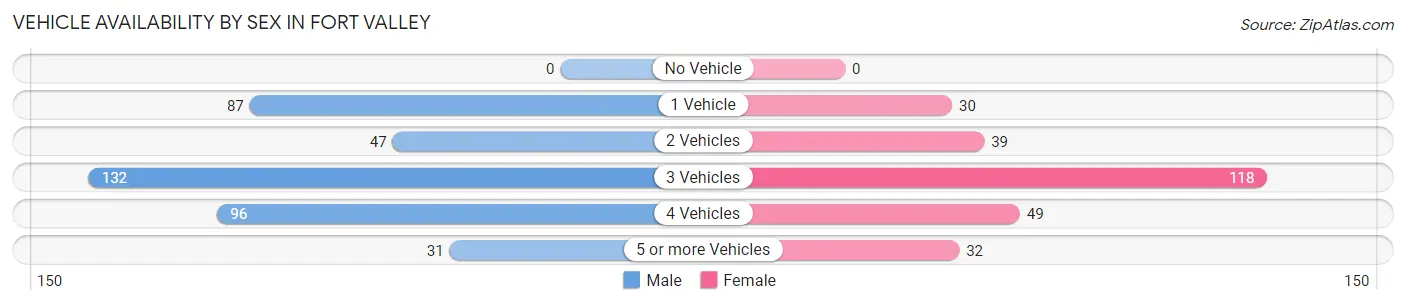
| Vehicles Available | Male | Female |
| No Vehicle | 0 (0.0%) | 0 (0.0%) |
| 1 Vehicle | 87 (22.1%) | 30 (11.2%) |
| 2 Vehicles | 47 (12.0%) | 39 (14.5%) |
| 3 Vehicles | 132 (33.6%) | 118 (44.0%) |
| 4 Vehicles | 96 (24.4%) | 49 (18.3%) |
| 5 or more Vehicles | 31 (7.9%) | 32 (11.9%) |
| Total | 393 (100.0%) | 268 (100.0%) |
Commute Time in Fort Valley
The most frequently occuring commute durations in Fort Valley are 15 to 19 minutes (255 commuters, 41.5%), 20 to 24 minutes (129 commuters, 21.0%), and 10 to 14 minutes (112 commuters, 18.2%).
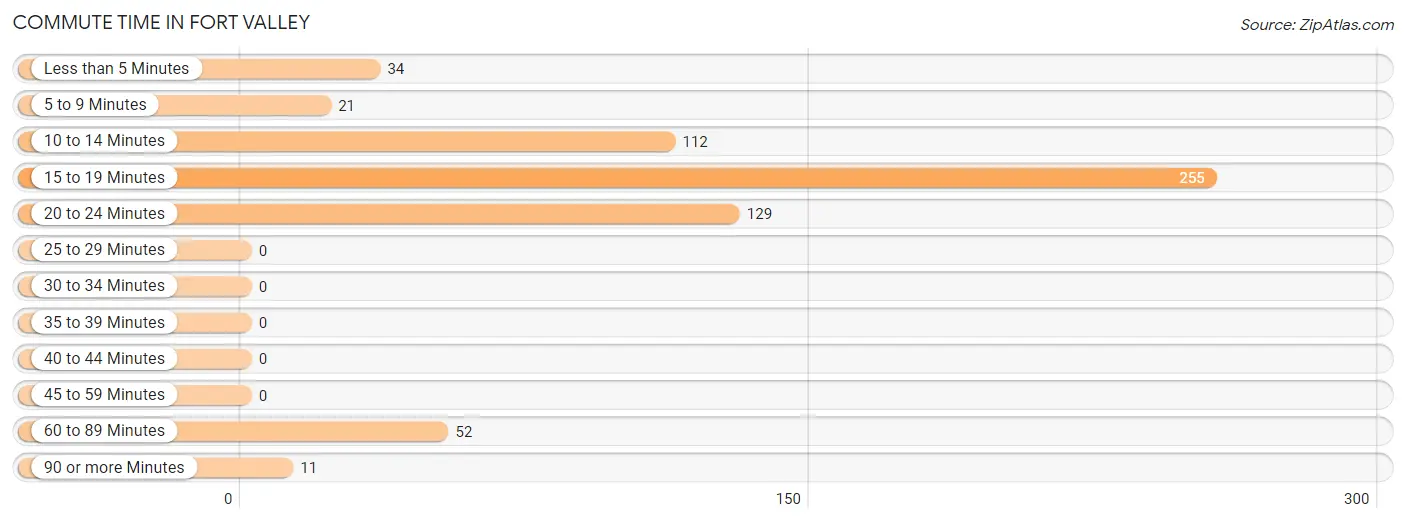
| Commute Time | # Commuters | % Commuters |
| Less than 5 Minutes | 34 | 5.5% |
| 5 to 9 Minutes | 21 | 3.4% |
| 10 to 14 Minutes | 112 | 18.2% |
| 15 to 19 Minutes | 255 | 41.5% |
| 20 to 24 Minutes | 129 | 21.0% |
| 25 to 29 Minutes | 0 | 0.0% |
| 30 to 34 Minutes | 0 | 0.0% |
| 35 to 39 Minutes | 0 | 0.0% |
| 40 to 44 Minutes | 0 | 0.0% |
| 45 to 59 Minutes | 0 | 0.0% |
| 60 to 89 Minutes | 52 | 8.5% |
| 90 or more Minutes | 11 | 1.8% |
Commute Time by Sex in Fort Valley
The most common commute times in Fort Valley are 15 to 19 minutes (143 commuters, 36.4%) for males and 15 to 19 minutes (112 commuters, 50.7%) for females.
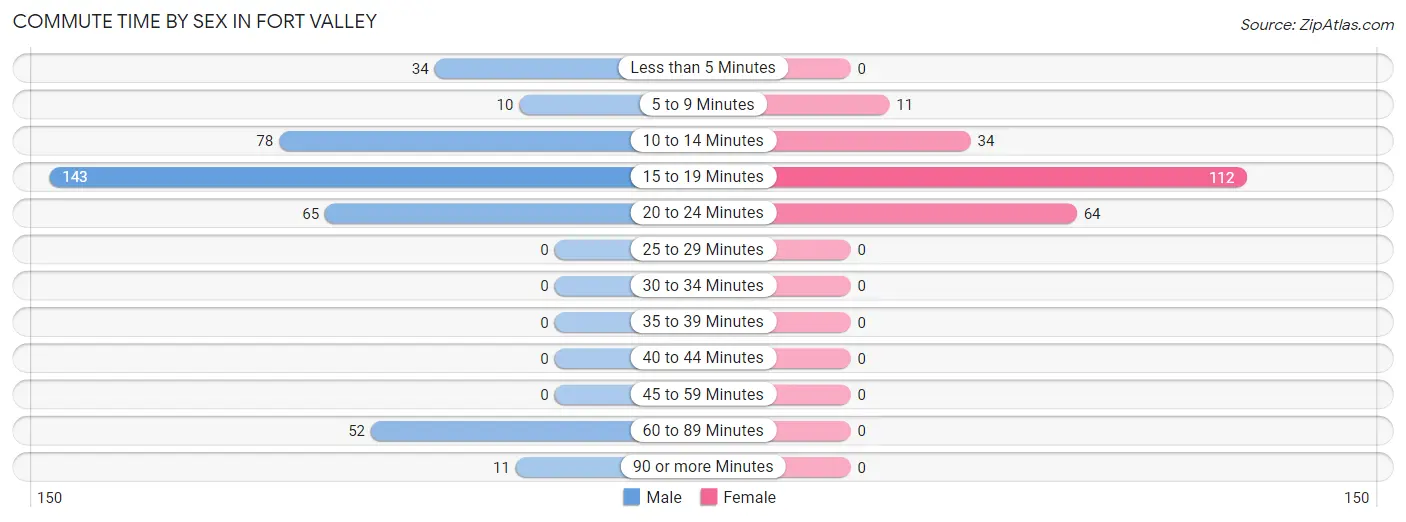
| Commute Time | Male | Female |
| Less than 5 Minutes | 34 (8.6%) | 0 (0.0%) |
| 5 to 9 Minutes | 10 (2.5%) | 11 (5.0%) |
| 10 to 14 Minutes | 78 (19.9%) | 34 (15.4%) |
| 15 to 19 Minutes | 143 (36.4%) | 112 (50.7%) |
| 20 to 24 Minutes | 65 (16.5%) | 64 (29.0%) |
| 25 to 29 Minutes | 0 (0.0%) | 0 (0.0%) |
| 30 to 34 Minutes | 0 (0.0%) | 0 (0.0%) |
| 35 to 39 Minutes | 0 (0.0%) | 0 (0.0%) |
| 40 to 44 Minutes | 0 (0.0%) | 0 (0.0%) |
| 45 to 59 Minutes | 0 (0.0%) | 0 (0.0%) |
| 60 to 89 Minutes | 52 (13.2%) | 0 (0.0%) |
| 90 or more Minutes | 11 (2.8%) | 0 (0.0%) |
Time of Departure to Work by Sex in Fort Valley
The most frequent times of departure to work in Fort Valley are 7:30 AM to 7:59 AM (186, 47.3%) for males and 7:30 AM to 7:59 AM (100, 45.3%) for females.
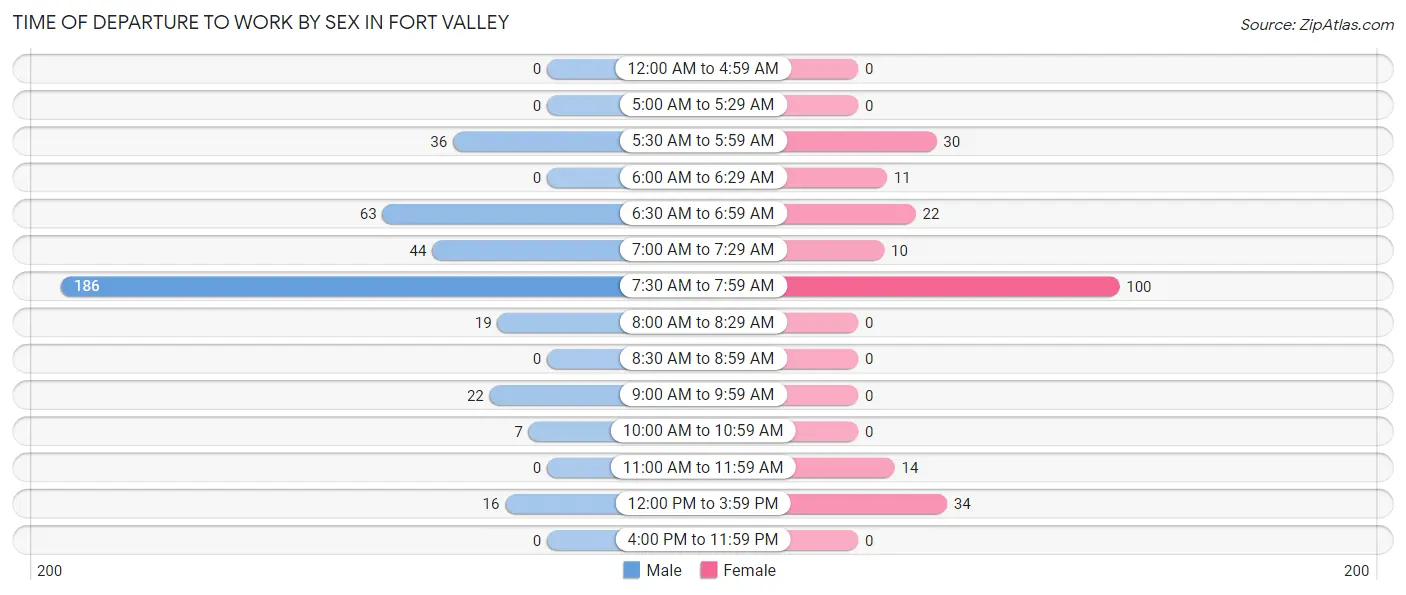
| Time of Departure | Male | Female |
| 12:00 AM to 4:59 AM | 0 (0.0%) | 0 (0.0%) |
| 5:00 AM to 5:29 AM | 0 (0.0%) | 0 (0.0%) |
| 5:30 AM to 5:59 AM | 36 (9.2%) | 30 (13.6%) |
| 6:00 AM to 6:29 AM | 0 (0.0%) | 11 (5.0%) |
| 6:30 AM to 6:59 AM | 63 (16.0%) | 22 (10.0%) |
| 7:00 AM to 7:29 AM | 44 (11.2%) | 10 (4.5%) |
| 7:30 AM to 7:59 AM | 186 (47.3%) | 100 (45.3%) |
| 8:00 AM to 8:29 AM | 19 (4.8%) | 0 (0.0%) |
| 8:30 AM to 8:59 AM | 0 (0.0%) | 0 (0.0%) |
| 9:00 AM to 9:59 AM | 22 (5.6%) | 0 (0.0%) |
| 10:00 AM to 10:59 AM | 7 (1.8%) | 0 (0.0%) |
| 11:00 AM to 11:59 AM | 0 (0.0%) | 14 (6.3%) |
| 12:00 PM to 3:59 PM | 16 (4.1%) | 34 (15.4%) |
| 4:00 PM to 11:59 PM | 0 (0.0%) | 0 (0.0%) |
| Total | 393 (100.0%) | 221 (100.0%) |
Housing Occupancy in Fort Valley
Occupancy by Ownership in Fort Valley
Of the total 712 dwellings in Fort Valley, owner-occupied units account for 673 (94.5%), while renter-occupied units make up 39 (5.5%).
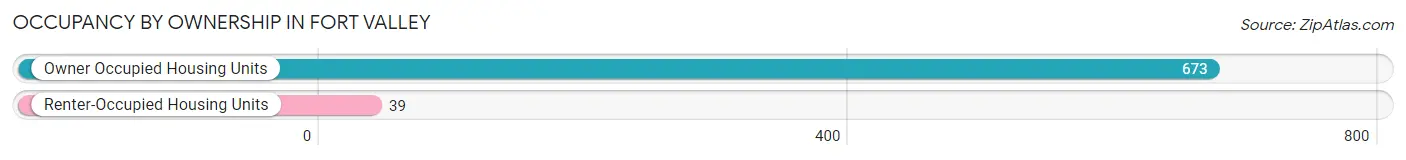
| Occupancy | # Housing Units | % Housing Units |
| Owner Occupied Housing Units | 673 | 94.5% |
| Renter-Occupied Housing Units | 39 | 5.5% |
| Total Occupied Housing Units | 712 | 100.0% |
Occupancy by Household Size in Fort Valley
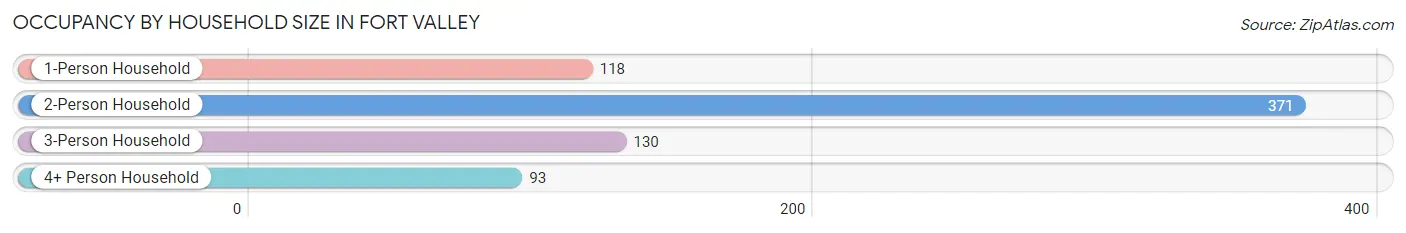
| Household Size | # Housing Units | % Housing Units |
| 1-Person Household | 118 | 16.6% |
| 2-Person Household | 371 | 52.1% |
| 3-Person Household | 130 | 18.3% |
| 4+ Person Household | 93 | 13.1% |
| Total Housing Units | 712 | 100.0% |
Occupancy by Ownership by Household Size in Fort Valley
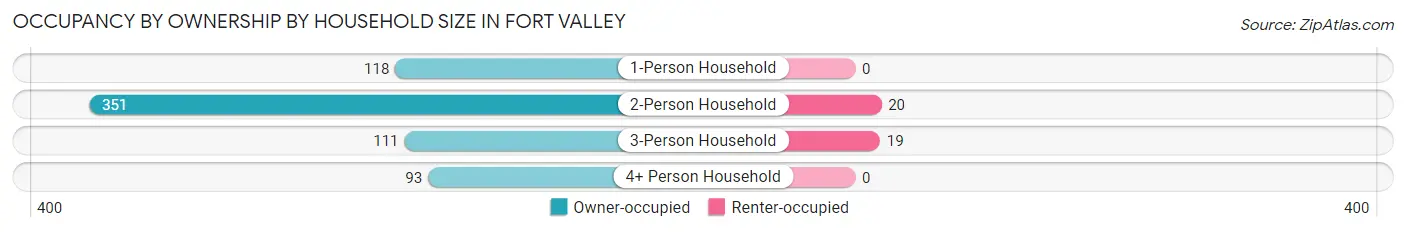
| Household Size | Owner-occupied | Renter-occupied |
| 1-Person Household | 118 (100.0%) | 0 (0.0%) |
| 2-Person Household | 351 (94.6%) | 20 (5.4%) |
| 3-Person Household | 111 (85.4%) | 19 (14.6%) |
| 4+ Person Household | 93 (100.0%) | 0 (0.0%) |
| Total Housing Units | 673 (94.5%) | 39 (5.5%) |
Occupancy by Educational Attainment in Fort Valley
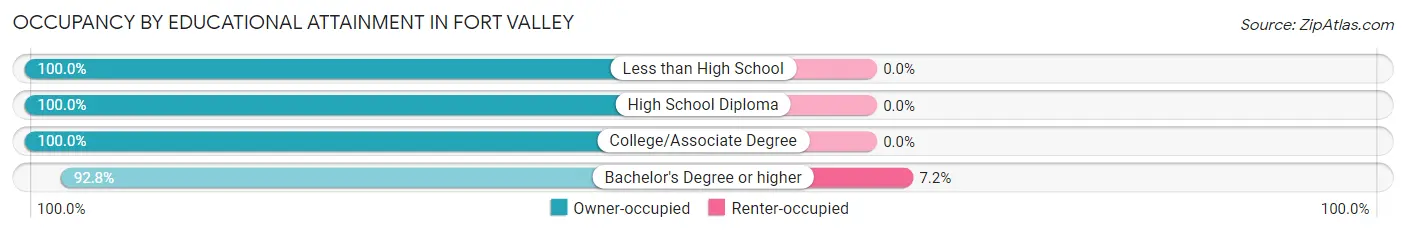
| Household Size | Owner-occupied | Renter-occupied |
| Less than High School | 20 (100.0%) | 0 (0.0%) |
| High School Diploma | 84 (100.0%) | 0 (0.0%) |
| College/Associate Degree | 66 (100.0%) | 0 (0.0%) |
| Bachelor's Degree or higher | 503 (92.8%) | 39 (7.2%) |
Occupancy by Age of Householder in Fort Valley
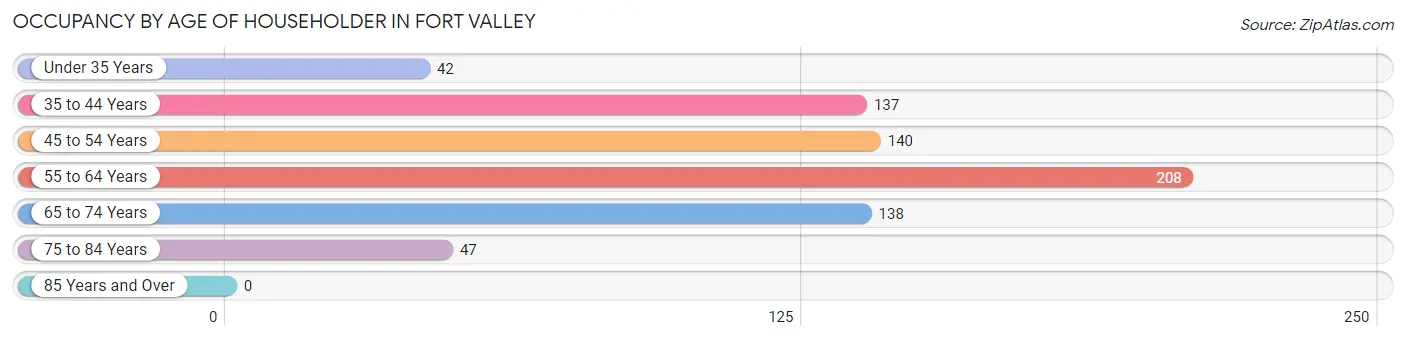
| Age Bracket | # Households | % Households |
| Under 35 Years | 42 | 5.9% |
| 35 to 44 Years | 137 | 19.2% |
| 45 to 54 Years | 140 | 19.7% |
| 55 to 64 Years | 208 | 29.2% |
| 65 to 74 Years | 138 | 19.4% |
| 75 to 84 Years | 47 | 6.6% |
| 85 Years and Over | 0 | 0.0% |
| Total | 712 | 100.0% |
Housing Finances in Fort Valley
Median Income by Occupancy in Fort Valley
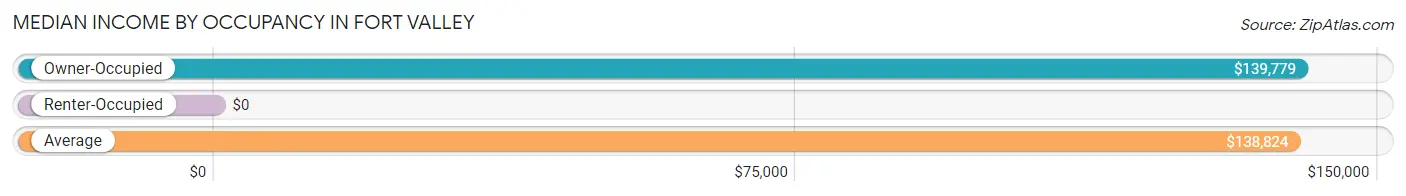
| Occupancy Type | # Households | Median Income |
| Owner-Occupied | 673 (94.5%) | $139,779 |
| Renter-Occupied | 39 (5.5%) | $0 |
| Average | 712 (100.0%) | $138,824 |
Occupancy by Householder Income Bracket in Fort Valley
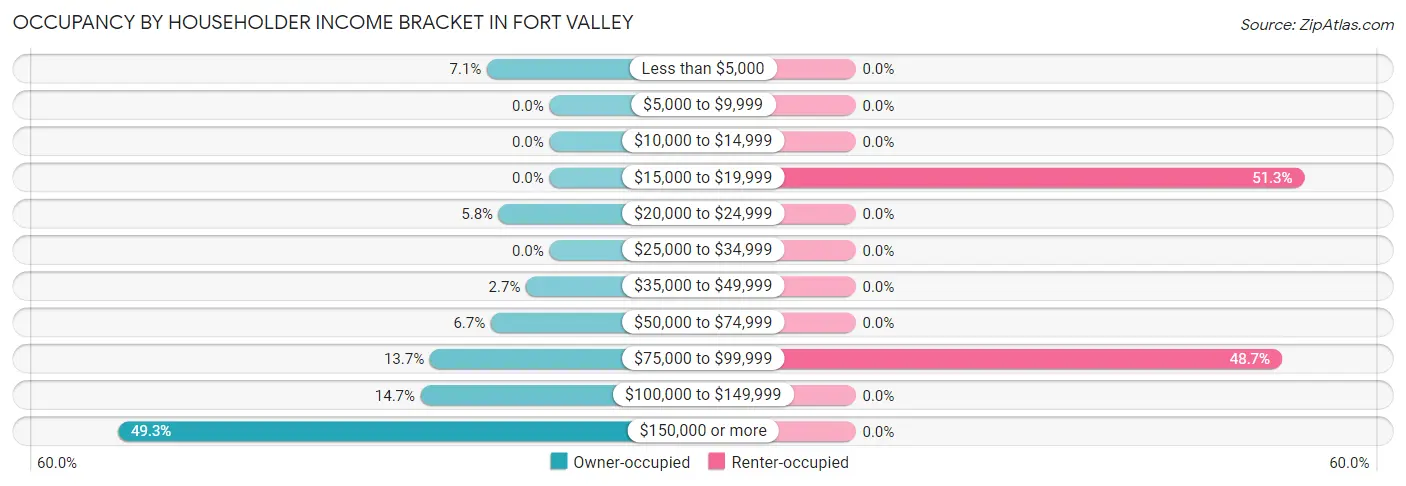
| Income Bracket | Owner-occupied | Renter-occupied |
| Less than $5,000 | 48 (7.1%) | 0 (0.0%) |
| $5,000 to $9,999 | 0 (0.0%) | 0 (0.0%) |
| $10,000 to $14,999 | 0 (0.0%) | 0 (0.0%) |
| $15,000 to $19,999 | 0 (0.0%) | 20 (51.3%) |
| $20,000 to $24,999 | 39 (5.8%) | 0 (0.0%) |
| $25,000 to $34,999 | 0 (0.0%) | 0 (0.0%) |
| $35,000 to $49,999 | 18 (2.7%) | 0 (0.0%) |
| $50,000 to $74,999 | 45 (6.7%) | 0 (0.0%) |
| $75,000 to $99,999 | 92 (13.7%) | 19 (48.7%) |
| $100,000 to $149,999 | 99 (14.7%) | 0 (0.0%) |
| $150,000 or more | 332 (49.3%) | 0 (0.0%) |
| Total | 673 (100.0%) | 39 (100.0%) |
Monthly Housing Cost Tiers in Fort Valley
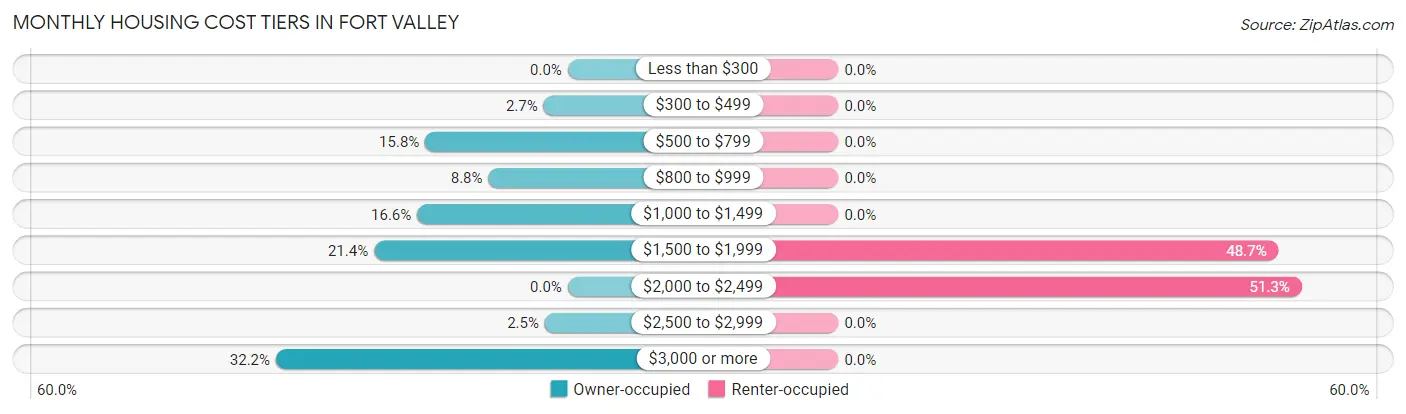
| Monthly Cost | Owner-occupied | Renter-occupied |
| Less than $300 | 0 (0.0%) | 0 (0.0%) |
| $300 to $499 | 18 (2.7%) | 0 (0.0%) |
| $500 to $799 | 106 (15.8%) | 0 (0.0%) |
| $800 to $999 | 59 (8.8%) | 0 (0.0%) |
| $1,000 to $1,499 | 112 (16.6%) | 0 (0.0%) |
| $1,500 to $1,999 | 144 (21.4%) | 19 (48.7%) |
| $2,000 to $2,499 | 0 (0.0%) | 20 (51.3%) |
| $2,500 to $2,999 | 17 (2.5%) | 0 (0.0%) |
| $3,000 or more | 217 (32.2%) | 0 (0.0%) |
| Total | 673 (100.0%) | 39 (100.0%) |
Physical Housing Characteristics in Fort Valley
Housing Structures in Fort Valley
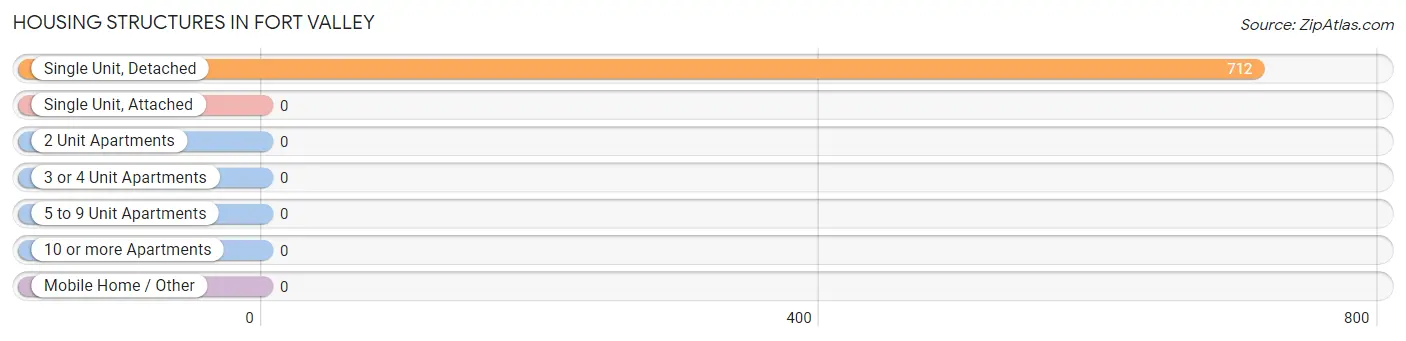
| Structure Type | # Housing Units | % Housing Units |
| Single Unit, Detached | 712 | 100.0% |
| Single Unit, Attached | 0 | 0.0% |
| 2 Unit Apartments | 0 | 0.0% |
| 3 or 4 Unit Apartments | 0 | 0.0% |
| 5 to 9 Unit Apartments | 0 | 0.0% |
| 10 or more Apartments | 0 | 0.0% |
| Mobile Home / Other | 0 | 0.0% |
| Total | 712 | 100.0% |
Housing Structures by Occupancy in Fort Valley
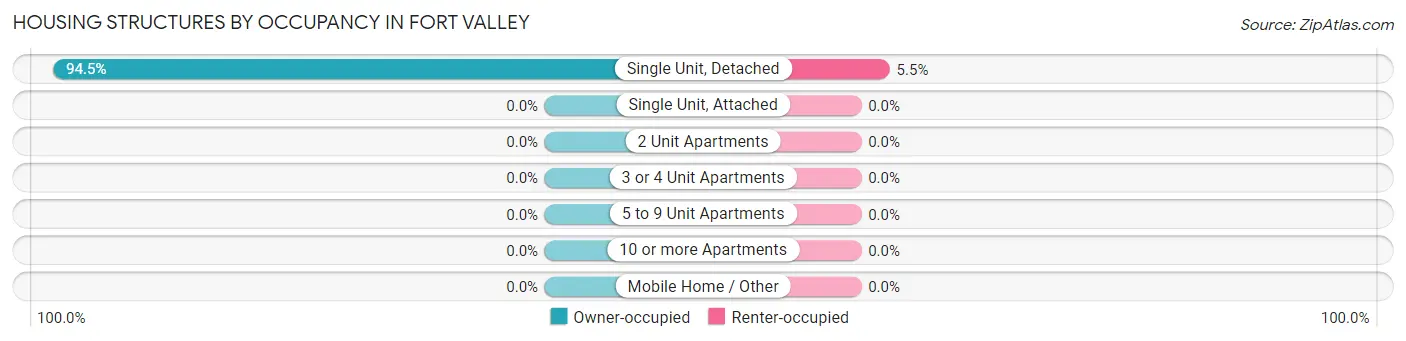
| Structure Type | Owner-occupied | Renter-occupied |
| Single Unit, Detached | 673 (94.5%) | 39 (5.5%) |
| Single Unit, Attached | 0 (0.0%) | 0 (0.0%) |
| 2 Unit Apartments | 0 (0.0%) | 0 (0.0%) |
| 3 or 4 Unit Apartments | 0 (0.0%) | 0 (0.0%) |
| 5 to 9 Unit Apartments | 0 (0.0%) | 0 (0.0%) |
| 10 or more Apartments | 0 (0.0%) | 0 (0.0%) |
| Mobile Home / Other | 0 (0.0%) | 0 (0.0%) |
| Total | 673 (94.5%) | 39 (5.5%) |
Housing Structures by Number of Rooms in Fort Valley
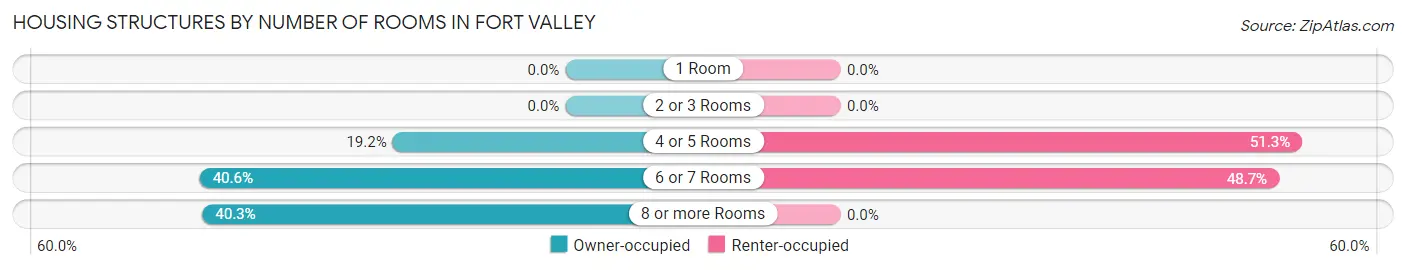
| Number of Rooms | Owner-occupied | Renter-occupied |
| 1 Room | 0 (0.0%) | 0 (0.0%) |
| 2 or 3 Rooms | 0 (0.0%) | 0 (0.0%) |
| 4 or 5 Rooms | 129 (19.2%) | 20 (51.3%) |
| 6 or 7 Rooms | 273 (40.6%) | 19 (48.7%) |
| 8 or more Rooms | 271 (40.3%) | 0 (0.0%) |
| Total | 673 (100.0%) | 39 (100.0%) |
Housing Structure by Heating Type in Fort Valley
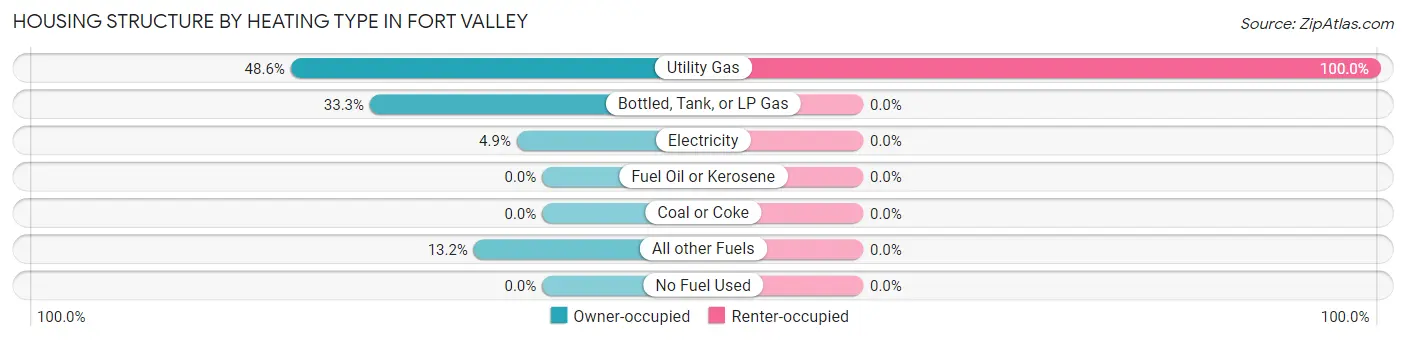
| Heating Type | Owner-occupied | Renter-occupied |
| Utility Gas | 327 (48.6%) | 39 (100.0%) |
| Bottled, Tank, or LP Gas | 224 (33.3%) | 0 (0.0%) |
| Electricity | 33 (4.9%) | 0 (0.0%) |
| Fuel Oil or Kerosene | 0 (0.0%) | 0 (0.0%) |
| Coal or Coke | 0 (0.0%) | 0 (0.0%) |
| All other Fuels | 89 (13.2%) | 0 (0.0%) |
| No Fuel Used | 0 (0.0%) | 0 (0.0%) |
| Total | 673 (100.0%) | 39 (100.0%) |
Household Vehicle Usage in Fort Valley
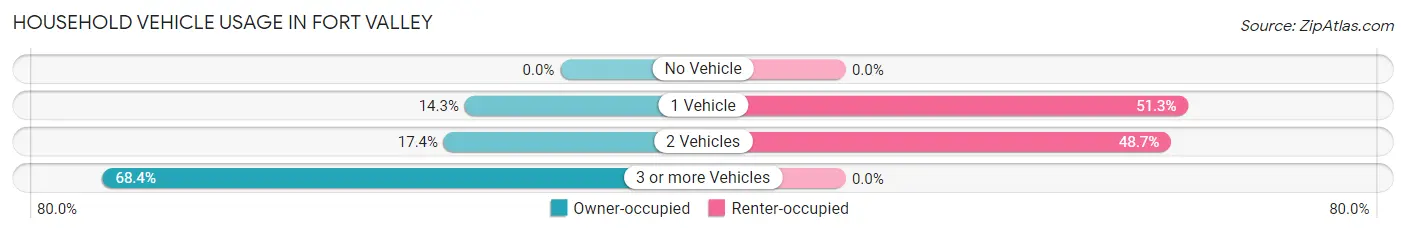
| Vehicles per Household | Owner-occupied | Renter-occupied |
| No Vehicle | 0 (0.0%) | 0 (0.0%) |
| 1 Vehicle | 96 (14.3%) | 20 (51.3%) |
| 2 Vehicles | 117 (17.4%) | 19 (48.7%) |
| 3 or more Vehicles | 460 (68.3%) | 0 (0.0%) |
| Total | 673 (100.0%) | 39 (100.0%) |
Real Estate & Mortgages in Fort Valley
Real Estate and Mortgage Overview in Fort Valley
| Characteristic | Without Mortgage | With Mortgage |
| Housing Units | 196 | 477 |
| Median Property Value | $885,200 | $808,400 |
| Median Household Income | - | - |
| Monthly Housing Costs | $876 | $217 |
| Real Estate Taxes | $4,292 | $12 |
Property Value by Mortgage Status in Fort Valley
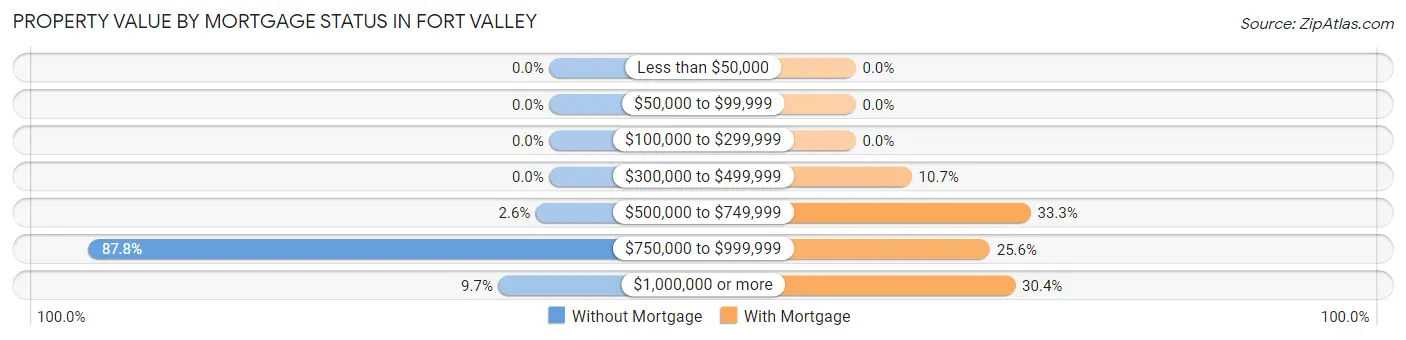
| Property Value | Without Mortgage | With Mortgage |
| Less than $50,000 | 0 (0.0%) | 0 (0.0%) |
| $50,000 to $99,999 | 0 (0.0%) | 0 (0.0%) |
| $100,000 to $299,999 | 0 (0.0%) | 0 (0.0%) |
| $300,000 to $499,999 | 0 (0.0%) | 51 (10.7%) |
| $500,000 to $749,999 | 5 (2.5%) | 159 (33.3%) |
| $750,000 to $999,999 | 172 (87.8%) | 122 (25.6%) |
| $1,000,000 or more | 19 (9.7%) | 145 (30.4%) |
| Total | 196 (100.0%) | 477 (100.0%) |
Household Income by Mortgage Status in Fort Valley
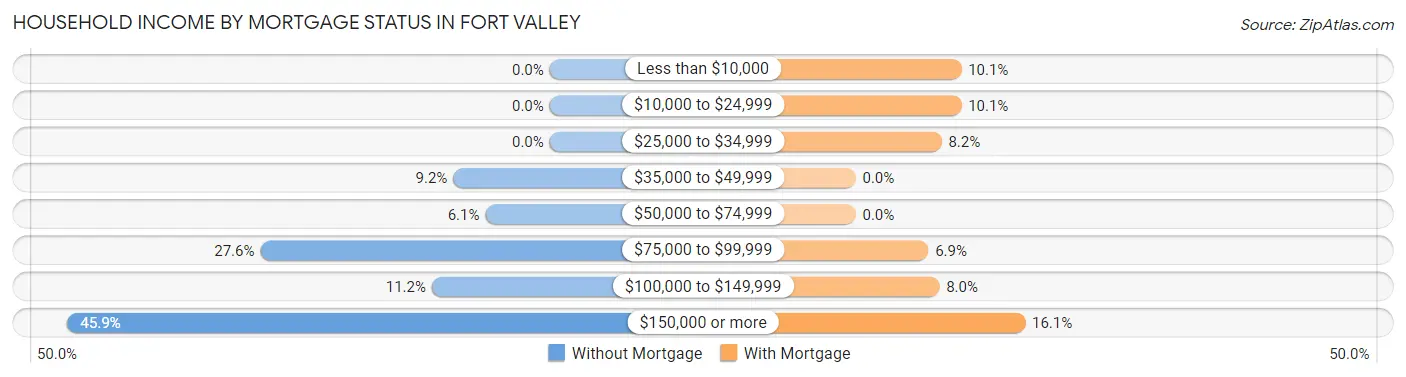
| Household Income | Without Mortgage | With Mortgage |
| Less than $10,000 | 0 (0.0%) | 48 (10.1%) |
| $10,000 to $24,999 | 0 (0.0%) | 48 (10.1%) |
| $25,000 to $34,999 | 0 (0.0%) | 39 (8.2%) |
| $35,000 to $49,999 | 18 (9.2%) | 0 (0.0%) |
| $50,000 to $74,999 | 12 (6.1%) | 0 (0.0%) |
| $75,000 to $99,999 | 54 (27.6%) | 33 (6.9%) |
| $100,000 to $149,999 | 22 (11.2%) | 38 (8.0%) |
| $150,000 or more | 90 (45.9%) | 77 (16.1%) |
| Total | 196 (100.0%) | 477 (100.0%) |
Property Value to Household Income Ratio in Fort Valley
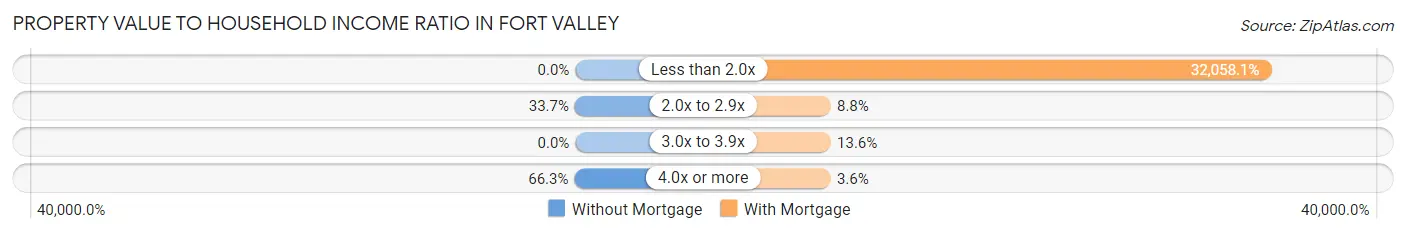
| Value-to-Income Ratio | Without Mortgage | With Mortgage |
| Less than 2.0x | 0 (0.0%) | 152,917 (32,058.1%) |
| 2.0x to 2.9x | 66 (33.7%) | 42 (8.8%) |
| 3.0x to 3.9x | 0 (0.0%) | 65 (13.6%) |
| 4.0x or more | 130 (66.3%) | 17 (3.6%) |
| Total | 196 (100.0%) | 477 (100.0%) |
Real Estate Taxes by Mortgage Status in Fort Valley
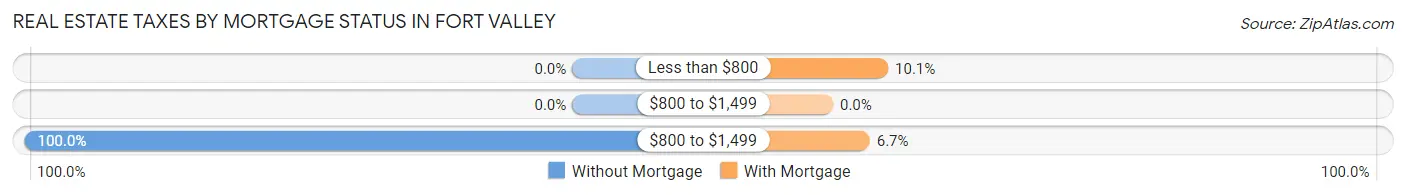
| Property Taxes | Without Mortgage | With Mortgage |
| Less than $800 | 0 (0.0%) | 48 (10.1%) |
| $800 to $1,499 | 0 (0.0%) | 0 (0.0%) |
| $800 to $1,499 | 196 (100.0%) | 32 (6.7%) |
| Total | 196 (100.0%) | 477 (100.0%) |
Health & Disability in Fort Valley
Health Insurance Coverage by Age in Fort Valley
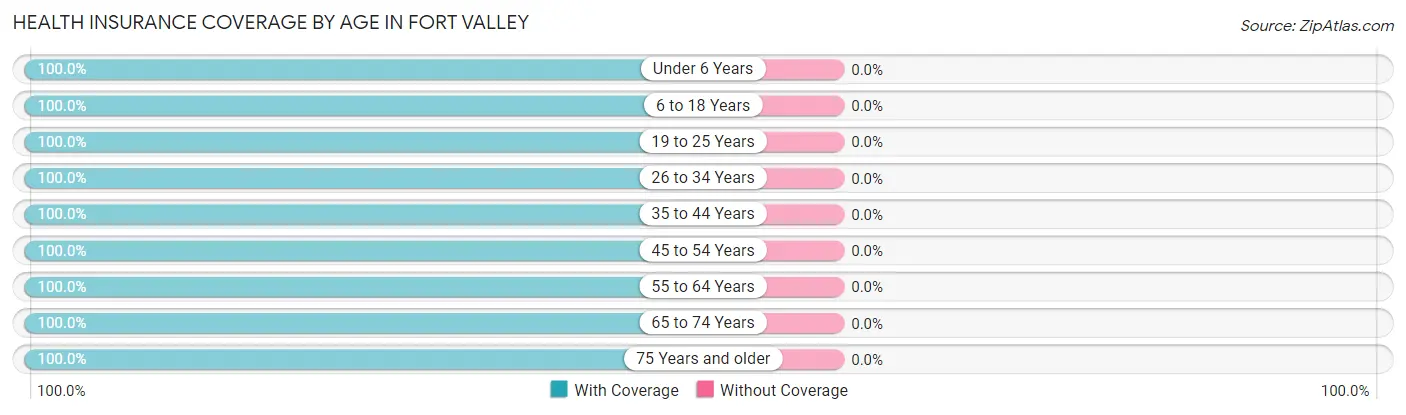
| Age Bracket | With Coverage | Without Coverage |
| Under 6 Years | 86 (100.0%) | 0 (0.0%) |
| 6 to 18 Years | 340 (100.0%) | 0 (0.0%) |
| 19 to 25 Years | 15 (100.0%) | 0 (0.0%) |
| 26 to 34 Years | 95 (100.0%) | 0 (0.0%) |
| 35 to 44 Years | 241 (100.0%) | 0 (0.0%) |
| 45 to 54 Years | 286 (100.0%) | 0 (0.0%) |
| 55 to 64 Years | 302 (100.0%) | 0 (0.0%) |
| 65 to 74 Years | 260 (100.0%) | 0 (0.0%) |
| 75 Years and older | 109 (100.0%) | 0 (0.0%) |
| Total | 1,734 (100.0%) | 0 (0.0%) |
Health Insurance Coverage by Citizenship Status in Fort Valley
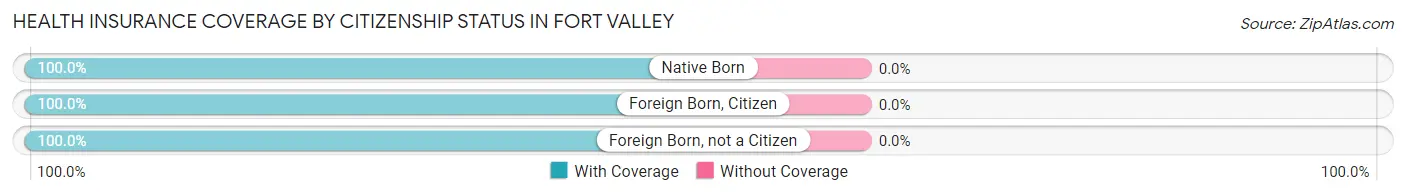
| Citizenship Status | With Coverage | Without Coverage |
| Native Born | 86 (100.0%) | 0 (0.0%) |
| Foreign Born, Citizen | 340 (100.0%) | 0 (0.0%) |
| Foreign Born, not a Citizen | 15 (100.0%) | 0 (0.0%) |
Health Insurance Coverage by Household Income in Fort Valley
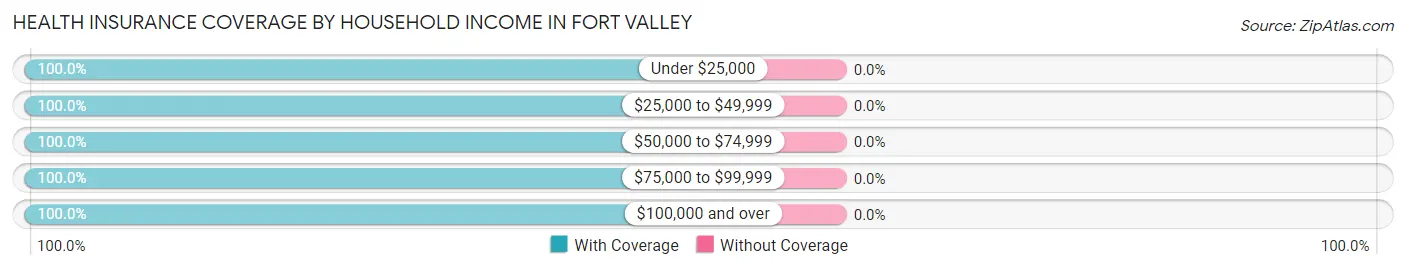
| Household Income | With Coverage | Without Coverage |
| Under $25,000 | 129 (100.0%) | 0 (0.0%) |
| $25,000 to $49,999 | 37 (100.0%) | 0 (0.0%) |
| $50,000 to $74,999 | 121 (100.0%) | 0 (0.0%) |
| $75,000 to $99,999 | 291 (100.0%) | 0 (0.0%) |
| $100,000 and over | 1,156 (100.0%) | 0 (0.0%) |
Public vs Private Health Insurance Coverage by Age in Fort Valley
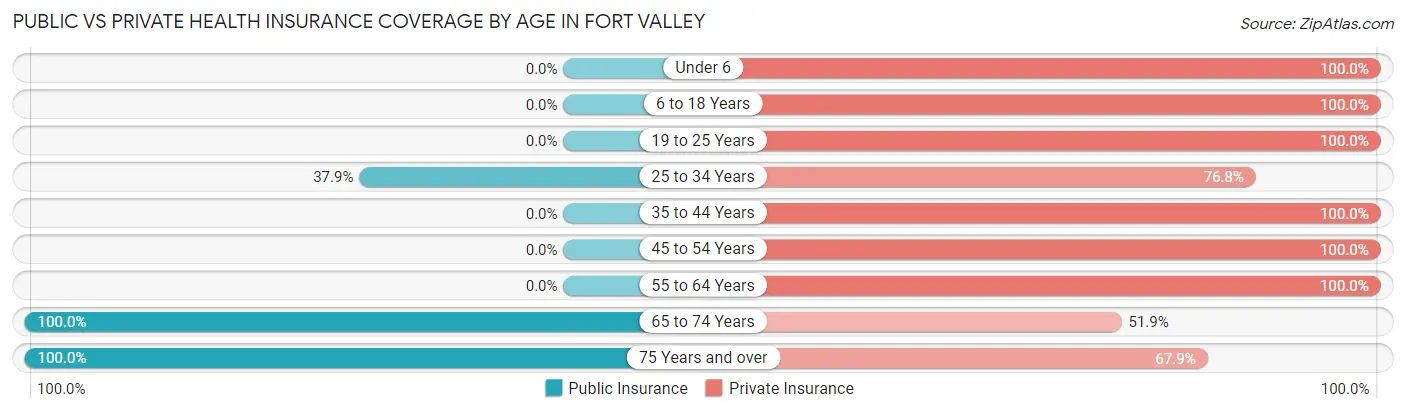
| Age Bracket | Public Insurance | Private Insurance |
| Under 6 | 0 (0.0%) | 86 (100.0%) |
| 6 to 18 Years | 0 (0.0%) | 340 (100.0%) |
| 19 to 25 Years | 0 (0.0%) | 15 (100.0%) |
| 25 to 34 Years | 36 (37.9%) | 73 (76.8%) |
| 35 to 44 Years | 0 (0.0%) | 241 (100.0%) |
| 45 to 54 Years | 0 (0.0%) | 286 (100.0%) |
| 55 to 64 Years | 0 (0.0%) | 302 (100.0%) |
| 65 to 74 Years | 260 (100.0%) | 135 (51.9%) |
| 75 Years and over | 109 (100.0%) | 74 (67.9%) |
| Total | 405 (23.4%) | 1,552 (89.5%) |
Disability Status by Sex by Age in Fort Valley
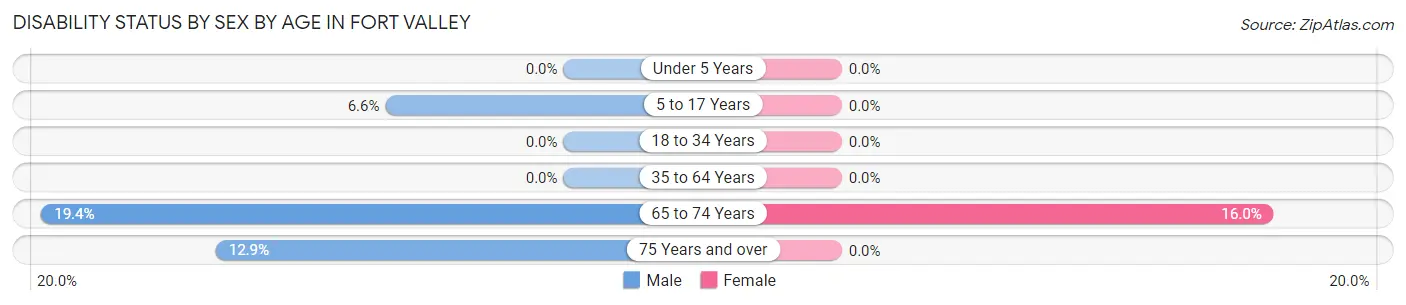
| Age Bracket | Male | Female |
| Under 5 Years | 0 (0.0%) | 0 (0.0%) |
| 5 to 17 Years | 16 (6.6%) | 0 (0.0%) |
| 18 to 34 Years | 0 (0.0%) | 0 (0.0%) |
| 35 to 64 Years | 0 (0.0%) | 0 (0.0%) |
| 65 to 74 Years | 25 (19.4%) | 21 (16.0%) |
| 75 Years and over | 8 (12.9%) | 0 (0.0%) |
Disability Class by Sex by Age in Fort Valley
Disability Class: Hearing Difficulty
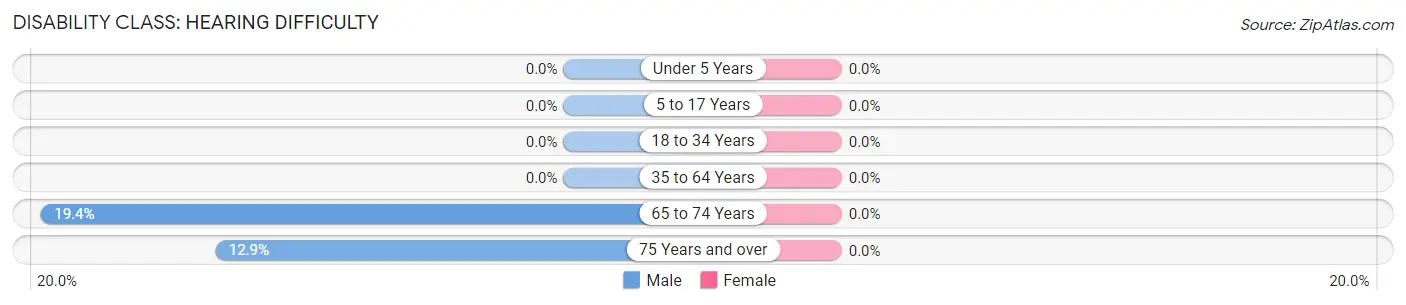
| Age Bracket | Male | Female |
| Under 5 Years | 0 (0.0%) | 0 (0.0%) |
| 5 to 17 Years | 0 (0.0%) | 0 (0.0%) |
| 18 to 34 Years | 0 (0.0%) | 0 (0.0%) |
| 35 to 64 Years | 0 (0.0%) | 0 (0.0%) |
| 65 to 74 Years | 25 (19.4%) | 0 (0.0%) |
| 75 Years and over | 8 (12.9%) | 0 (0.0%) |
Disability Class: Vision Difficulty
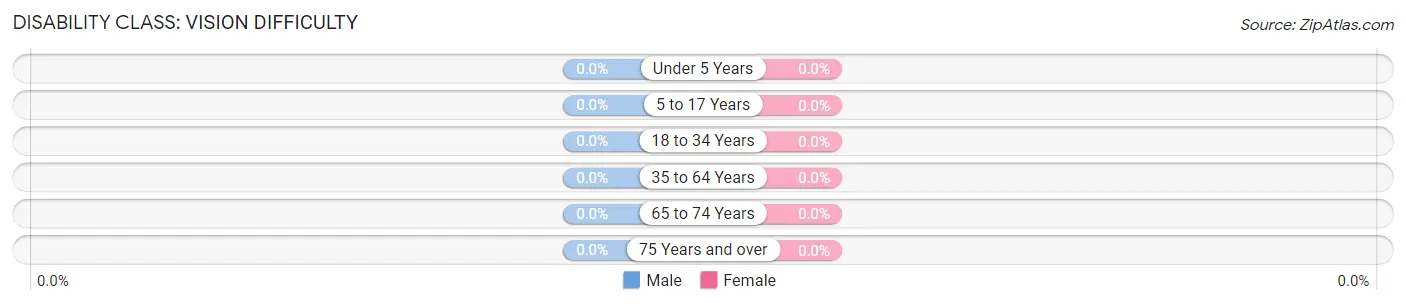
| Age Bracket | Male | Female |
| Under 5 Years | 0 (0.0%) | 0 (0.0%) |
| 5 to 17 Years | 0 (0.0%) | 0 (0.0%) |
| 18 to 34 Years | 0 (0.0%) | 0 (0.0%) |
| 35 to 64 Years | 0 (0.0%) | 0 (0.0%) |
| 65 to 74 Years | 0 (0.0%) | 0 (0.0%) |
| 75 Years and over | 0 (0.0%) | 0 (0.0%) |
Disability Class: Cognitive Difficulty
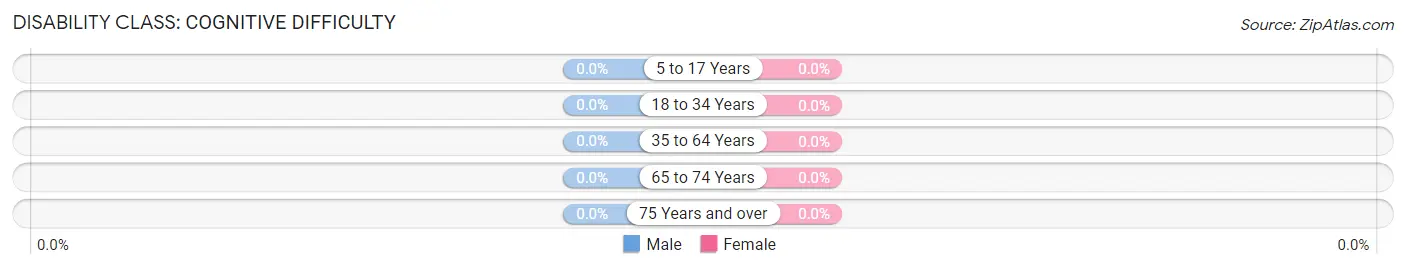
| Age Bracket | Male | Female |
| 5 to 17 Years | 0 (0.0%) | 0 (0.0%) |
| 18 to 34 Years | 0 (0.0%) | 0 (0.0%) |
| 35 to 64 Years | 0 (0.0%) | 0 (0.0%) |
| 65 to 74 Years | 0 (0.0%) | 0 (0.0%) |
| 75 Years and over | 0 (0.0%) | 0 (0.0%) |
Disability Class: Ambulatory Difficulty
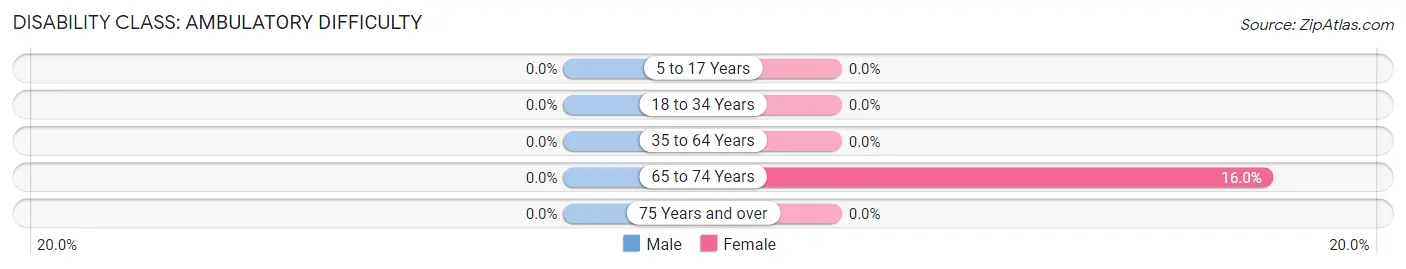
| Age Bracket | Male | Female |
| 5 to 17 Years | 0 (0.0%) | 0 (0.0%) |
| 18 to 34 Years | 0 (0.0%) | 0 (0.0%) |
| 35 to 64 Years | 0 (0.0%) | 0 (0.0%) |
| 65 to 74 Years | 0 (0.0%) | 21 (16.0%) |
| 75 Years and over | 0 (0.0%) | 0 (0.0%) |
Disability Class: Self-Care Difficulty
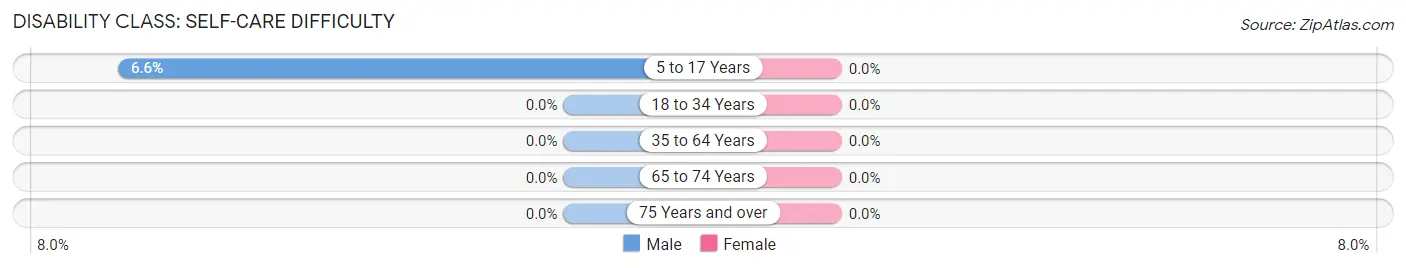
| Age Bracket | Male | Female |
| 5 to 17 Years | 16 (6.6%) | 0 (0.0%) |
| 18 to 34 Years | 0 (0.0%) | 0 (0.0%) |
| 35 to 64 Years | 0 (0.0%) | 0 (0.0%) |
| 65 to 74 Years | 0 (0.0%) | 0 (0.0%) |
| 75 Years and over | 0 (0.0%) | 0 (0.0%) |
Technology Access in Fort Valley
Computing Device Access in Fort Valley
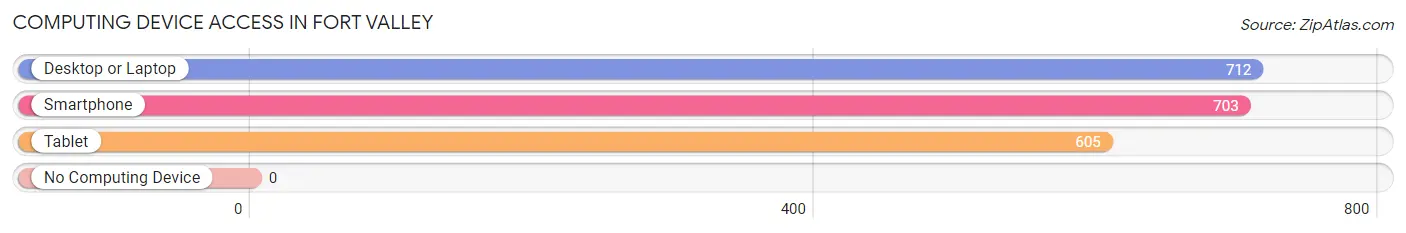
| Device Type | # Households | % Households |
| Desktop or Laptop | 712 | 100.0% |
| Smartphone | 703 | 98.7% |
| Tablet | 605 | 85.0% |
| No Computing Device | 0 | 0.0% |
| Total | 712 | 100.0% |
Internet Access in Fort Valley
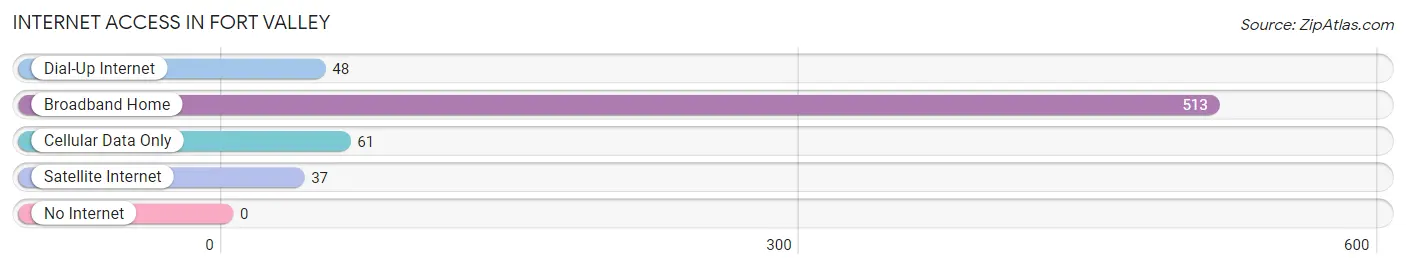
| Internet Type | # Households | % Households |
| Dial-Up Internet | 48 | 6.7% |
| Broadband Home | 513 | 72.1% |
| Cellular Data Only | 61 | 8.6% |
| Satellite Internet | 37 | 5.2% |
| No Internet | 0 | 0.0% |
| Total | 712 | 100.0% |
Fort Valley Summary
Valley History
Valley, Arizona is a small town located in Coconino County, Arizona. It is situated in the Verde Valley, which is a region of the state known for its natural beauty and rich history. The town was founded in 1883 by a group of settlers from the nearby town of Flagstaff. The settlers were looking for a place to settle and start a new life, and Valley was the perfect spot.
The town was originally called Fort Valley, as it was the site of a military fort that was built in 1864. The fort was used to protect settlers from Native American attacks. The fort was abandoned in 1871, but the town of Valley was established in its place.
The town grew quickly, and by the early 1900s it had become a bustling center of commerce and industry. The town was home to several businesses, including a sawmill, a flour mill, a blacksmith shop, and a general store. The town also had a post office, a school, and a church.
The town was also home to a large number of ranchers and farmers, who raised cattle, sheep, and horses. The town was also known for its mining industry, which included copper, gold, and silver.
The town of Valley was also home to a number of Native American tribes, including the Hopi, Navajo, and Apache. These tribes had a long history in the area, and many of their traditions and customs are still practiced today.
The town of Valley was also home to a number of famous people, including the famous outlaws Butch Cassidy and the Sundance Kid. The town was also the birthplace of the famous western author Zane Grey.
Geography
Valley, Arizona is located in the Verde Valley, which is a region of the state known for its natural beauty and rich history. The town is situated in the foothills of the San Francisco Peaks, which are the highest mountains in Arizona. The town is surrounded by the Coconino National Forest, which is home to a variety of wildlife, including elk, deer, and mountain lions.
The town of Valley is located at an elevation of 4,500 feet, and the climate is generally mild and dry. The average temperature in the summer is around 90 degrees Fahrenheit, and the average temperature in the winter is around 40 degrees Fahrenheit.
Economy
The economy of Valley, Arizona is largely based on tourism and agriculture. The town is home to a number of tourist attractions, including the Grand Canyon, the Petrified Forest National Park, and the Verde Valley Railroad. The town is also home to a number of wineries, which produce a variety of wines.
The town is also home to a number of agricultural businesses, including cattle ranches, sheep farms, and horse farms. The town is also home to a number of mining operations, which produce copper, gold, and silver.
Demographics
As of the 2010 census, the population of Valley, Arizona was 1,845. The population is largely made up of white (83.3%) and Native American (14.2%) residents. The median age of the population is 44.7 years, and the median household income is $41,944.
The town of Valley is served by the Valley Unified School District, which includes two elementary schools, one middle school, and one high school. The town is also home to a number of churches, including the Valley Baptist Church and the Valley United Methodist Church.
Conclusion
Valley, Arizona is a small town located in Coconino County, Arizona. It is situated in the Verde Valley, which is a region of the state known for its natural beauty and rich history. The town was founded in 1883 by a group of settlers from the nearby town of Flagstaff. The town is largely based on tourism and agriculture, and the population is largely made up of white and Native American residents. The town is served by the Valley Unified School District, and is home to a number of churches. Valley is a beautiful town with a rich history and a vibrant economy.
Common Questions
What is the Total Population of Fort Valley?
Total Population of Fort Valley is 1,734.
What is the Total Male Population of Fort Valley?
Total Male Population of Fort Valley is 898.
What is the Total Female Population of Fort Valley?
Total Female Population of Fort Valley is 836.
What is the Ratio of Males per 100 Females in Fort Valley?
There are 107.42 Males per 100 Females in Fort Valley.
What is the Ratio of Females per 100 Males in Fort Valley?
There are 93.10 Females per 100 Males in Fort Valley.
What is the Median Population Age in Fort Valley?
Median Population Age in Fort Valley is 48.3 Years.
What is the Average Family Size in Fort Valley
Average Family Size in Fort Valley is 2.7 People.
What is the Average Household Size in Fort Valley
Average Household Size in Fort Valley is 2.4 People.
What is Per Capita Income in Fort Valley?
Per Capita income in Fort Valley is $80,256.
What is the Median Family Income in Fort Valley?
Median Family Income in Fort Valley is $152,976.
What is the Median Household income in Fort Valley?
Median Household Income in Fort Valley is $138,824.
What is Income or Wage Gap in Fort Valley?
Income or Wage Gap in Fort Valley is 55.1%.
Women in Fort Valley earn 44.9 cents for every dollar earned by a man.
What is Inequality or Gini Index in Fort Valley?
Inequality or Gini Index in Fort Valley is 0.48.
How Large is the Labor Force in Fort Valley?
There are 715 People in the Labor Forcein in Fort Valley.
What is the Percentage of People in the Labor Force in Fort Valley?
51.3% of People are in the Labor Force in Fort Valley.
What is the Unemployment Rate in Fort Valley?
Unemployment Rate in Fort Valley is 3.1%.