Elephant Head, AZ
Elephant Head Map
Elephant Head Overview
517
TOTAL POPULATION
233
MALE POPULATION
284
FEMALE POPULATION
82.04
MALES / 100 FEMALES
121.89
FEMALES / 100 MALES
63.2
MEDIAN AGE
2.8
AVG FAMILY SIZE
2.2
AVG HOUSEHOLD SIZE
$29,565
PER CAPITA INCOME
$46,161
AVG FAMILY INCOME
$46,167
AVG HOUSEHOLD INCOME
13.9%
WAGE / INCOME GAP [ % ]
86.1¢/ $1
WAGE / INCOME GAP [ $ ]
0.38
INEQUALITY / GINI INDEX
124
LABOR FORCE [ PEOPLE ]
29.7%
PERCENT IN LABOR FORCE
2.4%
UNEMPLOYMENT RATE
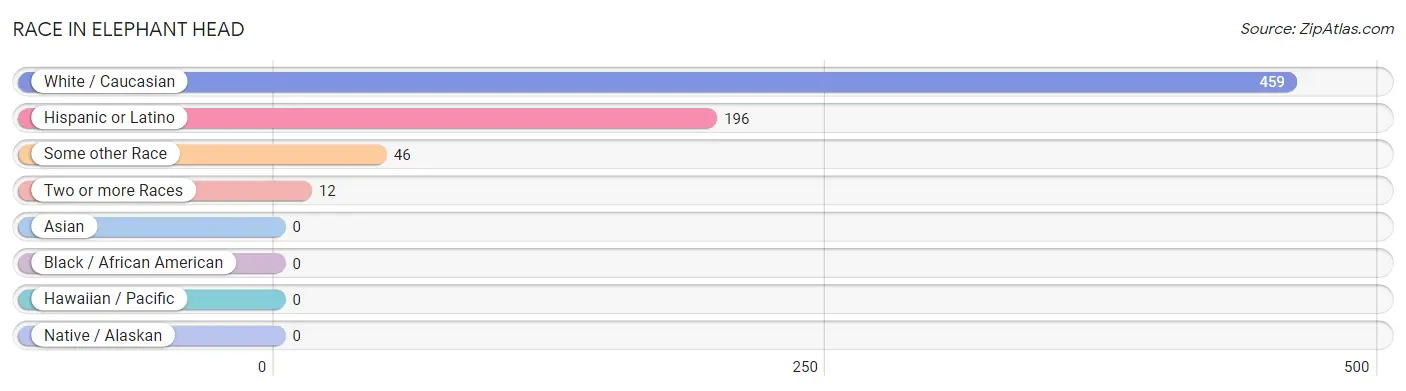
Race in Elephant Head
The most populous races in Elephant Head are White / Caucasian (459 | 88.8%), Hispanic or Latino (196 | 37.9%), and Some other Race (46 | 8.9%).
| Race | # Population | % Population |
| Asian | 0 | 0.0% |
| Black / African American | 0 | 0.0% |
| Hawaiian / Pacific | 0 | 0.0% |
| Hispanic or Latino | 196 | 37.9% |
| Native / Alaskan | 0 | 0.0% |
| White / Caucasian | 459 | 88.8% |
| Two or more Races | 12 | 2.3% |
| Some other Race | 46 | 8.9% |
| Total | 517 | 100.0% |
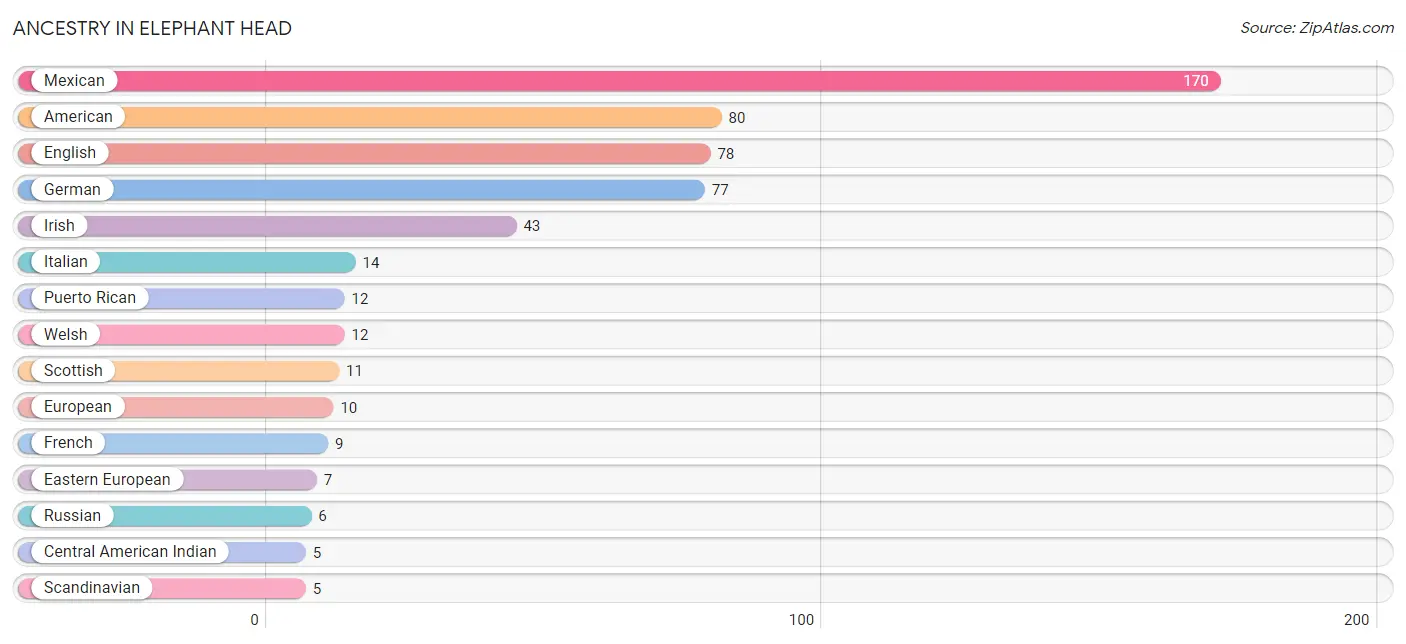
Ancestry in Elephant Head
The most populous ancestries reported in Elephant Head are Mexican (170 | 32.9%), American (80 | 15.5%), English (78 | 15.1%), German (77 | 14.9%), and Irish (43 | 8.3%), together accounting for 86.7% of all Elephant Head residents.
| Ancestry | # Population | % Population |
| American | 80 | 15.5% |
| Central American Indian | 5 | 1.0% |
| Eastern European | 7 | 1.3% |
| English | 78 | 15.1% |
| European | 10 | 1.9% |
| French | 9 | 1.7% |
| French Canadian | 3 | 0.6% |
| German | 77 | 14.9% |
| Irish | 43 | 8.3% |
| Italian | 14 | 2.7% |
| Mexican | 170 | 32.9% |
| Northern European | 4 | 0.8% |
| Puerto Rican | 12 | 2.3% |
| Russian | 6 | 1.2% |
| Scandinavian | 5 | 1.0% |
| Scotch-Irish | 3 | 0.6% |
| Scottish | 11 | 2.1% |
| Swedish | 4 | 0.8% |
| Swiss | 4 | 0.8% |
| Welsh | 12 | 2.3% | View All 20 Rows |
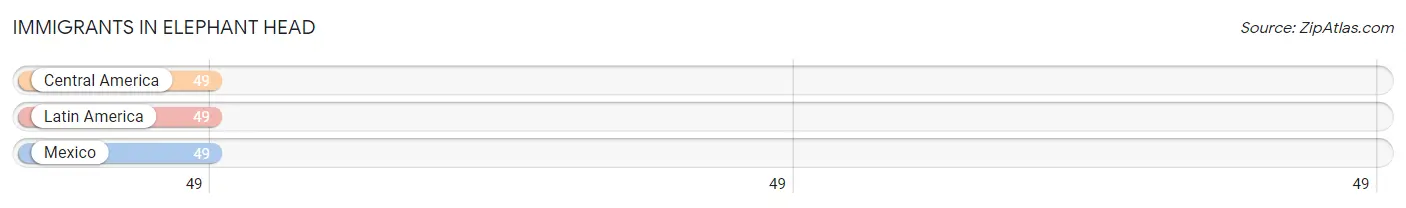
Immigrants in Elephant Head
The most numerous immigrant groups reported in Elephant Head came from Central America (49 | 9.5%), Latin America (49 | 9.5%), and Mexico (49 | 9.5%), together accounting for 28.4% of all Elephant Head residents.
| Immigration Origin | # Population | % Population |
| Central America | 49 | 9.5% |
| Latin America | 49 | 9.5% |
| Mexico | 49 | 9.5% | View All 3 Rows |
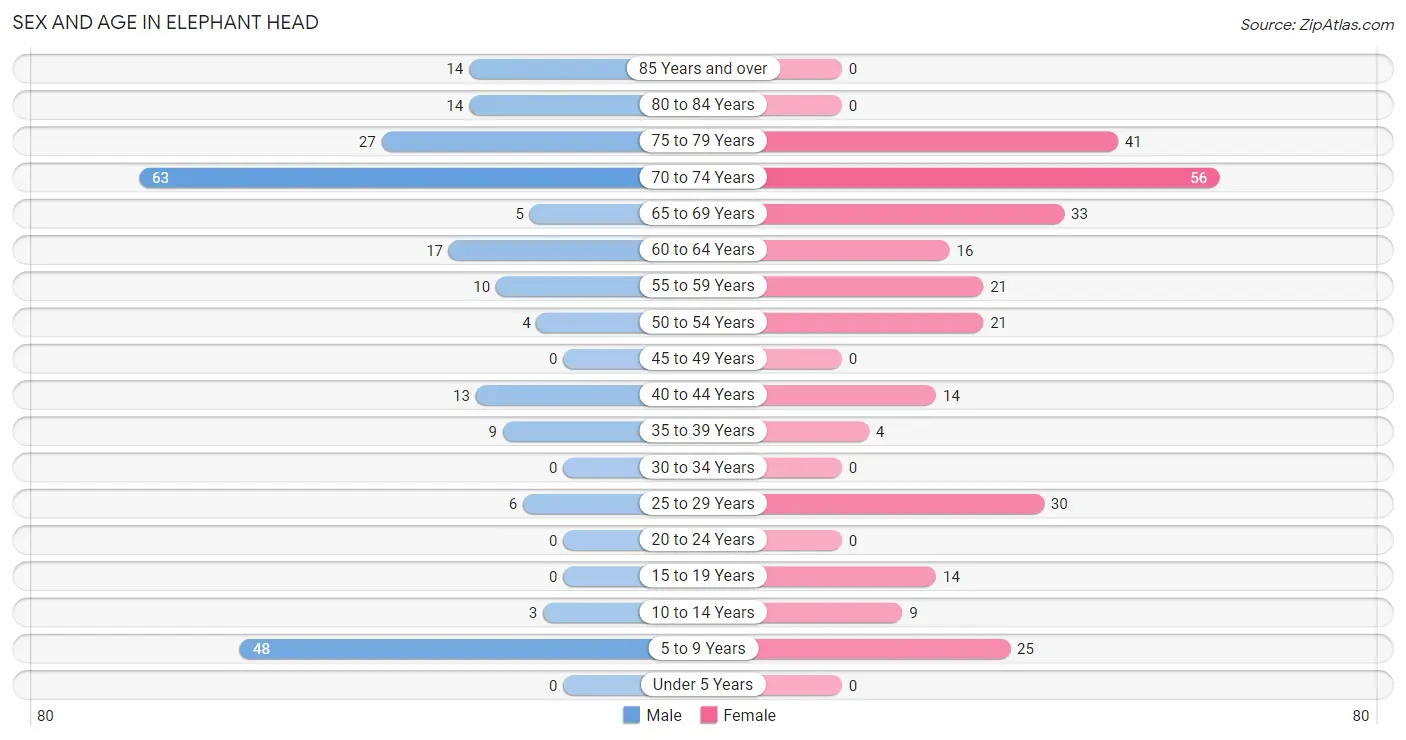
Sex and Age in Elephant Head
Sex and Age in Elephant Head
The most populous age groups in Elephant Head are 70 to 74 Years (63 | 27.0%) for men and 70 to 74 Years (56 | 19.7%) for women.
| Age Bracket | Male | Female |
| Under 5 Years | 0 (0.0%) | 0 (0.0%) |
| 5 to 9 Years | 48 (20.6%) | 25 (8.8%) |
| 10 to 14 Years | 3 (1.3%) | 9 (3.2%) |
| 15 to 19 Years | 0 (0.0%) | 14 (4.9%) |
| 20 to 24 Years | 0 (0.0%) | 0 (0.0%) |
| 25 to 29 Years | 6 (2.6%) | 30 (10.6%) |
| 30 to 34 Years | 0 (0.0%) | 0 (0.0%) |
| 35 to 39 Years | 9 (3.9%) | 4 (1.4%) |
| 40 to 44 Years | 13 (5.6%) | 14 (4.9%) |
| 45 to 49 Years | 0 (0.0%) | 0 (0.0%) |
| 50 to 54 Years | 4 (1.7%) | 21 (7.4%) |
| 55 to 59 Years | 10 (4.3%) | 21 (7.4%) |
| 60 to 64 Years | 17 (7.3%) | 16 (5.6%) |
| 65 to 69 Years | 5 (2.1%) | 33 (11.6%) |
| 70 to 74 Years | 63 (27.0%) | 56 (19.7%) |
| 75 to 79 Years | 27 (11.6%) | 41 (14.4%) |
| 80 to 84 Years | 14 (6.0%) | 0 (0.0%) |
| 85 Years and over | 14 (6.0%) | 0 (0.0%) |
| Total | 233 (100.0%) | 284 (100.0%) |
Families and Households in Elephant Head
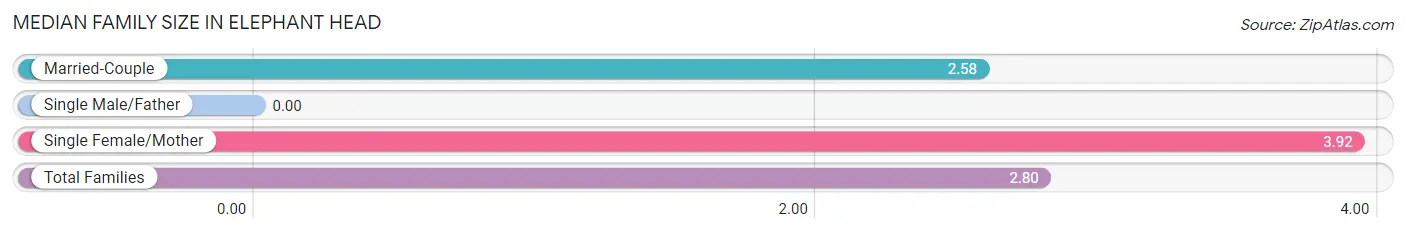
Median Family Size in Elephant Head
| Family Type | # Families | Family Size |
| Married-Couple | 132 (84.1%) | 2.58 |
| Single Male/Father | 0 (0.0%) | - |
| Single Female/Mother | 25 (15.9%) | 3.92 |
| Total Families | 157 (100.0%) | 2.80 |
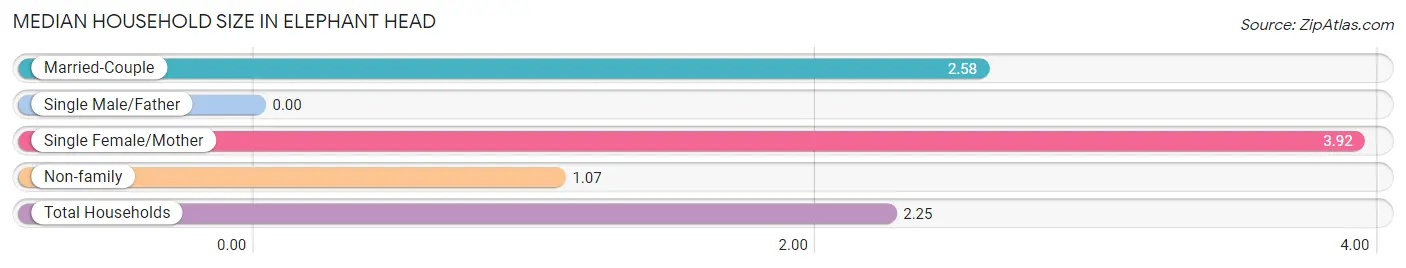
Median Household Size in Elephant Head
| Household Type | # Households | Household Size |
| Married-Couple | 132 (57.4%) | 2.58 |
| Single Male/Father | 0 (0.0%) | - |
| Single Female/Mother | 25 (10.9%) | 3.92 |
| Non-family | 73 (31.7%) | 1.07 |
| Total Households | 230 (100.0%) | 2.25 |
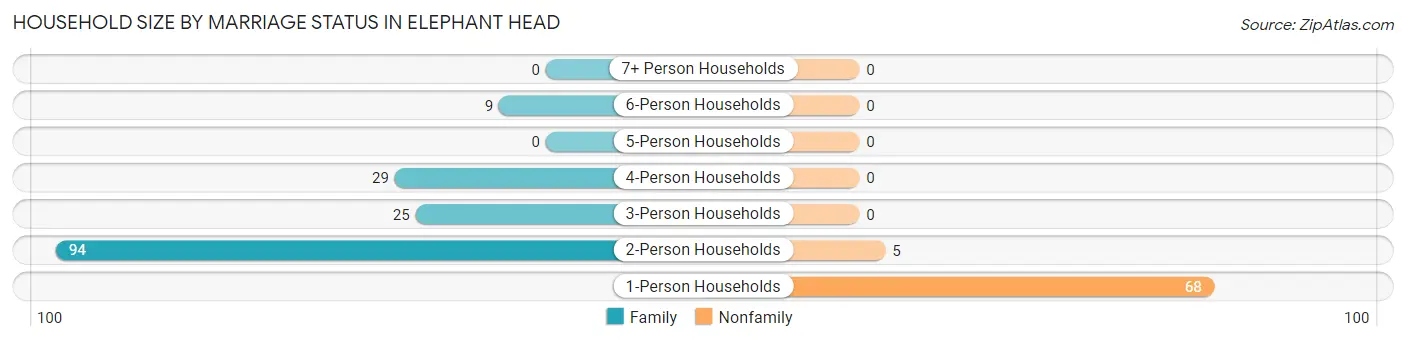
Household Size by Marriage Status in Elephant Head
Out of a total of 230 households in Elephant Head, 157 (68.3%) are family households, while 73 (31.7%) are nonfamily households. The most numerous type of family households are 2-person households, comprising 94, and the most common type of nonfamily households are 1-person households, comprising 68.
| Household Size | Family Households | Nonfamily Households |
| 1-Person Households | - | 68 (29.6%) |
| 2-Person Households | 94 (40.9%) | 5 (2.2%) |
| 3-Person Households | 25 (10.9%) | 0 (0.0%) |
| 4-Person Households | 29 (12.6%) | 0 (0.0%) |
| 5-Person Households | 0 (0.0%) | 0 (0.0%) |
| 6-Person Households | 9 (3.9%) | 0 (0.0%) |
| 7+ Person Households | 0 (0.0%) | 0 (0.0%) |
| Total | 157 (68.3%) | 73 (31.7%) |
Female Fertility in Elephant Head
Fertility by Age in Elephant Head
| Age Bracket | Women with Births | Births / 1,000 Women |
| 15 to 19 years | 0 (0.0%) | 0.0 |
| 20 to 34 years | 0 (0.0%) | 0.0 |
| 35 to 50 years | 0 (0.0%) | 0.0 |
| Total | 0 (0.0%) | 0.0 |
Fertility by Age by Marriage Status in Elephant Head
| Age Bracket | Married | Unmarried |
| 15 to 19 years | 0 (0.0%) | 0 (0.0%) |
| 20 to 34 years | 0 (0.0%) | 0 (0.0%) |
| 35 to 50 years | 0 (0.0%) | 0 (0.0%) |
| Total | 0 (0.0%) | 0 (0.0%) |
Fertility by Education in Elephant Head
| Educational Attainment | Women with Births | Births / 1,000 Women |
| Less than High School | 0 (0.0%) | 0.0 |
| High School Diploma | 0 (0.0%) | 0.0 |
| College or Associate's Degree | 0 (0.0%) | 0.0 |
| Bachelor's Degree | 0 (0.0%) | 0.0 |
| Graduate Degree | 0 (0.0%) | 0.0 |
| Total | 0 (0.0%) | 0.0 |
Fertility by Education by Marriage Status in Elephant Head
| Educational Attainment | Married | Unmarried |
| Less than High School | 0 (0.0%) | 0 (0.0%) |
| High School Diploma | 0 (0.0%) | 0 (0.0%) |
| College or Associate's Degree | 0 (0.0%) | 0 (0.0%) |
| Bachelor's Degree | 0 (0.0%) | 0 (0.0%) |
| Graduate Degree | 0 (0.0%) | 0 (0.0%) |
| Total | 0 (0.0%) | 0 (0.0%) |
Income in Elephant Head
Income Overview in Elephant Head
Per Capita Income in Elephant Head is $29,565, while median incomes of families and households are $46,161 and $46,167 respectively.
| Characteristic | Number | Measure |
| Per Capita Income | 517 | $29,565 |
| Median Family Income | 157 | $46,161 |
| Mean Family Income | 157 | $63,980 |
| Median Household Income | 230 | $46,167 |
| Mean Household Income | 230 | $67,316 |
| Income Deficit | 157 | $0 |
| Wage / Income Gap (%) | 517 | 13.89% |
| Wage / Income Gap ($) | 517 | 86.11¢ per $1 |
| Gini / Inequality Index | 517 | 0.38 |
Earnings by Sex in Elephant Head
Average Earnings in Elephant Head are $39,500, $34,659 for men and $40,250 for women, a difference of 13.9%.
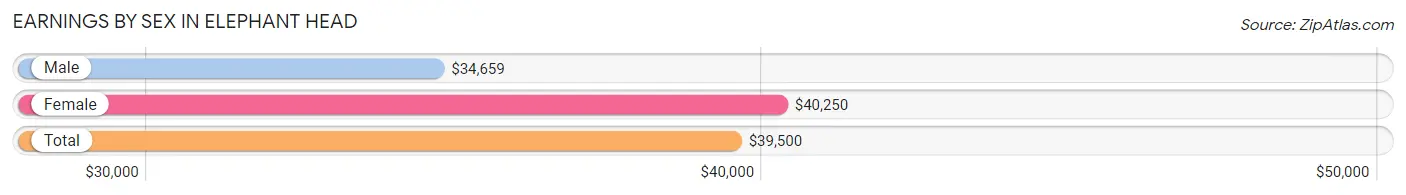
| Sex | Number | Average Earnings |
| Male | 39 (29.1%) | $34,659 |
| Female | 95 (70.9%) | $40,250 |
| Total | 134 (100.0%) | $39,500 |
Earnings by Sex by Income Bracket in Elephant Head
The most common earnings brackets in Elephant Head are $30,000 to $34,999 for men (11 | 28.2%) and $30,000 to $34,999 for women (25 | 26.3%).
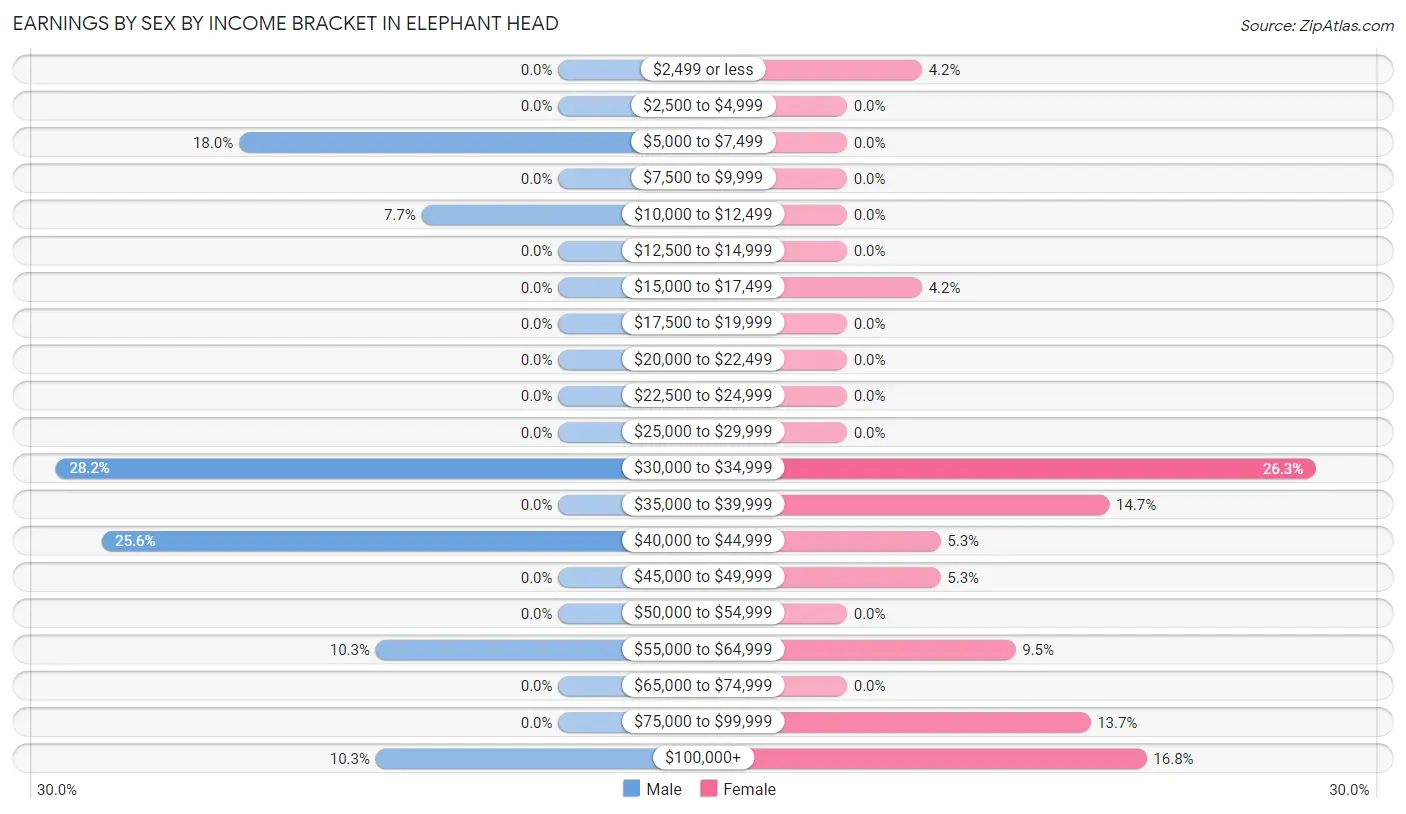
| Income | Male | Female |
| $2,499 or less | 0 (0.0%) | 4 (4.2%) |
| $2,500 to $4,999 | 0 (0.0%) | 0 (0.0%) |
| $5,000 to $7,499 | 7 (17.9%) | 0 (0.0%) |
| $7,500 to $9,999 | 0 (0.0%) | 0 (0.0%) |
| $10,000 to $12,499 | 3 (7.7%) | 0 (0.0%) |
| $12,500 to $14,999 | 0 (0.0%) | 0 (0.0%) |
| $15,000 to $17,499 | 0 (0.0%) | 4 (4.2%) |
| $17,500 to $19,999 | 0 (0.0%) | 0 (0.0%) |
| $20,000 to $22,499 | 0 (0.0%) | 0 (0.0%) |
| $22,500 to $24,999 | 0 (0.0%) | 0 (0.0%) |
| $25,000 to $29,999 | 0 (0.0%) | 0 (0.0%) |
| $30,000 to $34,999 | 11 (28.2%) | 25 (26.3%) |
| $35,000 to $39,999 | 0 (0.0%) | 14 (14.7%) |
| $40,000 to $44,999 | 10 (25.6%) | 5 (5.3%) |
| $45,000 to $49,999 | 0 (0.0%) | 5 (5.3%) |
| $50,000 to $54,999 | 0 (0.0%) | 0 (0.0%) |
| $55,000 to $64,999 | 4 (10.3%) | 9 (9.5%) |
| $65,000 to $74,999 | 0 (0.0%) | 0 (0.0%) |
| $75,000 to $99,999 | 0 (0.0%) | 13 (13.7%) |
| $100,000+ | 4 (10.3%) | 16 (16.8%) |
| Total | 39 (100.0%) | 95 (100.0%) |
Earnings by Sex by Educational Attainment in Elephant Head
Average earnings in Elephant Head are $34,659 for men and $40,250 for women, a difference of 13.9%. Men with an educational attainment of college or associate's degree enjoy the highest average annual earnings of $41,875, while those with college or associate's degree education earn the least with $41,875. Women with an educational attainment of bachelor's degree earn the most with the average annual earnings of $110,156, while those with high school diploma education have the smallest earnings of $35,278.
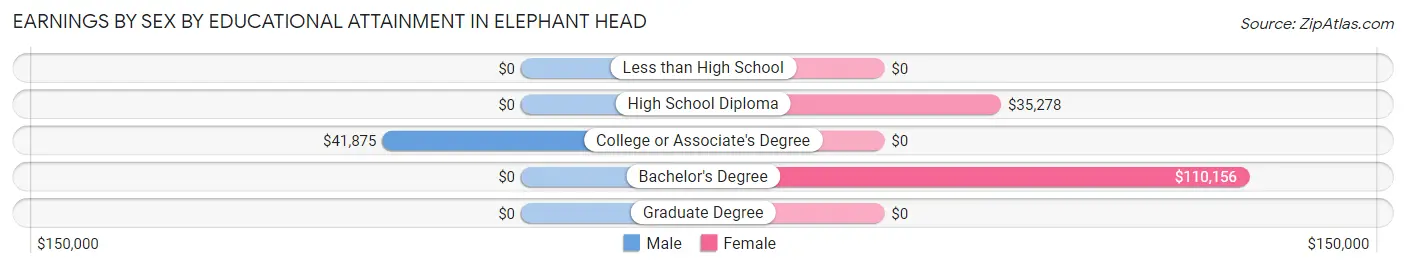
| Educational Attainment | Male Income | Female Income |
| Less than High School | - | - |
| High School Diploma | - | - |
| College or Associate's Degree | $41,875 | $0 |
| Bachelor's Degree | - | - |
| Graduate Degree | - | - |
| Total | $34,659 | $40,250 |
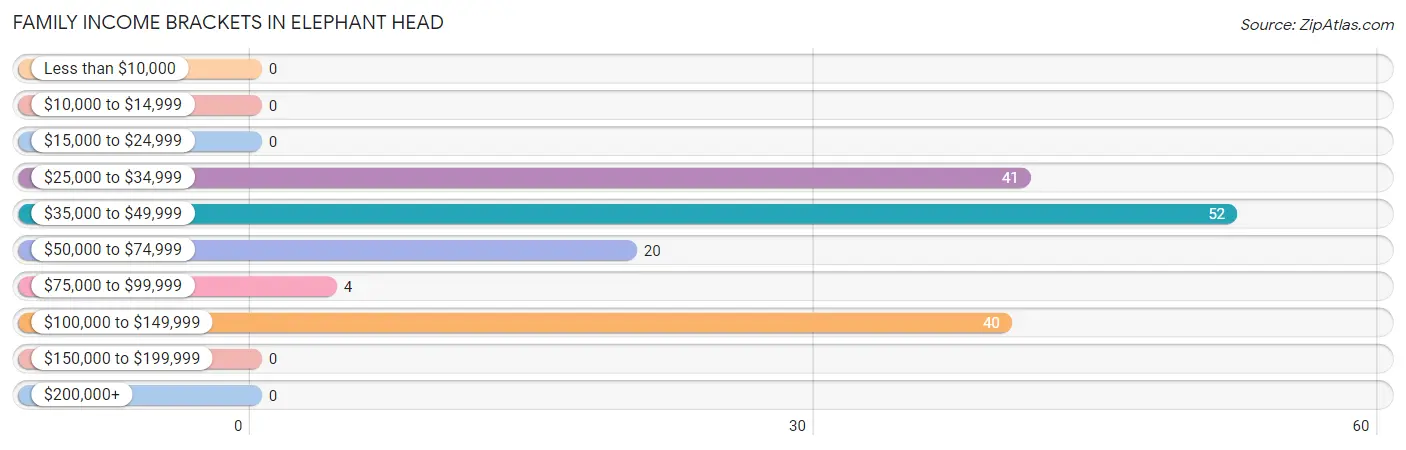
Family Income in Elephant Head
Family Income Brackets in Elephant Head
According to the Elephant Head family income data, there are 52 families falling into the $35,000 to $49,999 income range, which is the most common income bracket and makes up 33.1% of all families.
| Income Bracket | # Families | % Families |
| Less than $10,000 | 0 | 0.0% |
| $10,000 to $14,999 | 0 | 0.0% |
| $15,000 to $24,999 | 0 | 0.0% |
| $25,000 to $34,999 | 41 | 26.1% |
| $35,000 to $49,999 | 52 | 33.1% |
| $50,000 to $74,999 | 20 | 12.7% |
| $75,000 to $99,999 | 4 | 2.5% |
| $100,000 to $149,999 | 40 | 25.5% |
| $150,000 to $199,999 | 0 | 0.0% |
| $200,000+ | 0 | 0.0% |
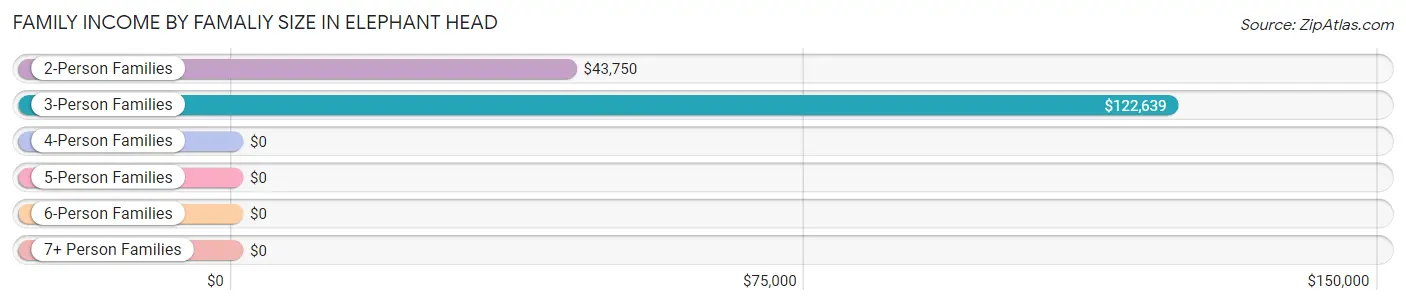
Family Income by Famaliy Size in Elephant Head
3-person families (25 | 15.9%) account for the highest median family income in Elephant Head with $122,639 per family, while 3-person families (25 | 15.9%) have the highest median income of $40,880 per family member.
| Income Bracket | # Families | Median Income |
| 2-Person Families | 94 (59.9%) | $43,750 |
| 3-Person Families | 25 (15.9%) | $122,639 |
| 4-Person Families | 29 (18.5%) | $0 |
| 5-Person Families | 0 (0.0%) | $0 |
| 6-Person Families | 9 (5.7%) | $0 |
| 7+ Person Families | 0 (0.0%) | $0 |
| Total | 157 (100.0%) | $46,161 |
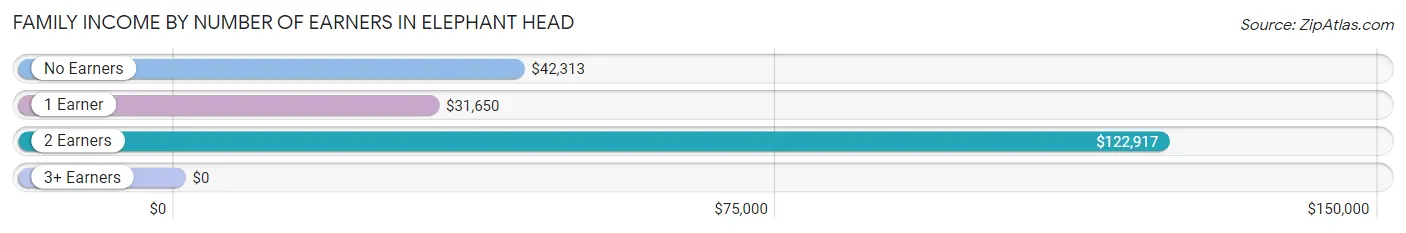
Family Income by Number of Earners in Elephant Head
| Number of Earners | # Families | Median Income |
| No Earners | 83 (52.9%) | $42,313 |
| 1 Earner | 33 (21.0%) | $31,650 |
| 2 Earners | 41 (26.1%) | $122,917 |
| 3+ Earners | 0 (0.0%) | $0 |
| Total | 157 (100.0%) | $46,161 |
Household Income in Elephant Head
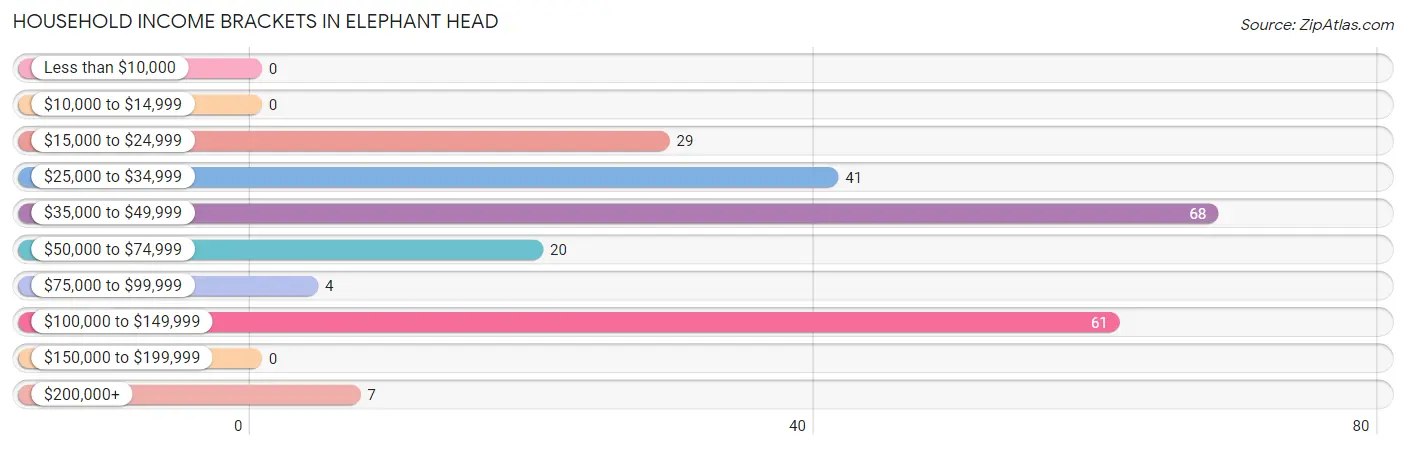
Household Income Brackets in Elephant Head
With 68 households falling in the category, the $35,000 to $49,999 income range is the most frequent in Elephant Head, accounting for 29.6% of all households.
| Income Bracket | # Households | % Households |
| Less than $10,000 | 0 | 0.0% |
| $10,000 to $14,999 | 0 | 0.0% |
| $15,000 to $24,999 | 29 | 12.6% |
| $25,000 to $34,999 | 41 | 17.8% |
| $35,000 to $49,999 | 68 | 29.6% |
| $50,000 to $74,999 | 20 | 8.7% |
| $75,000 to $99,999 | 4 | 1.7% |
| $100,000 to $149,999 | 61 | 26.5% |
| $150,000 to $199,999 | 0 | 0.0% |
| $200,000+ | 7 | 3.0% |
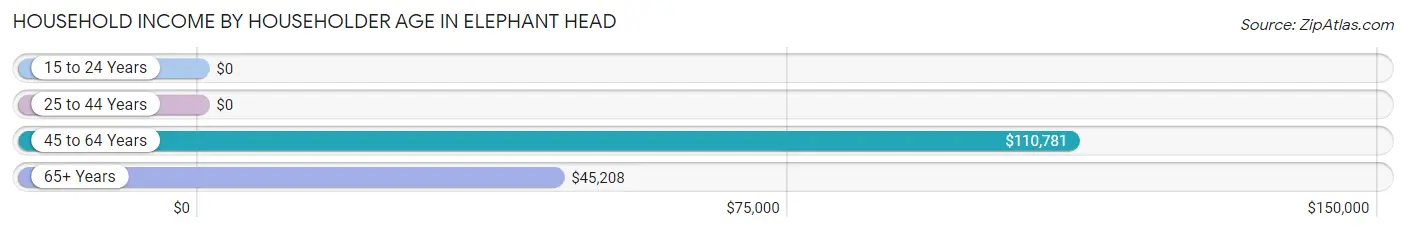
Household Income by Householder Age in Elephant Head
The median household income in Elephant Head is $46,167, with the highest median household income of $110,781 found in the 45 to 64 years age bracket for the primary householder. A total of 54 households (23.5%) fall into this category.
| Income Bracket | # Households | Median Income |
| 15 to 24 Years | 0 (0.0%) | $0 |
| 25 to 44 Years | 39 (17.0%) | $0 |
| 45 to 64 Years | 54 (23.5%) | $110,781 |
| 65+ Years | 137 (59.6%) | $45,208 |
| Total | 230 (100.0%) | $46,167 |
Poverty in Elephant Head
Income Below Poverty by Sex and Age in Elephant Head
| Age Bracket | Male | Female |
| Under 5 Years | 0 (0.0%) | 0 (0.0%) |
| 5 Years | 0 (0.0%) | 0 (0.0%) |
| 6 to 11 Years | 0 (0.0%) | 0 (0.0%) |
| 12 to 14 Years | 0 (0.0%) | 0 (0.0%) |
| 15 Years | 0 (0.0%) | 0 (0.0%) |
| 16 and 17 Years | 0 (0.0%) | 0 (0.0%) |
| 18 to 24 Years | 0 (0.0%) | 0 (0.0%) |
| 25 to 34 Years | 0 (0.0%) | 0 (0.0%) |
| 35 to 44 Years | 0 (0.0%) | 0 (0.0%) |
| 45 to 54 Years | 0 (0.0%) | 0 (0.0%) |
| 55 to 64 Years | 0 (0.0%) | 0 (0.0%) |
| 65 to 74 Years | 0 (0.0%) | 0 (0.0%) |
| 75 Years and over | 0 (0.0%) | 0 (0.0%) |
| Total | 0 (0.0%) | 0 (0.0%) |
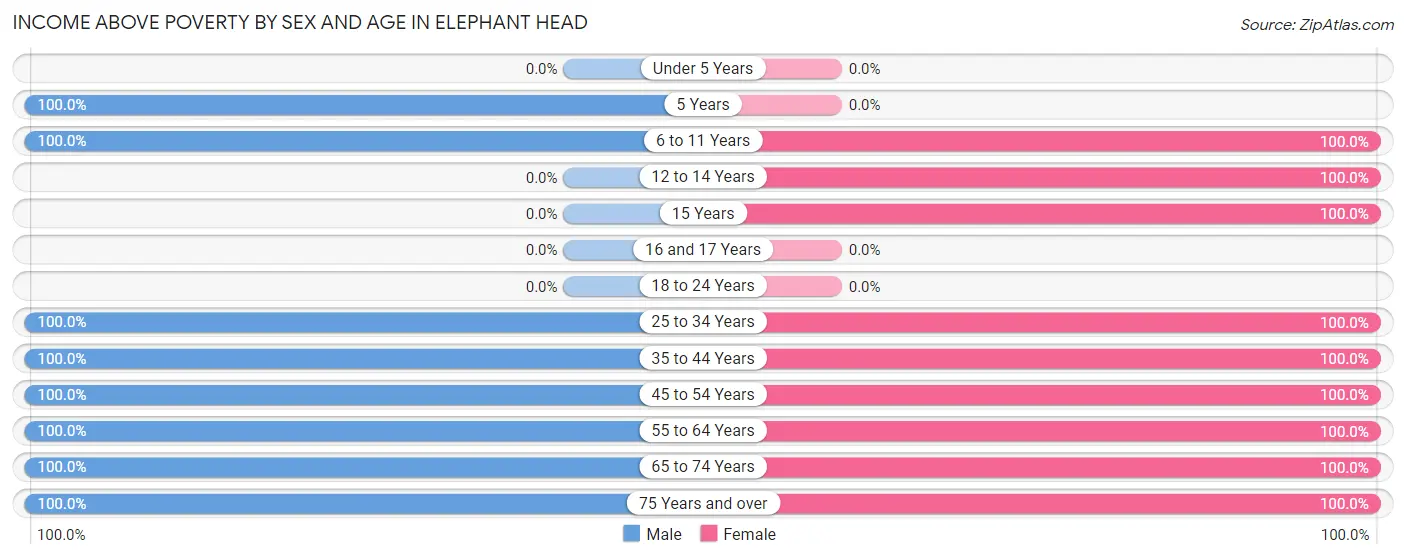
Income Above Poverty by Sex and Age in Elephant Head
According to the poverty statistics in Elephant Head, males aged 5 years and females aged 6 to 11 years are the age groups that are most secure financially, with 100.0% of males and 100.0% of females in these age groups living above the poverty line.
| Age Bracket | Male | Female |
| Under 5 Years | 0 (0.0%) | 0 (0.0%) |
| 5 Years | 24 (100.0%) | 0 (0.0%) |
| 6 to 11 Years | 27 (100.0%) | 25 (100.0%) |
| 12 to 14 Years | 0 (0.0%) | 9 (100.0%) |
| 15 Years | 0 (0.0%) | 14 (100.0%) |
| 16 and 17 Years | 0 (0.0%) | 0 (0.0%) |
| 18 to 24 Years | 0 (0.0%) | 0 (0.0%) |
| 25 to 34 Years | 6 (100.0%) | 30 (100.0%) |
| 35 to 44 Years | 22 (100.0%) | 18 (100.0%) |
| 45 to 54 Years | 4 (100.0%) | 21 (100.0%) |
| 55 to 64 Years | 27 (100.0%) | 37 (100.0%) |
| 65 to 74 Years | 68 (100.0%) | 89 (100.0%) |
| 75 Years and over | 55 (100.0%) | 41 (100.0%) |
| Total | 233 (100.0%) | 284 (100.0%) |
Income Below Poverty Among Married-Couple Families in Elephant Head
| Children | Above Poverty | Below Poverty |
| No Children | 115 (100.0%) | 0 (0.0%) |
| 1 or 2 Children | 17 (100.0%) | 0 (0.0%) |
| 3 or 4 Children | 0 (0.0%) | 0 (0.0%) |
| 5 or more Children | 0 (0.0%) | 0 (0.0%) |
| Total | 132 (100.0%) | 0 (0.0%) |
Income Below Poverty Among Single-Parent Households in Elephant Head
| Children | Single Father | Single Mother |
| No Children | 0 (0.0%) | 0 (0.0%) |
| 1 or 2 Children | 0 (0.0%) | 0 (0.0%) |
| 3 or 4 Children | 0 (0.0%) | 0 (0.0%) |
| 5 or more Children | 0 (0.0%) | 0 (0.0%) |
| Total | 0 (0.0%) | 0 (0.0%) |
Income Below Poverty Among Married-Couple vs Single-Parent Households in Elephant Head
| Children | Married-Couple Families | Single-Parent Households |
| No Children | 0 (0.0%) | 0 (0.0%) |
| 1 or 2 Children | 0 (0.0%) | 0 (0.0%) |
| 3 or 4 Children | 0 (0.0%) | 0 (0.0%) |
| 5 or more Children | 0 (0.0%) | 0 (0.0%) |
| Total | 0 (0.0%) | 0 (0.0%) |
Employment Characteristics in Elephant Head
Employment by Class of Employer in Elephant Head
Among the 121 employed individuals in Elephant Head, private company employees (82 | 67.8%), not-for-profit organizations (30 | 24.8%), and self-employed (not incorporated) (9 | 7.4%) make up the most common classes of employment.
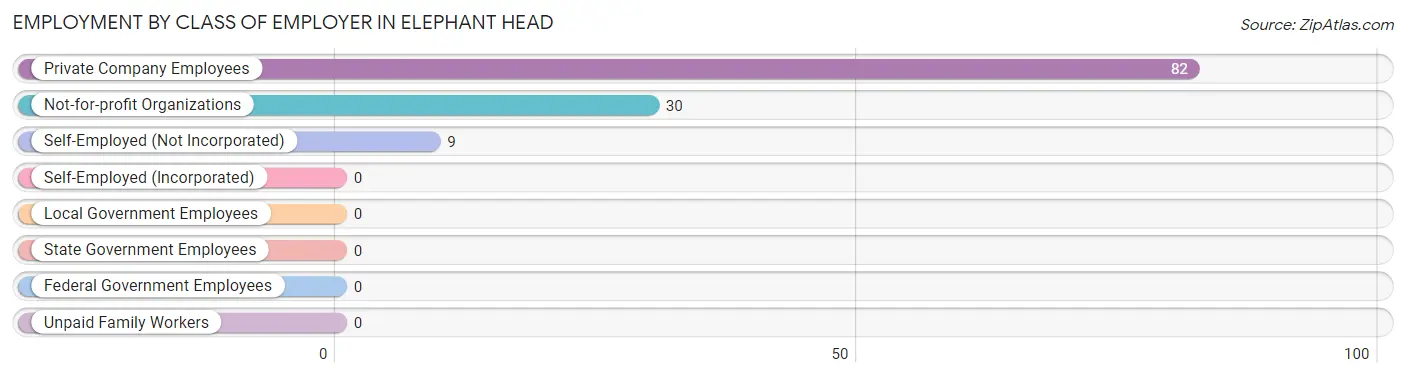
| Employer Class | # Employees | % Employees |
| Private Company Employees | 82 | 67.8% |
| Self-Employed (Incorporated) | 0 | 0.0% |
| Self-Employed (Not Incorporated) | 9 | 7.4% |
| Not-for-profit Organizations | 30 | 24.8% |
| Local Government Employees | 0 | 0.0% |
| State Government Employees | 0 | 0.0% |
| Federal Government Employees | 0 | 0.0% |
| Unpaid Family Workers | 0 | 0.0% |
| Total | 121 | 100.0% |
Employment Status by Age in Elephant Head
According to the labor force statistics for Elephant Head, out of the total population over 16 years of age (418), 29.7% or 124 individuals are in the labor force, with 2.4% or 3 of them unemployed. The age group with the highest labor force participation rate is 45 to 54 years, with 100.0% or 25 individuals in the labor force. Within the labor force, the 35 to 44 years age range has the highest percentage of unemployed individuals, with 8.3% or 3 of them being unemployed.
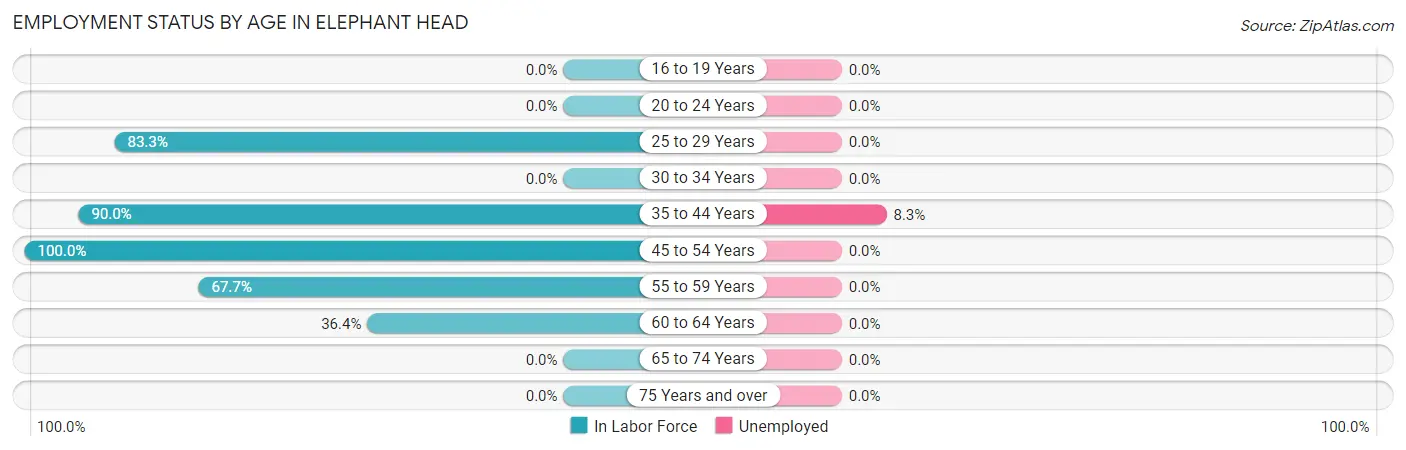
| Age Bracket | In Labor Force | Unemployed |
| 16 to 19 Years | 0 (0.0%) | 0 (0.0%) |
| 20 to 24 Years | 0 (0.0%) | 0 (0.0%) |
| 25 to 29 Years | 30 (83.3%) | 0 (0.0%) |
| 30 to 34 Years | 0 (0.0%) | 0 (0.0%) |
| 35 to 44 Years | 36 (90.0%) | 3 (8.3%) |
| 45 to 54 Years | 25 (100.0%) | 0 (0.0%) |
| 55 to 59 Years | 21 (67.7%) | 0 (0.0%) |
| 60 to 64 Years | 12 (36.4%) | 0 (0.0%) |
| 65 to 74 Years | 0 (0.0%) | 0 (0.0%) |
| 75 Years and over | 0 (0.0%) | 0 (0.0%) |
| Total | 124 (29.7%) | 3 (2.4%) |
Employment Status by Educational Attainment in Elephant Head
According to labor force statistics for Elephant Head, 75.2% of individuals (124) out of the total population between 25 and 64 years of age (165) are in the labor force, with 2.4% or 3 of them being unemployed. The group with the highest labor force participation rate are those with the educational attainment of bachelor's degree or higher, with 100.0% or 37 individuals in the labor force. Within the labor force, individuals with college / associate degree education have the highest percentage of unemployment, with 10.0% or 3 of them being unemployed.
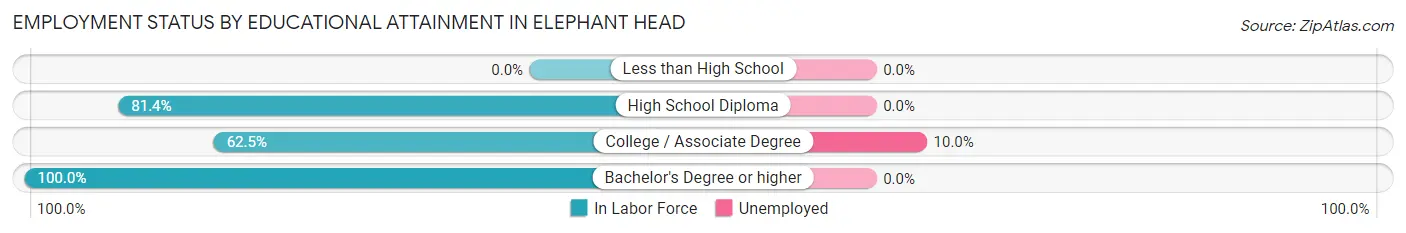
| Educational Attainment | In Labor Force | Unemployed |
| Less than High School | 0 (0.0%) | 0 (0.0%) |
| High School Diploma | 57 (81.4%) | 0 (0.0%) |
| College / Associate Degree | 30 (62.5%) | 5 (10.0%) |
| Bachelor's Degree or higher | 37 (100.0%) | 0 (0.0%) |
| Total | 124 (75.2%) | 4 (2.4%) |
Employment Occupations by Sex in Elephant Head
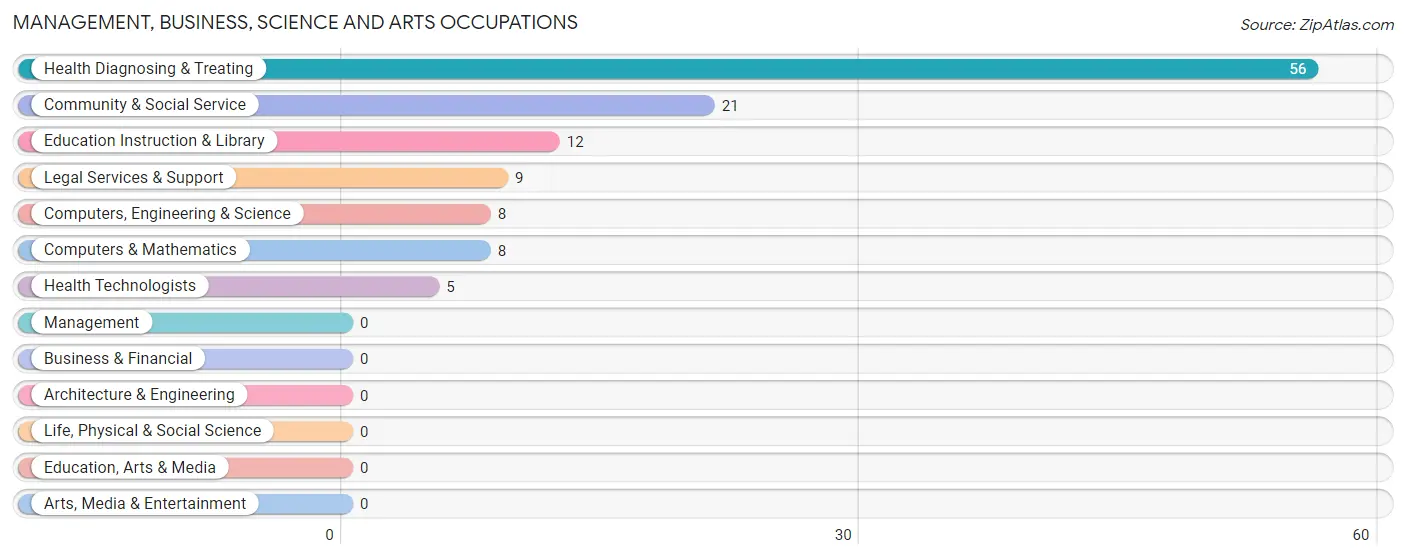
Management, Business, Science and Arts Occupations
The most common Management, Business, Science and Arts occupations in Elephant Head are Health Diagnosing & Treating (56 | 46.3%), Community & Social Service (21 | 17.4%), Education Instruction & Library (12 | 9.9%), Legal Services & Support (9 | 7.4%), and Computers, Engineering & Science (8 | 6.6%).
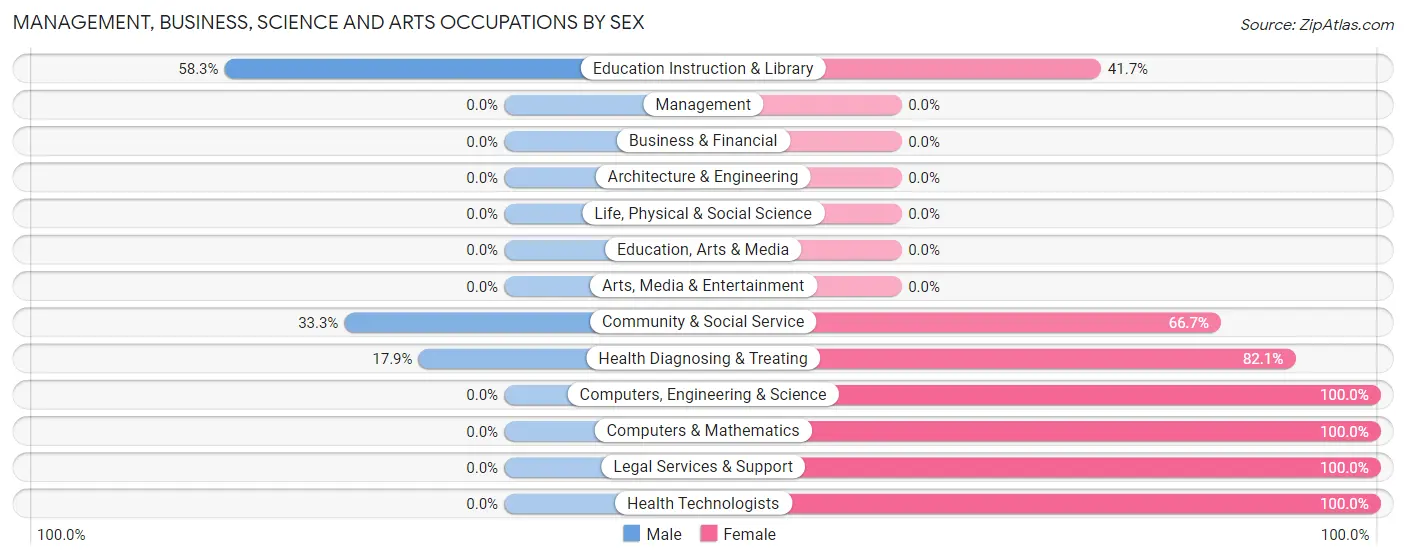
Management, Business, Science and Arts Occupations by Sex
Within the Management, Business, Science and Arts occupations in Elephant Head, the most male-oriented occupations are Education Instruction & Library (58.3%), Community & Social Service (33.3%), and Health Diagnosing & Treating (17.9%), while the most female-oriented occupations are Computers, Engineering & Science (100.0%), Computers & Mathematics (100.0%), and Legal Services & Support (100.0%).
| Occupation | Male | Female |
| Management | 0 (0.0%) | 0 (0.0%) |
| Business & Financial | 0 (0.0%) | 0 (0.0%) |
| Computers, Engineering & Science | 0 (0.0%) | 8 (100.0%) |
| Computers & Mathematics | 0 (0.0%) | 8 (100.0%) |
| Architecture & Engineering | 0 (0.0%) | 0 (0.0%) |
| Life, Physical & Social Science | 0 (0.0%) | 0 (0.0%) |
| Community & Social Service | 7 (33.3%) | 14 (66.7%) |
| Education, Arts & Media | 0 (0.0%) | 0 (0.0%) |
| Legal Services & Support | 0 (0.0%) | 9 (100.0%) |
| Education Instruction & Library | 7 (58.3%) | 5 (41.7%) |
| Arts, Media & Entertainment | 0 (0.0%) | 0 (0.0%) |
| Health Diagnosing & Treating | 10 (17.9%) | 46 (82.1%) |
| Health Technologists | 0 (0.0%) | 5 (100.0%) |
| Total (Category) | 17 (20.0%) | 68 (80.0%) |
| Total (Overall) | 30 (24.8%) | 91 (75.2%) |
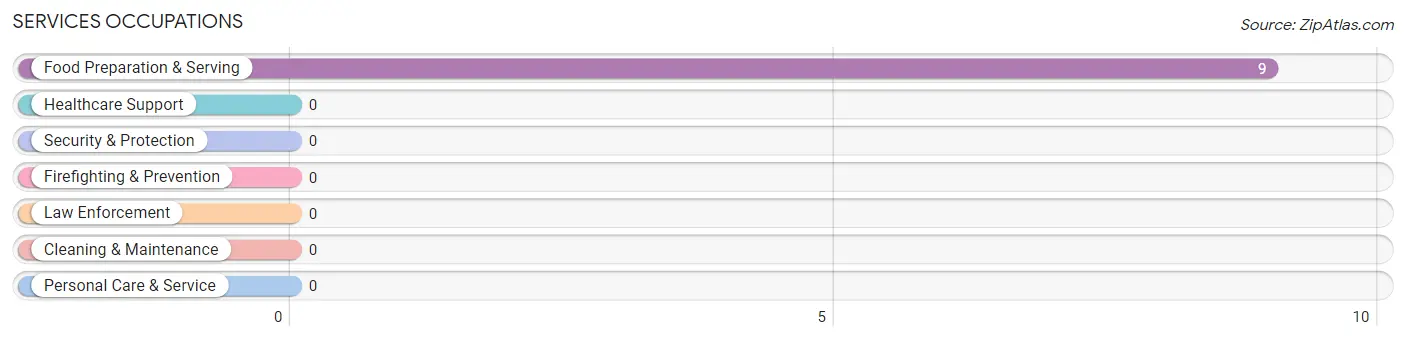
Services Occupations
The most common Services occupations in Elephant Head are , and Food Preparation & Serving (9 | 7.4%).
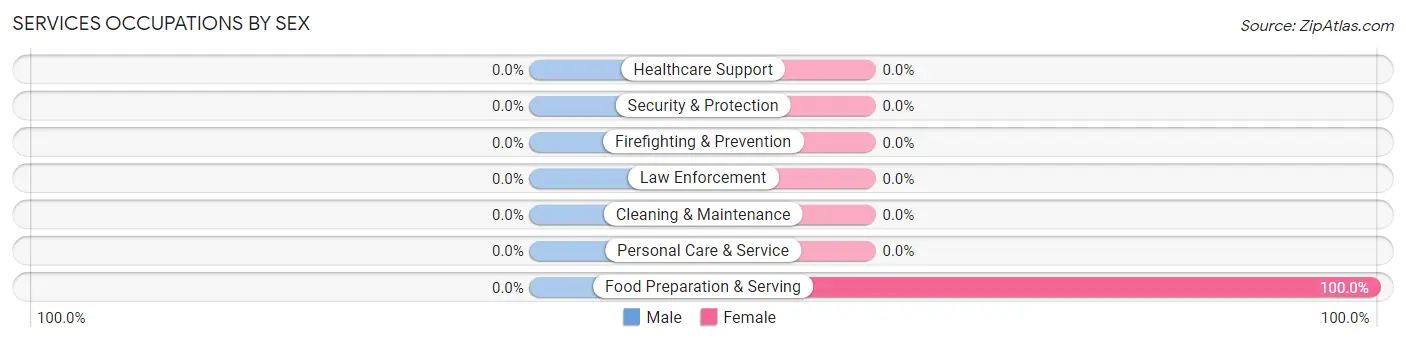
Services Occupations by Sex
| Occupation | Male | Female |
| Healthcare Support | 0 (0.0%) | 0 (0.0%) |
| Security & Protection | 0 (0.0%) | 0 (0.0%) |
| Firefighting & Prevention | 0 (0.0%) | 0 (0.0%) |
| Law Enforcement | 0 (0.0%) | 0 (0.0%) |
| Food Preparation & Serving | 0 (0.0%) | 9 (100.0%) |
| Cleaning & Maintenance | 0 (0.0%) | 0 (0.0%) |
| Personal Care & Service | 0 (0.0%) | 0 (0.0%) |
| Total (Category) | 0 (0.0%) | 9 (100.0%) |
| Total (Overall) | 30 (24.8%) | 91 (75.2%) |
Sales and Office Occupations
The most common Sales and Office occupations in Elephant Head are Office & Administration (10 | 8.3%), and Sales & Related (4 | 3.3%).
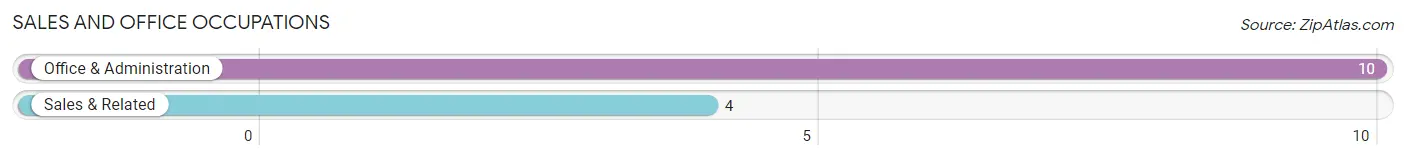
Sales and Office Occupations by Sex
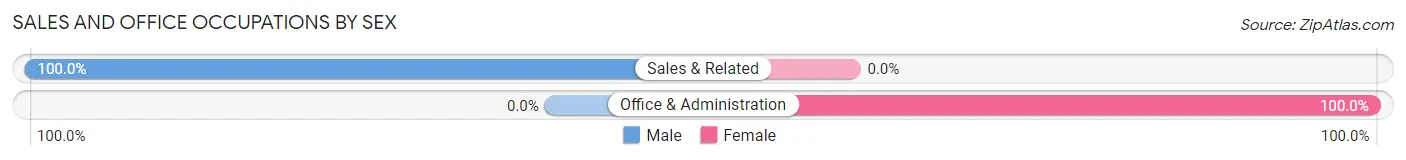
| Occupation | Male | Female |
| Sales & Related | 4 (100.0%) | 0 (0.0%) |
| Office & Administration | 0 (0.0%) | 10 (100.0%) |
| Total (Category) | 4 (28.6%) | 10 (71.4%) |
| Total (Overall) | 30 (24.8%) | 91 (75.2%) |
Natural Resources, Construction and Maintenance Occupations
The most common Natural Resources, Construction and Maintenance occupations in Elephant Head are , and Construction & Extraction (9 | 7.4%).
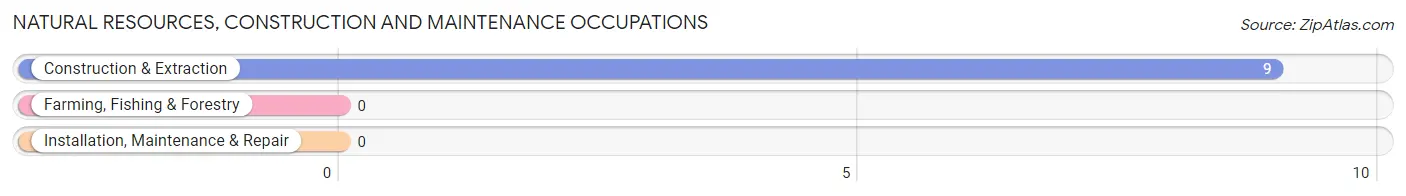
Natural Resources, Construction and Maintenance Occupations by Sex
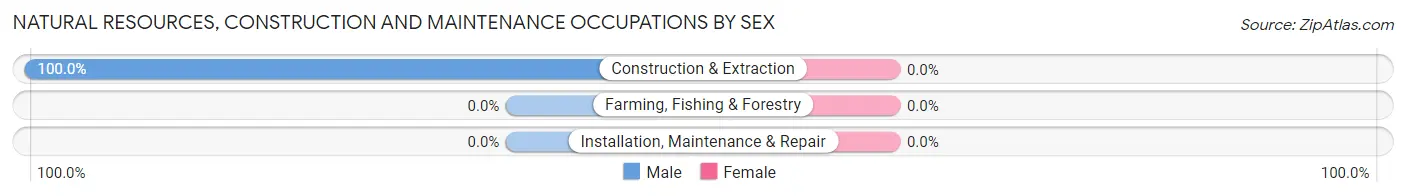
| Occupation | Male | Female |
| Farming, Fishing & Forestry | 0 (0.0%) | 0 (0.0%) |
| Construction & Extraction | 9 (100.0%) | 0 (0.0%) |
| Installation, Maintenance & Repair | 0 (0.0%) | 0 (0.0%) |
| Total (Category) | 9 (100.0%) | 0 (0.0%) |
| Total (Overall) | 30 (24.8%) | 91 (75.2%) |
Production, Transportation and Moving Occupations
The most common Production, Transportation and Moving occupations in Elephant Head are , and Production (4 | 3.3%).
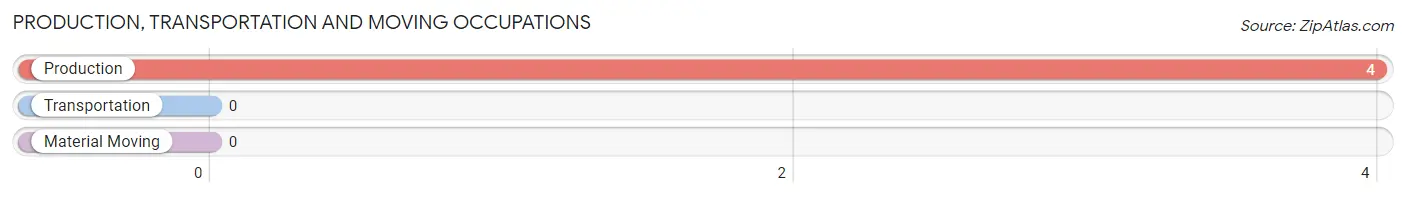
Production, Transportation and Moving Occupations by Sex
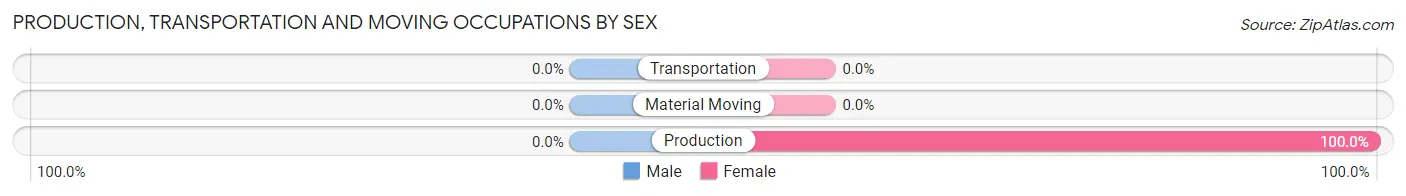
| Occupation | Male | Female |
| Production | 0 (0.0%) | 4 (100.0%) |
| Transportation | 0 (0.0%) | 0 (0.0%) |
| Material Moving | 0 (0.0%) | 0 (0.0%) |
| Total (Category) | 0 (0.0%) | 4 (100.0%) |
| Total (Overall) | 30 (24.8%) | 91 (75.2%) |
Employment Industries by Sex in Elephant Head
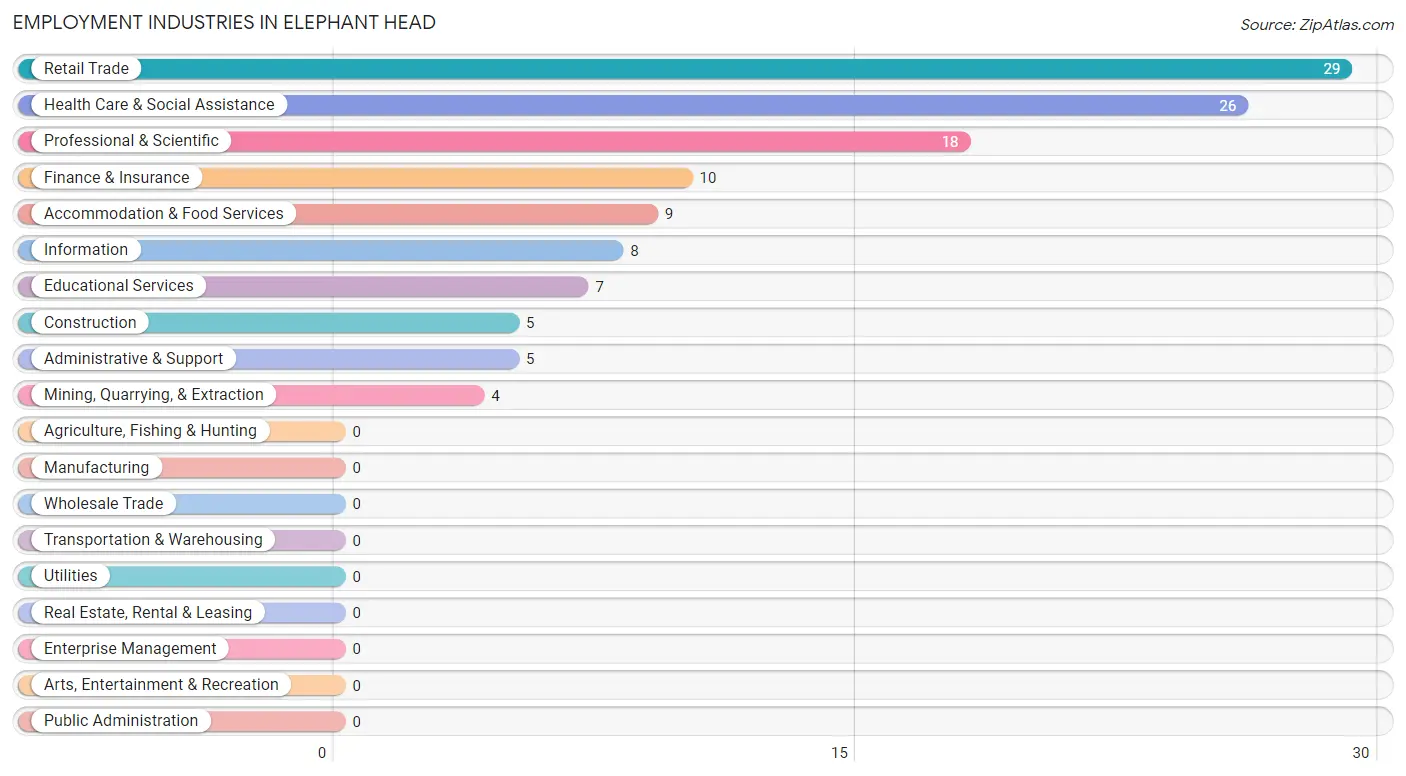
Employment Industries in Elephant Head
The major employment industries in Elephant Head include Retail Trade (29 | 24.0%), Health Care & Social Assistance (26 | 21.5%), Professional & Scientific (18 | 14.9%), Finance & Insurance (10 | 8.3%), and Accommodation & Food Services (9 | 7.4%).
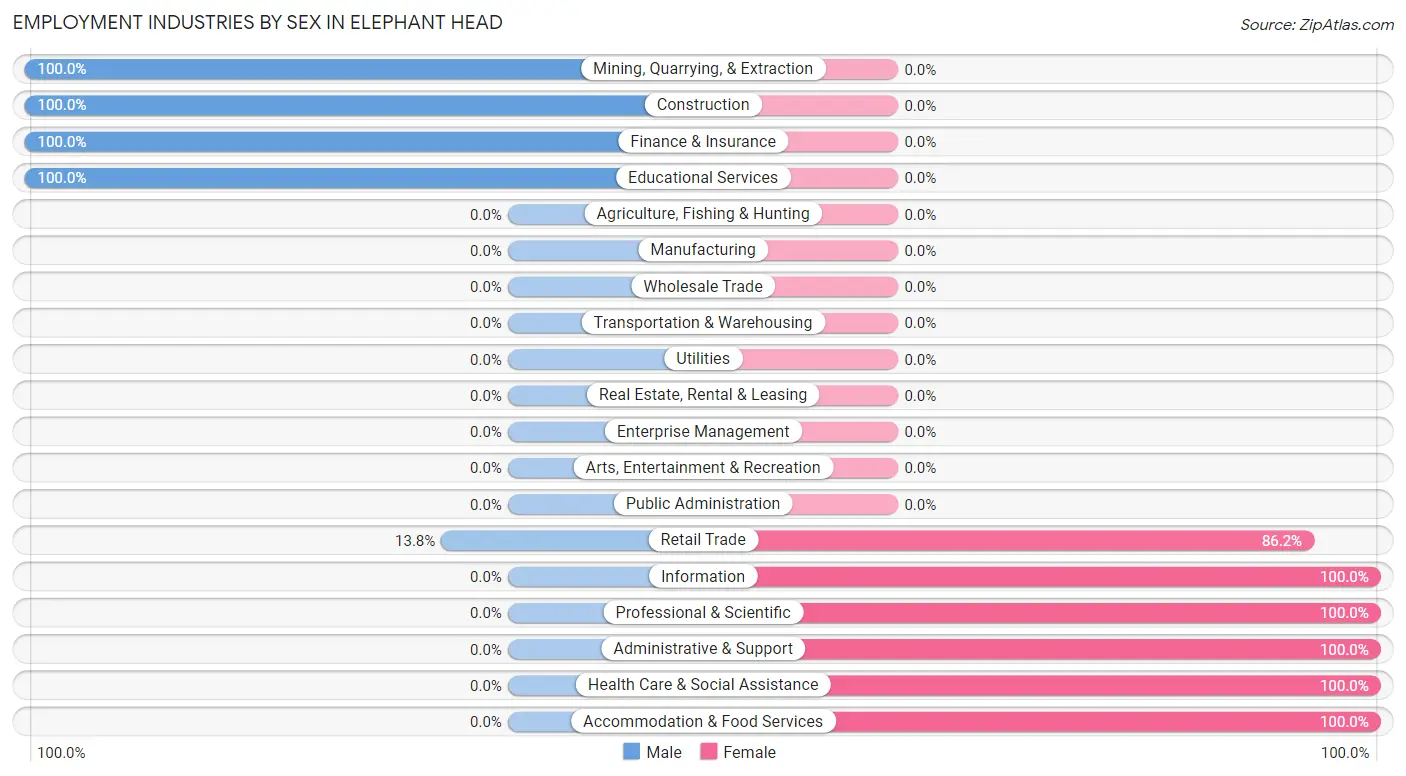
Employment Industries by Sex in Elephant Head
The Elephant Head industries that see more men than women are Mining, Quarrying, & Extraction (100.0%), Construction (100.0%), and Finance & Insurance (100.0%), whereas the industries that tend to have a higher number of women are Information (100.0%), Professional & Scientific (100.0%), and Administrative & Support (100.0%).
| Industry | Male | Female |
| Agriculture, Fishing & Hunting | 0 (0.0%) | 0 (0.0%) |
| Mining, Quarrying, & Extraction | 4 (100.0%) | 0 (0.0%) |
| Construction | 5 (100.0%) | 0 (0.0%) |
| Manufacturing | 0 (0.0%) | 0 (0.0%) |
| Wholesale Trade | 0 (0.0%) | 0 (0.0%) |
| Retail Trade | 4 (13.8%) | 25 (86.2%) |
| Transportation & Warehousing | 0 (0.0%) | 0 (0.0%) |
| Utilities | 0 (0.0%) | 0 (0.0%) |
| Information | 0 (0.0%) | 8 (100.0%) |
| Finance & Insurance | 10 (100.0%) | 0 (0.0%) |
| Real Estate, Rental & Leasing | 0 (0.0%) | 0 (0.0%) |
| Professional & Scientific | 0 (0.0%) | 18 (100.0%) |
| Enterprise Management | 0 (0.0%) | 0 (0.0%) |
| Administrative & Support | 0 (0.0%) | 5 (100.0%) |
| Educational Services | 7 (100.0%) | 0 (0.0%) |
| Health Care & Social Assistance | 0 (0.0%) | 26 (100.0%) |
| Arts, Entertainment & Recreation | 0 (0.0%) | 0 (0.0%) |
| Accommodation & Food Services | 0 (0.0%) | 9 (100.0%) |
| Public Administration | 0 (0.0%) | 0 (0.0%) |
| Total | 30 (24.8%) | 91 (75.2%) |
Education in Elephant Head
School Enrollment in Elephant Head
The most common levels of schooling among the 87 students in Elephant Head are elementary school (49 | 56.3%), high school (14 | 16.1%), and middle school (12 | 13.8%).
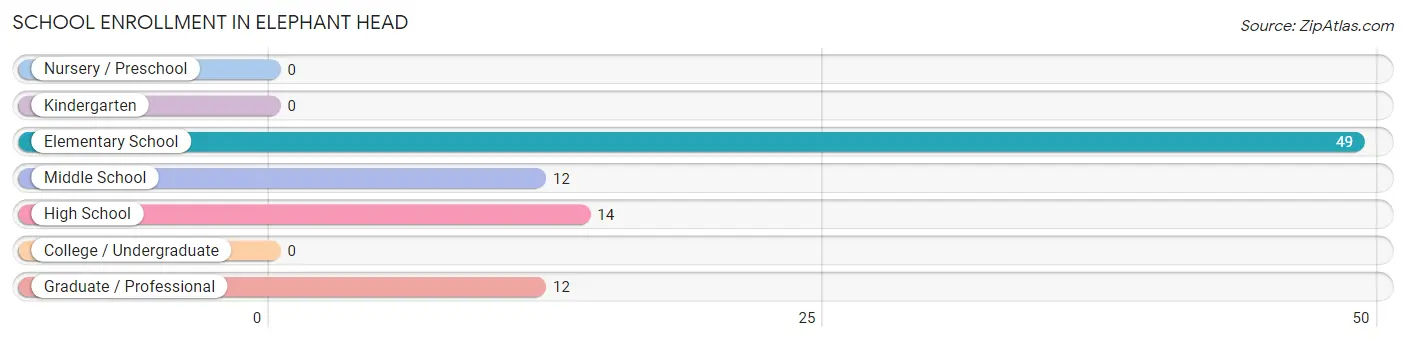
| School Level | # Students | % Students |
| Nursery / Preschool | 0 | 0.0% |
| Kindergarten | 0 | 0.0% |
| Elementary School | 49 | 56.3% |
| Middle School | 12 | 13.8% |
| High School | 14 | 16.1% |
| College / Undergraduate | 0 | 0.0% |
| Graduate / Professional | 12 | 13.8% |
| Total | 87 | 100.0% |
School Enrollment by Age by Funding Source in Elephant Head
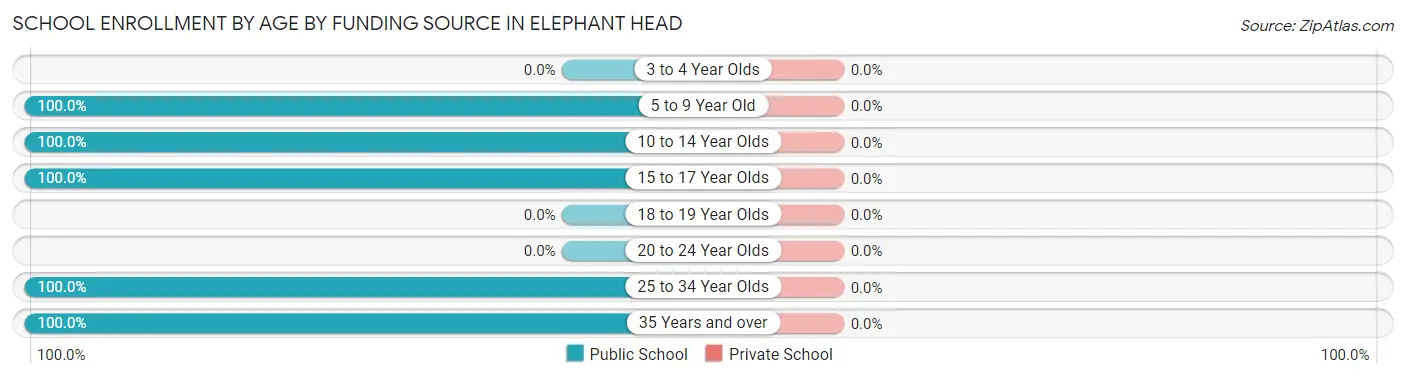
| Age Bracket | Public School | Private School |
| 3 to 4 Year Olds | 0 (0.0%) | 0 (0.0%) |
| 5 to 9 Year Old | 49 (100.0%) | 0 (0.0%) |
| 10 to 14 Year Olds | 12 (100.0%) | 0 (0.0%) |
| 15 to 17 Year Olds | 14 (100.0%) | 0 (0.0%) |
| 18 to 19 Year Olds | 0 (0.0%) | 0 (0.0%) |
| 20 to 24 Year Olds | 0 (0.0%) | 0 (0.0%) |
| 25 to 34 Year Olds | 5 (100.0%) | 0 (0.0%) |
| 35 Years and over | 7 (100.0%) | 0 (0.0%) |
| Total | 87 (100.0%) | 0 (0.0%) |
Educational Attainment by Field of Study in Elephant Head
Business (27 | 22.0%), bio, nature & agricultural (23 | 18.7%), social sciences (20 | 16.3%), engineering (18 | 14.6%), and liberal arts & history (16 | 13.0%) are the most common fields of study among 123 individuals in Elephant Head who have obtained a bachelor's degree or higher.
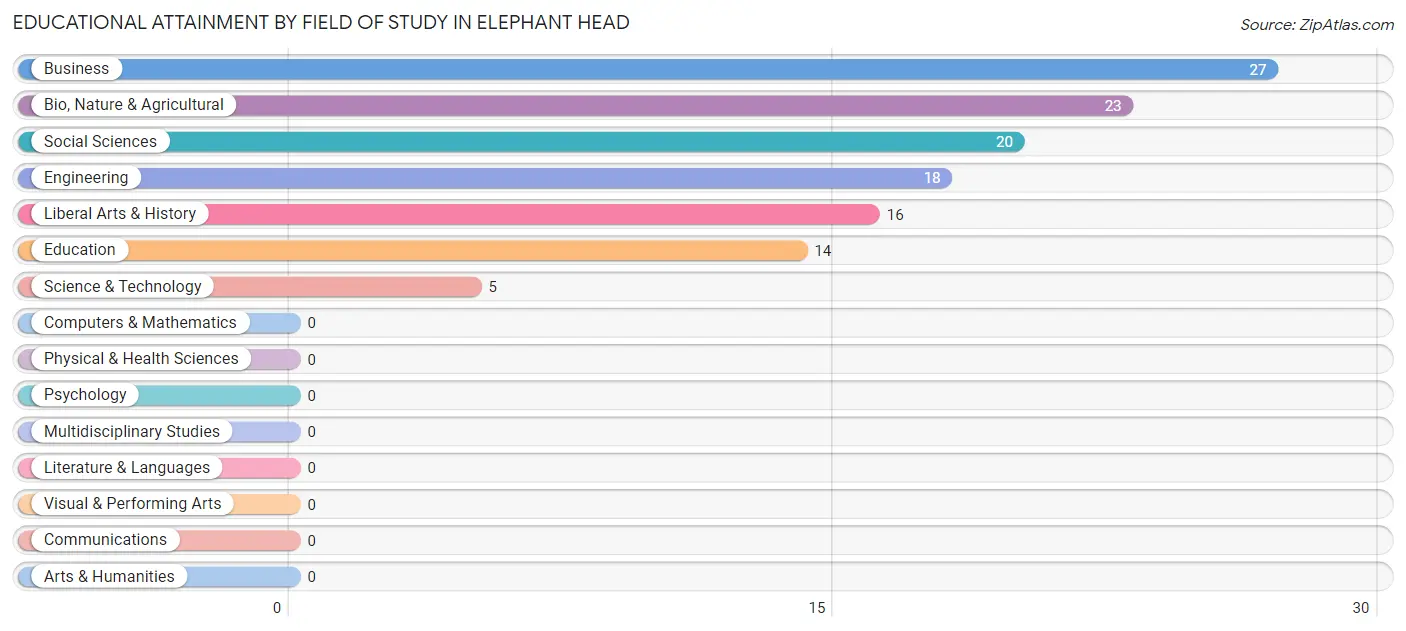
| Field of Study | # Graduates | % Graduates |
| Computers & Mathematics | 0 | 0.0% |
| Bio, Nature & Agricultural | 23 | 18.7% |
| Physical & Health Sciences | 0 | 0.0% |
| Psychology | 0 | 0.0% |
| Social Sciences | 20 | 16.3% |
| Engineering | 18 | 14.6% |
| Multidisciplinary Studies | 0 | 0.0% |
| Science & Technology | 5 | 4.1% |
| Business | 27 | 22.0% |
| Education | 14 | 11.4% |
| Literature & Languages | 0 | 0.0% |
| Liberal Arts & History | 16 | 13.0% |
| Visual & Performing Arts | 0 | 0.0% |
| Communications | 0 | 0.0% |
| Arts & Humanities | 0 | 0.0% |
| Total | 123 | 100.0% |
Transportation & Commute in Elephant Head
Vehicle Availability by Sex in Elephant Head
The most prevalent vehicle ownership categories in Elephant Head are males with 3 vehicles (20, accounting for 66.7%) and females with 3 vehicles (10, making up 22.0%).
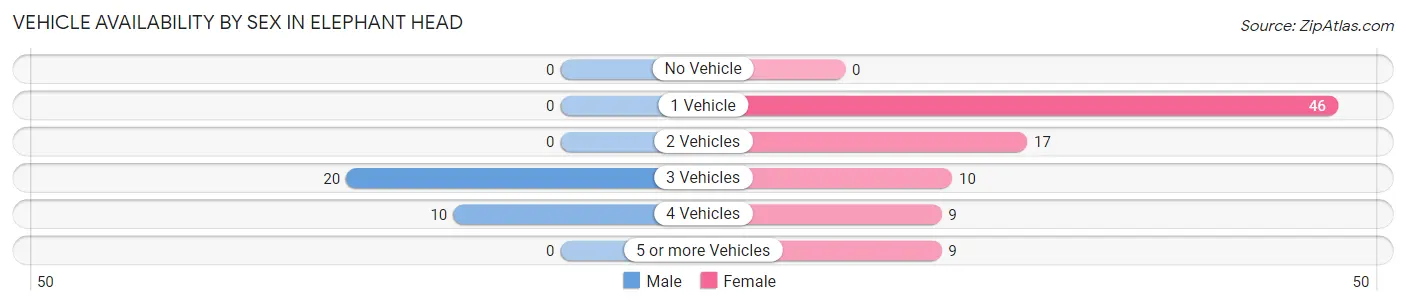
| Vehicles Available | Male | Female |
| No Vehicle | 0 (0.0%) | 0 (0.0%) |
| 1 Vehicle | 0 (0.0%) | 46 (50.5%) |
| 2 Vehicles | 0 (0.0%) | 17 (18.7%) |
| 3 Vehicles | 20 (66.7%) | 10 (11.0%) |
| 4 Vehicles | 10 (33.3%) | 9 (9.9%) |
| 5 or more Vehicles | 0 (0.0%) | 9 (9.9%) |
| Total | 30 (100.0%) | 91 (100.0%) |
Commute Time in Elephant Head
The most frequently occuring commute durations in Elephant Head are 20 to 24 minutes (25 commuters, 23.6%), 40 to 44 minutes (23 commuters, 21.7%), and 15 to 19 minutes (18 commuters, 17.0%).
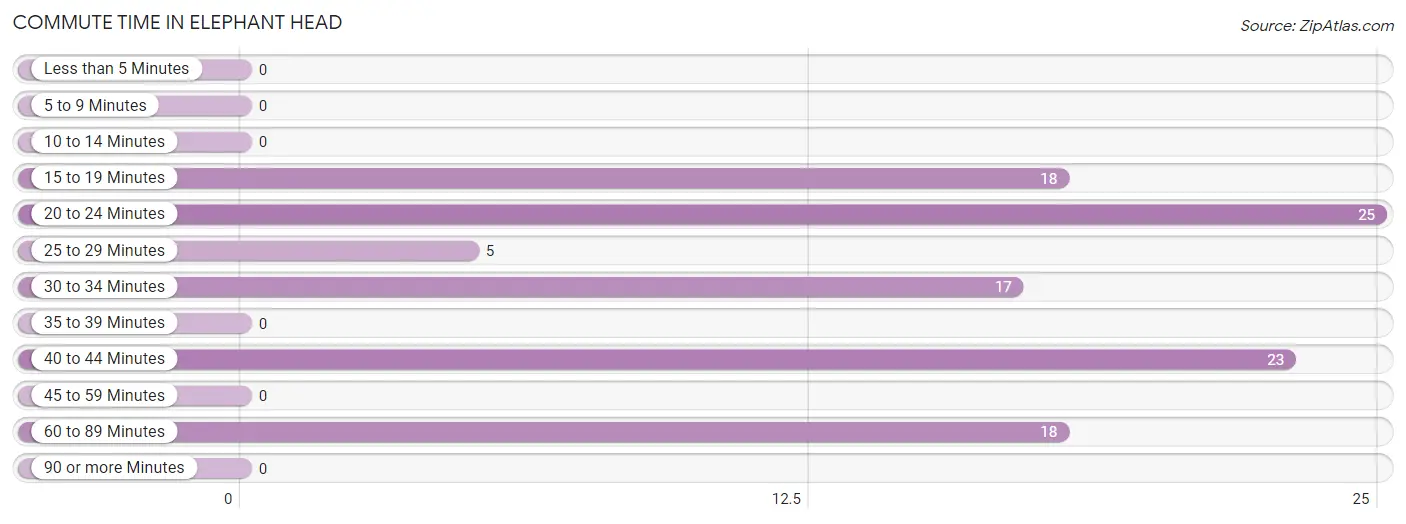
| Commute Time | # Commuters | % Commuters |
| Less than 5 Minutes | 0 | 0.0% |
| 5 to 9 Minutes | 0 | 0.0% |
| 10 to 14 Minutes | 0 | 0.0% |
| 15 to 19 Minutes | 18 | 17.0% |
| 20 to 24 Minutes | 25 | 23.6% |
| 25 to 29 Minutes | 5 | 4.7% |
| 30 to 34 Minutes | 17 | 16.0% |
| 35 to 39 Minutes | 0 | 0.0% |
| 40 to 44 Minutes | 23 | 21.7% |
| 45 to 59 Minutes | 0 | 0.0% |
| 60 to 89 Minutes | 18 | 17.0% |
| 90 or more Minutes | 0 | 0.0% |
Commute Time by Sex in Elephant Head
The most common commute times in Elephant Head are 30 to 34 minutes (8 commuters, 40.0%) for males and 20 to 24 minutes (25 commuters, 29.1%) for females.
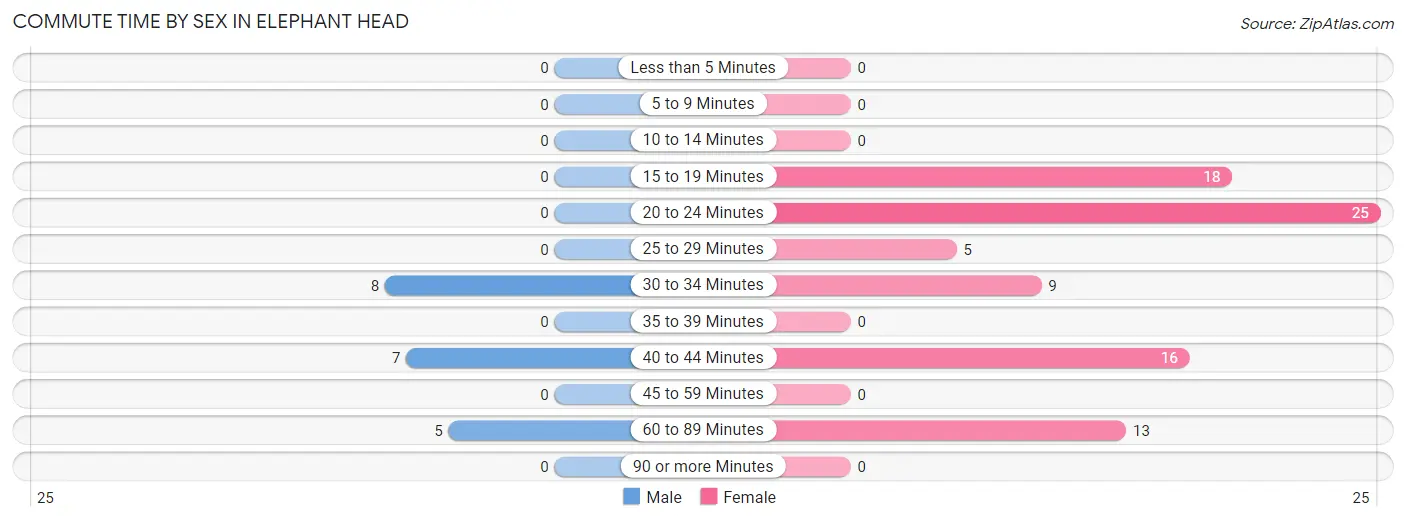
| Commute Time | Male | Female |
| Less than 5 Minutes | 0 (0.0%) | 0 (0.0%) |
| 5 to 9 Minutes | 0 (0.0%) | 0 (0.0%) |
| 10 to 14 Minutes | 0 (0.0%) | 0 (0.0%) |
| 15 to 19 Minutes | 0 (0.0%) | 18 (20.9%) |
| 20 to 24 Minutes | 0 (0.0%) | 25 (29.1%) |
| 25 to 29 Minutes | 0 (0.0%) | 5 (5.8%) |
| 30 to 34 Minutes | 8 (40.0%) | 9 (10.5%) |
| 35 to 39 Minutes | 0 (0.0%) | 0 (0.0%) |
| 40 to 44 Minutes | 7 (35.0%) | 16 (18.6%) |
| 45 to 59 Minutes | 0 (0.0%) | 0 (0.0%) |
| 60 to 89 Minutes | 5 (25.0%) | 13 (15.1%) |
| 90 or more Minutes | 0 (0.0%) | 0 (0.0%) |
Time of Departure to Work by Sex in Elephant Head
The most frequent times of departure to work in Elephant Head are 6:00 AM to 6:29 AM (9, 45.0%) for males and 4:00 PM to 11:59 PM (30, 34.9%) for females.
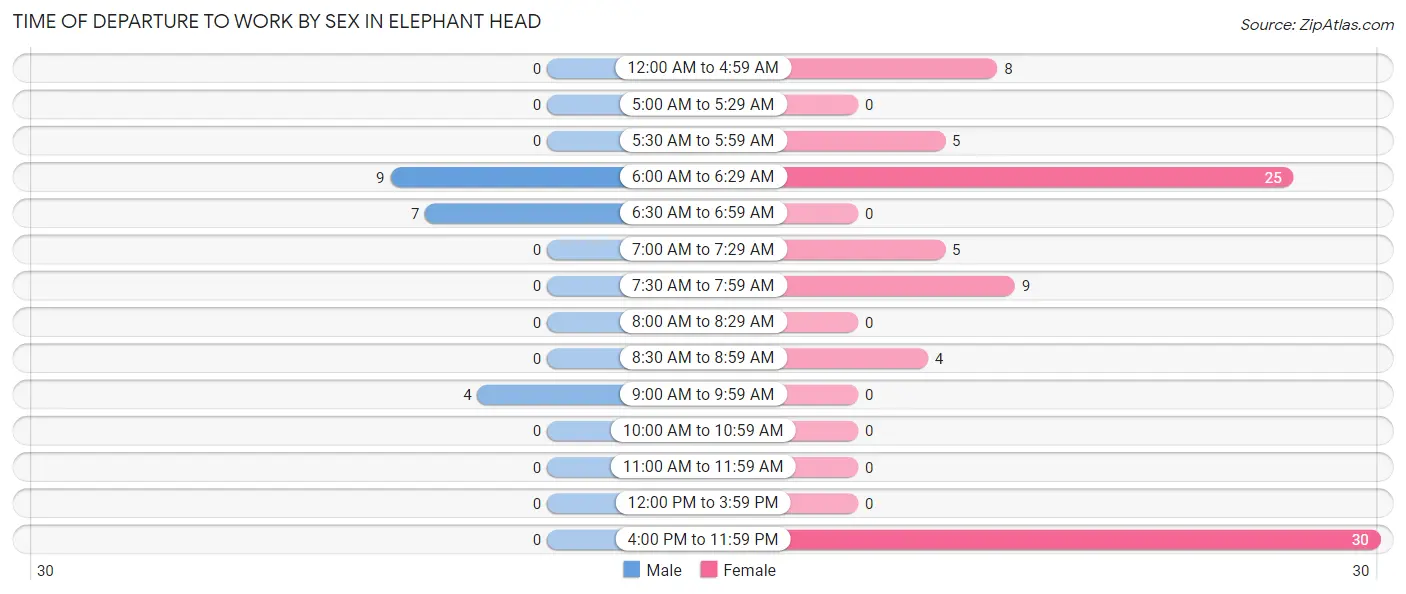
| Time of Departure | Male | Female |
| 12:00 AM to 4:59 AM | 0 (0.0%) | 8 (9.3%) |
| 5:00 AM to 5:29 AM | 0 (0.0%) | 0 (0.0%) |
| 5:30 AM to 5:59 AM | 0 (0.0%) | 5 (5.8%) |
| 6:00 AM to 6:29 AM | 9 (45.0%) | 25 (29.1%) |
| 6:30 AM to 6:59 AM | 7 (35.0%) | 0 (0.0%) |
| 7:00 AM to 7:29 AM | 0 (0.0%) | 5 (5.8%) |
| 7:30 AM to 7:59 AM | 0 (0.0%) | 9 (10.5%) |
| 8:00 AM to 8:29 AM | 0 (0.0%) | 0 (0.0%) |
| 8:30 AM to 8:59 AM | 0 (0.0%) | 4 (4.6%) |
| 9:00 AM to 9:59 AM | 4 (20.0%) | 0 (0.0%) |
| 10:00 AM to 10:59 AM | 0 (0.0%) | 0 (0.0%) |
| 11:00 AM to 11:59 AM | 0 (0.0%) | 0 (0.0%) |
| 12:00 PM to 3:59 PM | 0 (0.0%) | 0 (0.0%) |
| 4:00 PM to 11:59 PM | 0 (0.0%) | 30 (34.9%) |
| Total | 20 (100.0%) | 86 (100.0%) |
Housing Occupancy in Elephant Head
Occupancy by Ownership in Elephant Head
Of the total 230 dwellings in Elephant Head, owner-occupied units account for 196 (85.2%), while renter-occupied units make up 34 (14.8%).
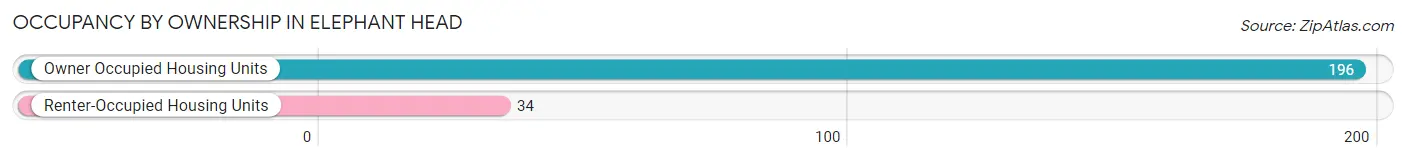
| Occupancy | # Housing Units | % Housing Units |
| Owner Occupied Housing Units | 196 | 85.2% |
| Renter-Occupied Housing Units | 34 | 14.8% |
| Total Occupied Housing Units | 230 | 100.0% |
Occupancy by Household Size in Elephant Head
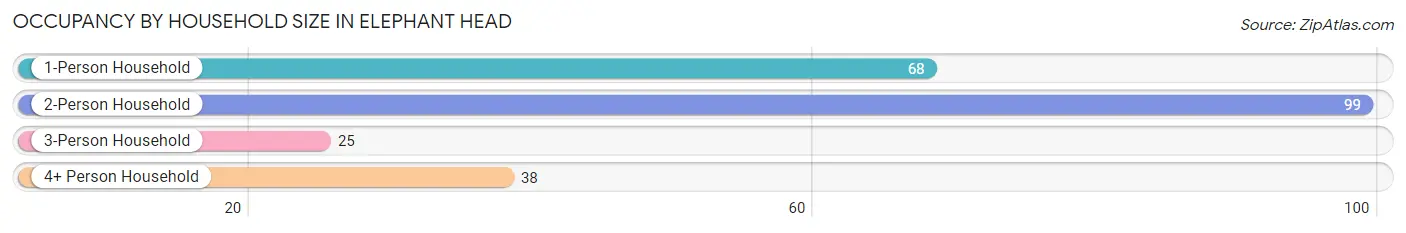
| Household Size | # Housing Units | % Housing Units |
| 1-Person Household | 68 | 29.6% |
| 2-Person Household | 99 | 43.0% |
| 3-Person Household | 25 | 10.9% |
| 4+ Person Household | 38 | 16.5% |
| Total Housing Units | 230 | 100.0% |
Occupancy by Ownership by Household Size in Elephant Head
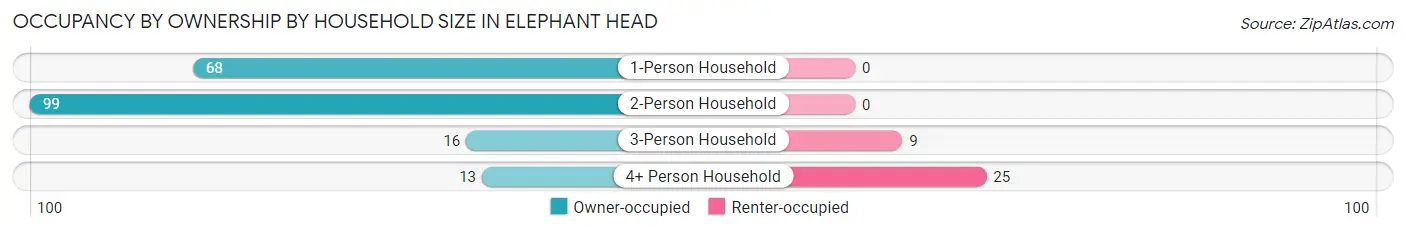
| Household Size | Owner-occupied | Renter-occupied |
| 1-Person Household | 68 (100.0%) | 0 (0.0%) |
| 2-Person Household | 99 (100.0%) | 0 (0.0%) |
| 3-Person Household | 16 (64.0%) | 9 (36.0%) |
| 4+ Person Household | 13 (34.2%) | 25 (65.8%) |
| Total Housing Units | 196 (85.2%) | 34 (14.8%) |
Occupancy by Educational Attainment in Elephant Head
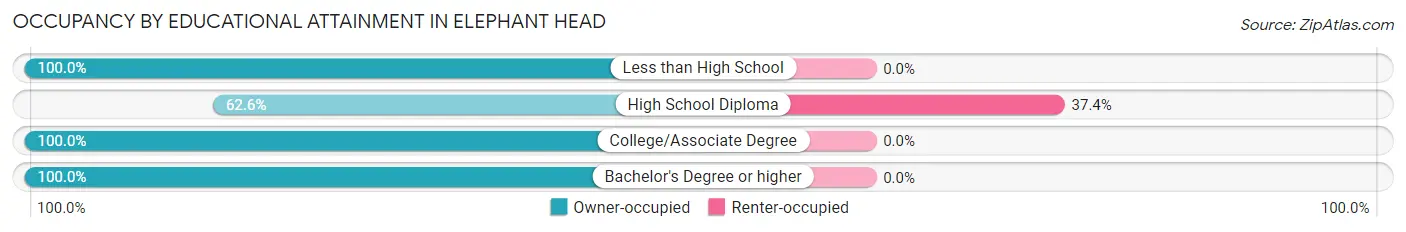
| Household Size | Owner-occupied | Renter-occupied |
| Less than High School | 20 (100.0%) | 0 (0.0%) |
| High School Diploma | 57 (62.6%) | 34 (37.4%) |
| College/Associate Degree | 35 (100.0%) | 0 (0.0%) |
| Bachelor's Degree or higher | 84 (100.0%) | 0 (0.0%) |
Occupancy by Age of Householder in Elephant Head
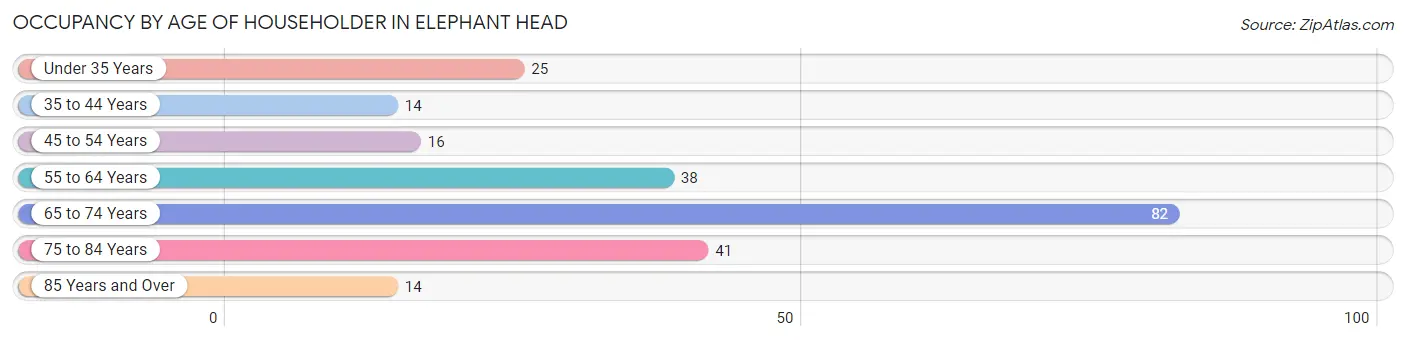
| Age Bracket | # Households | % Households |
| Under 35 Years | 25 | 10.9% |
| 35 to 44 Years | 14 | 6.1% |
| 45 to 54 Years | 16 | 7.0% |
| 55 to 64 Years | 38 | 16.5% |
| 65 to 74 Years | 82 | 35.6% |
| 75 to 84 Years | 41 | 17.8% |
| 85 Years and Over | 14 | 6.1% |
| Total | 230 | 100.0% |
Housing Finances in Elephant Head
Median Income by Occupancy in Elephant Head
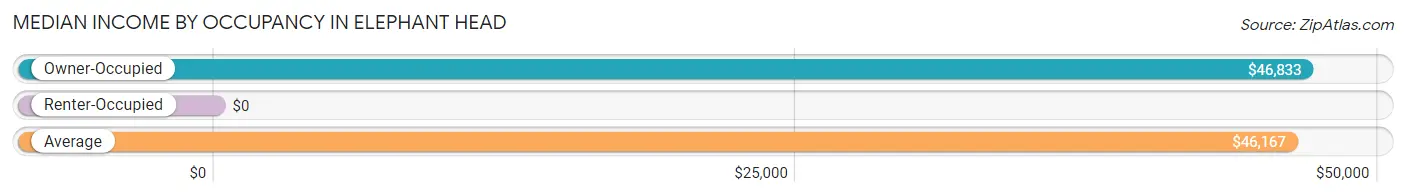
| Occupancy Type | # Households | Median Income |
| Owner-Occupied | 196 (85.2%) | $46,833 |
| Renter-Occupied | 34 (14.8%) | $0 |
| Average | 230 (100.0%) | $46,167 |
Occupancy by Householder Income Bracket in Elephant Head
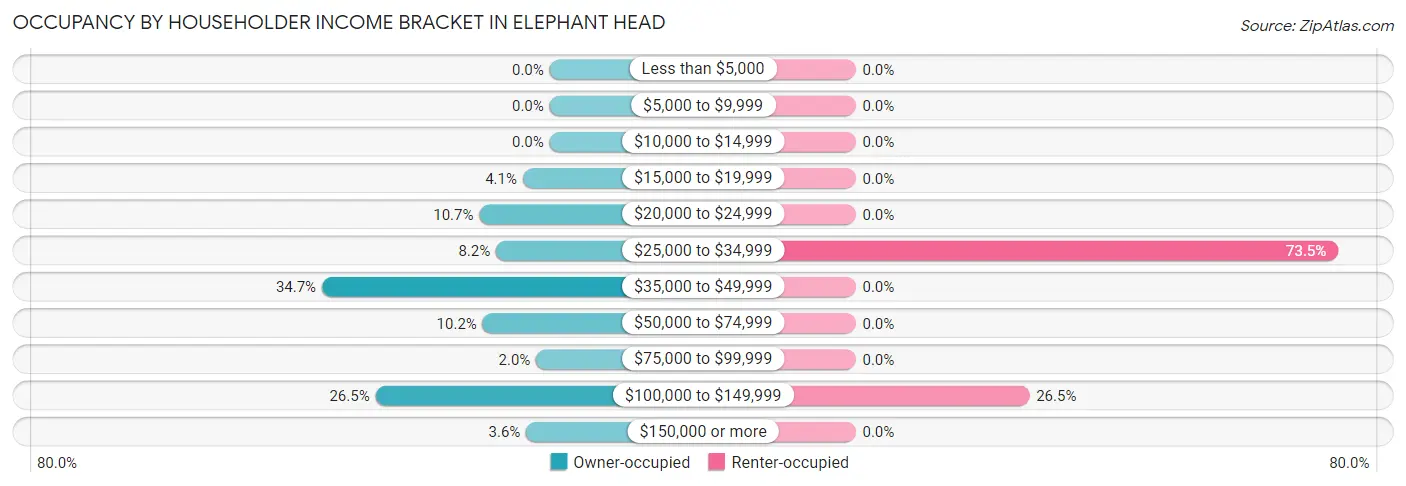
| Income Bracket | Owner-occupied | Renter-occupied |
| Less than $5,000 | 0 (0.0%) | 0 (0.0%) |
| $5,000 to $9,999 | 0 (0.0%) | 0 (0.0%) |
| $10,000 to $14,999 | 0 (0.0%) | 0 (0.0%) |
| $15,000 to $19,999 | 8 (4.1%) | 0 (0.0%) |
| $20,000 to $24,999 | 21 (10.7%) | 0 (0.0%) |
| $25,000 to $34,999 | 16 (8.2%) | 25 (73.5%) |
| $35,000 to $49,999 | 68 (34.7%) | 0 (0.0%) |
| $50,000 to $74,999 | 20 (10.2%) | 0 (0.0%) |
| $75,000 to $99,999 | 4 (2.0%) | 0 (0.0%) |
| $100,000 to $149,999 | 52 (26.5%) | 9 (26.5%) |
| $150,000 or more | 7 (3.6%) | 0 (0.0%) |
| Total | 196 (100.0%) | 34 (100.0%) |
Monthly Housing Cost Tiers in Elephant Head
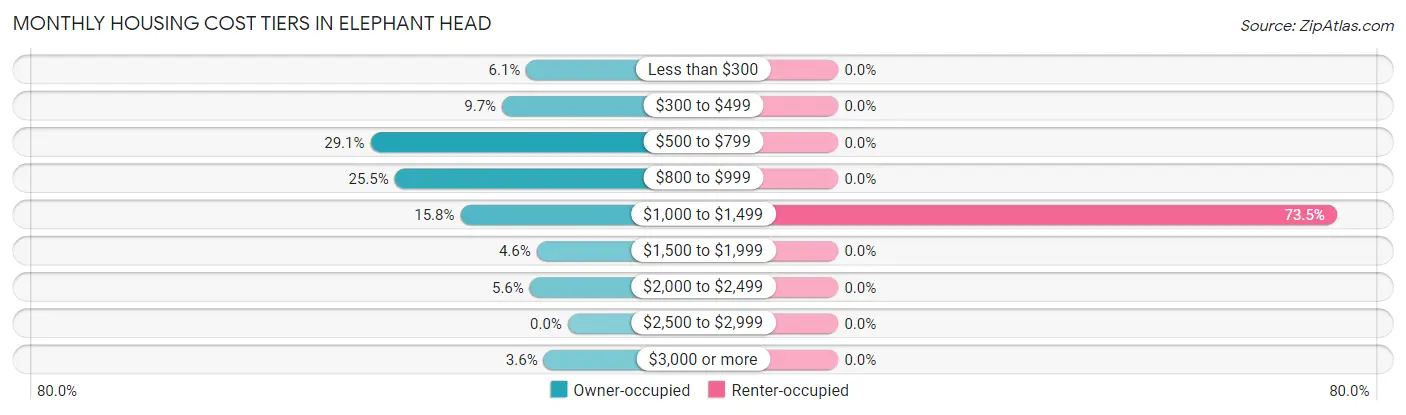
| Monthly Cost | Owner-occupied | Renter-occupied |
| Less than $300 | 12 (6.1%) | 0 (0.0%) |
| $300 to $499 | 19 (9.7%) | 0 (0.0%) |
| $500 to $799 | 57 (29.1%) | 0 (0.0%) |
| $800 to $999 | 50 (25.5%) | 0 (0.0%) |
| $1,000 to $1,499 | 31 (15.8%) | 25 (73.5%) |
| $1,500 to $1,999 | 9 (4.6%) | 0 (0.0%) |
| $2,000 to $2,499 | 11 (5.6%) | 0 (0.0%) |
| $2,500 to $2,999 | 0 (0.0%) | 0 (0.0%) |
| $3,000 or more | 7 (3.6%) | 0 (0.0%) |
| Total | 196 (100.0%) | 34 (100.0%) |
Physical Housing Characteristics in Elephant Head
Housing Structures in Elephant Head
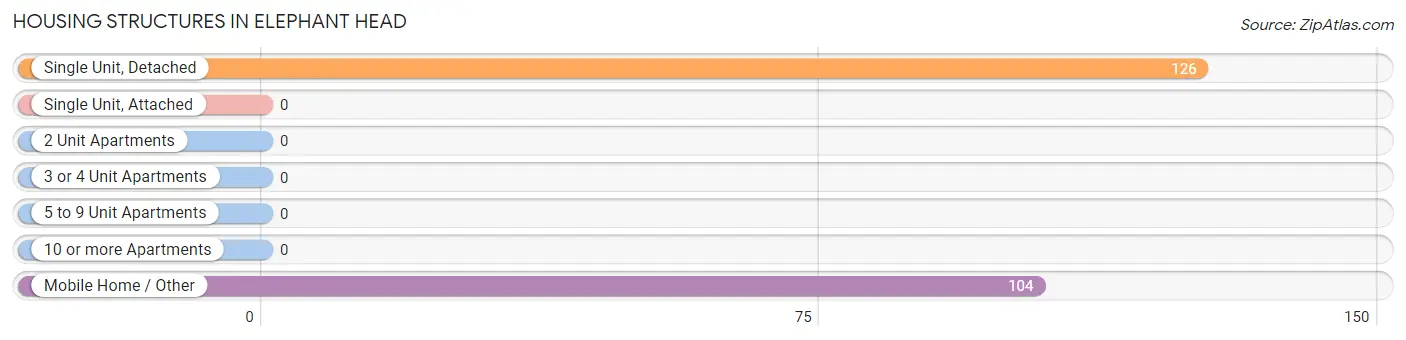
| Structure Type | # Housing Units | % Housing Units |
| Single Unit, Detached | 126 | 54.8% |
| Single Unit, Attached | 0 | 0.0% |
| 2 Unit Apartments | 0 | 0.0% |
| 3 or 4 Unit Apartments | 0 | 0.0% |
| 5 to 9 Unit Apartments | 0 | 0.0% |
| 10 or more Apartments | 0 | 0.0% |
| Mobile Home / Other | 104 | 45.2% |
| Total | 230 | 100.0% |
Housing Structures by Occupancy in Elephant Head
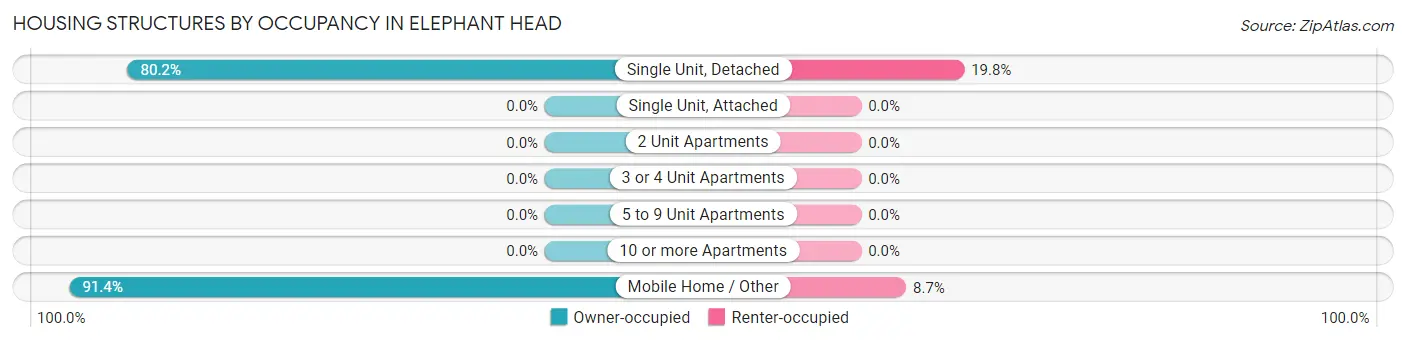
| Structure Type | Owner-occupied | Renter-occupied |
| Single Unit, Detached | 101 (80.2%) | 25 (19.8%) |
| Single Unit, Attached | 0 (0.0%) | 0 (0.0%) |
| 2 Unit Apartments | 0 (0.0%) | 0 (0.0%) |
| 3 or 4 Unit Apartments | 0 (0.0%) | 0 (0.0%) |
| 5 to 9 Unit Apartments | 0 (0.0%) | 0 (0.0%) |
| 10 or more Apartments | 0 (0.0%) | 0 (0.0%) |
| Mobile Home / Other | 95 (91.3%) | 9 (8.6%) |
| Total | 196 (85.2%) | 34 (14.8%) |
Housing Structures by Number of Rooms in Elephant Head
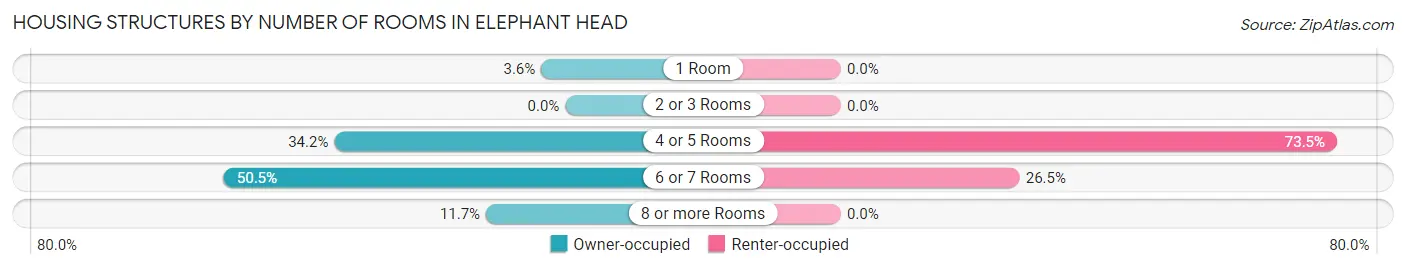
| Number of Rooms | Owner-occupied | Renter-occupied |
| 1 Room | 7 (3.6%) | 0 (0.0%) |
| 2 or 3 Rooms | 0 (0.0%) | 0 (0.0%) |
| 4 or 5 Rooms | 67 (34.2%) | 25 (73.5%) |
| 6 or 7 Rooms | 99 (50.5%) | 9 (26.5%) |
| 8 or more Rooms | 23 (11.7%) | 0 (0.0%) |
| Total | 196 (100.0%) | 34 (100.0%) |
Housing Structure by Heating Type in Elephant Head
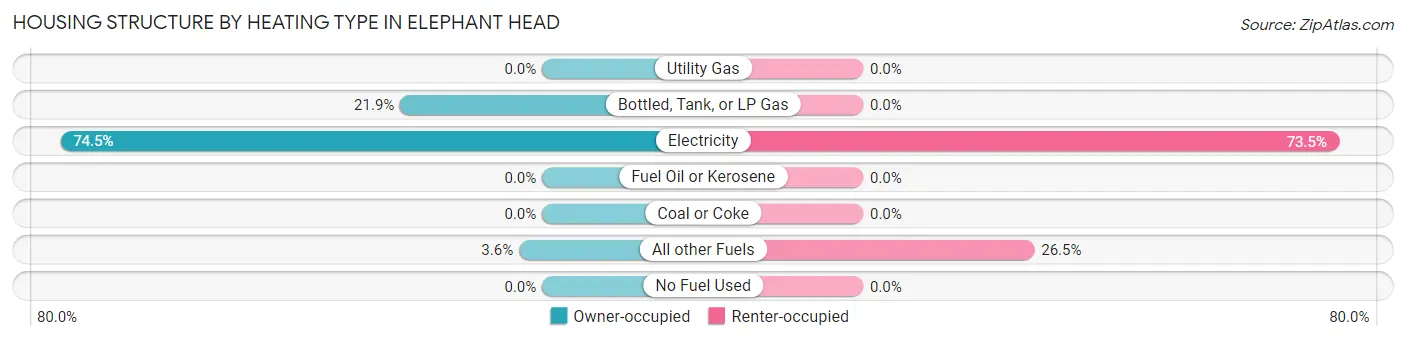
| Heating Type | Owner-occupied | Renter-occupied |
| Utility Gas | 0 (0.0%) | 0 (0.0%) |
| Bottled, Tank, or LP Gas | 43 (21.9%) | 0 (0.0%) |
| Electricity | 146 (74.5%) | 25 (73.5%) |
| Fuel Oil or Kerosene | 0 (0.0%) | 0 (0.0%) |
| Coal or Coke | 0 (0.0%) | 0 (0.0%) |
| All other Fuels | 7 (3.6%) | 9 (26.5%) |
| No Fuel Used | 0 (0.0%) | 0 (0.0%) |
| Total | 196 (100.0%) | 34 (100.0%) |
Household Vehicle Usage in Elephant Head
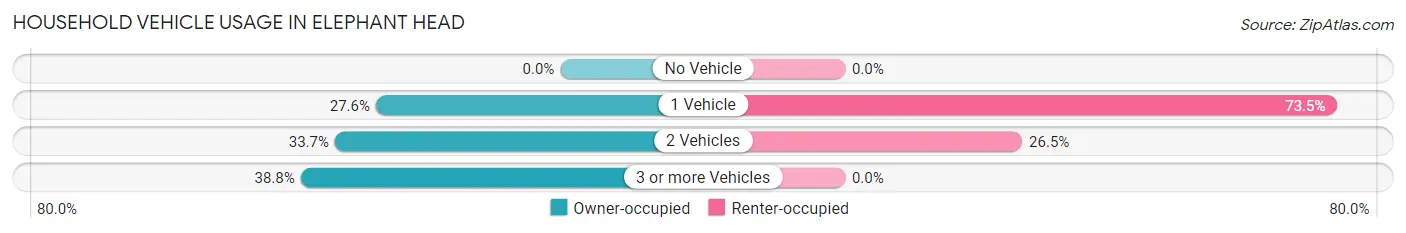
| Vehicles per Household | Owner-occupied | Renter-occupied |
| No Vehicle | 0 (0.0%) | 0 (0.0%) |
| 1 Vehicle | 54 (27.6%) | 25 (73.5%) |
| 2 Vehicles | 66 (33.7%) | 9 (26.5%) |
| 3 or more Vehicles | 76 (38.8%) | 0 (0.0%) |
| Total | 196 (100.0%) | 34 (100.0%) |
Real Estate & Mortgages in Elephant Head
Real Estate and Mortgage Overview in Elephant Head
| Characteristic | Without Mortgage | With Mortgage |
| Housing Units | 113 | 83 |
| Median Property Value | $357,700 | $219,400 |
| Median Household Income | $42,063 | $0 |
| Monthly Housing Costs | $638 | $0 |
| Real Estate Taxes | $1,948 | $0 |
Property Value by Mortgage Status in Elephant Head
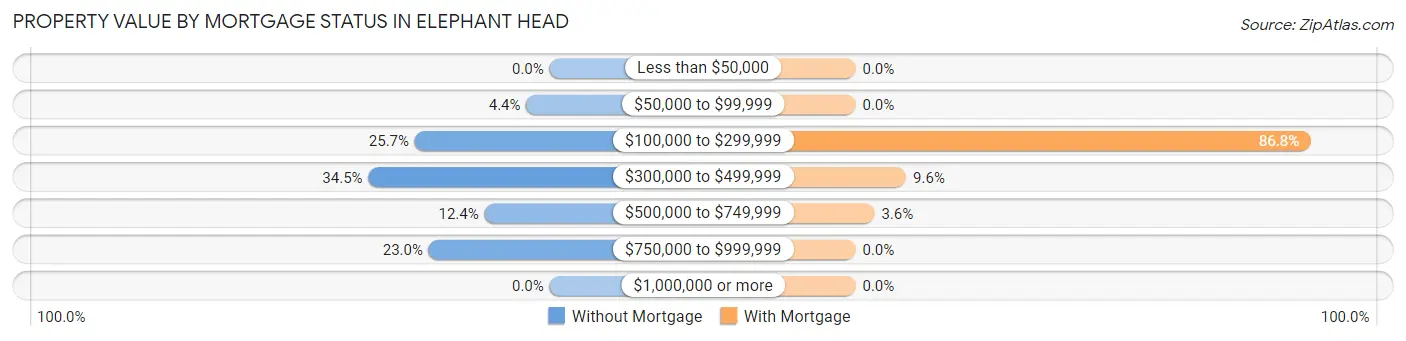
| Property Value | Without Mortgage | With Mortgage |
| Less than $50,000 | 0 (0.0%) | 0 (0.0%) |
| $50,000 to $99,999 | 5 (4.4%) | 0 (0.0%) |
| $100,000 to $299,999 | 29 (25.7%) | 72 (86.8%) |
| $300,000 to $499,999 | 39 (34.5%) | 8 (9.6%) |
| $500,000 to $749,999 | 14 (12.4%) | 3 (3.6%) |
| $750,000 to $999,999 | 26 (23.0%) | 0 (0.0%) |
| $1,000,000 or more | 0 (0.0%) | 0 (0.0%) |
| Total | 113 (100.0%) | 83 (100.0%) |
Household Income by Mortgage Status in Elephant Head
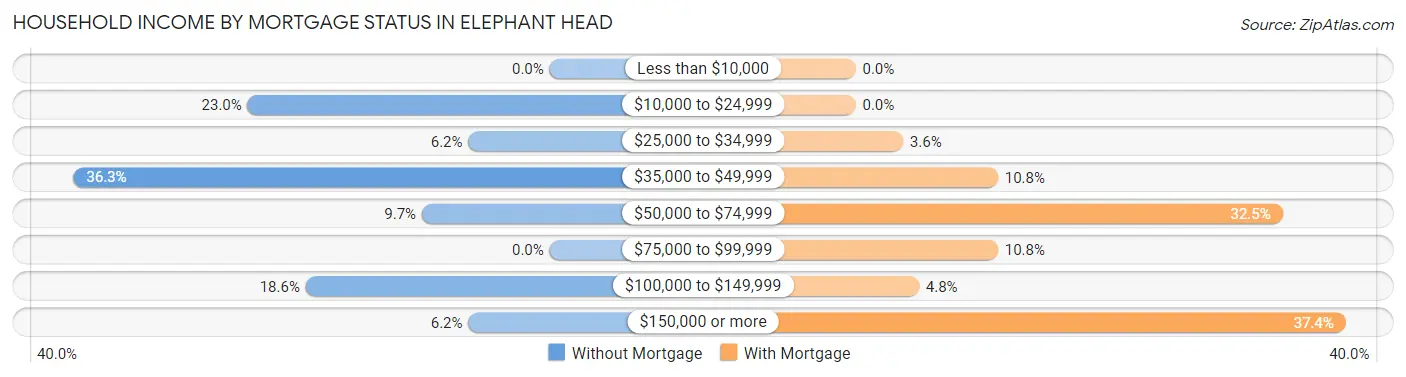
| Household Income | Without Mortgage | With Mortgage |
| Less than $10,000 | 0 (0.0%) | 0 (0.0%) |
| $10,000 to $24,999 | 26 (23.0%) | 0 (0.0%) |
| $25,000 to $34,999 | 7 (6.2%) | 3 (3.6%) |
| $35,000 to $49,999 | 41 (36.3%) | 9 (10.8%) |
| $50,000 to $74,999 | 11 (9.7%) | 27 (32.5%) |
| $75,000 to $99,999 | 0 (0.0%) | 9 (10.8%) |
| $100,000 to $149,999 | 21 (18.6%) | 4 (4.8%) |
| $150,000 or more | 7 (6.2%) | 31 (37.3%) |
| Total | 113 (100.0%) | 83 (100.0%) |
Property Value to Household Income Ratio in Elephant Head
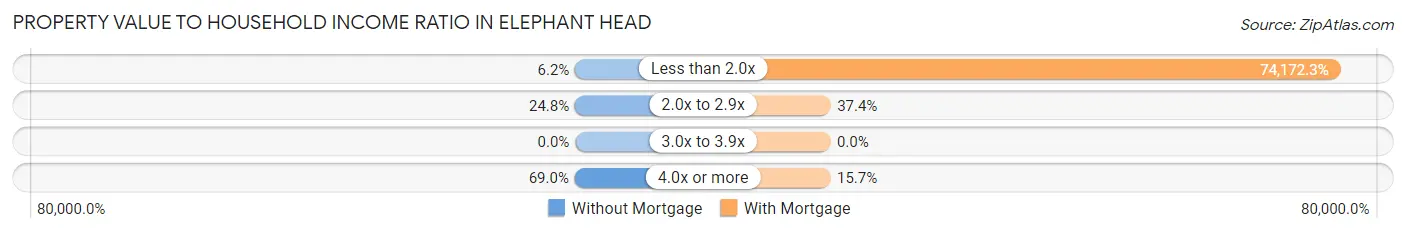
| Value-to-Income Ratio | Without Mortgage | With Mortgage |
| Less than 2.0x | 7 (6.2%) | 61,563 (74,172.3%) |
| 2.0x to 2.9x | 28 (24.8%) | 31 (37.3%) |
| 3.0x to 3.9x | 0 (0.0%) | 0 (0.0%) |
| 4.0x or more | 78 (69.0%) | 13 (15.7%) |
| Total | 113 (100.0%) | 83 (100.0%) |
Real Estate Taxes by Mortgage Status in Elephant Head
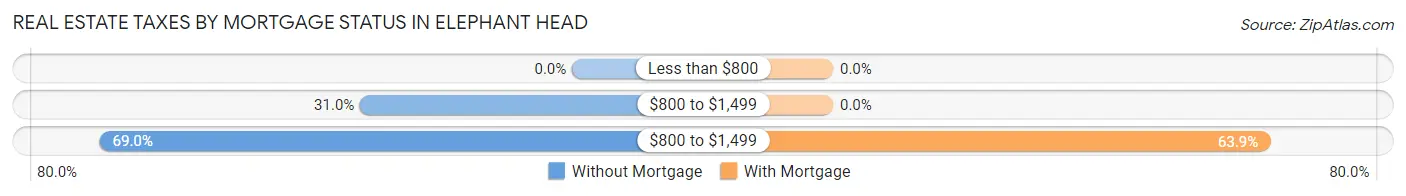
| Property Taxes | Without Mortgage | With Mortgage |
| Less than $800 | 0 (0.0%) | 0 (0.0%) |
| $800 to $1,499 | 35 (31.0%) | 0 (0.0%) |
| $800 to $1,499 | 78 (69.0%) | 53 (63.9%) |
| Total | 113 (100.0%) | 83 (100.0%) |
Health & Disability in Elephant Head
Health Insurance Coverage by Age in Elephant Head
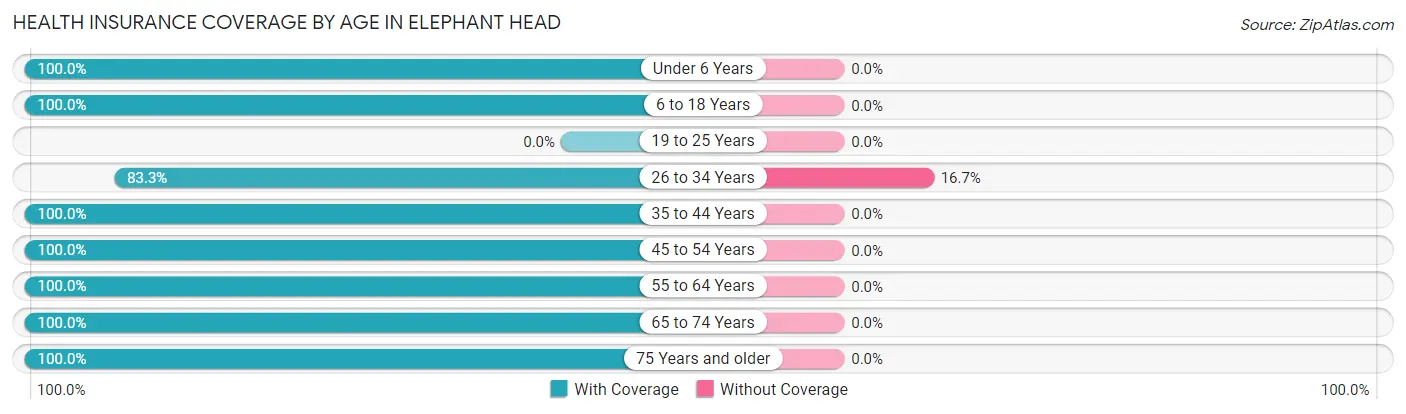
| Age Bracket | With Coverage | Without Coverage |
| Under 6 Years | 24 (100.0%) | 0 (0.0%) |
| 6 to 18 Years | 75 (100.0%) | 0 (0.0%) |
| 19 to 25 Years | 0 (0.0%) | 0 (0.0%) |
| 26 to 34 Years | 30 (83.3%) | 6 (16.7%) |
| 35 to 44 Years | 40 (100.0%) | 0 (0.0%) |
| 45 to 54 Years | 25 (100.0%) | 0 (0.0%) |
| 55 to 64 Years | 64 (100.0%) | 0 (0.0%) |
| 65 to 74 Years | 157 (100.0%) | 0 (0.0%) |
| 75 Years and older | 96 (100.0%) | 0 (0.0%) |
| Total | 511 (98.8%) | 6 (1.2%) |
Health Insurance Coverage by Citizenship Status in Elephant Head
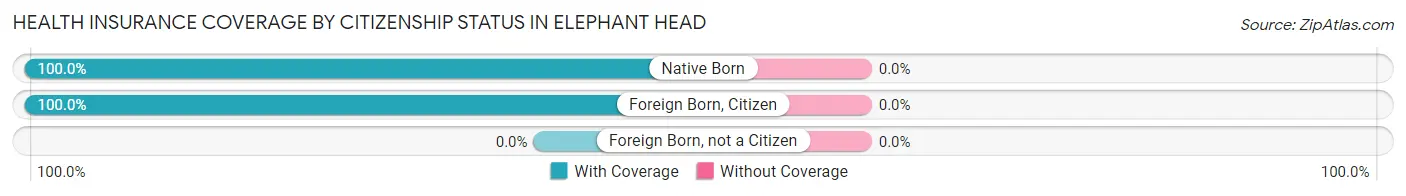
| Citizenship Status | With Coverage | Without Coverage |
| Native Born | 24 (100.0%) | 0 (0.0%) |
| Foreign Born, Citizen | 75 (100.0%) | 0 (0.0%) |
| Foreign Born, not a Citizen | 0 (0.0%) | 0 (0.0%) |
Health Insurance Coverage by Household Income in Elephant Head
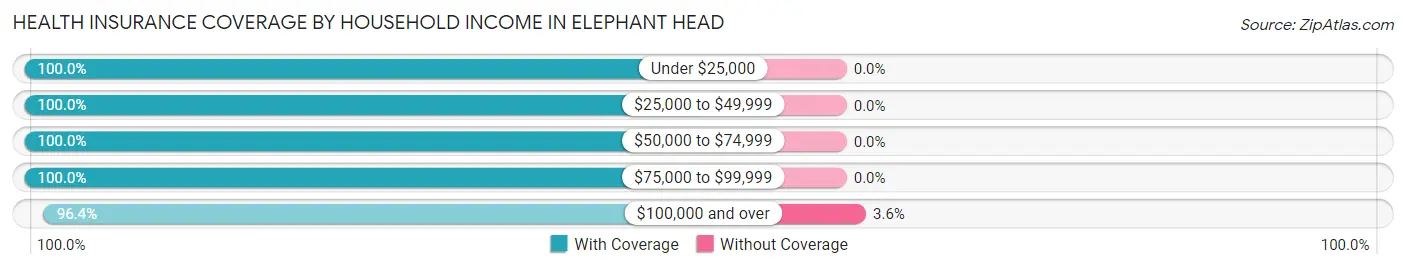
| Household Income | With Coverage | Without Coverage |
| Under $25,000 | 29 (100.0%) | 0 (0.0%) |
| $25,000 to $49,999 | 265 (100.0%) | 0 (0.0%) |
| $50,000 to $74,999 | 41 (100.0%) | 0 (0.0%) |
| $75,000 to $99,999 | 16 (100.0%) | 0 (0.0%) |
| $100,000 and over | 160 (96.4%) | 6 (3.6%) |
Public vs Private Health Insurance Coverage by Age in Elephant Head
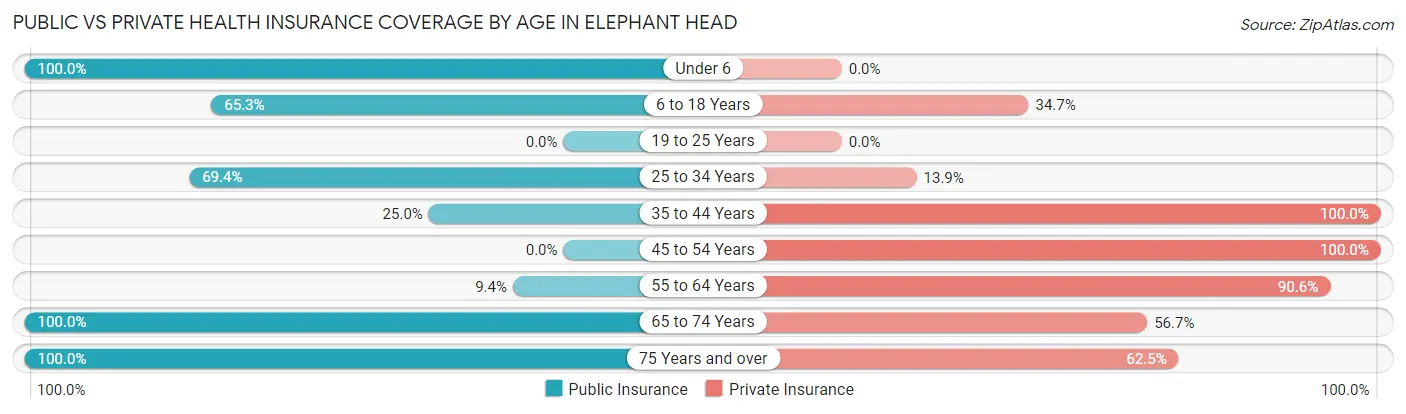
| Age Bracket | Public Insurance | Private Insurance |
| Under 6 | 24 (100.0%) | 0 (0.0%) |
| 6 to 18 Years | 49 (65.3%) | 26 (34.7%) |
| 19 to 25 Years | 0 (0.0%) | 0 (0.0%) |
| 25 to 34 Years | 25 (69.4%) | 5 (13.9%) |
| 35 to 44 Years | 10 (25.0%) | 40 (100.0%) |
| 45 to 54 Years | 0 (0.0%) | 25 (100.0%) |
| 55 to 64 Years | 6 (9.4%) | 58 (90.6%) |
| 65 to 74 Years | 157 (100.0%) | 89 (56.7%) |
| 75 Years and over | 96 (100.0%) | 60 (62.5%) |
| Total | 367 (71.0%) | 303 (58.6%) |
Disability Status by Sex by Age in Elephant Head
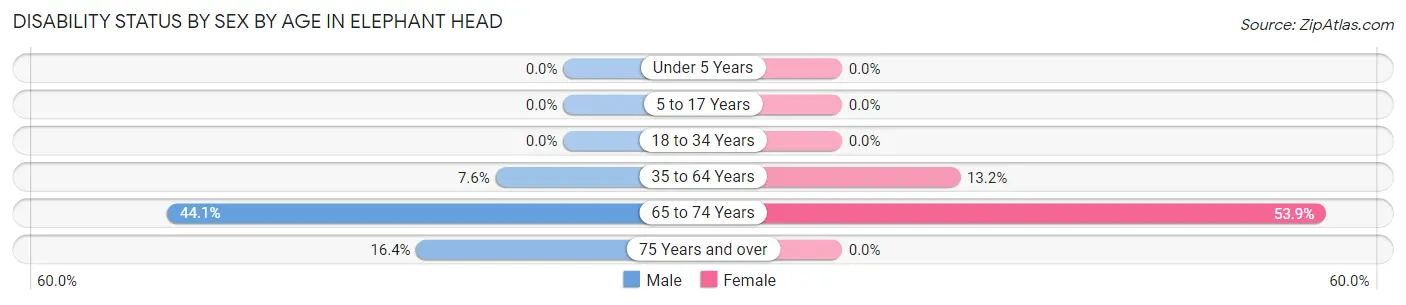
| Age Bracket | Male | Female |
| Under 5 Years | 0 (0.0%) | 0 (0.0%) |
| 5 to 17 Years | 0 (0.0%) | 0 (0.0%) |
| 18 to 34 Years | 0 (0.0%) | 0 (0.0%) |
| 35 to 64 Years | 4 (7.5%) | 10 (13.2%) |
| 65 to 74 Years | 30 (44.1%) | 48 (53.9%) |
| 75 Years and over | 9 (16.4%) | 0 (0.0%) |
Disability Class by Sex by Age in Elephant Head
Disability Class: Hearing Difficulty
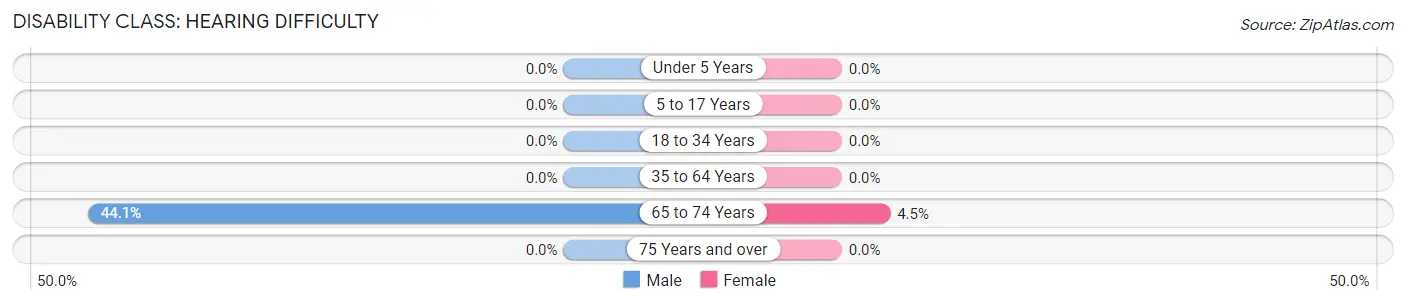
| Age Bracket | Male | Female |
| Under 5 Years | 0 (0.0%) | 0 (0.0%) |
| 5 to 17 Years | 0 (0.0%) | 0 (0.0%) |
| 18 to 34 Years | 0 (0.0%) | 0 (0.0%) |
| 35 to 64 Years | 0 (0.0%) | 0 (0.0%) |
| 65 to 74 Years | 30 (44.1%) | 4 (4.5%) |
| 75 Years and over | 0 (0.0%) | 0 (0.0%) |
Disability Class: Vision Difficulty
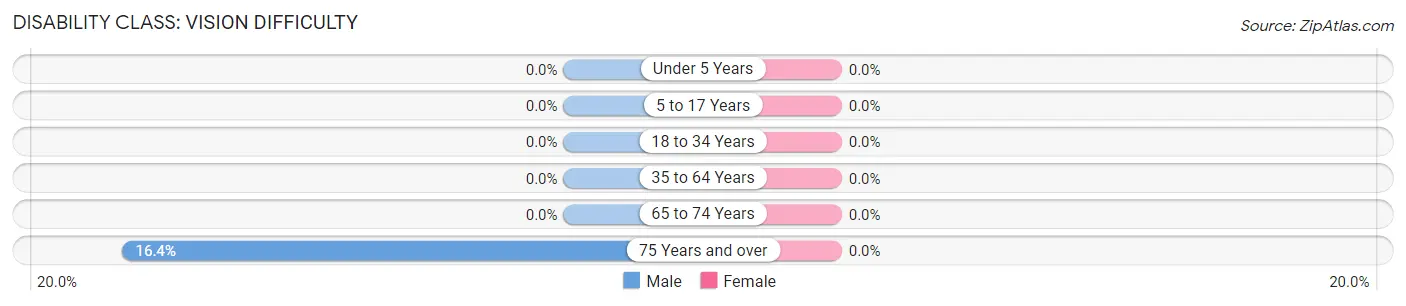
| Age Bracket | Male | Female |
| Under 5 Years | 0 (0.0%) | 0 (0.0%) |
| 5 to 17 Years | 0 (0.0%) | 0 (0.0%) |
| 18 to 34 Years | 0 (0.0%) | 0 (0.0%) |
| 35 to 64 Years | 0 (0.0%) | 0 (0.0%) |
| 65 to 74 Years | 0 (0.0%) | 0 (0.0%) |
| 75 Years and over | 9 (16.4%) | 0 (0.0%) |
Disability Class: Cognitive Difficulty
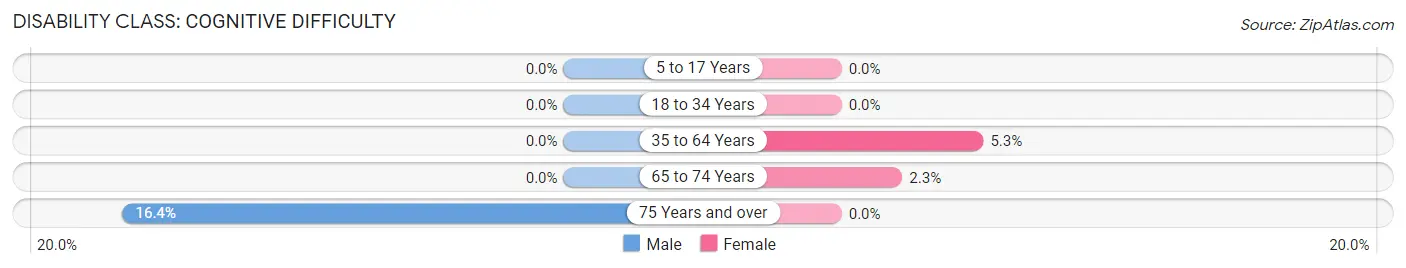
| Age Bracket | Male | Female |
| 5 to 17 Years | 0 (0.0%) | 0 (0.0%) |
| 18 to 34 Years | 0 (0.0%) | 0 (0.0%) |
| 35 to 64 Years | 0 (0.0%) | 4 (5.3%) |
| 65 to 74 Years | 0 (0.0%) | 2 (2.2%) |
| 75 Years and over | 9 (16.4%) | 0 (0.0%) |
Disability Class: Ambulatory Difficulty
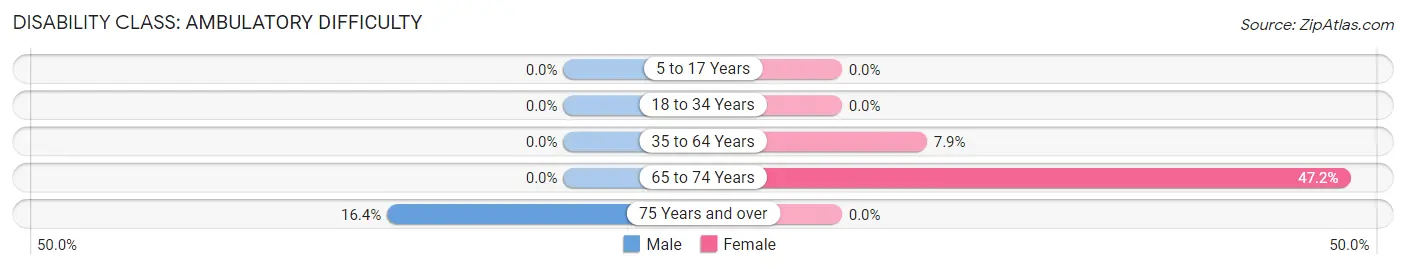
| Age Bracket | Male | Female |
| 5 to 17 Years | 0 (0.0%) | 0 (0.0%) |
| 18 to 34 Years | 0 (0.0%) | 0 (0.0%) |
| 35 to 64 Years | 0 (0.0%) | 6 (7.9%) |
| 65 to 74 Years | 0 (0.0%) | 42 (47.2%) |
| 75 Years and over | 9 (16.4%) | 0 (0.0%) |
Disability Class: Self-Care Difficulty
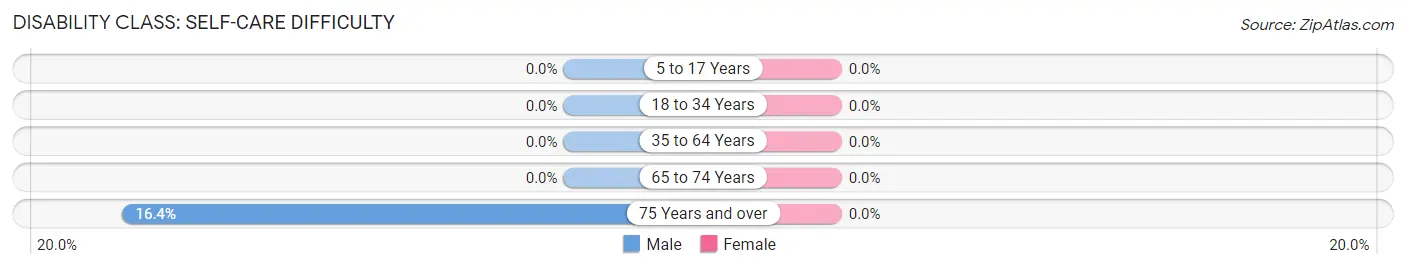
| Age Bracket | Male | Female |
| 5 to 17 Years | 0 (0.0%) | 0 (0.0%) |
| 18 to 34 Years | 0 (0.0%) | 0 (0.0%) |
| 35 to 64 Years | 0 (0.0%) | 0 (0.0%) |
| 65 to 74 Years | 0 (0.0%) | 0 (0.0%) |
| 75 Years and over | 9 (16.4%) | 0 (0.0%) |
Technology Access in Elephant Head
Computing Device Access in Elephant Head
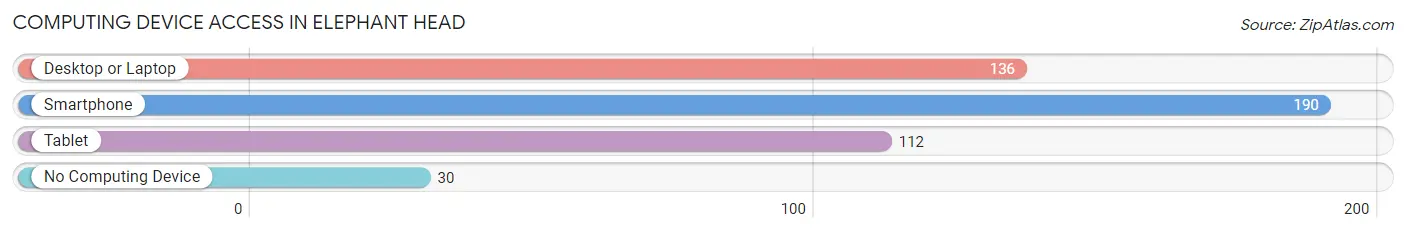
| Device Type | # Households | % Households |
| Desktop or Laptop | 136 | 59.1% |
| Smartphone | 190 | 82.6% |
| Tablet | 112 | 48.7% |
| No Computing Device | 30 | 13.0% |
| Total | 230 | 100.0% |
Internet Access in Elephant Head
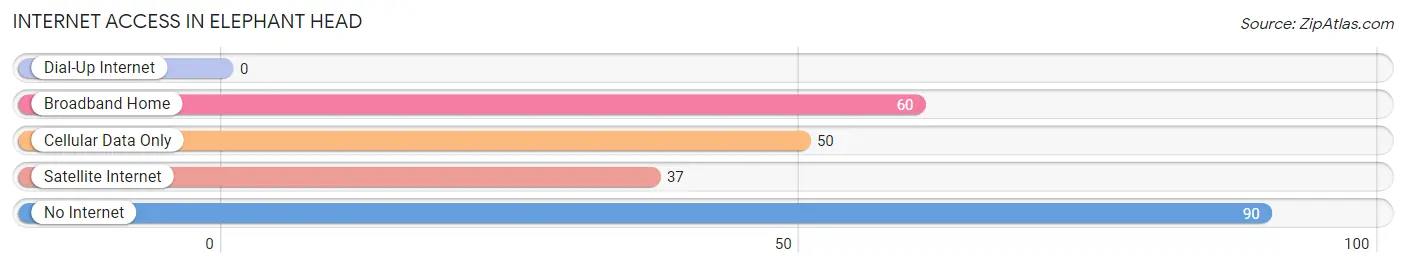
| Internet Type | # Households | % Households |
| Dial-Up Internet | 0 | 0.0% |
| Broadband Home | 60 | 26.1% |
| Cellular Data Only | 50 | 21.7% |
| Satellite Internet | 37 | 16.1% |
| No Internet | 90 | 39.1% |
| Total | 230 | 100.0% |
Elephant Head Summary
Elephant Head, Arizona is a small unincorporated community located in Pima County, Arizona. It is situated in the Sonoran Desert, approximately 25 miles northwest of Tucson. The community is located on the Tohono O’odham Nation, and is home to a small population of Native Americans.
History
The area around Elephant Head has been inhabited by Native Americans for centuries. The Tohono O’odham Nation is the largest federally recognized tribe in Arizona, and has a long history in the area. The tribe has lived in the Sonoran Desert for thousands of years, and the area around Elephant Head has been an important part of their culture and history.
The first European settlers arrived in the area in the late 1800s. The area was originally part of the San Xavier Indian Reservation, which was established in 1874. The reservation was later divided into two parts, with the northern part becoming the Tohono O’odham Nation.
Elephant Head was established in the early 1900s, and was named after a nearby mountain peak that resembled an elephant’s head. The community was originally a small farming and ranching community, and was home to a few hundred people.
Geography
Elephant Head is located in the Sonoran Desert, approximately 25 miles northwest of Tucson. The area is characterized by hot, dry summers and mild winters. The average annual temperature is around 70 degrees Fahrenheit, and the average annual precipitation is around 10 inches.
The area around Elephant Head is mostly flat, with some rolling hills. The nearby mountain peaks provide a scenic backdrop to the community. The area is home to a variety of wildlife, including coyotes, bobcats, javelinas, and a variety of birds.
Economy
The economy of Elephant Head is largely based on agriculture and ranching. The area is home to a variety of crops, including cotton, alfalfa, and wheat. The nearby mountain peaks provide a variety of recreational activities, including hiking, camping, and horseback riding.
The community is also home to a few small businesses, including a gas station, a convenience store, and a restaurant. The nearby Tohono O’odham Nation also provides employment opportunities for the residents of Elephant Head.
Demographics
As of the 2010 census, the population of Elephant Head was 545. The population is largely Native American, with the majority of the population being members of the Tohono O’odham Nation. The median age of the population is 33.5 years, and the median household income is $30,000.
Conclusion
Elephant Head, Arizona is a small unincorporated community located in Pima County, Arizona. It is situated in the Sonoran Desert, approximately 25 miles northwest of Tucson. The community is located on the Tohono O’odham Nation, and is home to a small population of Native Americans. The economy of Elephant Head is largely based on agriculture and ranching, and the nearby Tohono O’odham Nation provides employment opportunities for the residents of Elephant Head. As of the 2010 census, the population of Elephant Head was 545. The population is largely Native American, with the majority of the population being members of the Tohono O’odham Nation.
Common Questions
What is the Total Population of Elephant Head?
Total Population of Elephant Head is 517.
What is the Total Male Population of Elephant Head?
Total Male Population of Elephant Head is 233.
What is the Total Female Population of Elephant Head?
Total Female Population of Elephant Head is 284.
What is the Ratio of Males per 100 Females in Elephant Head?
There are 82.04 Males per 100 Females in Elephant Head.
What is the Ratio of Females per 100 Males in Elephant Head?
There are 121.89 Females per 100 Males in Elephant Head.
What is the Median Population Age in Elephant Head?
Median Population Age in Elephant Head is 63.2 Years.
What is the Average Family Size in Elephant Head
Average Family Size in Elephant Head is 2.8 People.
What is the Average Household Size in Elephant Head
Average Household Size in Elephant Head is 2.2 People.
What is Per Capita Income in Elephant Head?
Per Capita income in Elephant Head is $29,565.
What is the Median Family Income in Elephant Head?
Median Family Income in Elephant Head is $46,161.
What is the Median Household income in Elephant Head?
Median Household Income in Elephant Head is $46,167.
What is Income or Wage Gap in Elephant Head?
Income or Wage Gap in Elephant Head is 13.9%.
Women in Elephant Head earn 86.1 cents for every dollar earned by a man.
What is Inequality or Gini Index in Elephant Head?
Inequality or Gini Index in Elephant Head is 0.38.
How Large is the Labor Force in Elephant Head?
There are 124 People in the Labor Forcein in Elephant Head.
What is the Percentage of People in the Labor Force in Elephant Head?
29.7% of People are in the Labor Force in Elephant Head.
What is the Unemployment Rate in Elephant Head?
Unemployment Rate in Elephant Head is 2.4%.