Yavapai County, AZ
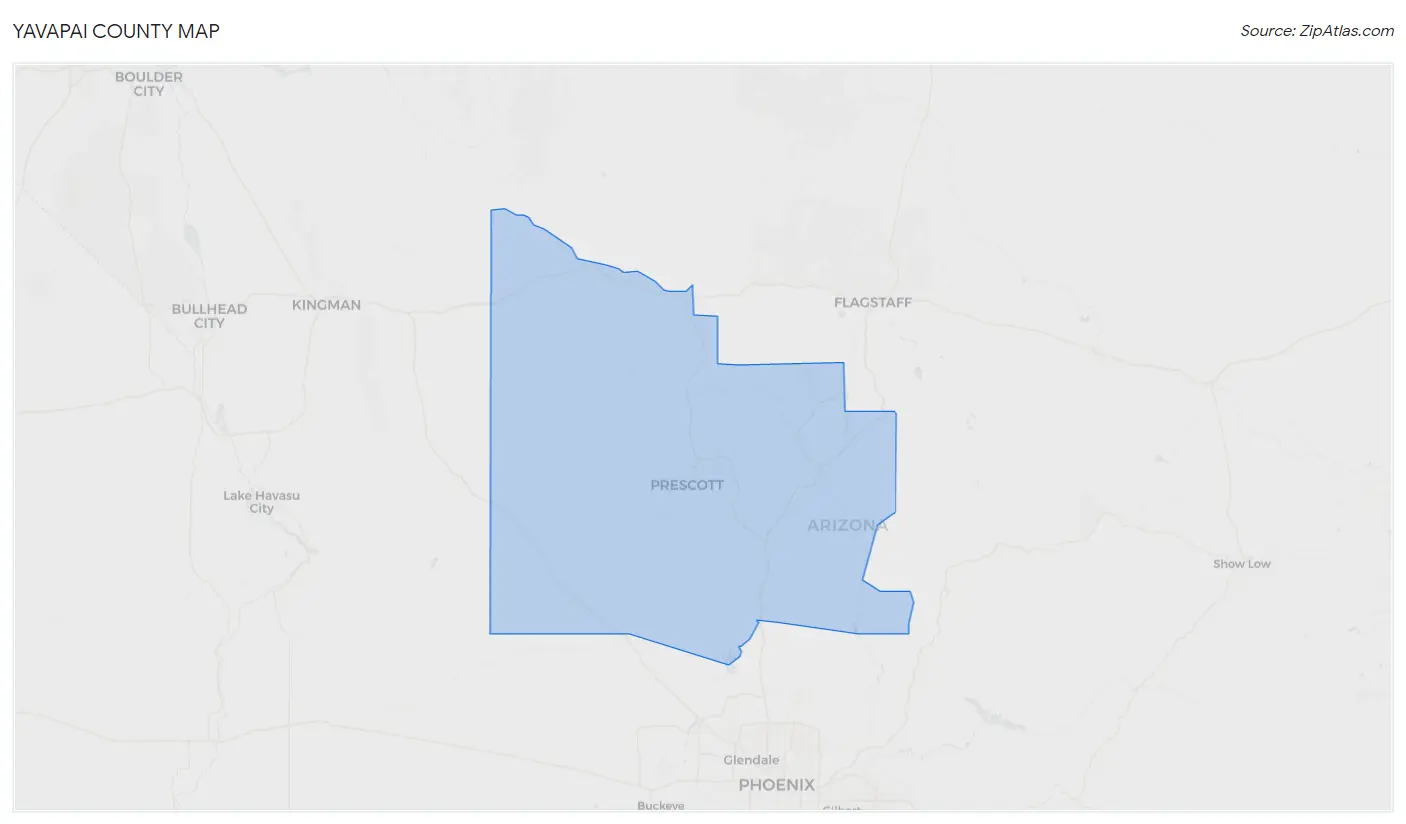
Yavapai County Map
Yavapai County Overview
237,830
TOTAL POPULATION
117,352
MALE POPULATION
120,478
FEMALE POPULATION
97.41
MALES / 100 FEMALES
102.66
FEMALES / 100 MALES
54.5
MEDIAN AGE
2.7
AVG FAMILY SIZE
2.2
AVG HOUSEHOLD SIZE
$37,666
PER CAPITA INCOME
$78,461
AVG FAMILY INCOME
$62,430
AVG HOUSEHOLD INCOME
24.6%
WAGE / INCOME GAP [ % ]
75.4¢/ $1
WAGE / INCOME GAP [ $ ]
$9,722
FAMILY INCOME DEFICIT
0.45
INEQUALITY / GINI INDEX
99,908
LABOR FORCE [ PEOPLE ]
48.7%
PERCENT IN LABOR FORCE
4.9%
UNEMPLOYMENT RATE
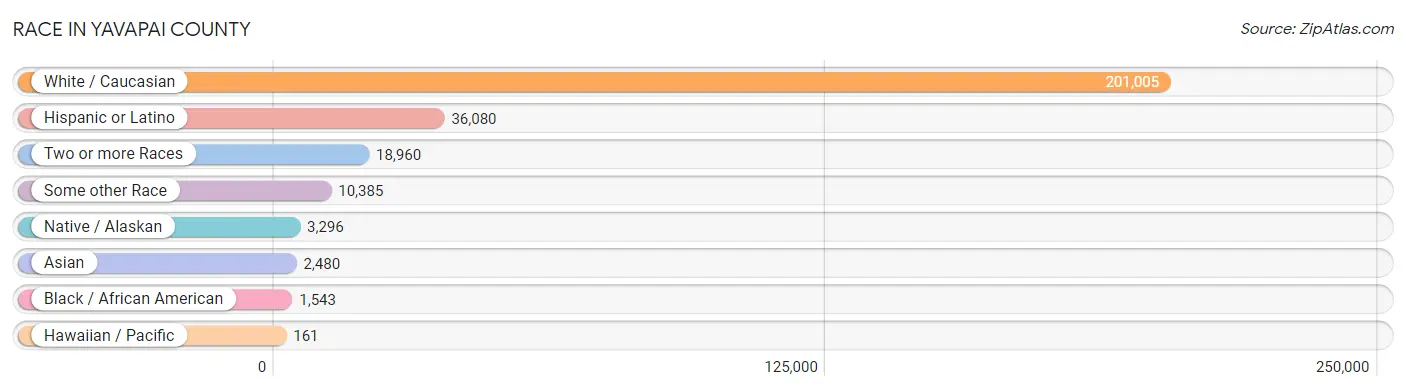
Race in Yavapai County
The most populous races in Yavapai County are White / Caucasian (201,005 | 84.5%), Hispanic or Latino (36,080 | 15.2%), and Two or more Races (18,960 | 8.0%).
| Race | # Population | % Population |
| Asian | 2,480 | 1.0% |
| Black / African American | 1,543 | 0.6% |
| Hawaiian / Pacific | 161 | 0.1% |
| Hispanic or Latino | 36,080 | 15.2% |
| Native / Alaskan | 3,296 | 1.4% |
| White / Caucasian | 201,005 | 84.5% |
| Two or more Races | 18,960 | 8.0% |
| Some other Race | 10,385 | 4.4% |
| Total | 237,830 | 100.0% |
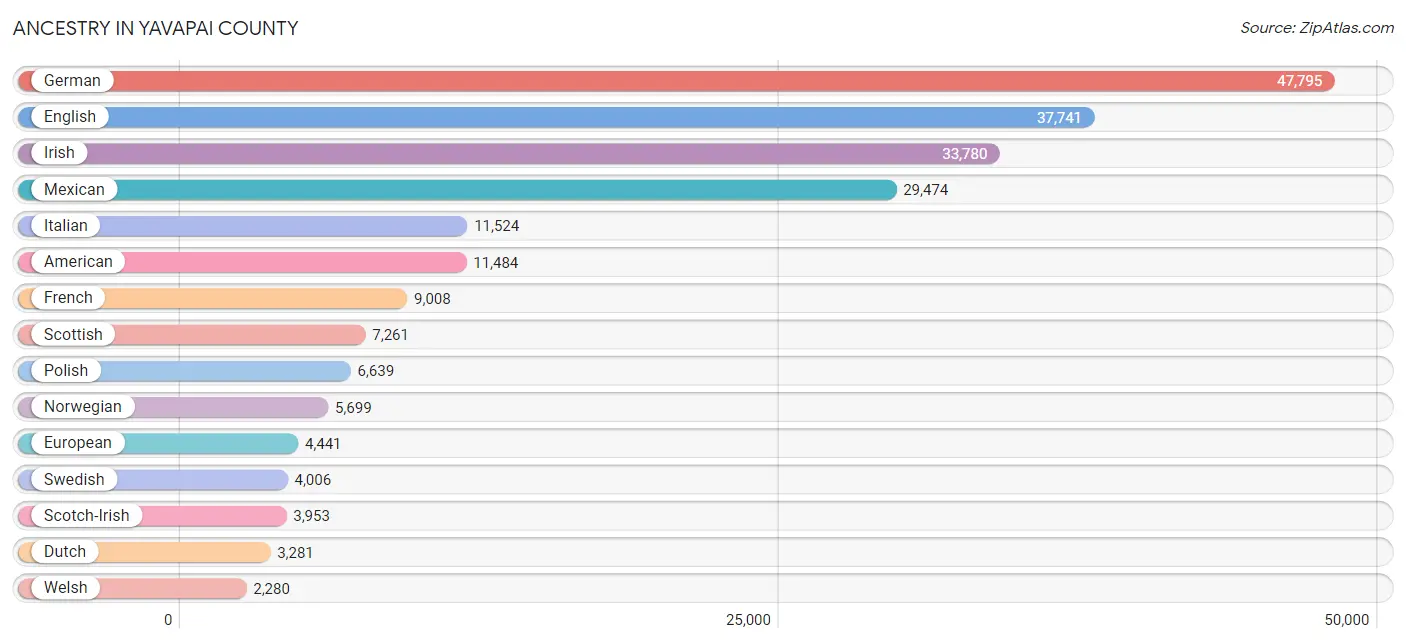
Ancestry in Yavapai County
The most populous ancestries reported in Yavapai County are German (47,795 | 20.1%), English (37,741 | 15.9%), Irish (33,780 | 14.2%), Mexican (29,474 | 12.4%), and Italian (11,524 | 4.9%), together accounting for 67.4% of all Yavapai County residents.
| Ancestry | # Population | % Population |
| Afghan | 21 | 0.0% |
| African | 102 | 0.0% |
| Alaska Native | 2 | 0.0% |
| Albanian | 24 | 0.0% |
| Aleut | 22 | 0.0% |
| American | 11,484 | 4.8% |
| Apache | 599 | 0.3% |
| Arab | 468 | 0.2% |
| Argentinean | 71 | 0.0% |
| Armenian | 299 | 0.1% |
| Australian | 94 | 0.0% |
| Austrian | 642 | 0.3% |
| Basque | 31 | 0.0% |
| Belgian | 260 | 0.1% |
| Bhutanese | 733 | 0.3% |
| Blackfeet | 56 | 0.0% |
| Bolivian | 19 | 0.0% |
| Brazilian | 91 | 0.0% |
| British | 2,061 | 0.9% |
| Bulgarian | 75 | 0.0% |
| Burmese | 652 | 0.3% |
| Cajun | 42 | 0.0% |
| Cambodian | 23 | 0.0% |
| Canadian | 810 | 0.3% |
| Celtic | 88 | 0.0% |
| Central American | 982 | 0.4% |
| Central American Indian | 43 | 0.0% |
| Cherokee | 1,258 | 0.5% |
| Cheyenne | 39 | 0.0% |
| Chickasaw | 219 | 0.1% |
| Chilean | 67 | 0.0% |
| Chippewa | 181 | 0.1% |
| Choctaw | 431 | 0.2% |
| Colombian | 155 | 0.1% |
| Comanche | 19 | 0.0% |
| Costa Rican | 34 | 0.0% |
| Cree | 89 | 0.0% |
| Creek | 53 | 0.0% |
| Croatian | 504 | 0.2% |
| Crow | 6 | 0.0% |
| Cuban | 466 | 0.2% |
| Czech | 1,488 | 0.6% |
| Czechoslovakian | 199 | 0.1% |
| Danish | 1,560 | 0.7% |
| Dominican | 43 | 0.0% |
| Dutch | 3,281 | 1.4% |
| Eastern European | 540 | 0.2% |
| Ecuadorian | 63 | 0.0% |
| Egyptian | 13 | 0.0% |
| English | 37,741 | 15.9% |
| Estonian | 52 | 0.0% |
| Ethiopian | 25 | 0.0% |
| European | 4,441 | 1.9% |
| Fijian | 51 | 0.0% |
| Filipino | 39 | 0.0% |
| Finnish | 731 | 0.3% |
| French | 9,008 | 3.8% |
| French American Indian | 107 | 0.0% |
| French Canadian | 1,840 | 0.8% |
| German | 47,795 | 20.1% |
| Greek | 1,152 | 0.5% |
| Guamanian / Chamorro | 63 | 0.0% |
| Guatemalan | 179 | 0.1% |
| Guyanese | 6 | 0.0% |
| Honduran | 50 | 0.0% |
| Hopi | 291 | 0.1% |
| Hungarian | 1,351 | 0.6% |
| Icelander | 51 | 0.0% |
| Indian (Asian) | 860 | 0.4% |
| Iranian | 126 | 0.1% |
| Irish | 33,780 | 14.2% |
| Iroquois | 148 | 0.1% |
| Israeli | 34 | 0.0% |
| Italian | 11,524 | 4.9% |
| Jamaican | 36 | 0.0% |
| Japanese | 92 | 0.0% |
| Jordanian | 26 | 0.0% |
| Korean | 948 | 0.4% |
| Laotian | 71 | 0.0% |
| Latvian | 26 | 0.0% |
| Lebanese | 313 | 0.1% |
| Lithuanian | 569 | 0.2% |
| Luxembourger | 95 | 0.0% |
| Malaysian | 7 | 0.0% |
| Maltese | 13 | 0.0% |
| Mexican | 29,474 | 12.4% |
| Mexican American Indian | 190 | 0.1% |
| Native Hawaiian | 380 | 0.2% |
| Navajo | 1,763 | 0.7% |
| Nicaraguan | 2 | 0.0% |
| Nigerian | 107 | 0.0% |
| Northern European | 677 | 0.3% |
| Norwegian | 5,699 | 2.4% |
| Osage | 12 | 0.0% |
| Paiute | 13 | 0.0% |
| Pakistani | 160 | 0.1% |
| Palestinian | 23 | 0.0% |
| Panamanian | 43 | 0.0% |
| Pennsylvania German | 53 | 0.0% |
| Peruvian | 308 | 0.1% |
| Pima | 26 | 0.0% |
| Polish | 6,639 | 2.8% |
| Portuguese | 1,161 | 0.5% |
| Potawatomi | 56 | 0.0% |
| Pueblo | 12 | 0.0% |
| Puerto Rican | 1,028 | 0.4% |
| Puget Sound Salish | 14 | 0.0% |
| Romanian | 196 | 0.1% |
| Russian | 1,641 | 0.7% |
| Salvadoran | 660 | 0.3% |
| Samoan | 65 | 0.0% |
| Scandinavian | 1,620 | 0.7% |
| Scotch-Irish | 3,953 | 1.7% |
| Scottish | 7,261 | 3.0% |
| Serbian | 123 | 0.1% |
| Shoshone | 93 | 0.0% |
| Sioux | 137 | 0.1% |
| Slavic | 171 | 0.1% |
| Slovak | 308 | 0.1% |
| Slovene | 185 | 0.1% |
| South African | 32 | 0.0% |
| South American | 687 | 0.3% |
| Soviet Union | 12 | 0.0% |
| Spaniard | 909 | 0.4% |
| Spanish | 1,383 | 0.6% |
| Sri Lankan | 418 | 0.2% |
| Subsaharan African | 266 | 0.1% |
| Swedish | 4,006 | 1.7% |
| Swiss | 1,252 | 0.5% |
| Syrian | 50 | 0.0% |
| Thai | 198 | 0.1% |
| Tlingit-Haida | 36 | 0.0% |
| Tohono O'Odham | 129 | 0.1% |
| Turkish | 165 | 0.1% |
| Ukrainian | 443 | 0.2% |
| Venezuelan | 4 | 0.0% |
| Welsh | 2,280 | 1.0% |
| West Indian | 19 | 0.0% |
| Yakama | 14 | 0.0% |
| Yaqui | 142 | 0.1% |
| Yugoslavian | 172 | 0.1% |
| Yuman | 356 | 0.2% | View All 142 Rows |
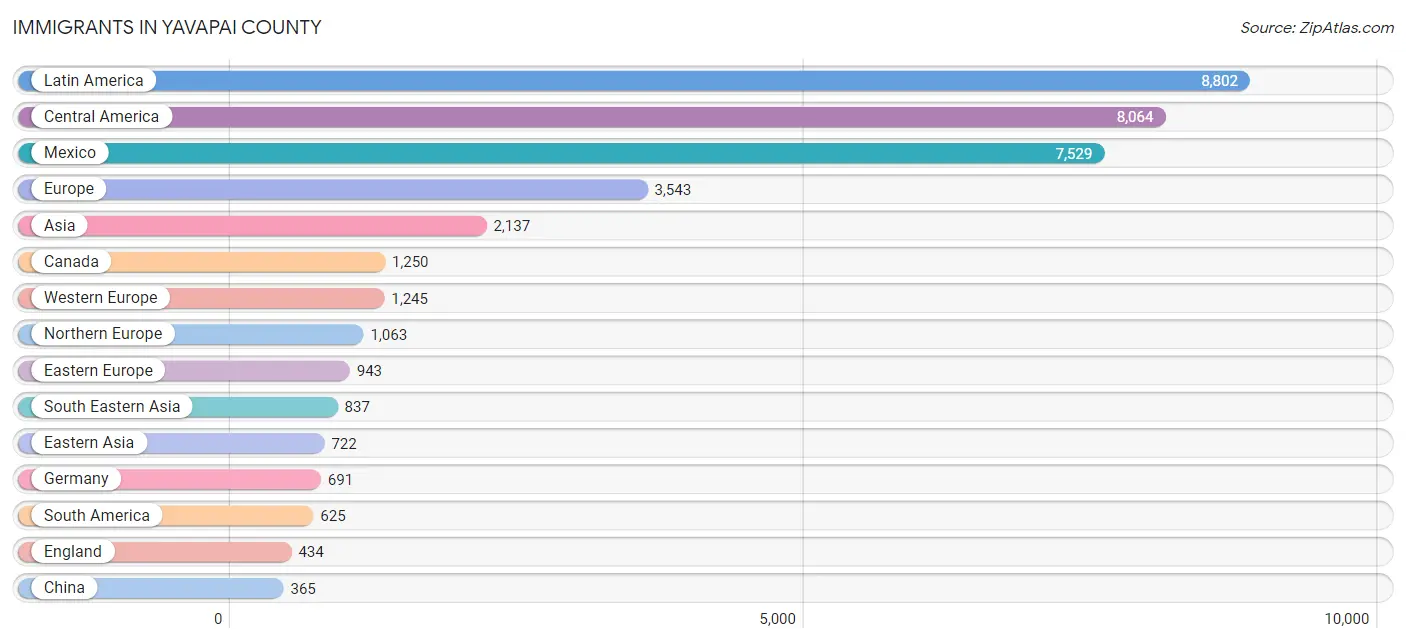
Immigrants in Yavapai County
The most numerous immigrant groups reported in Yavapai County came from Latin America (8,802 | 3.7%), Central America (8,064 | 3.4%), Mexico (7,529 | 3.2%), Europe (3,543 | 1.5%), and Asia (2,137 | 0.9%), together accounting for 12.7% of all Yavapai County residents.
| Immigration Origin | # Population | % Population |
| Afghanistan | 21 | 0.0% |
| Africa | 246 | 0.1% |
| Albania | 15 | 0.0% |
| Argentina | 127 | 0.1% |
| Armenia | 24 | 0.0% |
| Asia | 2,137 | 0.9% |
| Australia | 88 | 0.0% |
| Austria | 84 | 0.0% |
| Bahamas | 11 | 0.0% |
| Belgium | 37 | 0.0% |
| Belize | 13 | 0.0% |
| Bolivia | 19 | 0.0% |
| Bosnia and Herzegovina | 38 | 0.0% |
| Brazil | 53 | 0.0% |
| Cambodia | 92 | 0.0% |
| Canada | 1,250 | 0.5% |
| Caribbean | 113 | 0.1% |
| Central America | 8,064 | 3.4% |
| Chile | 103 | 0.0% |
| China | 365 | 0.2% |
| Colombia | 83 | 0.0% |
| Costa Rica | 21 | 0.0% |
| Croatia | 15 | 0.0% |
| Cuba | 66 | 0.0% |
| Czechoslovakia | 146 | 0.1% |
| Denmark | 110 | 0.1% |
| Eastern Africa | 48 | 0.0% |
| Eastern Asia | 722 | 0.3% |
| Eastern Europe | 943 | 0.4% |
| Ecuador | 43 | 0.0% |
| El Salvador | 295 | 0.1% |
| England | 434 | 0.2% |
| Ethiopia | 31 | 0.0% |
| Europe | 3,543 | 1.5% |
| France | 219 | 0.1% |
| Germany | 691 | 0.3% |
| Ghana | 9 | 0.0% |
| Greece | 18 | 0.0% |
| Guatemala | 170 | 0.1% |
| Guyana | 17 | 0.0% |
| Honduras | 36 | 0.0% |
| Hong Kong | 11 | 0.0% |
| India | 107 | 0.0% |
| Indonesia | 56 | 0.0% |
| Iran | 137 | 0.1% |
| Iraq | 26 | 0.0% |
| Ireland | 68 | 0.0% |
| Italy | 234 | 0.1% |
| Jamaica | 36 | 0.0% |
| Japan | 203 | 0.1% |
| Kenya | 17 | 0.0% |
| Korea | 154 | 0.1% |
| Latin America | 8,802 | 3.7% |
| Latvia | 10 | 0.0% |
| Lebanon | 32 | 0.0% |
| Mexico | 7,529 | 3.2% |
| Nepal | 27 | 0.0% |
| Netherlands | 113 | 0.1% |
| Northern Africa | 13 | 0.0% |
| Northern Europe | 1,063 | 0.4% |
| Norway | 20 | 0.0% |
| Oceania | 116 | 0.1% |
| Peru | 122 | 0.1% |
| Philippines | 347 | 0.2% |
| Poland | 229 | 0.1% |
| Portugal | 10 | 0.0% |
| Romania | 46 | 0.0% |
| Russia | 253 | 0.1% |
| Saudi Arabia | 10 | 0.0% |
| Scotland | 168 | 0.1% |
| Serbia | 35 | 0.0% |
| South Africa | 135 | 0.1% |
| South America | 625 | 0.3% |
| South Central Asia | 321 | 0.1% |
| South Eastern Asia | 837 | 0.4% |
| Southern Europe | 292 | 0.1% |
| Spain | 23 | 0.0% |
| Sri Lanka | 29 | 0.0% |
| Sweden | 20 | 0.0% |
| Switzerland | 69 | 0.0% |
| Syria | 52 | 0.0% |
| Taiwan | 24 | 0.0% |
| Thailand | 69 | 0.0% |
| Turkey | 102 | 0.0% |
| Ukraine | 59 | 0.0% |
| Venezuela | 58 | 0.0% |
| Vietnam | 273 | 0.1% |
| Western Africa | 19 | 0.0% |
| Western Asia | 246 | 0.1% |
| Western Europe | 1,245 | 0.5% | View All 90 Rows |
Sex and Age in Yavapai County
Sex and Age in Yavapai County
The most populous age groups in Yavapai County are 70 to 74 Years (11,205 | 9.6%) for men and 65 to 69 Years (12,691 | 10.5%) for women.
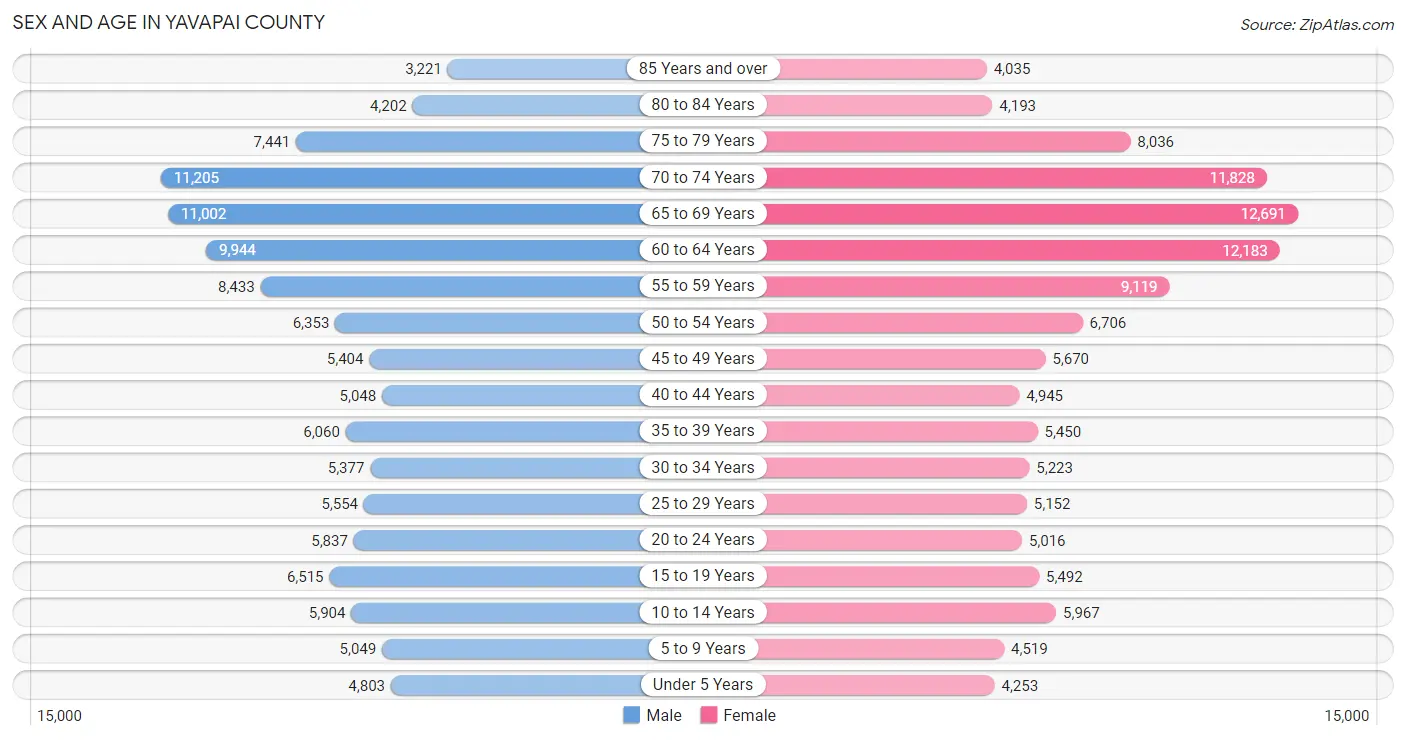
| Age Bracket | Male | Female |
| Under 5 Years | 4,803 (4.1%) | 4,253 (3.5%) |
| 5 to 9 Years | 5,049 (4.3%) | 4,519 (3.7%) |
| 10 to 14 Years | 5,904 (5.0%) | 5,967 (5.0%) |
| 15 to 19 Years | 6,515 (5.6%) | 5,492 (4.6%) |
| 20 to 24 Years | 5,837 (5.0%) | 5,016 (4.2%) |
| 25 to 29 Years | 5,554 (4.7%) | 5,152 (4.3%) |
| 30 to 34 Years | 5,377 (4.6%) | 5,223 (4.3%) |
| 35 to 39 Years | 6,060 (5.2%) | 5,450 (4.5%) |
| 40 to 44 Years | 5,048 (4.3%) | 4,945 (4.1%) |
| 45 to 49 Years | 5,404 (4.6%) | 5,670 (4.7%) |
| 50 to 54 Years | 6,353 (5.4%) | 6,706 (5.6%) |
| 55 to 59 Years | 8,433 (7.2%) | 9,119 (7.6%) |
| 60 to 64 Years | 9,944 (8.5%) | 12,183 (10.1%) |
| 65 to 69 Years | 11,002 (9.4%) | 12,691 (10.5%) |
| 70 to 74 Years | 11,205 (9.6%) | 11,828 (9.8%) |
| 75 to 79 Years | 7,441 (6.3%) | 8,036 (6.7%) |
| 80 to 84 Years | 4,202 (3.6%) | 4,193 (3.5%) |
| 85 Years and over | 3,221 (2.7%) | 4,035 (3.4%) |
| Total | 117,352 (100.0%) | 120,478 (100.0%) |
Families and Households in Yavapai County
Median Family Size in Yavapai County
The median family size in Yavapai County is 2.69 persons per family, with single female/mother families (8,598 | 13.2%) accounting for the largest median family size of 2.87 persons per family. On the other hand, single male/father families (4,305 | 6.6%) represent the smallest median family size with 2.49 persons per family.
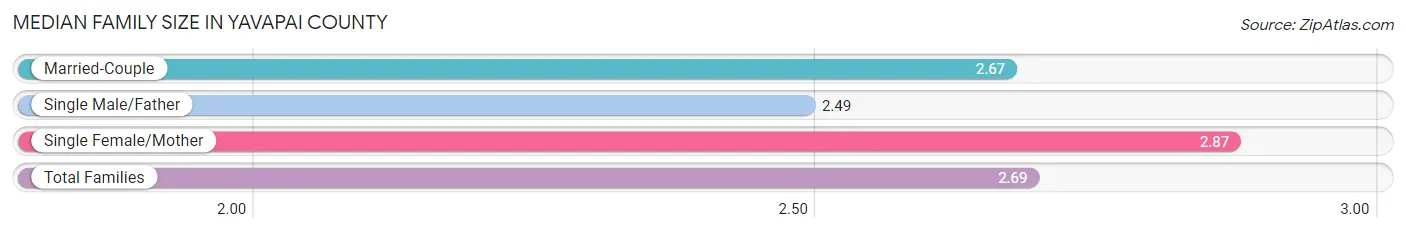
| Family Type | # Families | Family Size |
| Married-Couple | 52,304 (80.2%) | 2.67 |
| Single Male/Father | 4,305 (6.6%) | 2.49 |
| Single Female/Mother | 8,598 (13.2%) | 2.87 |
| Total Families | 65,207 (100.0%) | 2.69 |
Median Household Size in Yavapai County
The median household size in Yavapai County is 2.19 persons per household, with single female/mother households (8,598 | 8.1%) accounting for the largest median household size of 3.16 persons per household. non-family households (41,335 | 38.8%) represent the smallest median household size with 1.23 persons per household.
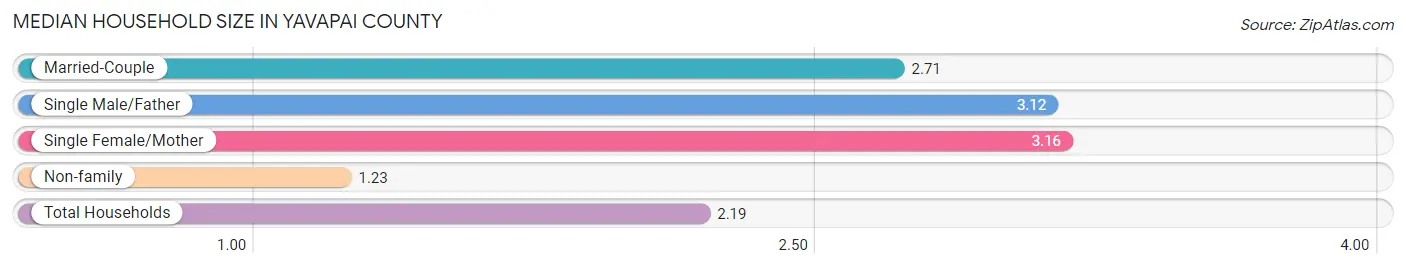
| Household Type | # Households | Household Size |
| Married-Couple | 52,304 (49.1%) | 2.71 |
| Single Male/Father | 4,305 (4.0%) | 3.12 |
| Single Female/Mother | 8,598 (8.1%) | 3.16 |
| Non-family | 41,335 (38.8%) | 1.23 |
| Total Households | 106,542 (100.0%) | 2.19 |
Household Size by Marriage Status in Yavapai County
Out of a total of 106,542 households in Yavapai County, 65,207 (61.2%) are family households, while 41,335 (38.8%) are nonfamily households. The most numerous type of family households are 2-person households, comprising 40,338, and the most common type of nonfamily households are 1-person households, comprising 33,553.
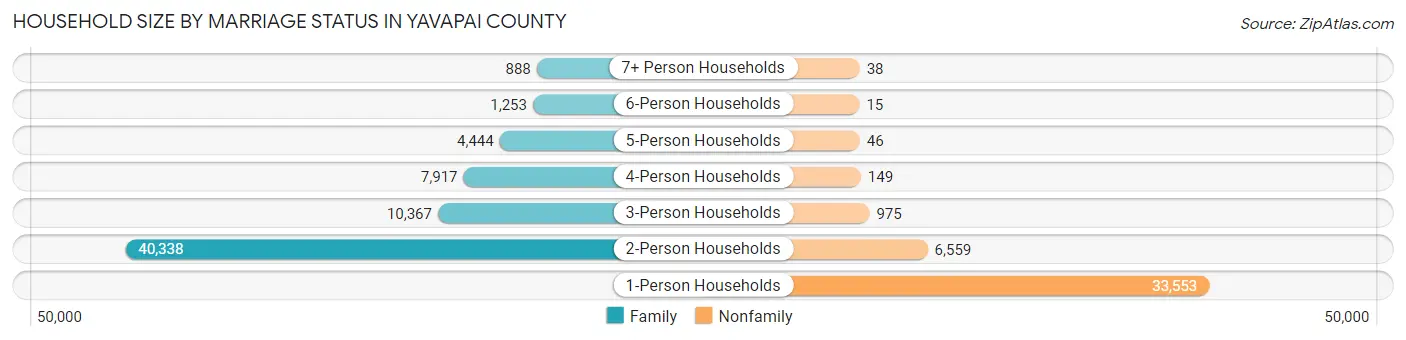
| Household Size | Family Households | Nonfamily Households |
| 1-Person Households | - | 33,553 (31.5%) |
| 2-Person Households | 40,338 (37.9%) | 6,559 (6.2%) |
| 3-Person Households | 10,367 (9.7%) | 975 (0.9%) |
| 4-Person Households | 7,917 (7.4%) | 149 (0.1%) |
| 5-Person Households | 4,444 (4.2%) | 46 (0.0%) |
| 6-Person Households | 1,253 (1.2%) | 15 (0.0%) |
| 7+ Person Households | 888 (0.8%) | 38 (0.0%) |
| Total | 65,207 (61.2%) | 41,335 (38.8%) |
Female Fertility in Yavapai County
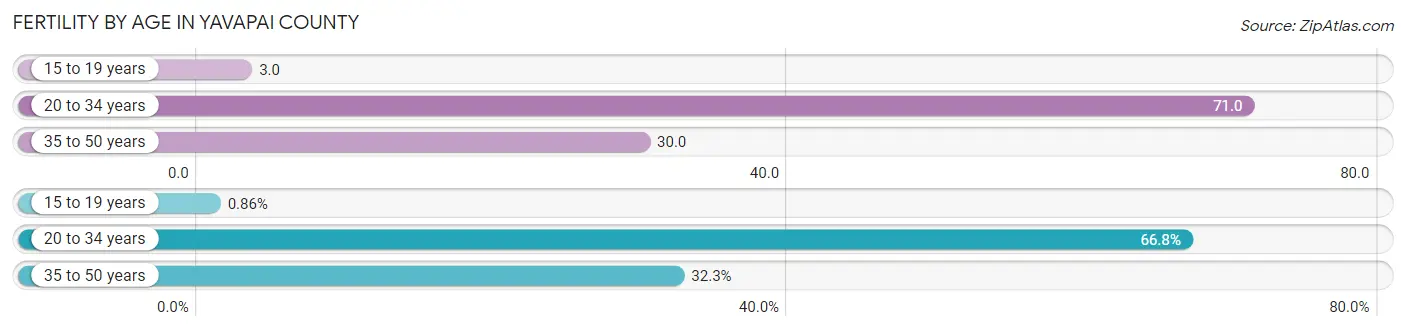
Fertility by Age in Yavapai County
Average fertility rate in Yavapai County is 42.0 births per 1,000 women. Women in the age bracket of 20 to 34 years have the highest fertility rate with 71.0 births per 1,000 women. Women in the age bracket of 20 to 34 years acount for 66.8% of all women with births.
| Age Bracket | Women with Births | Births / 1,000 Women |
| 15 to 19 years | 14 (0.9%) | 3.0 |
| 20 to 34 years | 1,089 (66.8%) | 71.0 |
| 35 to 50 years | 527 (32.3%) | 30.0 |
| Total | 1,630 (100.0%) | 42.0 |
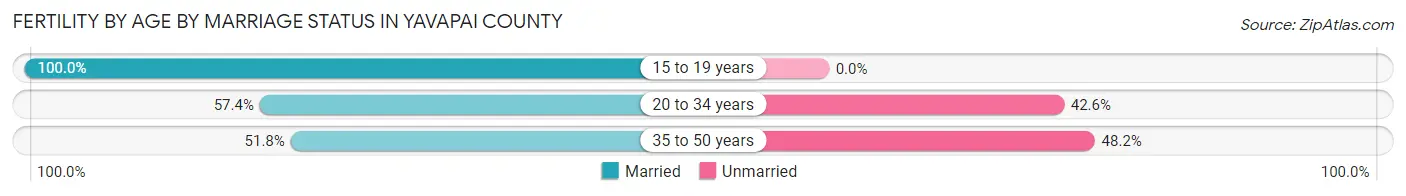
Fertility by Age by Marriage Status in Yavapai County
56.0% of women with births (1,630) in Yavapai County are married. The highest percentage of unmarried women with births falls into 35 to 50 years age bracket with 48.2% of them unmarried at the time of birth, while the lowest percentage of unmarried women with births belong to 15 to 19 years age bracket with 0.0% of them unmarried.
| Age Bracket | Married | Unmarried |
| 15 to 19 years | 14 (100.0%) | 0 (0.0%) |
| 20 to 34 years | 625 (57.4%) | 464 (42.6%) |
| 35 to 50 years | 273 (51.8%) | 254 (48.2%) |
| Total | 913 (56.0%) | 717 (44.0%) |
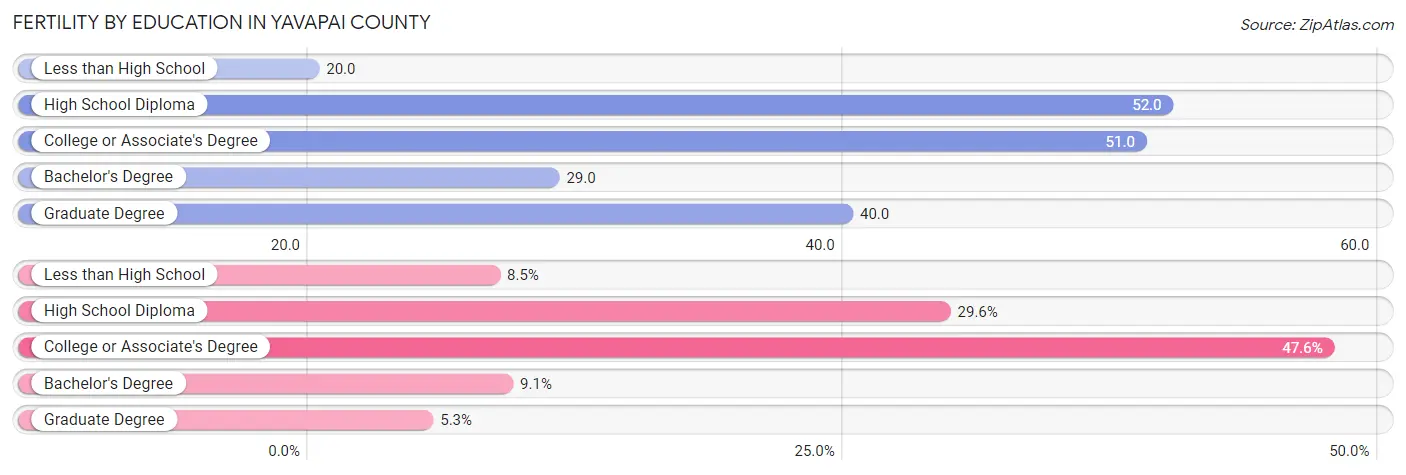
Fertility by Education in Yavapai County
Average fertility rate in Yavapai County is 42.0 births per 1,000 women. Women with the education attainment of high school diploma have the highest fertility rate of 52.0 births per 1,000 women, while women with the education attainment of less than high school have the lowest fertility at 20.0 births per 1,000 women. Women with the education attainment of college or associate's degree represent 47.5% of all women with births.
| Educational Attainment | Women with Births | Births / 1,000 Women |
| Less than High School | 138 (8.5%) | 20.0 |
| High School Diploma | 482 (29.6%) | 52.0 |
| College or Associate's Degree | 775 (47.5%) | 51.0 |
| Bachelor's Degree | 148 (9.1%) | 29.0 |
| Graduate Degree | 87 (5.3%) | 40.0 |
| Total | 1,630 (100.0%) | 42.0 |
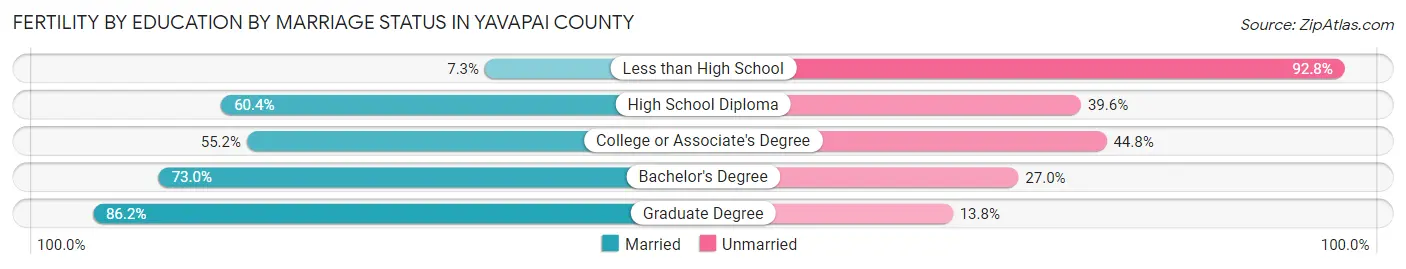
Fertility by Education by Marriage Status in Yavapai County
44.0% of women with births in Yavapai County are unmarried. Women with the educational attainment of graduate degree are most likely to be married with 86.2% of them married at childbirth, while women with the educational attainment of less than high school are least likely to be married with 92.7% of them unmarried at childbirth.
| Educational Attainment | Married | Unmarried |
| Less than High School | 10 (7.2%) | 128 (92.7%) |
| High School Diploma | 291 (60.4%) | 191 (39.6%) |
| College or Associate's Degree | 428 (55.2%) | 347 (44.8%) |
| Bachelor's Degree | 108 (73.0%) | 40 (27.0%) |
| Graduate Degree | 75 (86.2%) | 12 (13.8%) |
| Total | 913 (56.0%) | 717 (44.0%) |
Income in Yavapai County
Income Overview in Yavapai County
Per Capita Income in Yavapai County is $37,666, while median incomes of families and households are $78,461 and $62,430 respectively.
| Characteristic | Number | Measure |
| Per Capita Income | 237,830 | $37,666 |
| Median Family Income | 65,207 | $78,461 |
| Mean Family Income | 65,207 | $99,777 |
| Median Household Income | 106,542 | $62,430 |
| Mean Household Income | 106,542 | $83,305 |
| Income Deficit | 65,207 | $9,722 |
| Wage / Income Gap (%) | 237,830 | 24.58% |
| Wage / Income Gap ($) | 237,830 | 75.42¢ per $1 |
| Gini / Inequality Index | 237,830 | 0.45 |
Earnings by Sex in Yavapai County
Average Earnings in Yavapai County are $34,148, $39,986 for men and $30,156 for women, a difference of 24.6%.
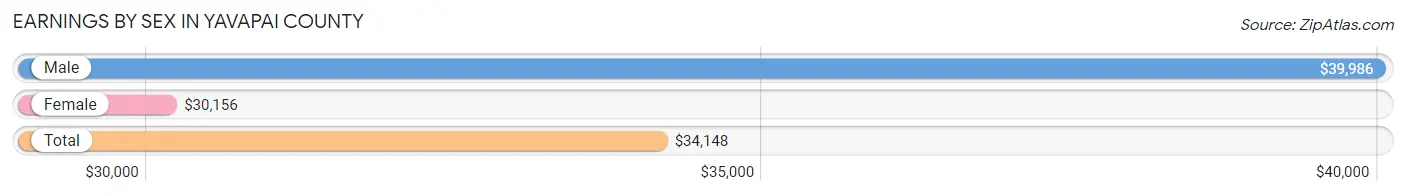
| Sex | Number | Average Earnings |
| Male | 56,274 (52.0%) | $39,986 |
| Female | 51,853 (48.0%) | $30,156 |
| Total | 108,127 (100.0%) | $34,148 |
Earnings by Sex by Income Bracket in Yavapai County
The most common earnings brackets in Yavapai County are $100,000+ for men (6,516 | 11.6%) and $25,000 to $29,999 for women (3,938 | 7.6%).
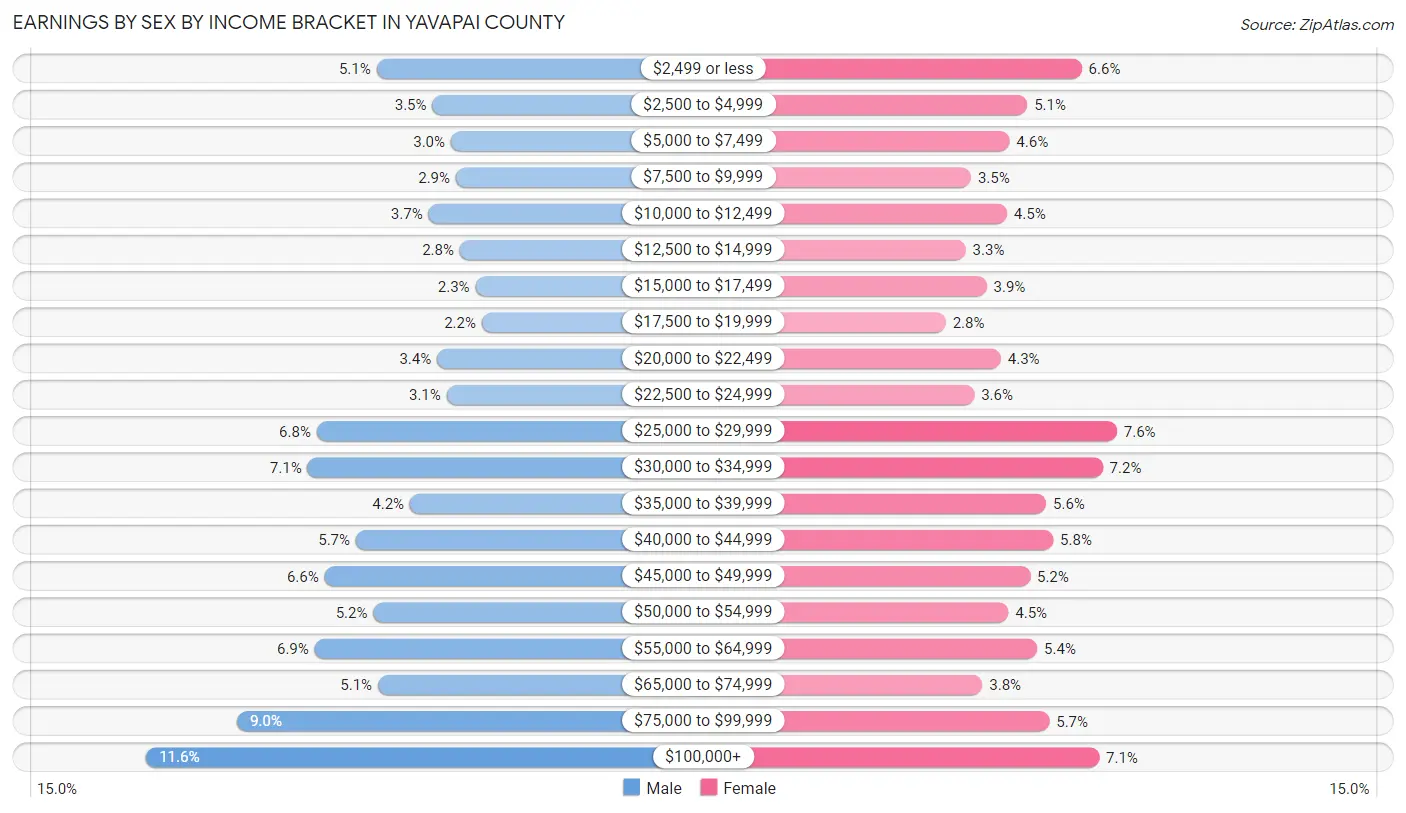
| Income | Male | Female |
| $2,499 or less | 2,875 (5.1%) | 3,423 (6.6%) |
| $2,500 to $4,999 | 1,993 (3.5%) | 2,628 (5.1%) |
| $5,000 to $7,499 | 1,701 (3.0%) | 2,368 (4.6%) |
| $7,500 to $9,999 | 1,622 (2.9%) | 1,808 (3.5%) |
| $10,000 to $12,499 | 2,056 (3.6%) | 2,333 (4.5%) |
| $12,500 to $14,999 | 1,556 (2.8%) | 1,732 (3.3%) |
| $15,000 to $17,499 | 1,312 (2.3%) | 2,038 (3.9%) |
| $17,500 to $19,999 | 1,210 (2.1%) | 1,443 (2.8%) |
| $20,000 to $22,499 | 1,919 (3.4%) | 2,245 (4.3%) |
| $22,500 to $24,999 | 1,768 (3.1%) | 1,854 (3.6%) |
| $25,000 to $29,999 | 3,821 (6.8%) | 3,938 (7.6%) |
| $30,000 to $34,999 | 3,966 (7.0%) | 3,729 (7.2%) |
| $35,000 to $39,999 | 2,344 (4.2%) | 2,902 (5.6%) |
| $40,000 to $44,999 | 3,202 (5.7%) | 3,009 (5.8%) |
| $45,000 to $49,999 | 3,697 (6.6%) | 2,672 (5.1%) |
| $50,000 to $54,999 | 2,924 (5.2%) | 2,354 (4.5%) |
| $55,000 to $64,999 | 3,856 (6.9%) | 2,773 (5.3%) |
| $65,000 to $74,999 | 2,855 (5.1%) | 1,974 (3.8%) |
| $75,000 to $99,999 | 5,081 (9.0%) | 2,953 (5.7%) |
| $100,000+ | 6,516 (11.6%) | 3,677 (7.1%) |
| Total | 56,274 (100.0%) | 51,853 (100.0%) |
Earnings by Sex by Educational Attainment in Yavapai County
Average earnings in Yavapai County are $45,282 for men and $33,545 for women, a difference of 25.9%. Men with an educational attainment of graduate degree enjoy the highest average annual earnings of $78,885, while those with less than high school education earn the least with $33,007. Women with an educational attainment of graduate degree earn the most with the average annual earnings of $57,032, while those with less than high school education have the smallest earnings of $28,428.
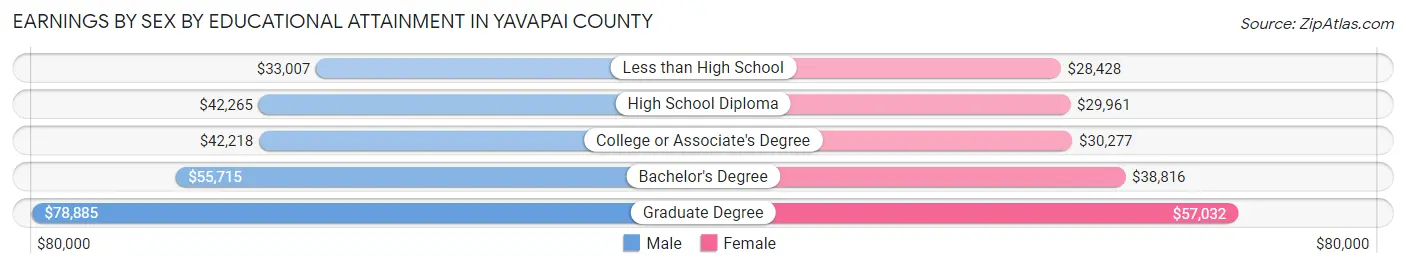
| Educational Attainment | Male Income | Female Income |
| Less than High School | $33,007 | $28,428 |
| High School Diploma | $42,265 | $29,961 |
| College or Associate's Degree | $42,218 | $30,277 |
| Bachelor's Degree | $55,715 | $38,816 |
| Graduate Degree | $78,885 | $57,032 |
| Total | $45,282 | $33,545 |
Family Income in Yavapai County
Family Income Brackets in Yavapai County
According to the Yavapai County family income data, there are 12,846 families falling into the $100,000 to $149,999 income range, which is the most common income bracket and makes up 19.7% of all families. Conversely, the $10,000 to $14,999 income bracket is the least frequent group with only 1,043 families (1.6%) belonging to this category.
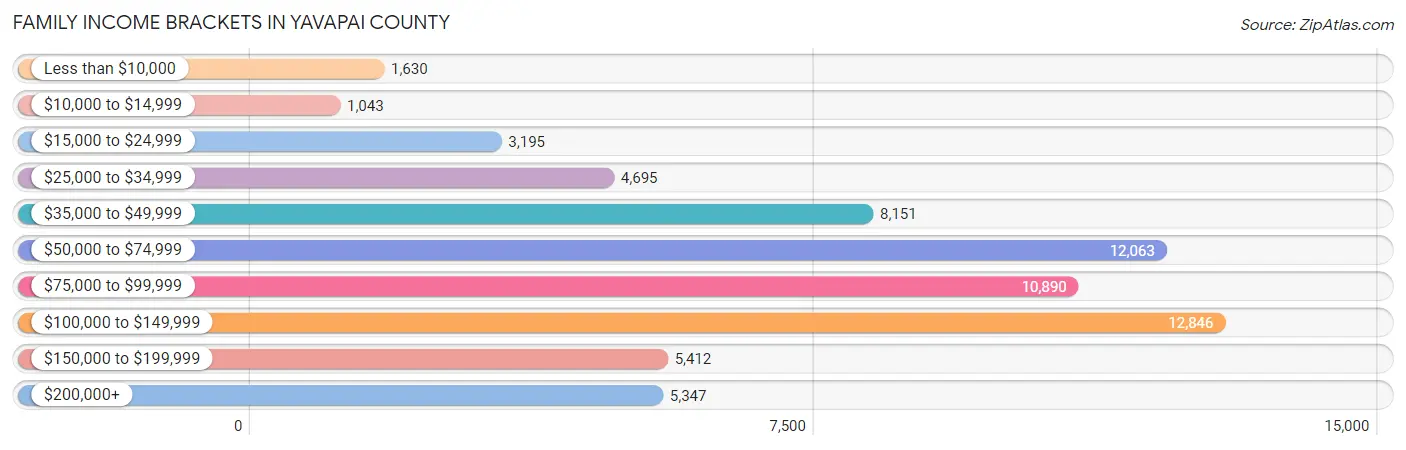
| Income Bracket | # Families | % Families |
| Less than $10,000 | 1,630 | 2.5% |
| $10,000 to $14,999 | 1,043 | 1.6% |
| $15,000 to $24,999 | 3,195 | 4.9% |
| $25,000 to $34,999 | 4,695 | 7.2% |
| $35,000 to $49,999 | 8,151 | 12.5% |
| $50,000 to $74,999 | 12,063 | 18.5% |
| $75,000 to $99,999 | 10,890 | 16.7% |
| $100,000 to $149,999 | 12,846 | 19.7% |
| $150,000 to $199,999 | 5,412 | 8.3% |
| $200,000+ | 5,347 | 8.2% |
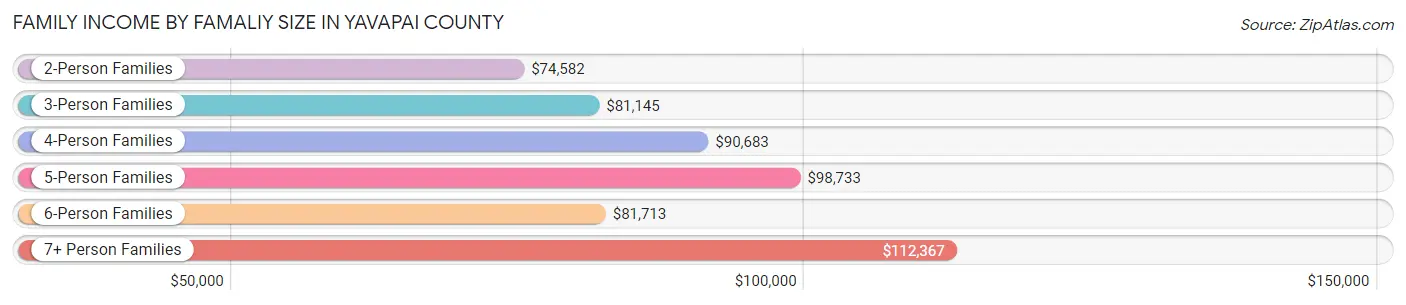
Family Income by Famaliy Size in Yavapai County
7+ person families (601 | 0.9%) account for the highest median family income in Yavapai County with $112,367 per family, while 2-person families (43,013 | 66.0%) have the highest median income of $37,291 per family member.
| Income Bracket | # Families | Median Income |
| 2-Person Families | 43,013 (66.0%) | $74,582 |
| 3-Person Families | 9,994 (15.3%) | $81,145 |
| 4-Person Families | 6,773 (10.4%) | $90,683 |
| 5-Person Families | 3,705 (5.7%) | $98,733 |
| 6-Person Families | 1,121 (1.7%) | $81,713 |
| 7+ Person Families | 601 (0.9%) | $112,367 |
| Total | 65,207 (100.0%) | $78,461 |
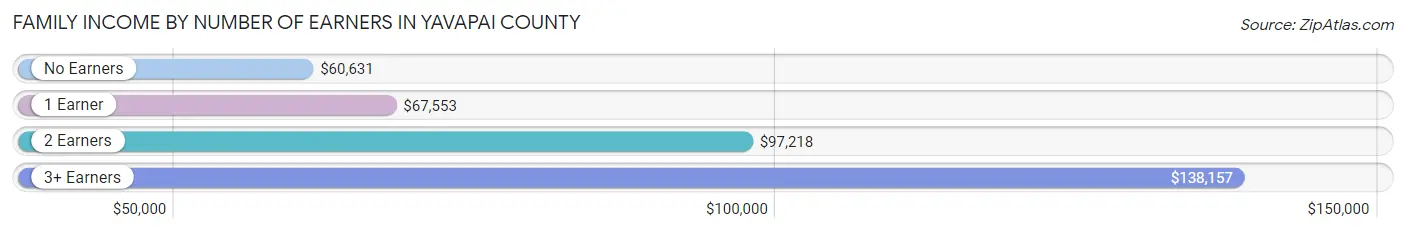
Family Income by Number of Earners in Yavapai County
The median family income in Yavapai County is $78,461, with families comprising 3+ earners (4,615) having the highest median family income of $138,157, while families with no earners (20,352) have the lowest median family income of $60,631, accounting for 7.1% and 31.2% of families, respectively.
| Number of Earners | # Families | Median Income |
| No Earners | 20,352 (31.2%) | $60,631 |
| 1 Earner | 20,362 (31.2%) | $67,553 |
| 2 Earners | 19,878 (30.5%) | $97,218 |
| 3+ Earners | 4,615 (7.1%) | $138,157 |
| Total | 65,207 (100.0%) | $78,461 |
Household Income in Yavapai County
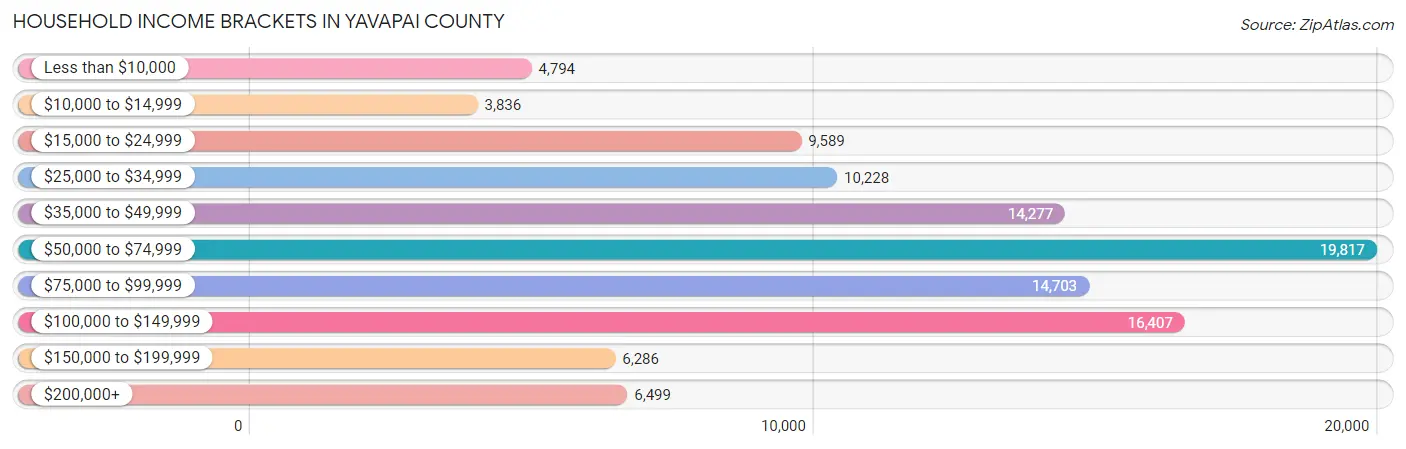
Household Income Brackets in Yavapai County
With 19,817 households falling in the category, the $50,000 to $74,999 income range is the most frequent in Yavapai County, accounting for 18.6% of all households. In contrast, only 3,836 households (3.6%) fall into the $10,000 to $14,999 income bracket, making it the least populous group.
| Income Bracket | # Households | % Households |
| Less than $10,000 | 4,794 | 4.5% |
| $10,000 to $14,999 | 3,836 | 3.6% |
| $15,000 to $24,999 | 9,589 | 9.0% |
| $25,000 to $34,999 | 10,228 | 9.6% |
| $35,000 to $49,999 | 14,277 | 13.4% |
| $50,000 to $74,999 | 19,817 | 18.6% |
| $75,000 to $99,999 | 14,703 | 13.8% |
| $100,000 to $149,999 | 16,407 | 15.4% |
| $150,000 to $199,999 | 6,286 | 5.9% |
| $200,000+ | 6,499 | 6.1% |
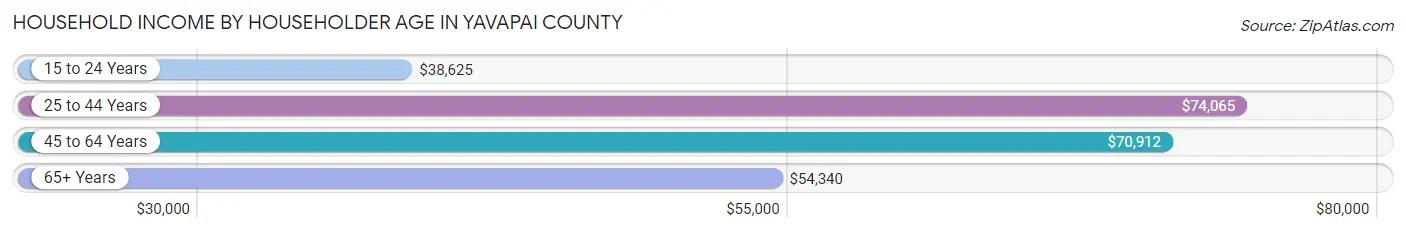
Household Income by Householder Age in Yavapai County
The median household income in Yavapai County is $62,430, with the highest median household income of $74,065 found in the 25 to 44 years age bracket for the primary householder. A total of 18,703 households (17.5%) fall into this category. Meanwhile, the 15 to 24 years age bracket for the primary householder has the lowest median household income of $38,625, with 2,583 households (2.4%) in this group.
| Income Bracket | # Households | Median Income |
| 15 to 24 Years | 2,583 (2.4%) | $38,625 |
| 25 to 44 Years | 18,703 (17.5%) | $74,065 |
| 45 to 64 Years | 35,430 (33.3%) | $70,912 |
| 65+ Years | 49,826 (46.8%) | $54,340 |
| Total | 106,542 (100.0%) | $62,430 |
Poverty in Yavapai County
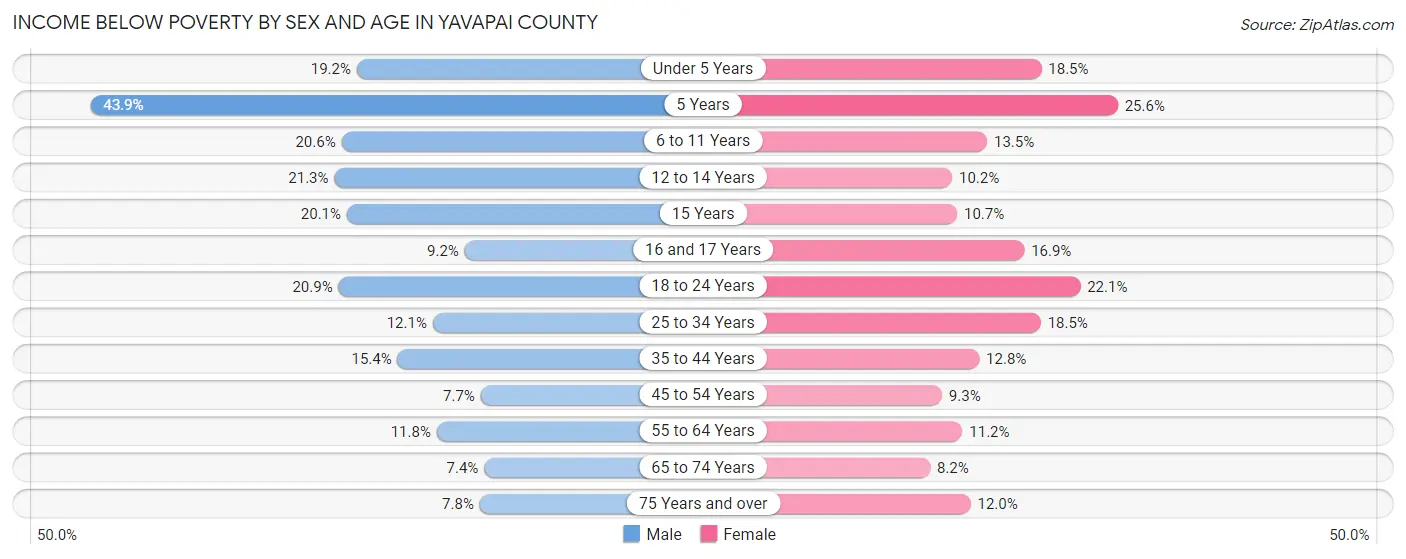
Income Below Poverty by Sex and Age in Yavapai County
With 12.3% poverty level for males and 12.4% for females among the residents of Yavapai County, 5 year old males and 5 year old females are the most vulnerable to poverty, with 385 males (43.9%) and 189 females (25.6%) in their respective age groups living below the poverty level.
| Age Bracket | Male | Female |
| Under 5 Years | 902 (19.2%) | 779 (18.5%) |
| 5 Years | 385 (43.9%) | 189 (25.6%) |
| 6 to 11 Years | 1,319 (20.6%) | 763 (13.5%) |
| 12 to 14 Years | 651 (21.2%) | 380 (10.2%) |
| 15 Years | 212 (20.1%) | 120 (10.7%) |
| 16 and 17 Years | 236 (9.2%) | 373 (16.9%) |
| 18 to 24 Years | 1,544 (20.9%) | 1,437 (22.1%) |
| 25 to 34 Years | 1,301 (12.1%) | 1,907 (18.5%) |
| 35 to 44 Years | 1,686 (15.4%) | 1,322 (12.8%) |
| 45 to 54 Years | 895 (7.7%) | 1,146 (9.3%) |
| 55 to 64 Years | 2,143 (11.7%) | 2,381 (11.2%) |
| 65 to 74 Years | 1,624 (7.3%) | 2,003 (8.2%) |
| 75 Years and over | 1,136 (7.8%) | 1,931 (11.9%) |
| Total | 14,034 (12.3%) | 14,731 (12.4%) |
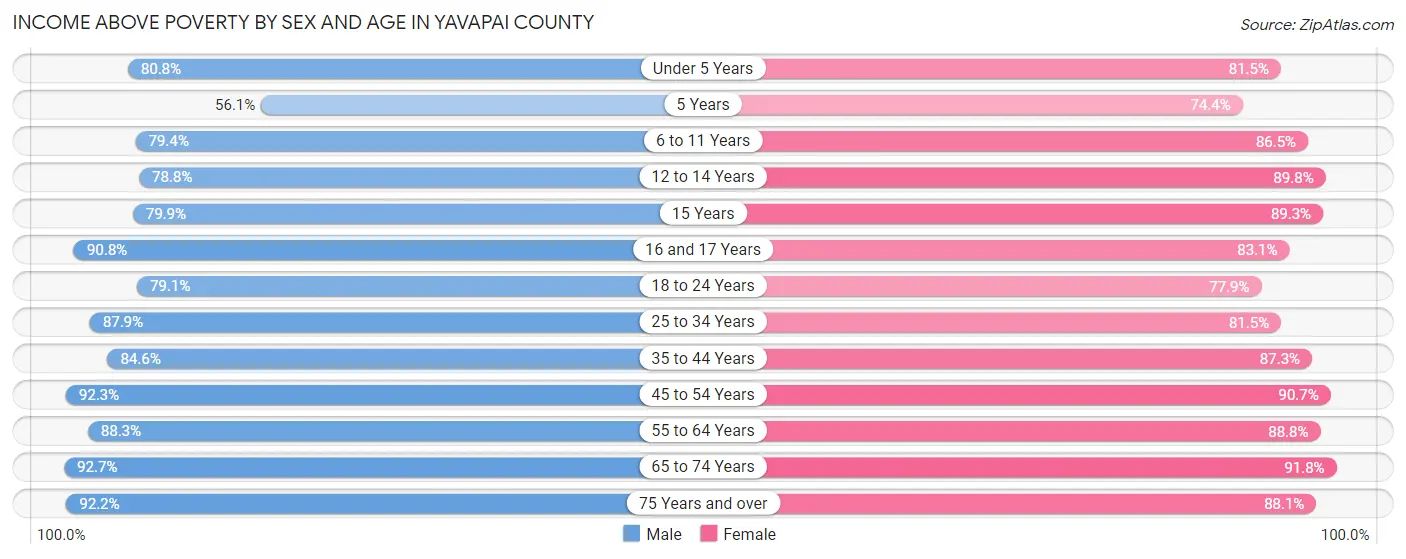
Income Above Poverty by Sex and Age in Yavapai County
According to the poverty statistics in Yavapai County, males aged 65 to 74 years and females aged 65 to 74 years are the age groups that are most secure financially, with 92.6% of males and 91.8% of females in these age groups living above the poverty line.
| Age Bracket | Male | Female |
| Under 5 Years | 3,804 (80.8%) | 3,428 (81.5%) |
| 5 Years | 492 (56.1%) | 549 (74.4%) |
| 6 to 11 Years | 5,086 (79.4%) | 4,898 (86.5%) |
| 12 to 14 Years | 2,413 (78.7%) | 3,335 (89.8%) |
| 15 Years | 843 (79.9%) | 1,001 (89.3%) |
| 16 and 17 Years | 2,340 (90.8%) | 1,830 (83.1%) |
| 18 to 24 Years | 5,855 (79.1%) | 5,056 (77.9%) |
| 25 to 34 Years | 9,435 (87.9%) | 8,423 (81.5%) |
| 35 to 44 Years | 9,271 (84.6%) | 9,043 (87.3%) |
| 45 to 54 Years | 10,769 (92.3%) | 11,195 (90.7%) |
| 55 to 64 Years | 16,094 (88.2%) | 18,905 (88.8%) |
| 65 to 74 Years | 20,459 (92.6%) | 22,442 (91.8%) |
| 75 Years and over | 13,495 (92.2%) | 14,223 (88.0%) |
| Total | 100,356 (87.7%) | 104,328 (87.6%) |
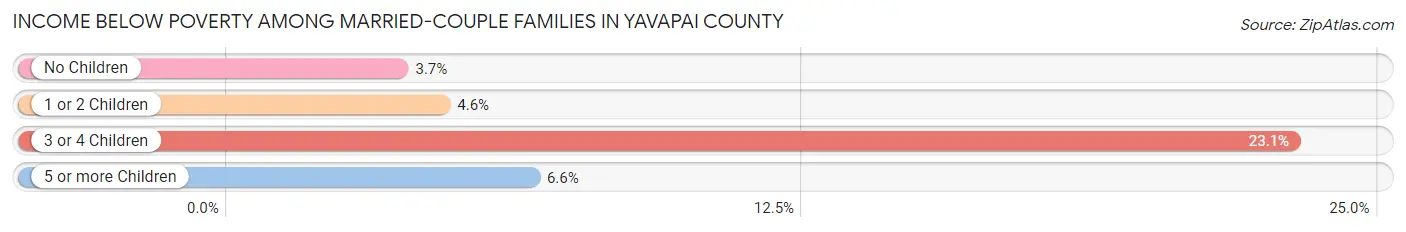
Income Below Poverty Among Married-Couple Families in Yavapai County
The poverty statistics for married-couple families in Yavapai County show that 4.9% or 2,552 of the total 52,304 families live below the poverty line. Families with 3 or 4 children have the highest poverty rate of 23.1%, comprising of 622 families. On the other hand, families with no children have the lowest poverty rate of 3.7%, which includes 1,487 families.
| Children | Above Poverty | Below Poverty |
| No Children | 38,624 (96.3%) | 1,487 (3.7%) |
| 1 or 2 Children | 8,862 (95.4%) | 429 (4.6%) |
| 3 or 4 Children | 2,067 (76.9%) | 622 (23.1%) |
| 5 or more Children | 199 (93.4%) | 14 (6.6%) |
| Total | 49,752 (95.1%) | 2,552 (4.9%) |
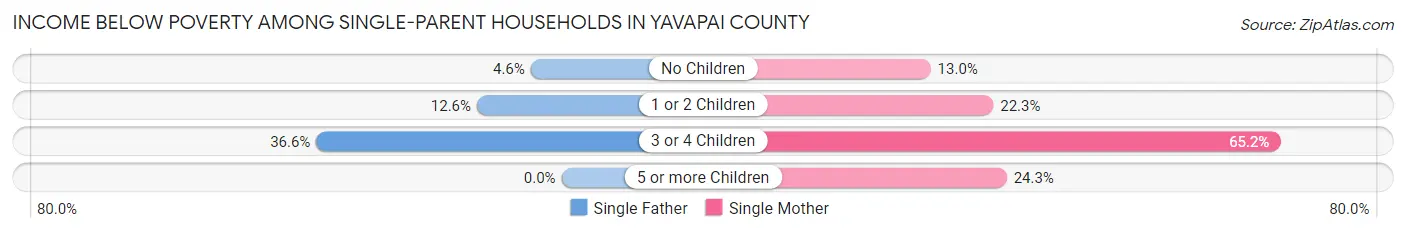
Income Below Poverty Among Single-Parent Households in Yavapai County
According to the poverty data in Yavapai County, 11.0% or 475 single-father households and 20.8% or 1,786 single-mother households are living below the poverty line. Among single-father households, those with 3 or 4 children have the highest poverty rate, with 125 households (36.5%) experiencing poverty. Likewise, among single-mother households, those with 3 or 4 children have the highest poverty rate, with 354 households (65.2%) falling below the poverty line.
| Children | Single Father | Single Mother |
| No Children | 86 (4.6%) | 507 (13.0%) |
| 1 or 2 Children | 264 (12.6%) | 908 (22.3%) |
| 3 or 4 Children | 125 (36.5%) | 354 (65.2%) |
| 5 or more Children | 0 (0.0%) | 17 (24.3%) |
| Total | 475 (11.0%) | 1,786 (20.8%) |
Income Below Poverty Among Married-Couple vs Single-Parent Households in Yavapai County
The poverty data for Yavapai County shows that 2,552 of the married-couple family households (4.9%) and 2,261 of the single-parent households (17.5%) are living below the poverty level. Within the married-couple family households, those with 3 or 4 children have the highest poverty rate, with 622 households (23.1%) falling below the poverty line. Among the single-parent households, those with 3 or 4 children have the highest poverty rate, with 479 household (54.1%) living below poverty.
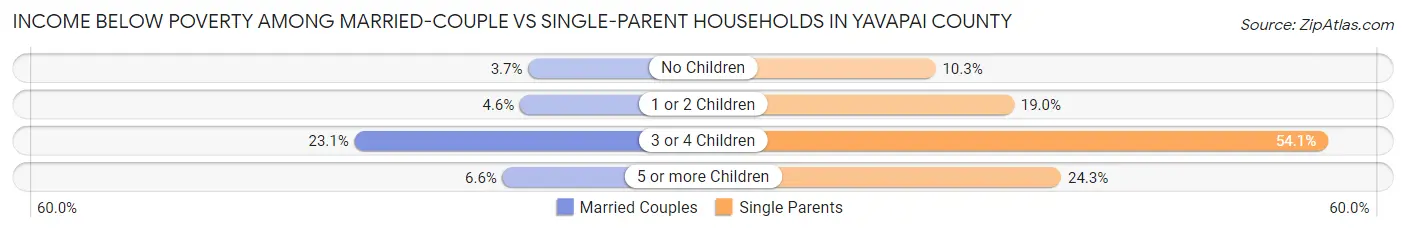
| Children | Married-Couple Families | Single-Parent Households |
| No Children | 1,487 (3.7%) | 593 (10.3%) |
| 1 or 2 Children | 429 (4.6%) | 1,172 (19.0%) |
| 3 or 4 Children | 622 (23.1%) | 479 (54.1%) |
| 5 or more Children | 14 (6.6%) | 17 (24.3%) |
| Total | 2,552 (4.9%) | 2,261 (17.5%) |
Employment Characteristics in Yavapai County
Employment by Class of Employer in Yavapai County
Among the 92,865 employed individuals in Yavapai County, private company employees (57,219 | 61.6%), self-employed (not incorporated) (10,527 | 11.3%), and not-for-profit organizations (7,659 | 8.3%) make up the most common classes of employment.
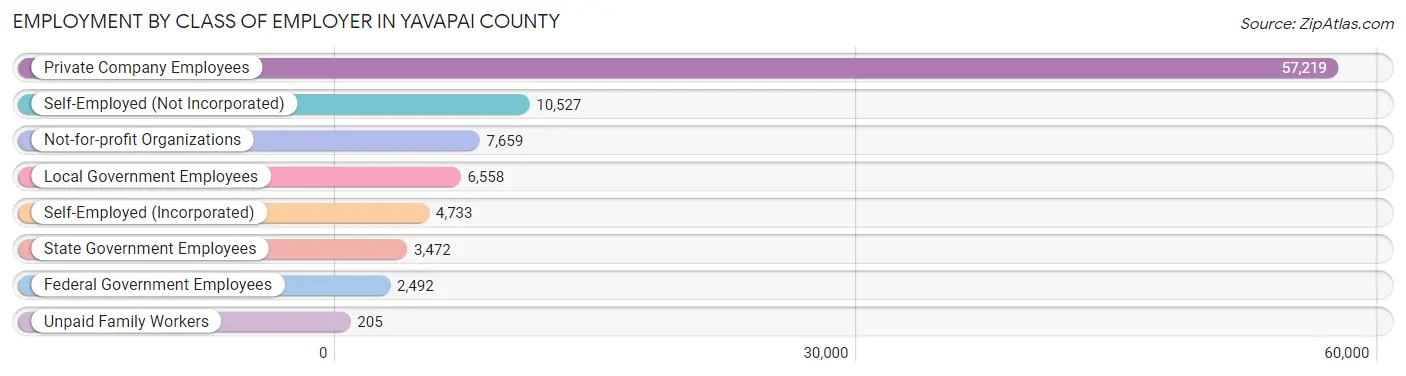
| Employer Class | # Employees | % Employees |
| Private Company Employees | 57,219 | 61.6% |
| Self-Employed (Incorporated) | 4,733 | 5.1% |
| Self-Employed (Not Incorporated) | 10,527 | 11.3% |
| Not-for-profit Organizations | 7,659 | 8.3% |
| Local Government Employees | 6,558 | 7.1% |
| State Government Employees | 3,472 | 3.7% |
| Federal Government Employees | 2,492 | 2.7% |
| Unpaid Family Workers | 205 | 0.2% |
| Total | 92,865 | 100.0% |
Employment Status by Age in Yavapai County
According to the labor force statistics for Yavapai County, out of the total population over 16 years of age (205,150), 48.7% or 99,908 individuals are in the labor force, with 4.9% or 4,895 of them unemployed. The age group with the highest labor force participation rate is 35 to 44 years, with 82.8% or 17,804 individuals in the labor force. Within the labor force, the 16 to 19 years age range has the highest percentage of unemployed individuals, with 14.8% or 624 of them being unemployed.
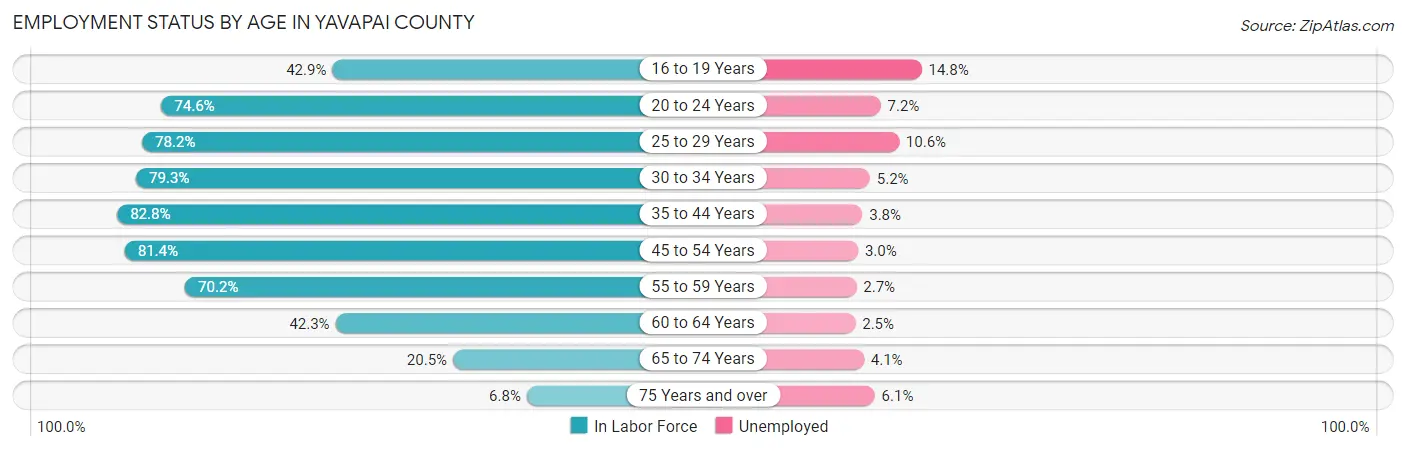
| Age Bracket | In Labor Force | Unemployed |
| 16 to 19 Years | 4,214 (42.9%) | 624 (14.8%) |
| 20 to 24 Years | 8,096 (74.6%) | 583 (7.2%) |
| 25 to 29 Years | 8,372 (78.2%) | 887 (10.6%) |
| 30 to 34 Years | 8,406 (79.3%) | 437 (5.2%) |
| 35 to 44 Years | 17,804 (82.8%) | 677 (3.8%) |
| 45 to 54 Years | 19,644 (81.4%) | 589 (3.0%) |
| 55 to 59 Years | 12,322 (70.2%) | 333 (2.7%) |
| 60 to 64 Years | 9,360 (42.3%) | 234 (2.5%) |
| 65 to 74 Years | 9,579 (20.5%) | 393 (4.1%) |
| 75 Years and over | 2,117 (6.8%) | 129 (6.1%) |
| Total | 99,908 (48.7%) | 4,895 (4.9%) |
Employment Status by Educational Attainment in Yavapai County
According to labor force statistics for Yavapai County, 71.2% of individuals (75,914) out of the total population between 25 and 64 years of age (106,621) are in the labor force, with 4.2% or 3,188 of them being unemployed. The group with the highest labor force participation rate are those with the educational attainment of bachelor's degree or higher, with 74.8% or 19,998 individuals in the labor force. Within the labor force, individuals with less than high school education have the highest percentage of unemployment, with 9.7% or 588 of them being unemployed.
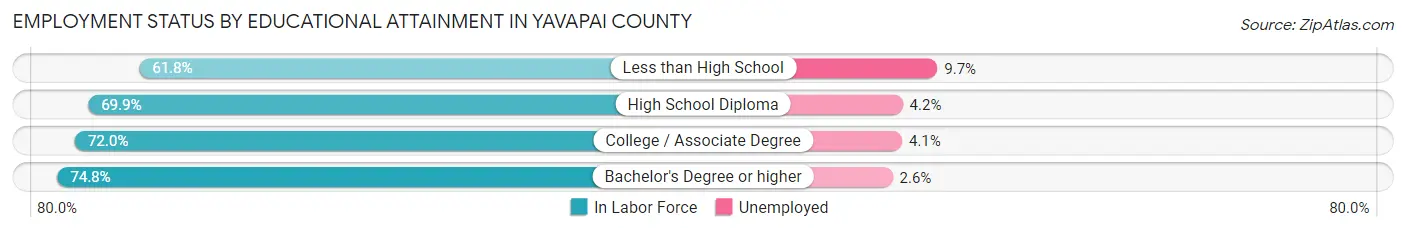
| Educational Attainment | In Labor Force | Unemployed |
| Less than High School | 6,058 (61.8%) | 951 (9.7%) |
| High School Diploma | 20,107 (69.9%) | 1,208 (4.2%) |
| College / Associate Degree | 29,750 (72.0%) | 1,694 (4.1%) |
| Bachelor's Degree or higher | 19,998 (74.8%) | 695 (2.6%) |
| Total | 75,914 (71.2%) | 4,478 (4.2%) |
Employment Occupations by Sex in Yavapai County
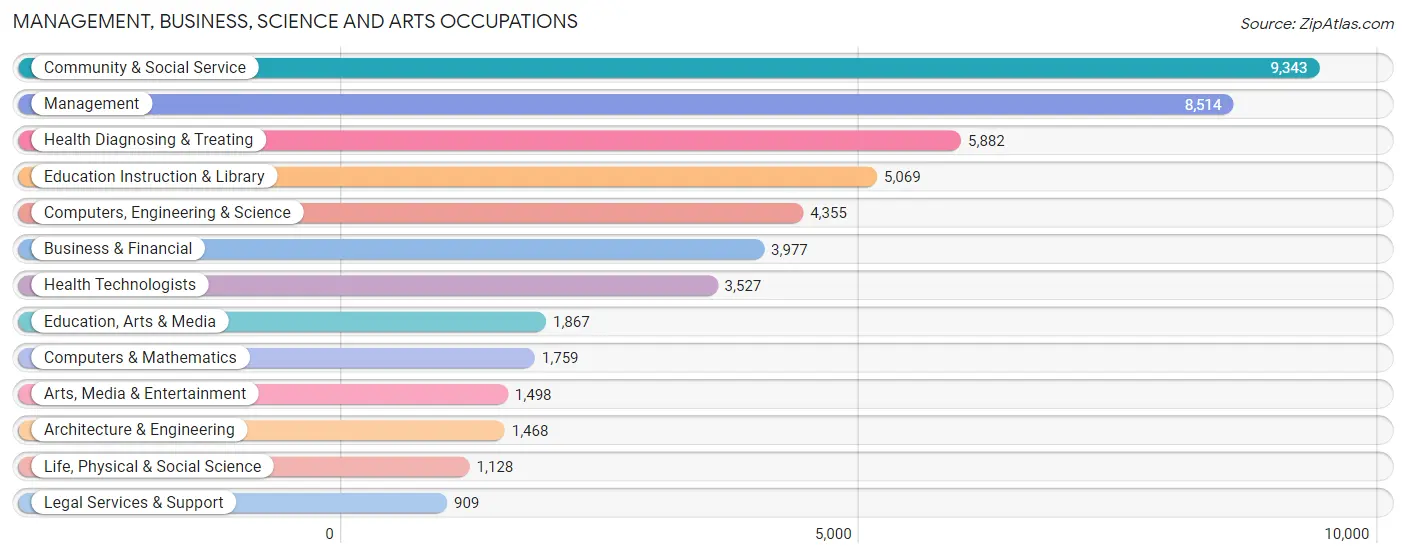
Management, Business, Science and Arts Occupations
The most common Management, Business, Science and Arts occupations in Yavapai County are Community & Social Service (9,343 | 9.8%), Management (8,514 | 9.0%), Health Diagnosing & Treating (5,882 | 6.2%), Education Instruction & Library (5,069 | 5.3%), and Computers, Engineering & Science (4,355 | 4.6%).
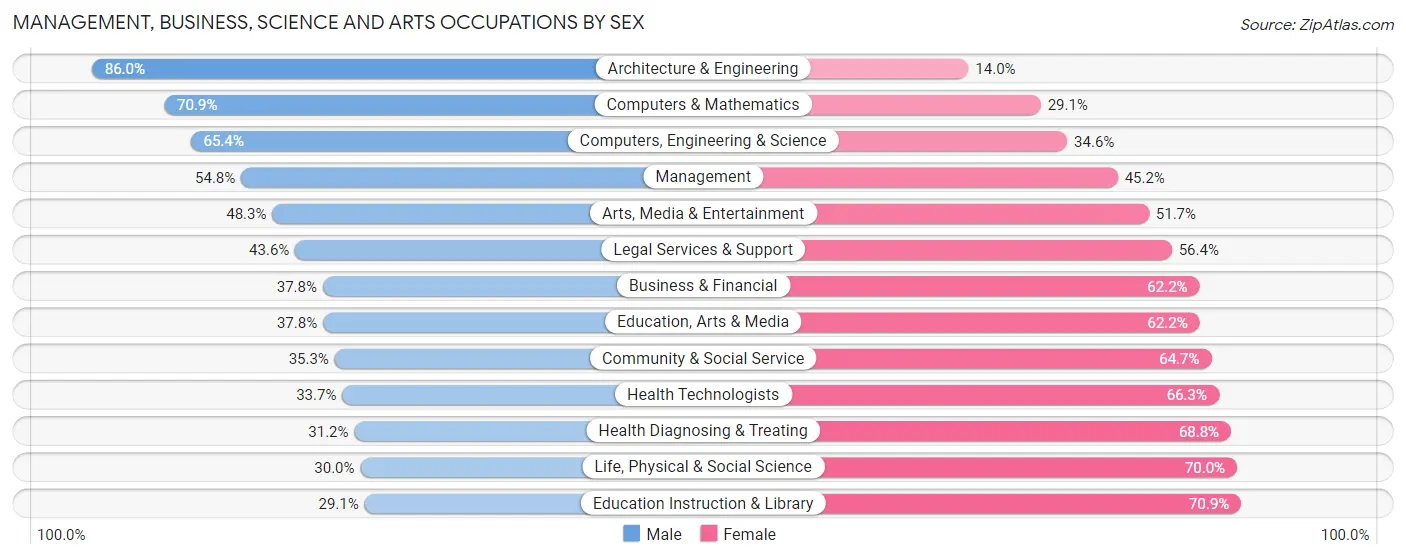
Management, Business, Science and Arts Occupations by Sex
Within the Management, Business, Science and Arts occupations in Yavapai County, the most male-oriented occupations are Architecture & Engineering (86.0%), Computers & Mathematics (70.9%), and Computers, Engineering & Science (65.4%), while the most female-oriented occupations are Education Instruction & Library (70.9%), Life, Physical & Social Science (70.0%), and Health Diagnosing & Treating (68.8%).
| Occupation | Male | Female |
| Management | 4,668 (54.8%) | 3,846 (45.2%) |
| Business & Financial | 1,503 (37.8%) | 2,474 (62.2%) |
| Computers, Engineering & Science | 2,847 (65.4%) | 1,508 (34.6%) |
| Computers & Mathematics | 1,247 (70.9%) | 512 (29.1%) |
| Architecture & Engineering | 1,262 (86.0%) | 206 (14.0%) |
| Life, Physical & Social Science | 338 (30.0%) | 790 (70.0%) |
| Community & Social Service | 3,299 (35.3%) | 6,044 (64.7%) |
| Education, Arts & Media | 705 (37.8%) | 1,162 (62.2%) |
| Legal Services & Support | 396 (43.6%) | 513 (56.4%) |
| Education Instruction & Library | 1,474 (29.1%) | 3,595 (70.9%) |
| Arts, Media & Entertainment | 724 (48.3%) | 774 (51.7%) |
| Health Diagnosing & Treating | 1,836 (31.2%) | 4,046 (68.8%) |
| Health Technologists | 1,190 (33.7%) | 2,337 (66.3%) |
| Total (Category) | 14,153 (44.1%) | 17,918 (55.9%) |
| Total (Overall) | 48,982 (51.6%) | 45,972 (48.4%) |
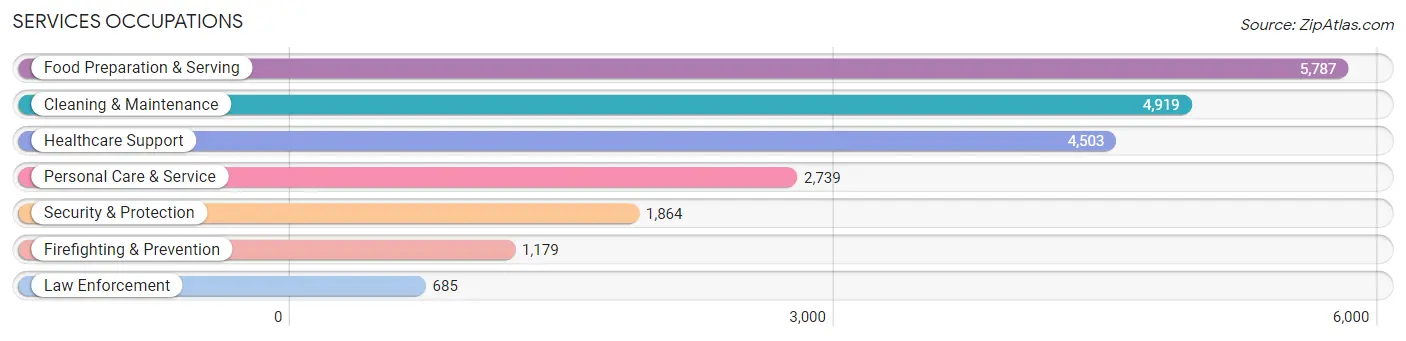
Services Occupations
The most common Services occupations in Yavapai County are Food Preparation & Serving (5,787 | 6.1%), Cleaning & Maintenance (4,919 | 5.2%), Healthcare Support (4,503 | 4.7%), Personal Care & Service (2,739 | 2.9%), and Security & Protection (1,864 | 2.0%).
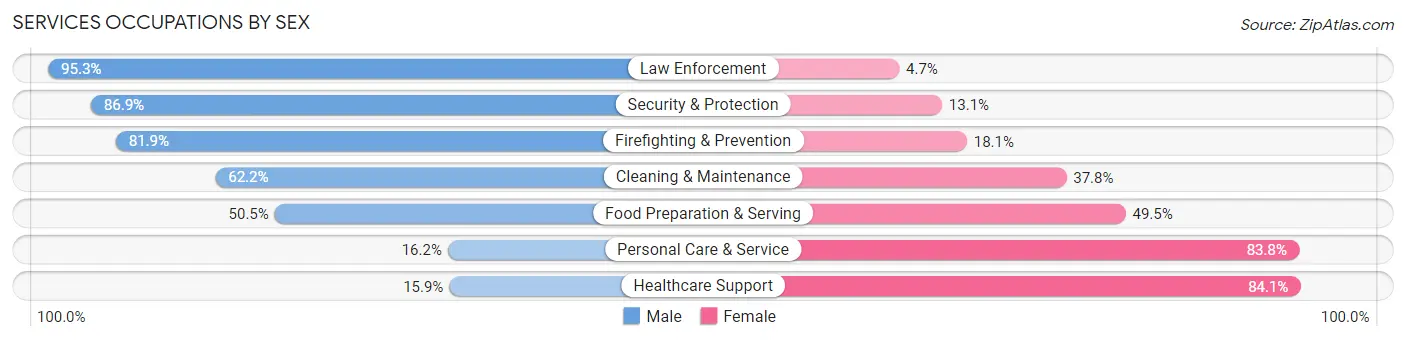
Services Occupations by Sex
Within the Services occupations in Yavapai County, the most male-oriented occupations are Law Enforcement (95.3%), Security & Protection (86.9%), and Firefighting & Prevention (81.9%), while the most female-oriented occupations are Healthcare Support (84.1%), Personal Care & Service (83.8%), and Food Preparation & Serving (49.5%).
| Occupation | Male | Female |
| Healthcare Support | 717 (15.9%) | 3,786 (84.1%) |
| Security & Protection | 1,619 (86.9%) | 245 (13.1%) |
| Firefighting & Prevention | 966 (81.9%) | 213 (18.1%) |
| Law Enforcement | 653 (95.3%) | 32 (4.7%) |
| Food Preparation & Serving | 2,922 (50.5%) | 2,865 (49.5%) |
| Cleaning & Maintenance | 3,061 (62.2%) | 1,858 (37.8%) |
| Personal Care & Service | 444 (16.2%) | 2,295 (83.8%) |
| Total (Category) | 8,763 (44.2%) | 11,049 (55.8%) |
| Total (Overall) | 48,982 (51.6%) | 45,972 (48.4%) |
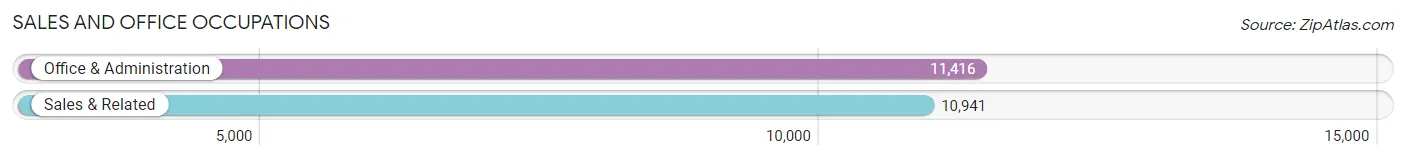
Sales and Office Occupations
The most common Sales and Office occupations in Yavapai County are Office & Administration (11,416 | 12.0%), and Sales & Related (10,941 | 11.5%).
Sales and Office Occupations by Sex
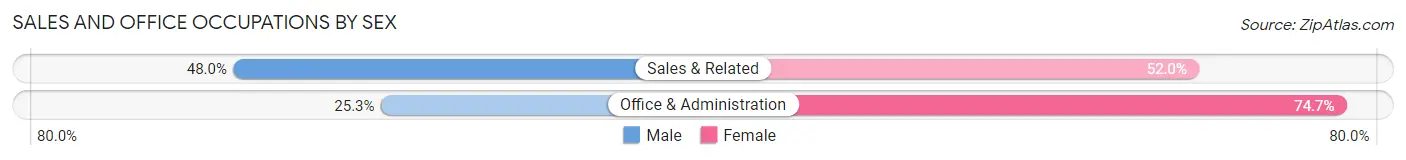
| Occupation | Male | Female |
| Sales & Related | 5,248 (48.0%) | 5,693 (52.0%) |
| Office & Administration | 2,885 (25.3%) | 8,531 (74.7%) |
| Total (Category) | 8,133 (36.4%) | 14,224 (63.6%) |
| Total (Overall) | 48,982 (51.6%) | 45,972 (48.4%) |
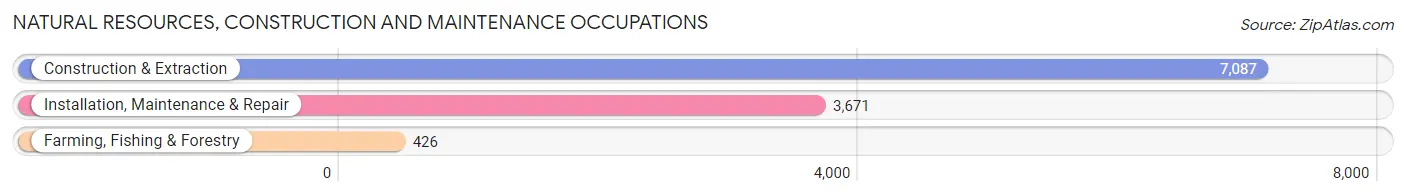
Natural Resources, Construction and Maintenance Occupations
The most common Natural Resources, Construction and Maintenance occupations in Yavapai County are Construction & Extraction (7,087 | 7.5%), Installation, Maintenance & Repair (3,671 | 3.9%), and Farming, Fishing & Forestry (426 | 0.4%).
Natural Resources, Construction and Maintenance Occupations by Sex
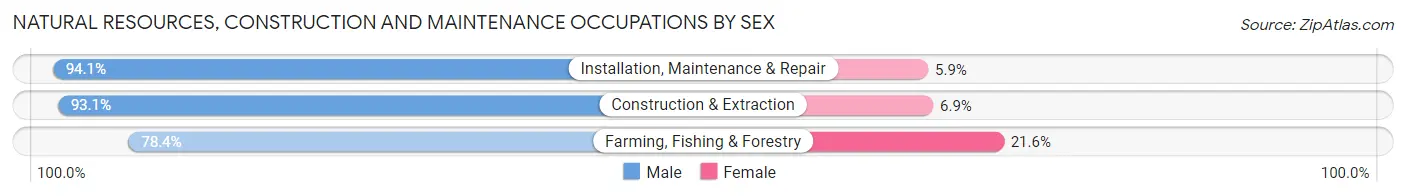
| Occupation | Male | Female |
| Farming, Fishing & Forestry | 334 (78.4%) | 92 (21.6%) |
| Construction & Extraction | 6,598 (93.1%) | 489 (6.9%) |
| Installation, Maintenance & Repair | 3,456 (94.1%) | 215 (5.9%) |
| Total (Category) | 10,388 (92.9%) | 796 (7.1%) |
| Total (Overall) | 48,982 (51.6%) | 45,972 (48.4%) |
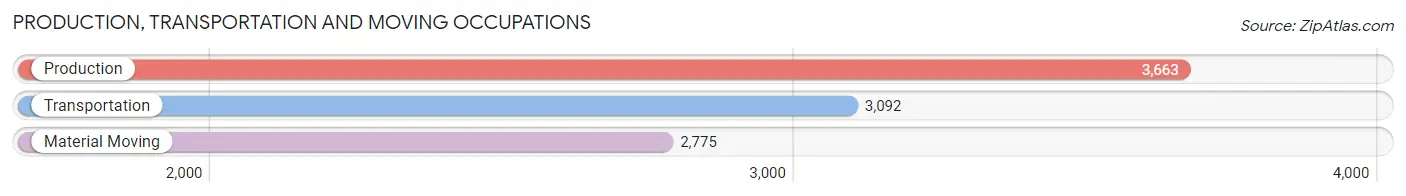
Production, Transportation and Moving Occupations
The most common Production, Transportation and Moving occupations in Yavapai County are Production (3,663 | 3.9%), Transportation (3,092 | 3.3%), and Material Moving (2,775 | 2.9%).
Production, Transportation and Moving Occupations by Sex
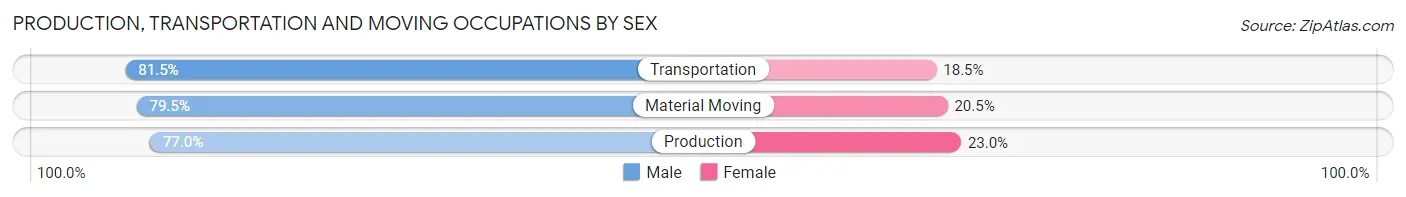
| Occupation | Male | Female |
| Production | 2,820 (77.0%) | 843 (23.0%) |
| Transportation | 2,520 (81.5%) | 572 (18.5%) |
| Material Moving | 2,205 (79.5%) | 570 (20.5%) |
| Total (Category) | 7,545 (79.2%) | 1,985 (20.8%) |
| Total (Overall) | 48,982 (51.6%) | 45,972 (48.4%) |
Employment Industries by Sex in Yavapai County
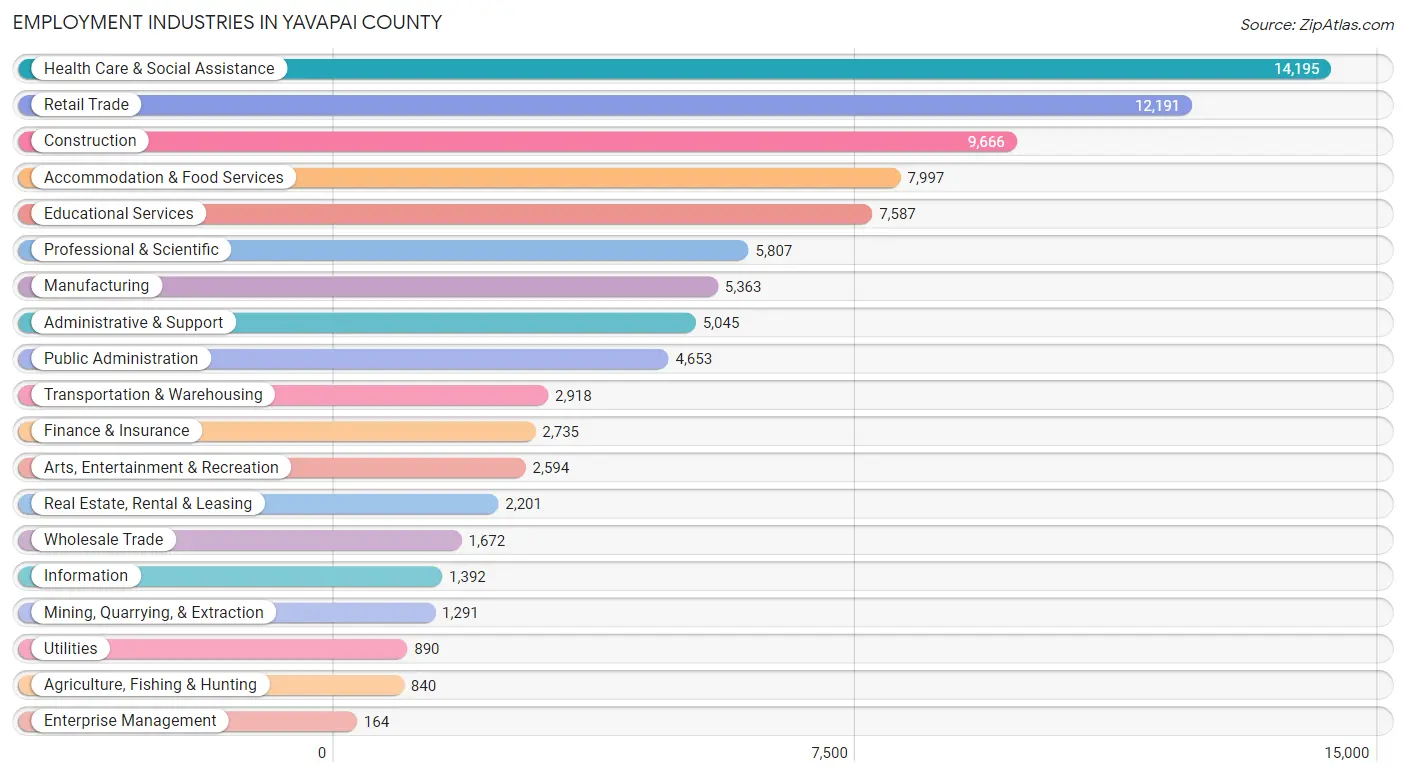
Employment Industries in Yavapai County
The major employment industries in Yavapai County include Health Care & Social Assistance (14,195 | 14.9%), Retail Trade (12,191 | 12.8%), Construction (9,666 | 10.2%), Accommodation & Food Services (7,997 | 8.4%), and Educational Services (7,587 | 8.0%).
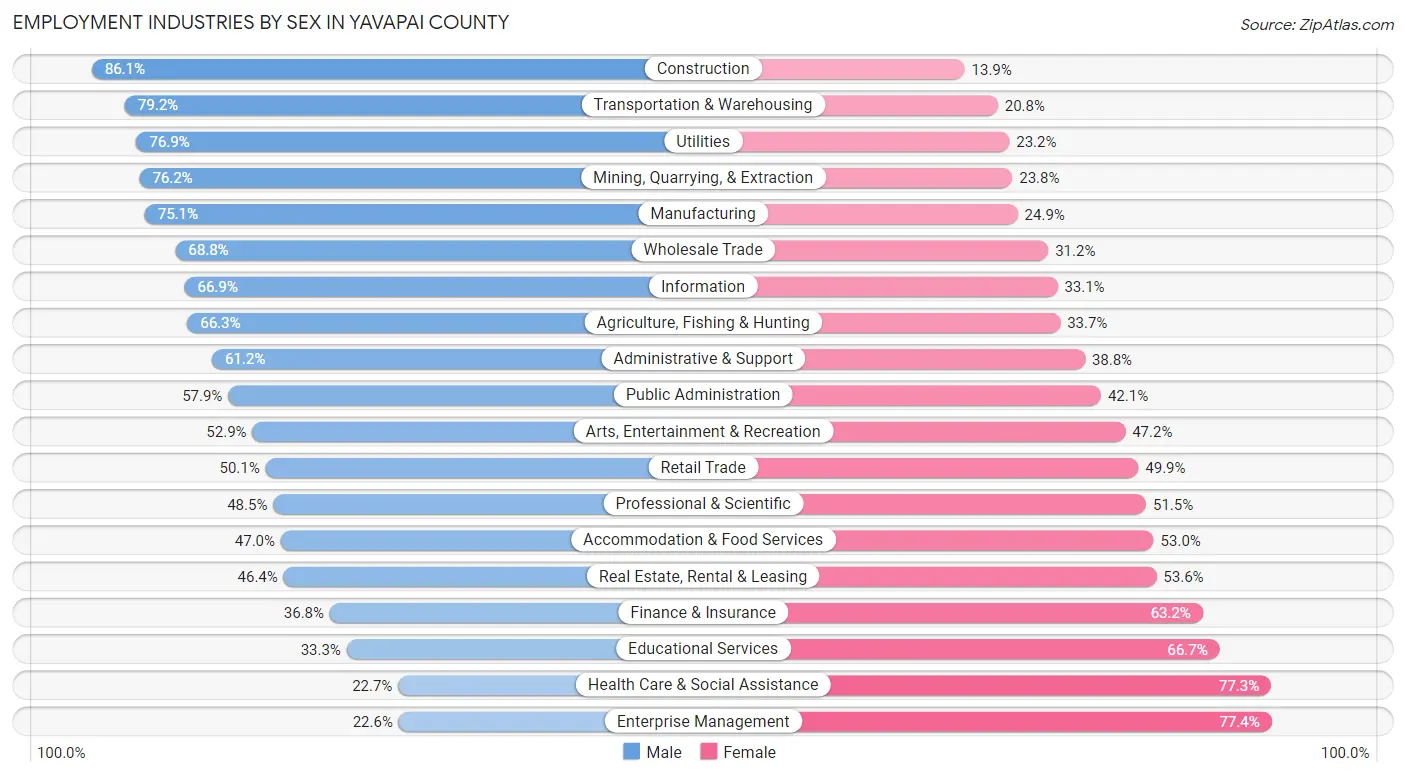
Employment Industries by Sex in Yavapai County
The Yavapai County industries that see more men than women are Construction (86.1%), Transportation & Warehousing (79.2%), and Utilities (76.8%), whereas the industries that tend to have a higher number of women are Enterprise Management (77.4%), Health Care & Social Assistance (77.3%), and Educational Services (66.7%).
| Industry | Male | Female |
| Agriculture, Fishing & Hunting | 557 (66.3%) | 283 (33.7%) |
| Mining, Quarrying, & Extraction | 984 (76.2%) | 307 (23.8%) |
| Construction | 8,321 (86.1%) | 1,345 (13.9%) |
| Manufacturing | 4,028 (75.1%) | 1,335 (24.9%) |
| Wholesale Trade | 1,150 (68.8%) | 522 (31.2%) |
| Retail Trade | 6,111 (50.1%) | 6,080 (49.9%) |
| Transportation & Warehousing | 2,312 (79.2%) | 606 (20.8%) |
| Utilities | 684 (76.8%) | 206 (23.2%) |
| Information | 931 (66.9%) | 461 (33.1%) |
| Finance & Insurance | 1,007 (36.8%) | 1,728 (63.2%) |
| Real Estate, Rental & Leasing | 1,021 (46.4%) | 1,180 (53.6%) |
| Professional & Scientific | 2,819 (48.5%) | 2,988 (51.5%) |
| Enterprise Management | 37 (22.6%) | 127 (77.4%) |
| Administrative & Support | 3,087 (61.2%) | 1,958 (38.8%) |
| Educational Services | 2,529 (33.3%) | 5,058 (66.7%) |
| Health Care & Social Assistance | 3,218 (22.7%) | 10,977 (77.3%) |
| Arts, Entertainment & Recreation | 1,371 (52.8%) | 1,223 (47.1%) |
| Accommodation & Food Services | 3,755 (47.0%) | 4,242 (53.0%) |
| Public Administration | 2,692 (57.9%) | 1,961 (42.1%) |
| Total | 48,982 (51.6%) | 45,972 (48.4%) |
Education in Yavapai County
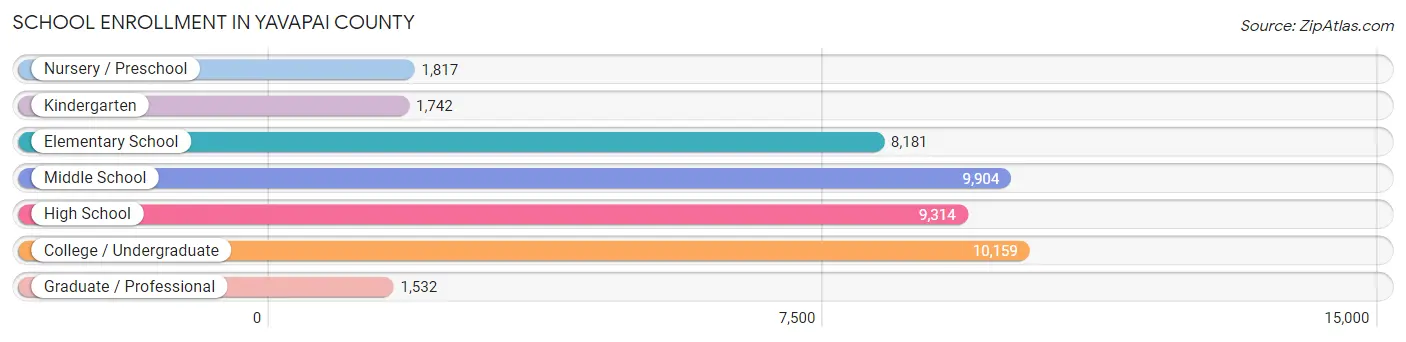
School Enrollment in Yavapai County
The most common levels of schooling among the 42,649 students in Yavapai County are college / undergraduate (10,159 | 23.8%), middle school (9,904 | 23.2%), and high school (9,314 | 21.8%).
| School Level | # Students | % Students |
| Nursery / Preschool | 1,817 | 4.3% |
| Kindergarten | 1,742 | 4.1% |
| Elementary School | 8,181 | 19.2% |
| Middle School | 9,904 | 23.2% |
| High School | 9,314 | 21.8% |
| College / Undergraduate | 10,159 | 23.8% |
| Graduate / Professional | 1,532 | 3.6% |
| Total | 42,649 | 100.0% |
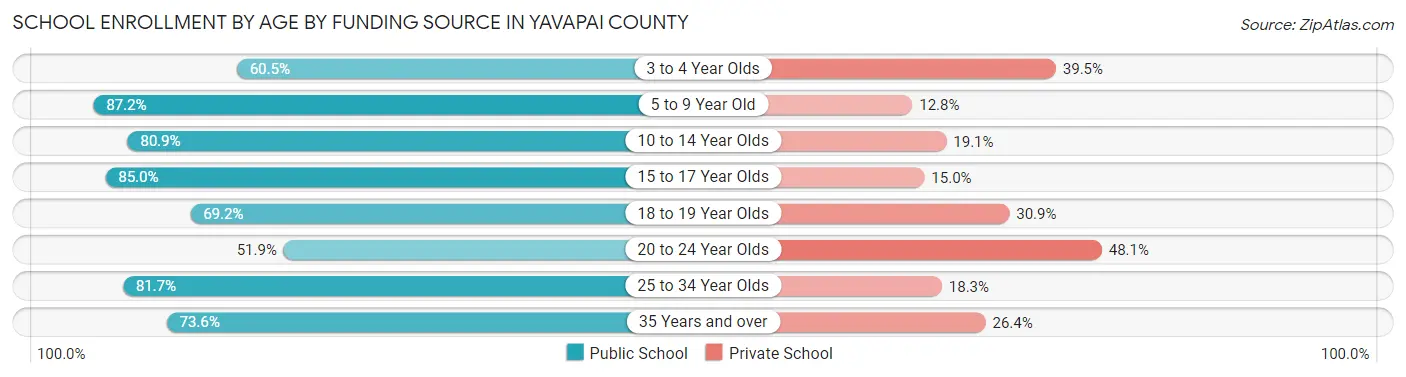
School Enrollment by Age by Funding Source in Yavapai County
Out of a total of 42,649 students who are enrolled in schools in Yavapai County, 9,596 (22.5%) attend a private institution, while the remaining 33,053 (77.5%) are enrolled in public schools. The age group of 20 to 24 year olds has the highest likelihood of being enrolled in private schools, with 2,133 (48.1% in the age bracket) enrolled. Conversely, the age group of 5 to 9 year old has the lowest likelihood of being enrolled in a private school, with 7,791 (87.2% in the age bracket) attending a public institution.
| Age Bracket | Public School | Private School |
| 3 to 4 Year Olds | 1,004 (60.5%) | 656 (39.5%) |
| 5 to 9 Year Old | 7,791 (87.2%) | 1,143 (12.8%) |
| 10 to 14 Year Olds | 9,353 (80.9%) | 2,213 (19.1%) |
| 15 to 17 Year Olds | 5,622 (85.0%) | 995 (15.0%) |
| 18 to 19 Year Olds | 2,484 (69.2%) | 1,108 (30.8%) |
| 20 to 24 Year Olds | 2,303 (51.9%) | 2,133 (48.1%) |
| 25 to 34 Year Olds | 1,823 (81.7%) | 408 (18.3%) |
| 35 Years and over | 2,658 (73.6%) | 955 (26.4%) |
| Total | 33,053 (77.5%) | 9,596 (22.5%) |
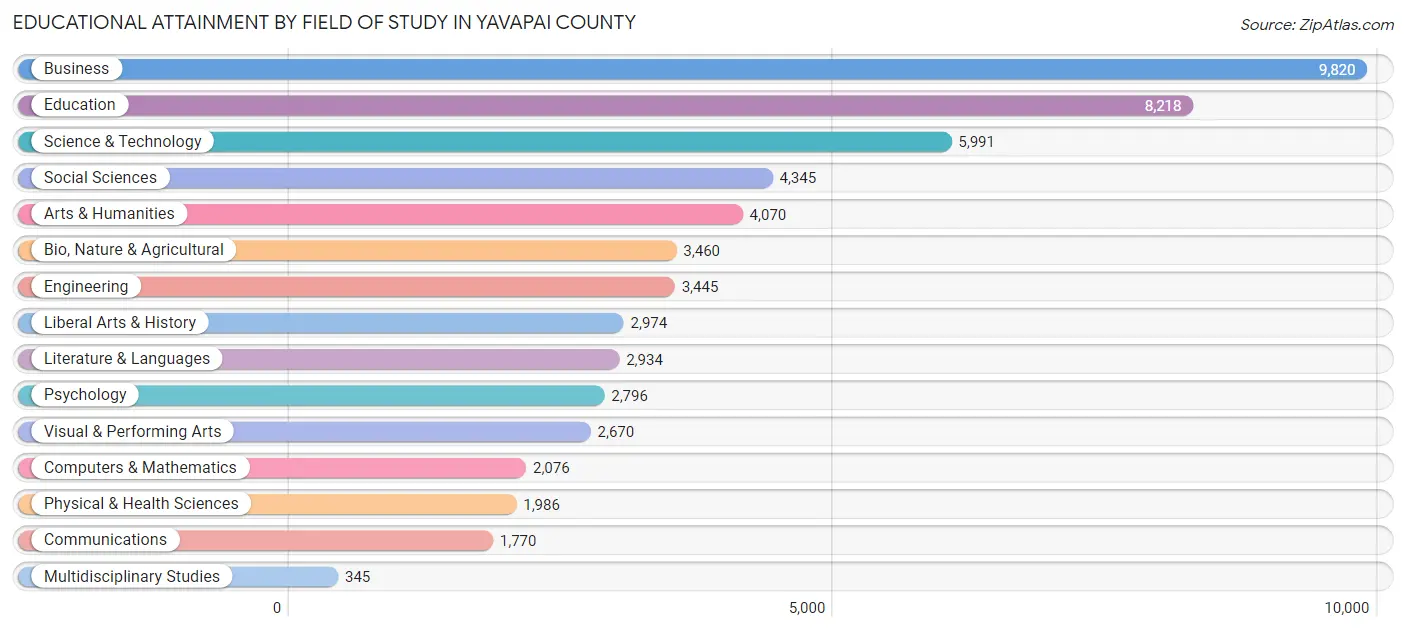
Educational Attainment by Field of Study in Yavapai County
Business (9,820 | 17.3%), education (8,218 | 14.4%), science & technology (5,991 | 10.5%), social sciences (4,345 | 7.6%), and arts & humanities (4,070 | 7.1%) are the most common fields of study among 56,900 individuals in Yavapai County who have obtained a bachelor's degree or higher.
| Field of Study | # Graduates | % Graduates |
| Computers & Mathematics | 2,076 | 3.6% |
| Bio, Nature & Agricultural | 3,460 | 6.1% |
| Physical & Health Sciences | 1,986 | 3.5% |
| Psychology | 2,796 | 4.9% |
| Social Sciences | 4,345 | 7.6% |
| Engineering | 3,445 | 6.0% |
| Multidisciplinary Studies | 345 | 0.6% |
| Science & Technology | 5,991 | 10.5% |
| Business | 9,820 | 17.3% |
| Education | 8,218 | 14.4% |
| Literature & Languages | 2,934 | 5.2% |
| Liberal Arts & History | 2,974 | 5.2% |
| Visual & Performing Arts | 2,670 | 4.7% |
| Communications | 1,770 | 3.1% |
| Arts & Humanities | 4,070 | 7.1% |
| Total | 56,900 | 100.0% |
Transportation & Commute in Yavapai County
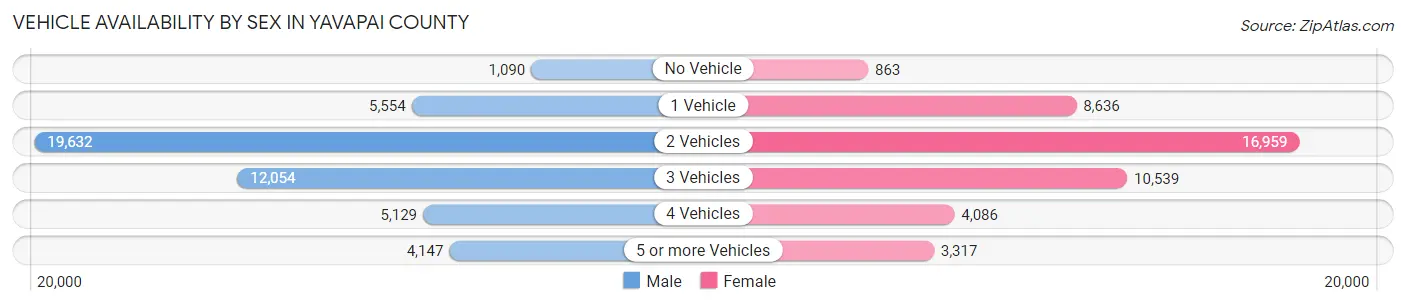
Vehicle Availability by Sex in Yavapai County
The most prevalent vehicle ownership categories in Yavapai County are males with 2 vehicles (19,632, accounting for 41.2%) and females with 2 vehicles (16,959, making up 44.2%).
| Vehicles Available | Male | Female |
| No Vehicle | 1,090 (2.3%) | 863 (1.9%) |
| 1 Vehicle | 5,554 (11.7%) | 8,636 (19.5%) |
| 2 Vehicles | 19,632 (41.2%) | 16,959 (38.2%) |
| 3 Vehicles | 12,054 (25.3%) | 10,539 (23.7%) |
| 4 Vehicles | 5,129 (10.8%) | 4,086 (9.2%) |
| 5 or more Vehicles | 4,147 (8.7%) | 3,317 (7.5%) |
| Total | 47,606 (100.0%) | 44,400 (100.0%) |
Commute Time in Yavapai County
The most frequently occuring commute durations in Yavapai County are 10 to 14 minutes (13,051 commuters, 15.8%), 5 to 9 minutes (12,183 commuters, 14.7%), and 15 to 19 minutes (11,705 commuters, 14.2%).
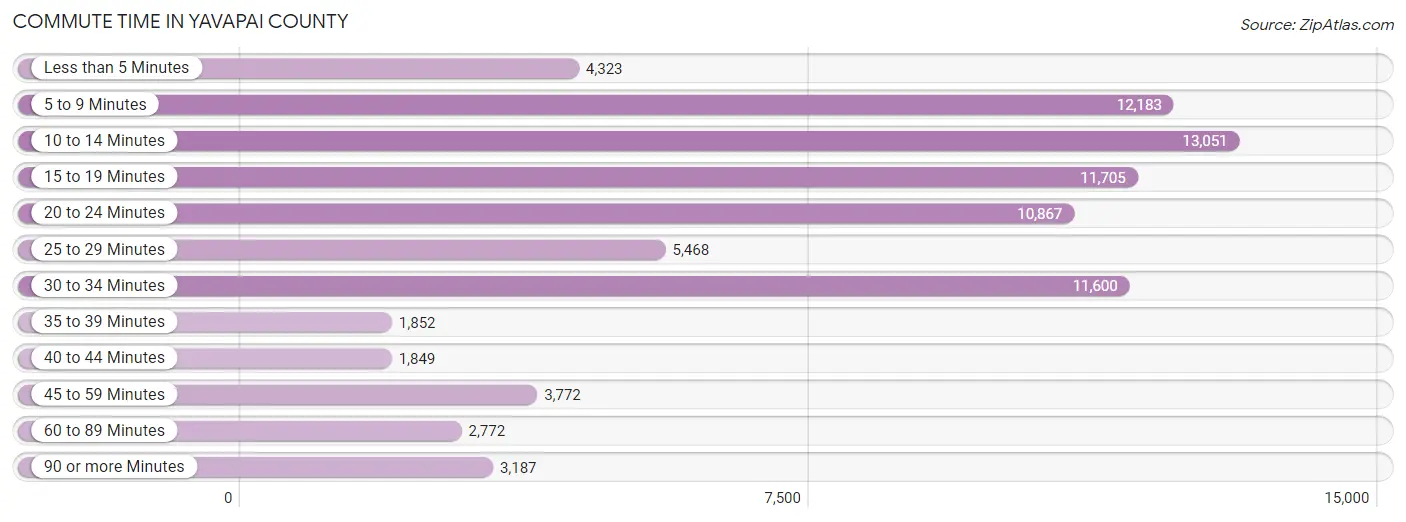
| Commute Time | # Commuters | % Commuters |
| Less than 5 Minutes | 4,323 | 5.2% |
| 5 to 9 Minutes | 12,183 | 14.7% |
| 10 to 14 Minutes | 13,051 | 15.8% |
| 15 to 19 Minutes | 11,705 | 14.2% |
| 20 to 24 Minutes | 10,867 | 13.2% |
| 25 to 29 Minutes | 5,468 | 6.6% |
| 30 to 34 Minutes | 11,600 | 14.0% |
| 35 to 39 Minutes | 1,852 | 2.2% |
| 40 to 44 Minutes | 1,849 | 2.2% |
| 45 to 59 Minutes | 3,772 | 4.6% |
| 60 to 89 Minutes | 2,772 | 3.4% |
| 90 or more Minutes | 3,187 | 3.9% |
Commute Time by Sex in Yavapai County
The most common commute times in Yavapai County are 10 to 14 minutes (6,809 commuters, 15.8%) for males and 10 to 14 minutes (6,242 commuters, 15.8%) for females.
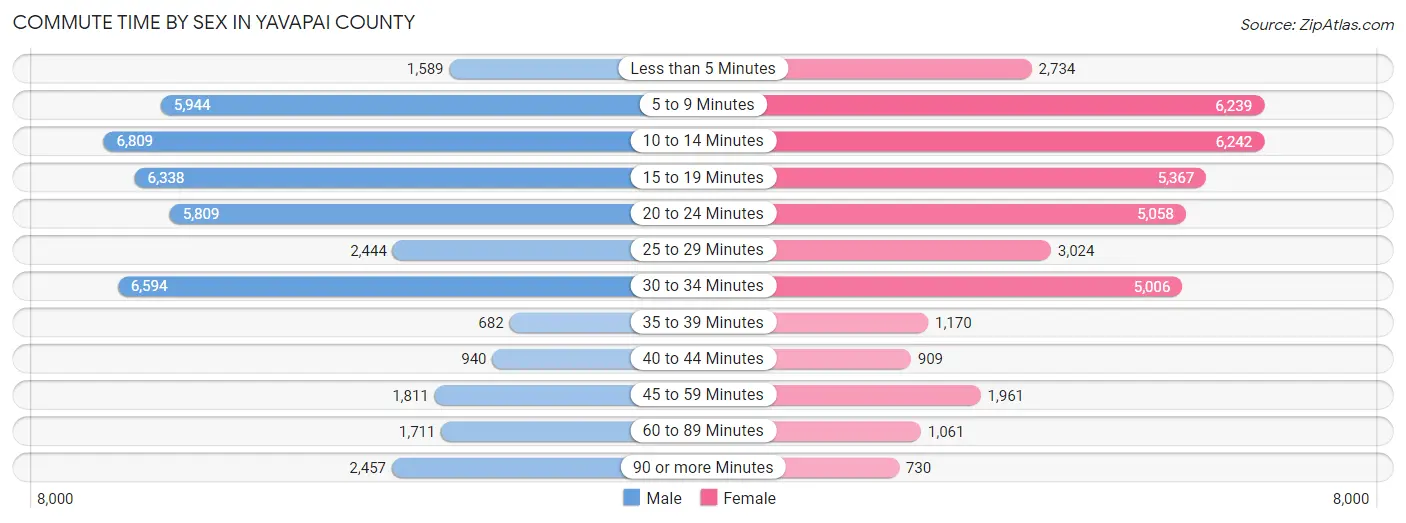
| Commute Time | Male | Female |
| Less than 5 Minutes | 1,589 (3.7%) | 2,734 (6.9%) |
| 5 to 9 Minutes | 5,944 (13.8%) | 6,239 (15.8%) |
| 10 to 14 Minutes | 6,809 (15.8%) | 6,242 (15.8%) |
| 15 to 19 Minutes | 6,338 (14.7%) | 5,367 (13.6%) |
| 20 to 24 Minutes | 5,809 (13.5%) | 5,058 (12.8%) |
| 25 to 29 Minutes | 2,444 (5.7%) | 3,024 (7.7%) |
| 30 to 34 Minutes | 6,594 (15.3%) | 5,006 (12.7%) |
| 35 to 39 Minutes | 682 (1.6%) | 1,170 (3.0%) |
| 40 to 44 Minutes | 940 (2.2%) | 909 (2.3%) |
| 45 to 59 Minutes | 1,811 (4.2%) | 1,961 (5.0%) |
| 60 to 89 Minutes | 1,711 (4.0%) | 1,061 (2.7%) |
| 90 or more Minutes | 2,457 (5.7%) | 730 (1.8%) |
Time of Departure to Work by Sex in Yavapai County
The most frequent times of departure to work in Yavapai County are 7:00 AM to 7:29 AM (6,222, 14.4%) for males and 7:30 AM to 7:59 AM (6,254, 15.8%) for females.
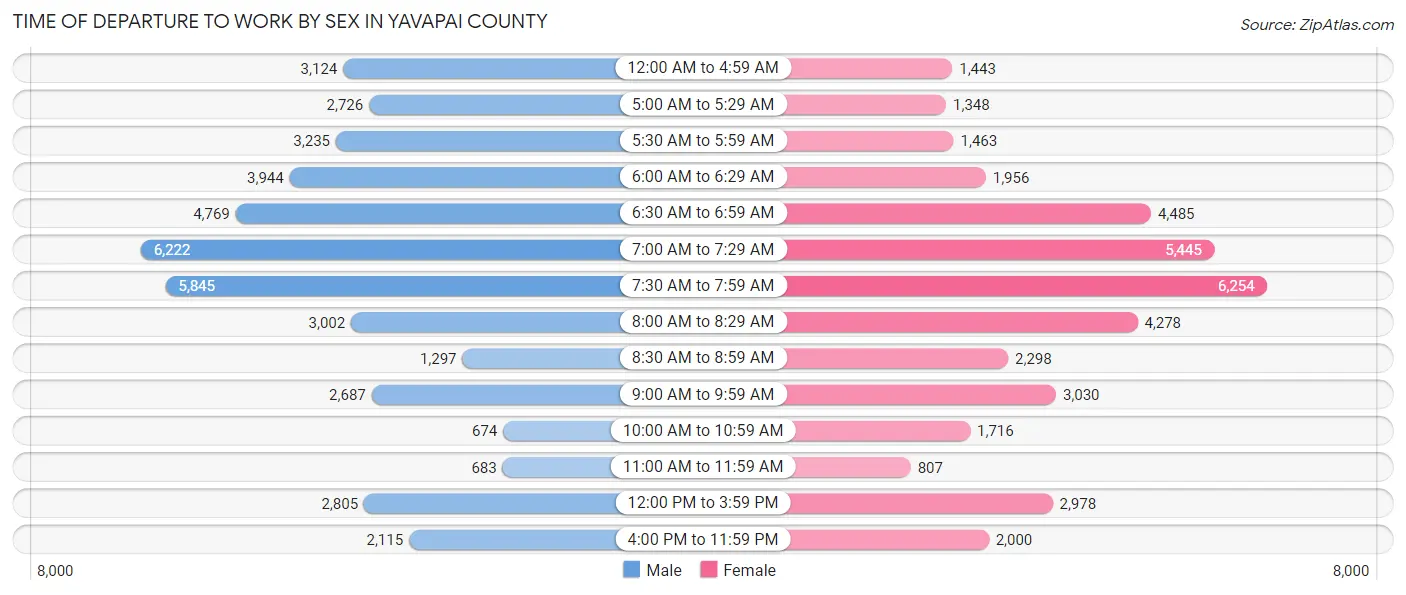
| Time of Departure | Male | Female |
| 12:00 AM to 4:59 AM | 3,124 (7.2%) | 1,443 (3.6%) |
| 5:00 AM to 5:29 AM | 2,726 (6.3%) | 1,348 (3.4%) |
| 5:30 AM to 5:59 AM | 3,235 (7.5%) | 1,463 (3.7%) |
| 6:00 AM to 6:29 AM | 3,944 (9.1%) | 1,956 (5.0%) |
| 6:30 AM to 6:59 AM | 4,769 (11.1%) | 4,485 (11.4%) |
| 7:00 AM to 7:29 AM | 6,222 (14.4%) | 5,445 (13.8%) |
| 7:30 AM to 7:59 AM | 5,845 (13.6%) | 6,254 (15.8%) |
| 8:00 AM to 8:29 AM | 3,002 (7.0%) | 4,278 (10.8%) |
| 8:30 AM to 8:59 AM | 1,297 (3.0%) | 2,298 (5.8%) |
| 9:00 AM to 9:59 AM | 2,687 (6.2%) | 3,030 (7.7%) |
| 10:00 AM to 10:59 AM | 674 (1.6%) | 1,716 (4.3%) |
| 11:00 AM to 11:59 AM | 683 (1.6%) | 807 (2.0%) |
| 12:00 PM to 3:59 PM | 2,805 (6.5%) | 2,978 (7.5%) |
| 4:00 PM to 11:59 PM | 2,115 (4.9%) | 2,000 (5.1%) |
| Total | 43,128 (100.0%) | 39,501 (100.0%) |
Housing Occupancy in Yavapai County
Occupancy by Ownership in Yavapai County
Of the total 106,542 dwellings in Yavapai County, owner-occupied units account for 77,893 (73.1%), while renter-occupied units make up 28,649 (26.9%).
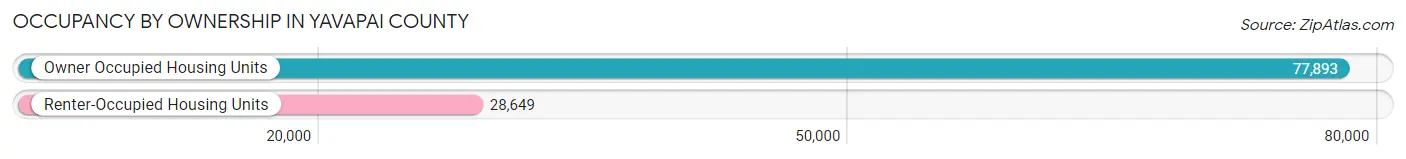
| Occupancy | # Housing Units | % Housing Units |
| Owner Occupied Housing Units | 77,893 | 73.1% |
| Renter-Occupied Housing Units | 28,649 | 26.9% |
| Total Occupied Housing Units | 106,542 | 100.0% |
Occupancy by Household Size in Yavapai County
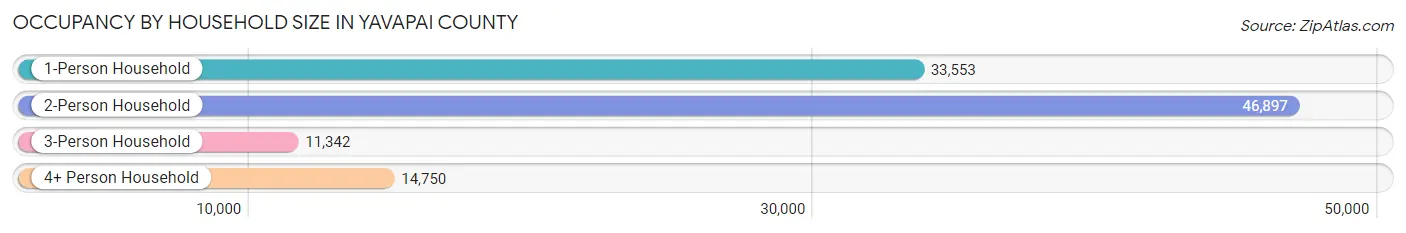
| Household Size | # Housing Units | % Housing Units |
| 1-Person Household | 33,553 | 31.5% |
| 2-Person Household | 46,897 | 44.0% |
| 3-Person Household | 11,342 | 10.6% |
| 4+ Person Household | 14,750 | 13.8% |
| Total Housing Units | 106,542 | 100.0% |
Occupancy by Ownership by Household Size in Yavapai County
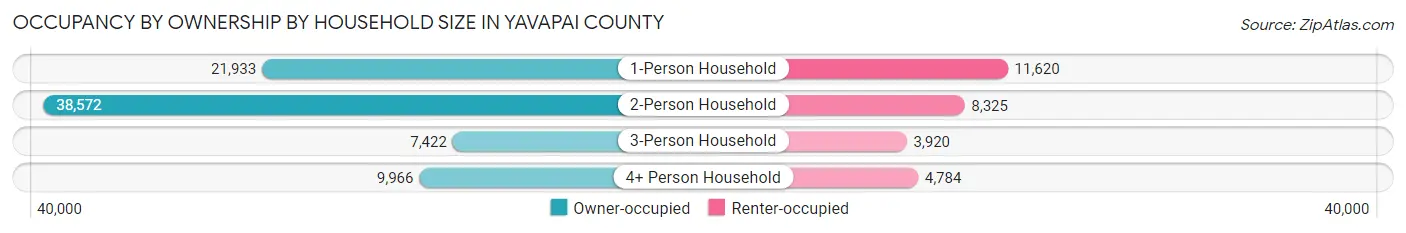
| Household Size | Owner-occupied | Renter-occupied |
| 1-Person Household | 21,933 (65.4%) | 11,620 (34.6%) |
| 2-Person Household | 38,572 (82.3%) | 8,325 (17.7%) |
| 3-Person Household | 7,422 (65.4%) | 3,920 (34.6%) |
| 4+ Person Household | 9,966 (67.6%) | 4,784 (32.4%) |
| Total Housing Units | 77,893 (73.1%) | 28,649 (26.9%) |
Occupancy by Educational Attainment in Yavapai County
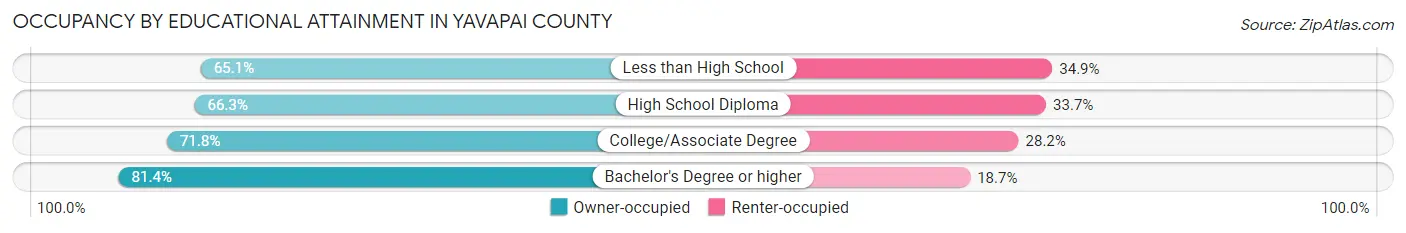
| Household Size | Owner-occupied | Renter-occupied |
| Less than High School | 4,602 (65.1%) | 2,470 (34.9%) |
| High School Diploma | 15,170 (66.3%) | 7,711 (33.7%) |
| College/Associate Degree | 31,315 (71.8%) | 12,323 (28.2%) |
| Bachelor's Degree or higher | 26,806 (81.4%) | 6,145 (18.6%) |
Occupancy by Age of Householder in Yavapai County
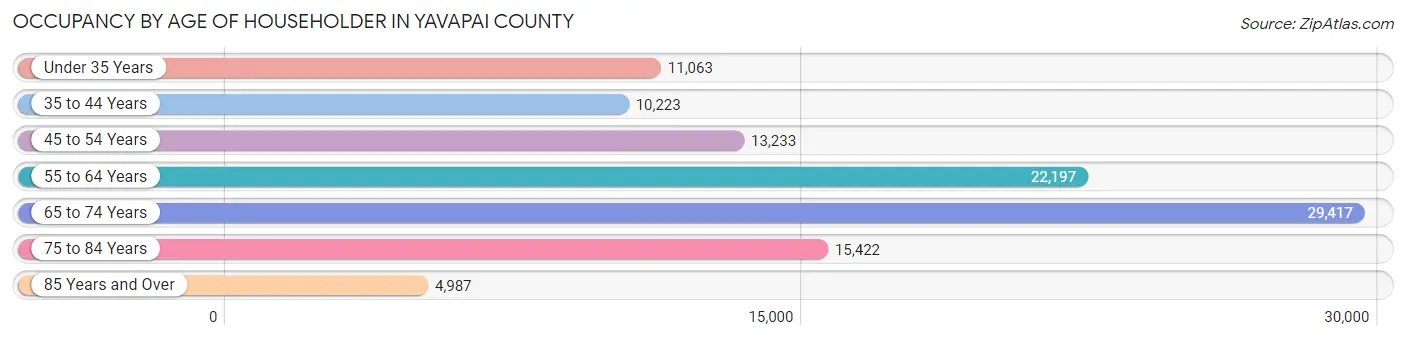
| Age Bracket | # Households | % Households |
| Under 35 Years | 11,063 | 10.4% |
| 35 to 44 Years | 10,223 | 9.6% |
| 45 to 54 Years | 13,233 | 12.4% |
| 55 to 64 Years | 22,197 | 20.8% |
| 65 to 74 Years | 29,417 | 27.6% |
| 75 to 84 Years | 15,422 | 14.5% |
| 85 Years and Over | 4,987 | 4.7% |
| Total | 106,542 | 100.0% |
Housing Finances in Yavapai County
Median Income by Occupancy in Yavapai County
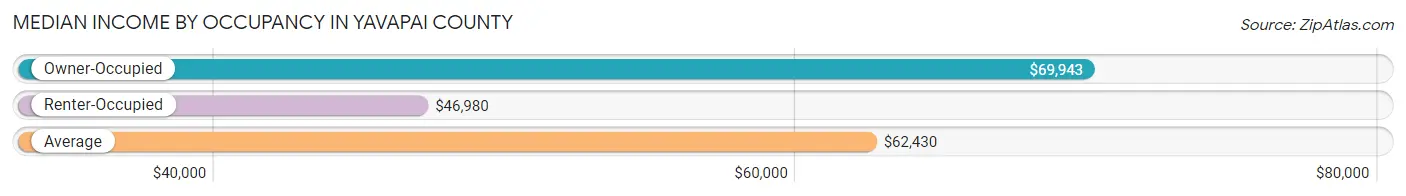
| Occupancy Type | # Households | Median Income |
| Owner-Occupied | 77,893 (73.1%) | $69,943 |
| Renter-Occupied | 28,649 (26.9%) | $46,980 |
| Average | 106,542 (100.0%) | $62,430 |
Occupancy by Householder Income Bracket in Yavapai County
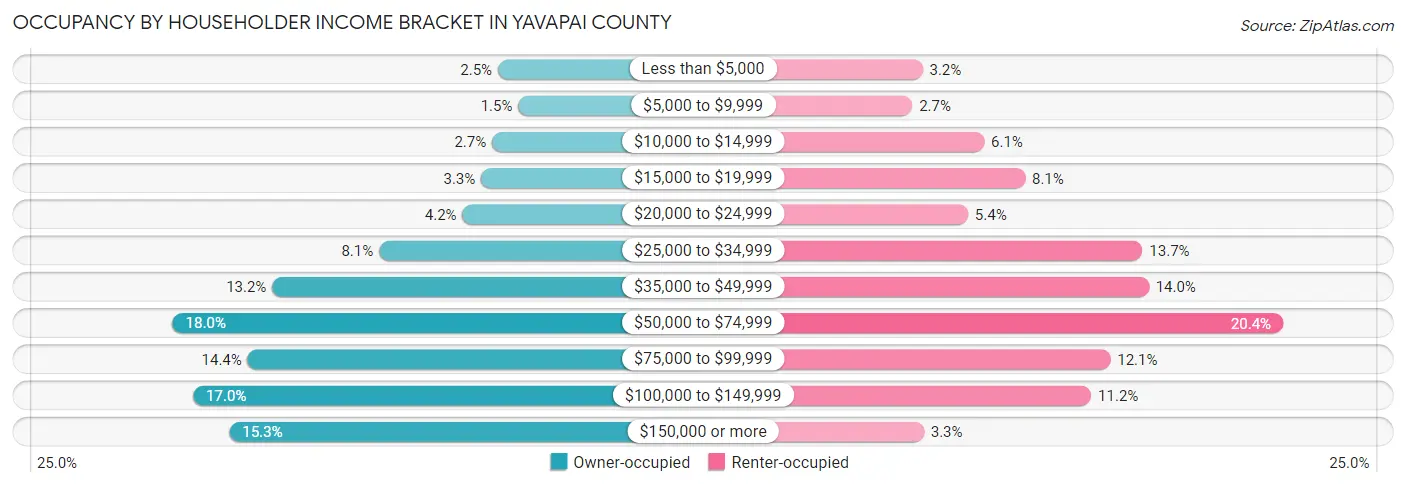
| Income Bracket | Owner-occupied | Renter-occupied |
| Less than $5,000 | 1,920 (2.5%) | 913 (3.2%) |
| $5,000 to $9,999 | 1,163 (1.5%) | 774 (2.7%) |
| $10,000 to $14,999 | 2,132 (2.7%) | 1,752 (6.1%) |
| $15,000 to $19,999 | 2,541 (3.3%) | 2,313 (8.1%) |
| $20,000 to $24,999 | 3,234 (4.2%) | 1,533 (5.3%) |
| $25,000 to $34,999 | 6,325 (8.1%) | 3,913 (13.7%) |
| $35,000 to $49,999 | 10,287 (13.2%) | 4,000 (14.0%) |
| $50,000 to $74,999 | 13,985 (17.9%) | 5,829 (20.3%) |
| $75,000 to $99,999 | 11,204 (14.4%) | 3,476 (12.1%) |
| $100,000 to $149,999 | 13,224 (17.0%) | 3,215 (11.2%) |
| $150,000 or more | 11,878 (15.2%) | 931 (3.3%) |
| Total | 77,893 (100.0%) | 28,649 (100.0%) |
Monthly Housing Cost Tiers in Yavapai County
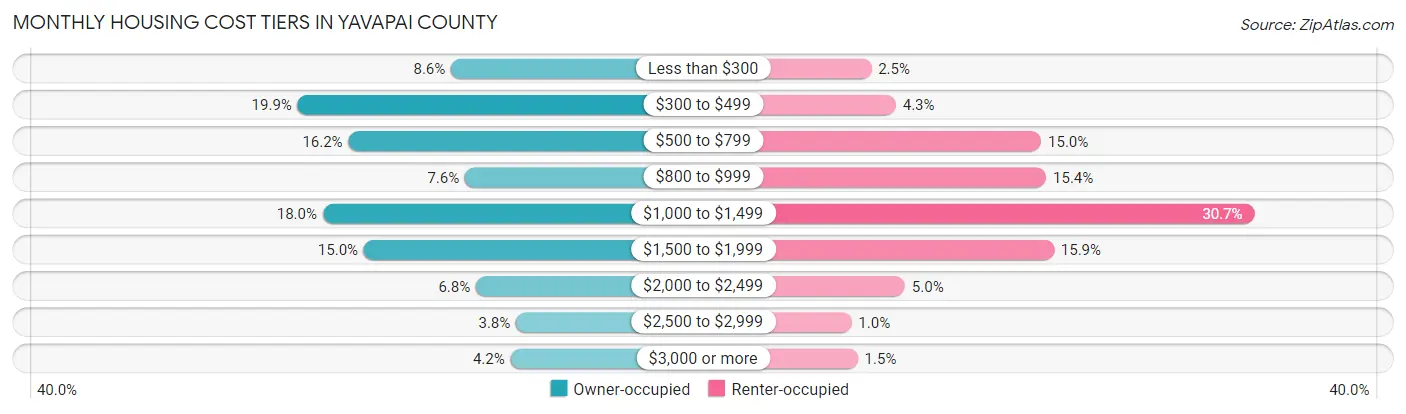
| Monthly Cost | Owner-occupied | Renter-occupied |
| Less than $300 | 6,688 (8.6%) | 714 (2.5%) |
| $300 to $499 | 15,493 (19.9%) | 1,231 (4.3%) |
| $500 to $799 | 12,582 (16.2%) | 4,298 (15.0%) |
| $800 to $999 | 5,885 (7.6%) | 4,403 (15.4%) |
| $1,000 to $1,499 | 14,050 (18.0%) | 8,798 (30.7%) |
| $1,500 to $1,999 | 11,691 (15.0%) | 4,566 (15.9%) |
| $2,000 to $2,499 | 5,261 (6.8%) | 1,424 (5.0%) |
| $2,500 to $2,999 | 2,963 (3.8%) | 296 (1.0%) |
| $3,000 or more | 3,280 (4.2%) | 428 (1.5%) |
| Total | 77,893 (100.0%) | 28,649 (100.0%) |
Physical Housing Characteristics in Yavapai County
Housing Structures in Yavapai County
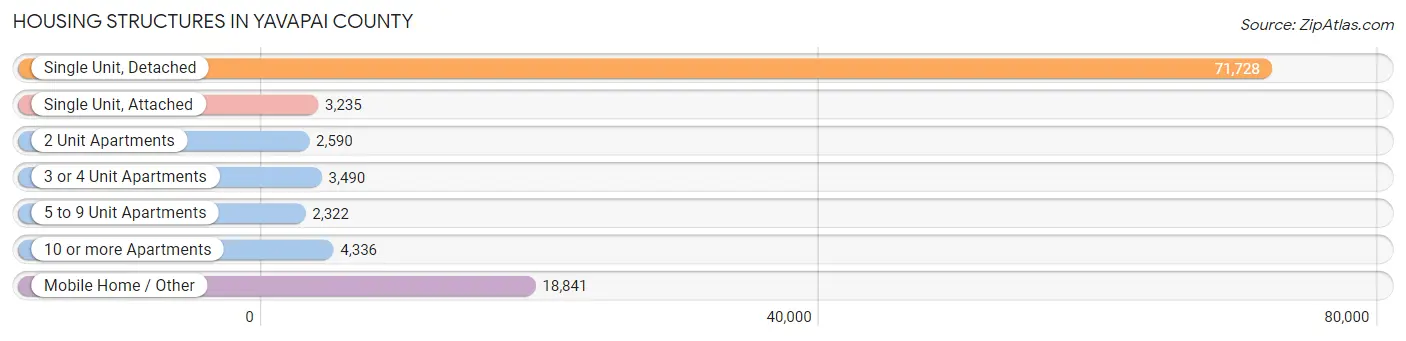
| Structure Type | # Housing Units | % Housing Units |
| Single Unit, Detached | 71,728 | 67.3% |
| Single Unit, Attached | 3,235 | 3.0% |
| 2 Unit Apartments | 2,590 | 2.4% |
| 3 or 4 Unit Apartments | 3,490 | 3.3% |
| 5 to 9 Unit Apartments | 2,322 | 2.2% |
| 10 or more Apartments | 4,336 | 4.1% |
| Mobile Home / Other | 18,841 | 17.7% |
| Total | 106,542 | 100.0% |
Housing Structures by Occupancy in Yavapai County
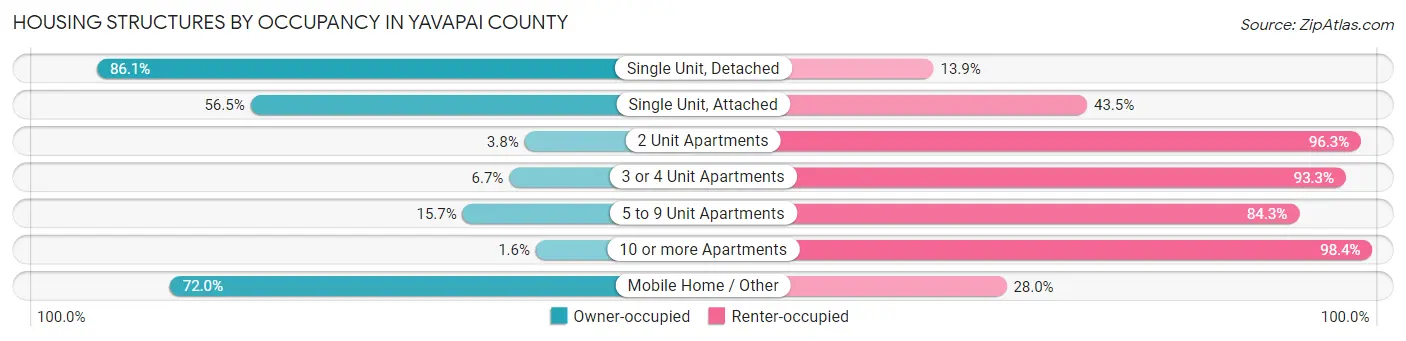
| Structure Type | Owner-occupied | Renter-occupied |
| Single Unit, Detached | 61,730 (86.1%) | 9,998 (13.9%) |
| Single Unit, Attached | 1,828 (56.5%) | 1,407 (43.5%) |
| 2 Unit Apartments | 97 (3.7%) | 2,493 (96.3%) |
| 3 or 4 Unit Apartments | 234 (6.7%) | 3,256 (93.3%) |
| 5 to 9 Unit Apartments | 364 (15.7%) | 1,958 (84.3%) |
| 10 or more Apartments | 68 (1.6%) | 4,268 (98.4%) |
| Mobile Home / Other | 13,572 (72.0%) | 5,269 (28.0%) |
| Total | 77,893 (73.1%) | 28,649 (26.9%) |
Housing Structures by Number of Rooms in Yavapai County
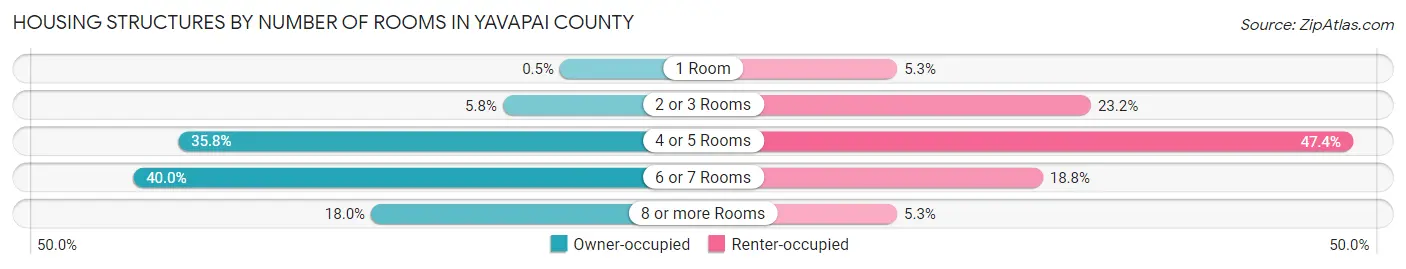
| Number of Rooms | Owner-occupied | Renter-occupied |
| 1 Room | 386 (0.5%) | 1,519 (5.3%) |
| 2 or 3 Rooms | 4,506 (5.8%) | 6,652 (23.2%) |
| 4 or 5 Rooms | 27,887 (35.8%) | 13,588 (47.4%) |
| 6 or 7 Rooms | 31,117 (40.0%) | 5,374 (18.8%) |
| 8 or more Rooms | 13,997 (18.0%) | 1,516 (5.3%) |
| Total | 77,893 (100.0%) | 28,649 (100.0%) |
Housing Structure by Heating Type in Yavapai County
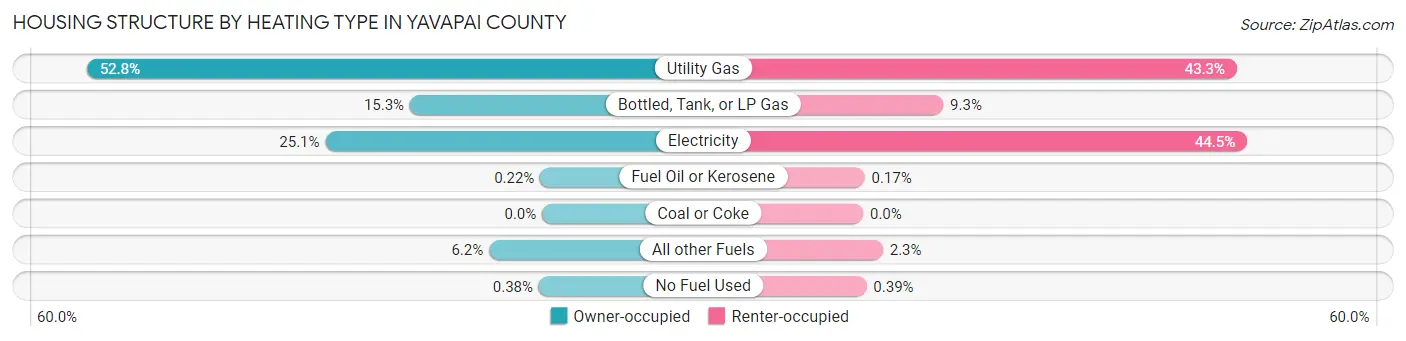
| Heating Type | Owner-occupied | Renter-occupied |
| Utility Gas | 41,121 (52.8%) | 12,417 (43.3%) |
| Bottled, Tank, or LP Gas | 11,937 (15.3%) | 2,662 (9.3%) |
| Electricity | 19,575 (25.1%) | 12,754 (44.5%) |
| Fuel Oil or Kerosene | 174 (0.2%) | 50 (0.2%) |
| Coal or Coke | 0 (0.0%) | 0 (0.0%) |
| All other Fuels | 4,791 (6.1%) | 655 (2.3%) |
| No Fuel Used | 295 (0.4%) | 111 (0.4%) |
| Total | 77,893 (100.0%) | 28,649 (100.0%) |
Household Vehicle Usage in Yavapai County
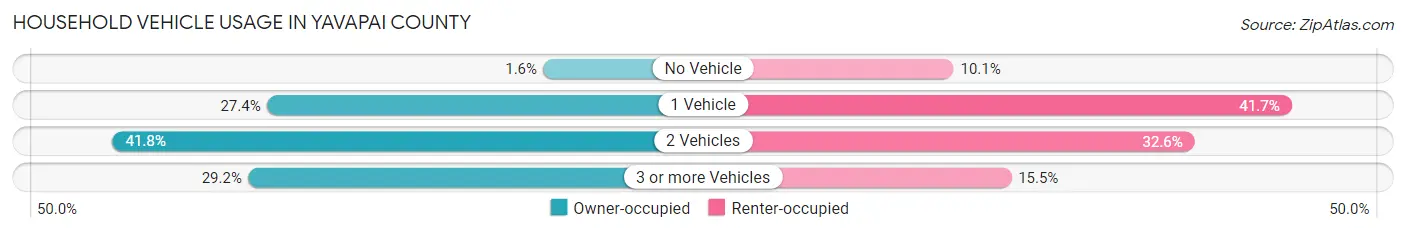
| Vehicles per Household | Owner-occupied | Renter-occupied |
| No Vehicle | 1,258 (1.6%) | 2,905 (10.1%) |
| 1 Vehicle | 21,362 (27.4%) | 11,945 (41.7%) |
| 2 Vehicles | 32,552 (41.8%) | 9,352 (32.6%) |
| 3 or more Vehicles | 22,721 (29.2%) | 4,447 (15.5%) |
| Total | 77,893 (100.0%) | 28,649 (100.0%) |
Real Estate & Mortgages in Yavapai County
Real Estate and Mortgage Overview in Yavapai County
| Characteristic | Without Mortgage | With Mortgage |
| Housing Units | 35,720 | 42,173 |
| Median Property Value | $332,600 | $368,000 |
| Median Household Income | $54,432 | $7,577 |
| Monthly Housing Costs | $450 | $3,154 |
| Real Estate Taxes | $1,665 | $1,447 |
Property Value by Mortgage Status in Yavapai County
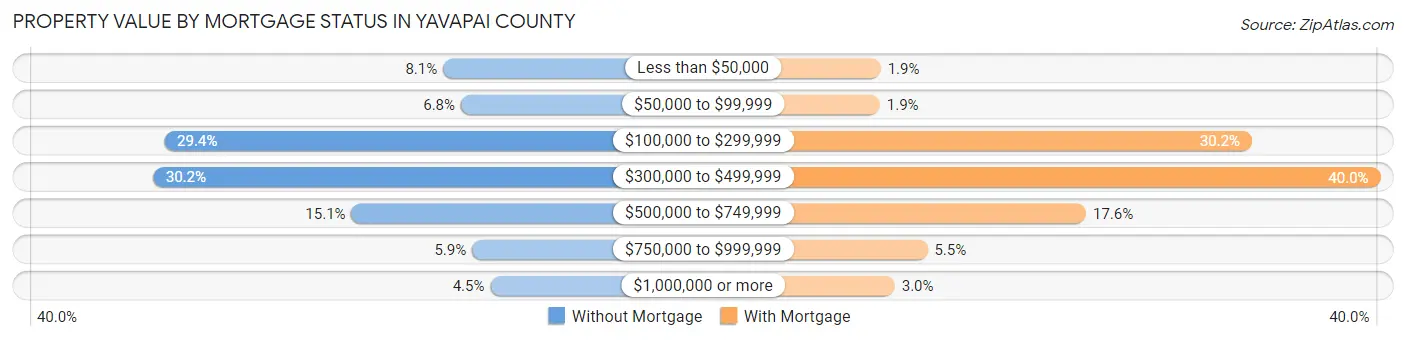
| Property Value | Without Mortgage | With Mortgage |
| Less than $50,000 | 2,900 (8.1%) | 810 (1.9%) |
| $50,000 to $99,999 | 2,414 (6.8%) | 782 (1.8%) |
| $100,000 to $299,999 | 10,490 (29.4%) | 12,736 (30.2%) |
| $300,000 to $499,999 | 10,797 (30.2%) | 16,866 (40.0%) |
| $500,000 to $749,999 | 5,395 (15.1%) | 7,404 (17.6%) |
| $750,000 to $999,999 | 2,111 (5.9%) | 2,312 (5.5%) |
| $1,000,000 or more | 1,613 (4.5%) | 1,263 (3.0%) |
| Total | 35,720 (100.0%) | 42,173 (100.0%) |
Household Income by Mortgage Status in Yavapai County
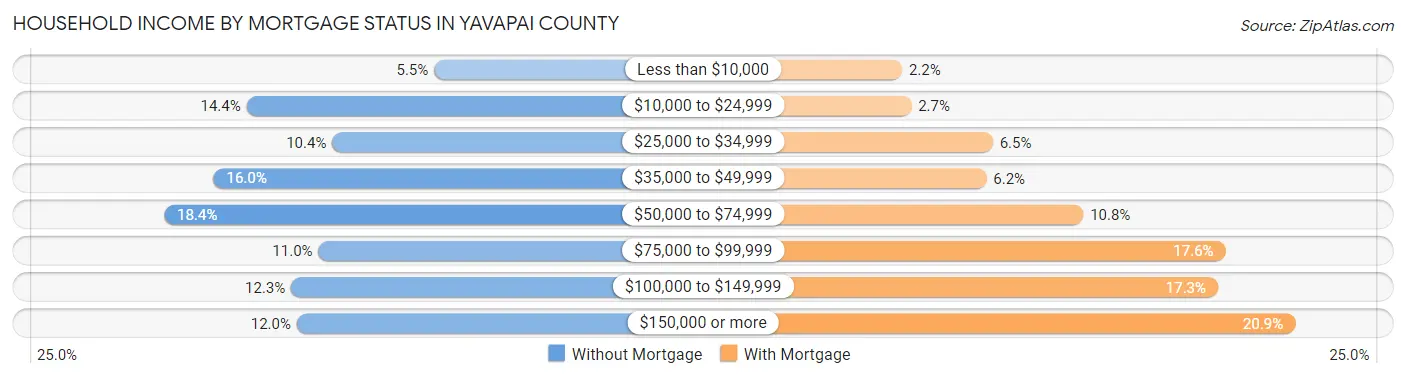
| Household Income | Without Mortgage | With Mortgage |
| Less than $10,000 | 1,964 (5.5%) | 931 (2.2%) |
| $10,000 to $24,999 | 5,155 (14.4%) | 1,119 (2.6%) |
| $25,000 to $34,999 | 3,697 (10.3%) | 2,752 (6.5%) |
| $35,000 to $49,999 | 5,716 (16.0%) | 2,628 (6.2%) |
| $50,000 to $74,999 | 6,559 (18.4%) | 4,571 (10.8%) |
| $75,000 to $99,999 | 3,931 (11.0%) | 7,426 (17.6%) |
| $100,000 to $149,999 | 4,397 (12.3%) | 7,273 (17.2%) |
| $150,000 or more | 4,301 (12.0%) | 8,827 (20.9%) |
| Total | 35,720 (100.0%) | 42,173 (100.0%) |
Property Value to Household Income Ratio in Yavapai County
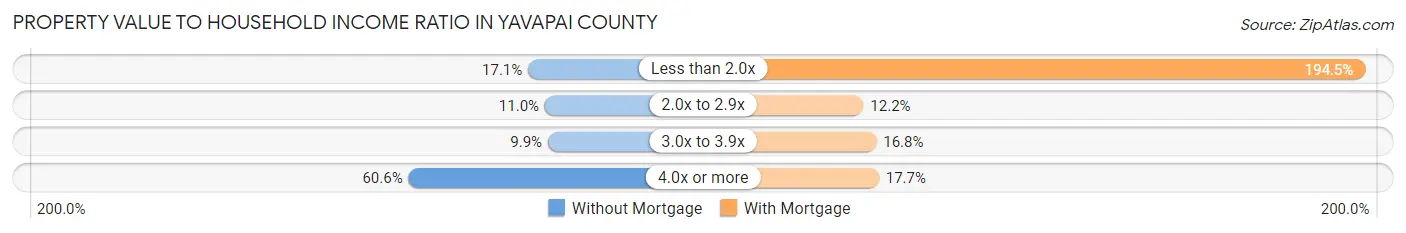
| Value-to-Income Ratio | Without Mortgage | With Mortgage |
| Less than 2.0x | 6,117 (17.1%) | 82,006 (194.4%) |
| 2.0x to 2.9x | 3,931 (11.0%) | 5,130 (12.2%) |
| 3.0x to 3.9x | 3,544 (9.9%) | 7,104 (16.8%) |
| 4.0x or more | 21,635 (60.6%) | 7,480 (17.7%) |
| Total | 35,720 (100.0%) | 42,173 (100.0%) |
Real Estate Taxes by Mortgage Status in Yavapai County
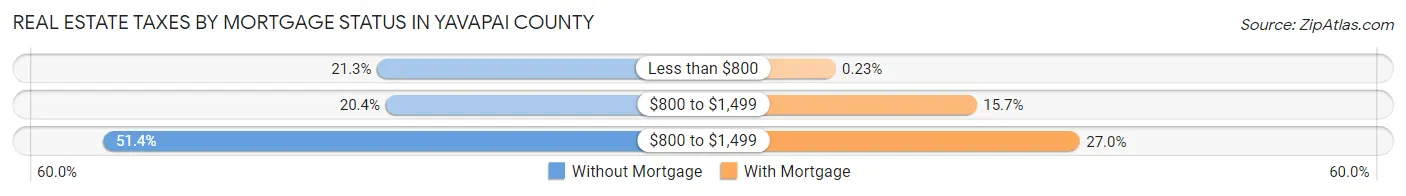
| Property Taxes | Without Mortgage | With Mortgage |
| Less than $800 | 7,623 (21.3%) | 96 (0.2%) |
| $800 to $1,499 | 7,294 (20.4%) | 6,621 (15.7%) |
| $800 to $1,499 | 18,358 (51.4%) | 11,383 (27.0%) |
| Total | 35,720 (100.0%) | 42,173 (100.0%) |
Health & Disability in Yavapai County
Health Insurance Coverage by Age in Yavapai County
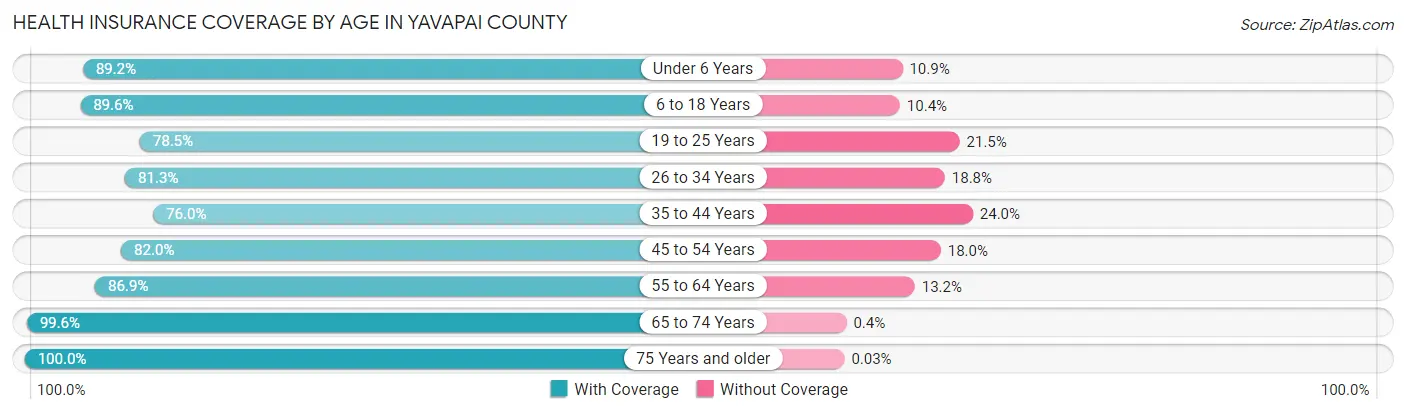
| Age Bracket | With Coverage | Without Coverage |
| Under 6 Years | 9,640 (89.1%) | 1,173 (10.8%) |
| 6 to 18 Years | 26,482 (89.6%) | 3,063 (10.4%) |
| 19 to 25 Years | 11,711 (78.5%) | 3,208 (21.5%) |
| 26 to 34 Years | 15,427 (81.2%) | 3,561 (18.8%) |
| 35 to 44 Years | 16,199 (76.0%) | 5,108 (24.0%) |
| 45 to 54 Years | 19,671 (82.0%) | 4,319 (18.0%) |
| 55 to 64 Years | 34,326 (86.9%) | 5,197 (13.2%) |
| 65 to 74 Years | 46,341 (99.6%) | 187 (0.4%) |
| 75 Years and older | 30,775 (100.0%) | 10 (0.0%) |
| Total | 210,572 (89.1%) | 25,826 (10.9%) |
Health Insurance Coverage by Citizenship Status in Yavapai County
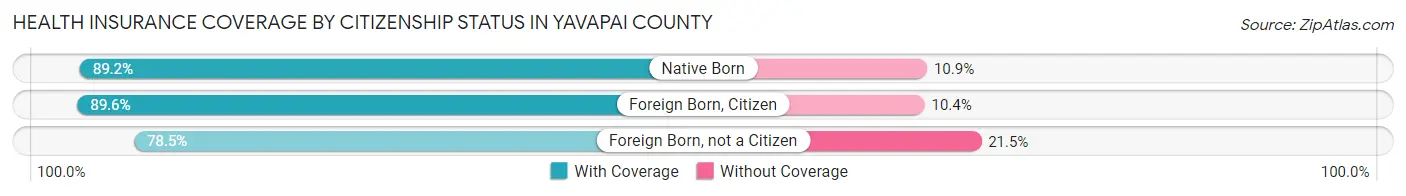
| Citizenship Status | With Coverage | Without Coverage |
| Native Born | 9,640 (89.1%) | 1,173 (10.8%) |
| Foreign Born, Citizen | 26,482 (89.6%) | 3,063 (10.4%) |
| Foreign Born, not a Citizen | 11,711 (78.5%) | 3,208 (21.5%) |
Health Insurance Coverage by Household Income in Yavapai County
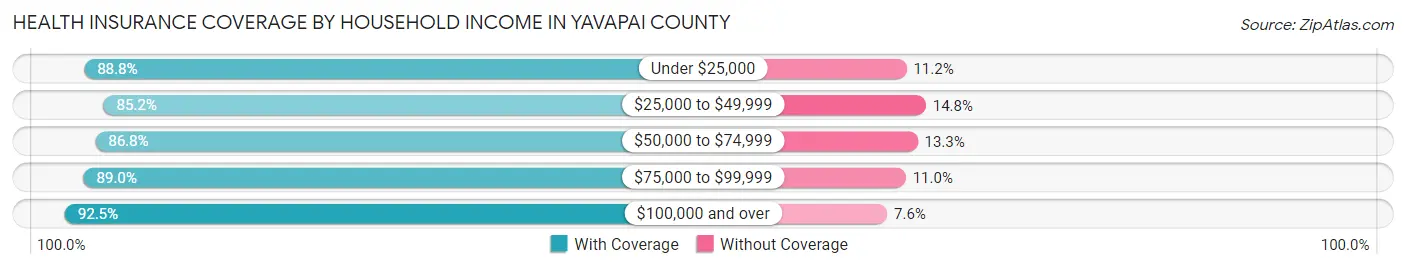
| Household Income | With Coverage | Without Coverage |
| Under $25,000 | 24,429 (88.8%) | 3,075 (11.2%) |
| $25,000 to $49,999 | 39,654 (85.2%) | 6,886 (14.8%) |
| $50,000 to $74,999 | 37,095 (86.8%) | 5,665 (13.3%) |
| $75,000 to $99,999 | 31,886 (89.0%) | 3,958 (11.0%) |
| $100,000 and over | 74,373 (92.4%) | 6,077 (7.5%) |
Public vs Private Health Insurance Coverage by Age in Yavapai County
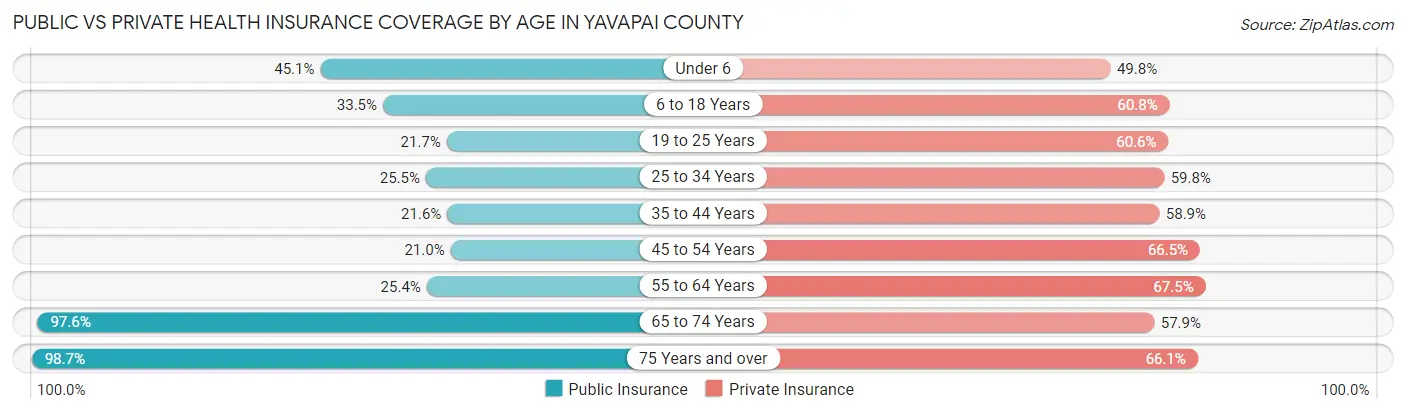
| Age Bracket | Public Insurance | Private Insurance |
| Under 6 | 4,878 (45.1%) | 5,383 (49.8%) |
| 6 to 18 Years | 9,897 (33.5%) | 17,972 (60.8%) |
| 19 to 25 Years | 3,232 (21.7%) | 9,042 (60.6%) |
| 25 to 34 Years | 4,849 (25.5%) | 11,346 (59.8%) |
| 35 to 44 Years | 4,596 (21.6%) | 12,539 (58.9%) |
| 45 to 54 Years | 5,027 (20.9%) | 15,946 (66.5%) |
| 55 to 64 Years | 10,026 (25.4%) | 26,679 (67.5%) |
| 65 to 74 Years | 45,410 (97.6%) | 26,945 (57.9%) |
| 75 Years and over | 30,376 (98.7%) | 20,332 (66.0%) |
| Total | 118,291 (50.0%) | 146,184 (61.8%) |
Disability Status by Sex by Age in Yavapai County
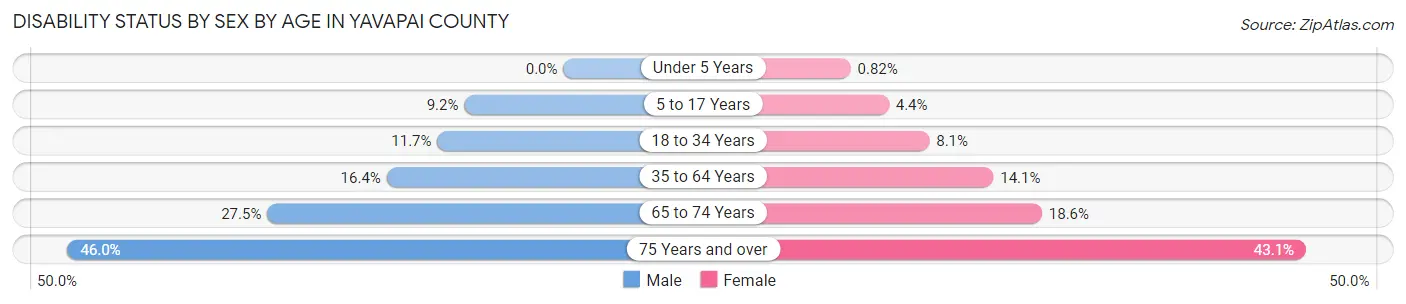
| Age Bracket | Male | Female |
| Under 5 Years | 0 (0.0%) | 35 (0.8%) |
| 5 to 17 Years | 1,339 (9.2%) | 602 (4.4%) |
| 18 to 34 Years | 2,265 (11.7%) | 1,417 (8.1%) |
| 35 to 64 Years | 6,697 (16.4%) | 6,185 (14.1%) |
| 65 to 74 Years | 6,069 (27.5%) | 4,539 (18.6%) |
| 75 Years and over | 6,733 (46.0%) | 6,957 (43.1%) |
Disability Class by Sex by Age in Yavapai County
Disability Class: Hearing Difficulty
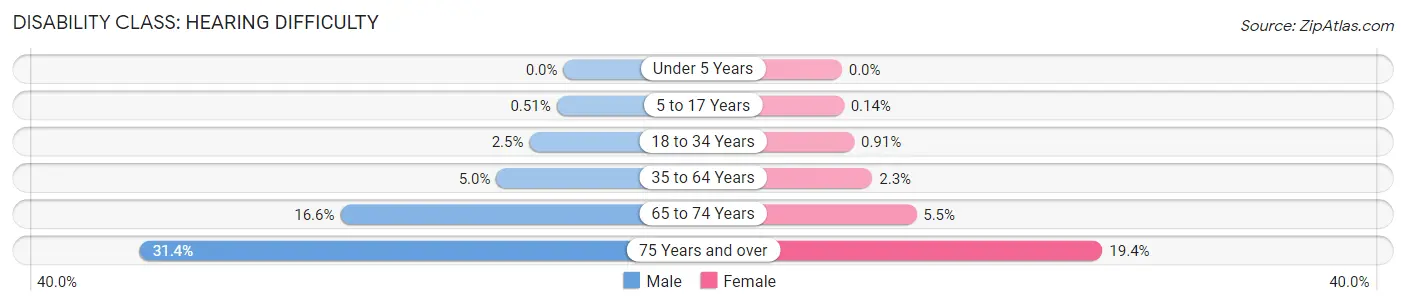
| Age Bracket | Male | Female |
| Under 5 Years | 0 (0.0%) | 0 (0.0%) |
| 5 to 17 Years | 74 (0.5%) | 19 (0.1%) |
| 18 to 34 Years | 491 (2.5%) | 158 (0.9%) |
| 35 to 64 Years | 2,035 (5.0%) | 998 (2.3%) |
| 65 to 74 Years | 3,658 (16.6%) | 1,353 (5.5%) |
| 75 Years and over | 4,600 (31.4%) | 3,125 (19.4%) |
Disability Class: Vision Difficulty
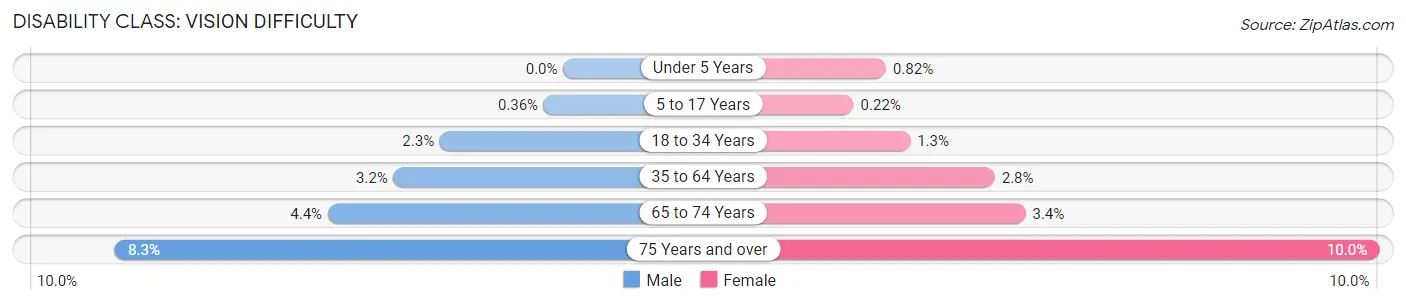
| Age Bracket | Male | Female |
| Under 5 Years | 0 (0.0%) | 35 (0.8%) |
| 5 to 17 Years | 53 (0.4%) | 30 (0.2%) |
| 18 to 34 Years | 444 (2.3%) | 221 (1.3%) |
| 35 to 64 Years | 1,285 (3.2%) | 1,250 (2.8%) |
| 65 to 74 Years | 964 (4.4%) | 834 (3.4%) |
| 75 Years and over | 1,217 (8.3%) | 1,610 (10.0%) |
Disability Class: Cognitive Difficulty
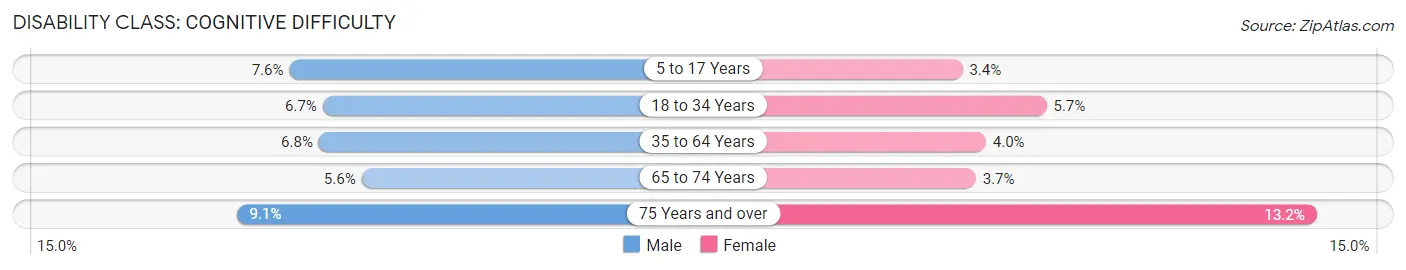
| Age Bracket | Male | Female |
| 5 to 17 Years | 1,113 (7.6%) | 464 (3.4%) |
| 18 to 34 Years | 1,297 (6.7%) | 994 (5.7%) |
| 35 to 64 Years | 2,782 (6.8%) | 1,764 (4.0%) |
| 65 to 74 Years | 1,240 (5.6%) | 912 (3.7%) |
| 75 Years and over | 1,331 (9.1%) | 2,136 (13.2%) |
Disability Class: Ambulatory Difficulty
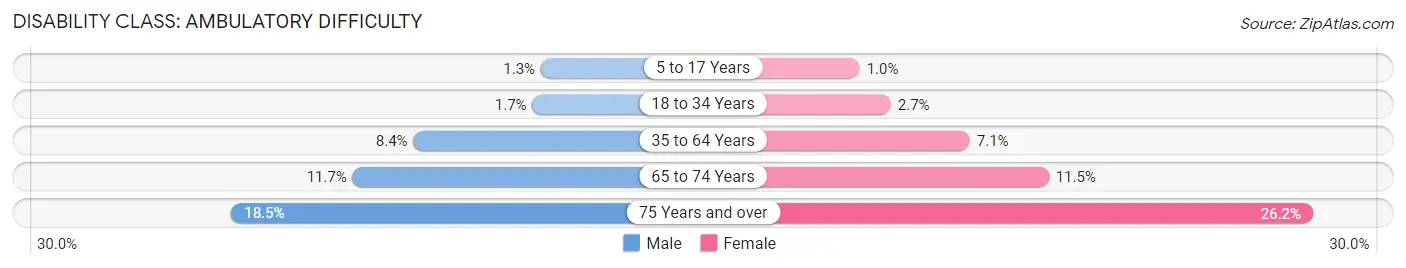
| Age Bracket | Male | Female |
| 5 to 17 Years | 182 (1.3%) | 138 (1.0%) |
| 18 to 34 Years | 333 (1.7%) | 477 (2.7%) |
| 35 to 64 Years | 3,409 (8.4%) | 3,137 (7.1%) |
| 65 to 74 Years | 2,590 (11.7%) | 2,816 (11.5%) |
| 75 Years and over | 2,705 (18.5%) | 4,237 (26.2%) |
Disability Class: Self-Care Difficulty
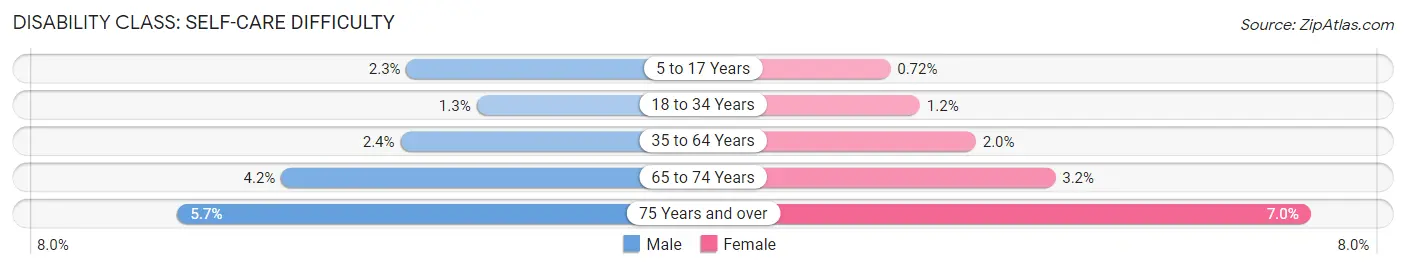
| Age Bracket | Male | Female |
| 5 to 17 Years | 340 (2.3%) | 100 (0.7%) |
| 18 to 34 Years | 250 (1.3%) | 202 (1.2%) |
| 35 to 64 Years | 987 (2.4%) | 875 (2.0%) |
| 65 to 74 Years | 925 (4.2%) | 776 (3.2%) |
| 75 Years and over | 838 (5.7%) | 1,125 (7.0%) |
Technology Access in Yavapai County
Computing Device Access in Yavapai County
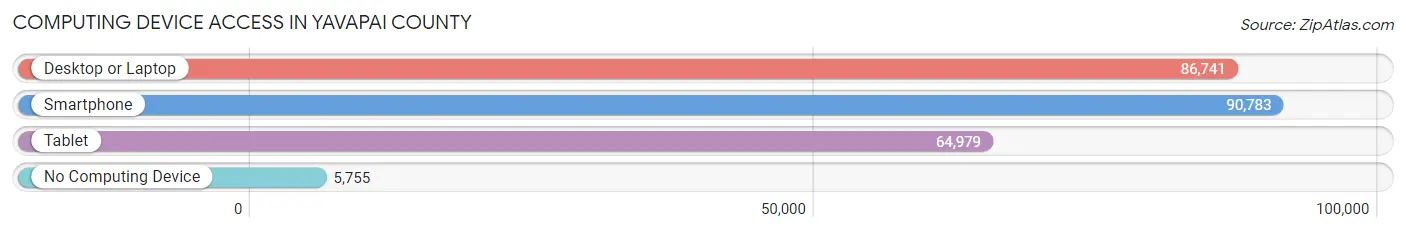
| Device Type | # Households | % Households |
| Desktop or Laptop | 86,741 | 81.4% |
| Smartphone | 90,783 | 85.2% |
| Tablet | 64,979 | 61.0% |
| No Computing Device | 5,755 | 5.4% |
| Total | 106,542 | 100.0% |
Internet Access in Yavapai County
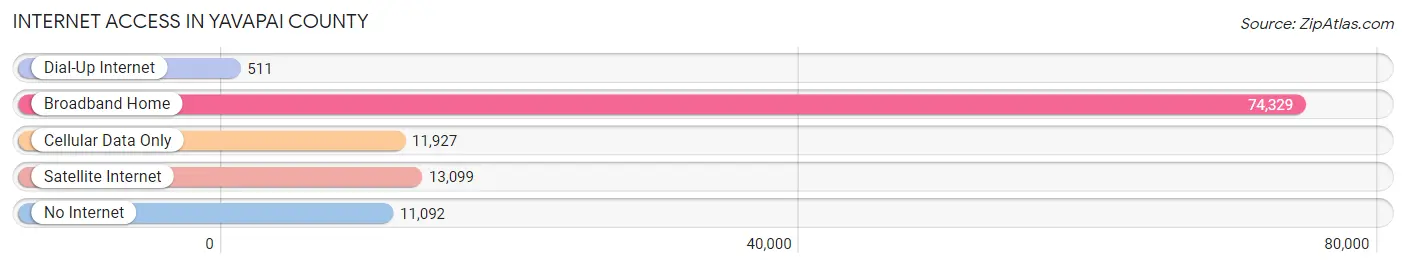
| Internet Type | # Households | % Households |
| Dial-Up Internet | 511 | 0.5% |
| Broadband Home | 74,329 | 69.8% |
| Cellular Data Only | 11,927 | 11.2% |
| Satellite Internet | 13,099 | 12.3% |
| No Internet | 11,092 | 10.4% |
| Total | 106,542 | 100.0% |
Yavapai County Summary
Yavapai County is located in the central part of Arizona, and is the second largest county in the state. It is bordered by Coconino County to the north, Maricopa County to the south, Gila County to the east, and Yuma County to the west. The county seat is Prescott, and the largest city is Prescott Valley. The county has a total area of 8,128 square miles, making it the fourth largest county in the United States.
Geography
Yavapai County is located in the central part of Arizona, and is the second largest county in the state. It is bordered by Coconino County to the north, Maricopa County to the south, Gila County to the east, and Yuma County to the west. The county has a total area of 8,128 square miles, making it the fourth largest county in the United States. The county is divided into two distinct regions: the Verde Valley and the Prescott Valley. The Verde Valley is located in the northern part of the county and is home to the cities of Cottonwood, Camp Verde, and Sedona. The Prescott Valley is located in the southern part of the county and is home to the cities of Prescott, Prescott Valley, and Chino Valley.
The county is home to several mountain ranges, including the Bradshaw Mountains, the Mingus Mountains, and the White Mountains. The highest point in the county is Mount Union, which has an elevation of 7,979 feet. The county also contains several rivers, including the Verde River, the Agua Fria River, and the Hassayampa River.
Climate
Yavapai County has a semi-arid climate, with hot summers and mild winters. The average high temperature in the summer is around 95 degrees Fahrenheit, and the average low temperature in the winter is around 40 degrees Fahrenheit. The county receives an average of 12 inches of precipitation per year, with most of it falling in the summer months.
Demographics
As of the 2010 census, Yavapai County had a population of 211,073. The population was spread out, with 24.3% under the age of 18, 8.2% from 18 to 24, 25.2% from 25 to 44, 28.2% from 45 to 64, and 14.1% who were 65 years of age or older. The median age was 40.3 years. The racial makeup of the county was 87.2% White, 1.3% Black or African American, 1.7% Native American, 0.7% Asian, 0.1% Pacific Islander, 6.7% from other races, and 2.1% from two or more races. Hispanic or Latino of any race were 16.3% of the population.
Economy
Yavapai County has a diverse economy, with a variety of industries providing employment opportunities. The county is home to several large employers, including the Yavapai Regional Medical Center, the Yavapai County Government, and the Yavapai County Sheriff's Office. The county is also home to several large manufacturing companies, including the Arizona Copper Company, the Arizona Cement Company, and the Arizona Steel Company.
The county is also home to several tourist attractions, including the Grand Canyon, the Verde Valley, and the Prescott National Forest. Tourism is a major contributor to the county's economy, with visitors spending an estimated $1.2 billion in the county in 2018.
The county also has a thriving agricultural industry, with cattle, hay, and cotton being the primary crops. The county is also home to several wineries, breweries, and distilleries.
Conclusion
Yavapai County is a large and diverse county located in the central part of Arizona. It is home to several mountain ranges, rivers, and tourist attractions, and has a semi-arid climate. The county has a population of 211,073, and is home to several large employers and a thriving agricultural industry. Tourism is a major contributor to the county's economy, and the county is home to several wineries, breweries, and distilleries.
Common Questions
What is the Total Population of Yavapai County?
Total Population of Yavapai County is 237,830.
What is the Total Male Population of Yavapai County?
Total Male Population of Yavapai County is 117,352.
What is the Total Female Population of Yavapai County?
Total Female Population of Yavapai County is 120,478.
What is the Ratio of Males per 100 Females in Yavapai County?
There are 97.41 Males per 100 Females in Yavapai County.
What is the Ratio of Females per 100 Males in Yavapai County?
There are 102.66 Females per 100 Males in Yavapai County.
What is the Median Population Age in Yavapai County?
Median Population Age in Yavapai County is 54.5 Years.
What is the Average Family Size in Yavapai County
Average Family Size in Yavapai County is 2.7 People.
What is the Average Household Size in Yavapai County
Average Household Size in Yavapai County is 2.2 People.
What is Per Capita Income in Yavapai County?
Per Capita income in Yavapai County is $37,666.
What is the Median Family Income in Yavapai County?
Median Family Income in Yavapai County is $78,461.
What is the Median Household income in Yavapai County?
Median Household Income in Yavapai County is $62,430.
What is Income or Wage Gap in Yavapai County?
Income or Wage Gap in Yavapai County is 24.6%.
Women in Yavapai County earn 75.4 cents for every dollar earned by a man.
What is Family Income Deficit in Yavapai County?
Family Income Deficit in Yavapai County is $9,722.
Families that are below poverty line in Yavapai County earn $9,722 less on average than the poverty threshold level.
What is Inequality or Gini Index in Yavapai County?
Inequality or Gini Index in Yavapai County is 0.45.
How Large is the Labor Force in Yavapai County?
There are 99,908 People in the Labor Forcein in Yavapai County.
What is the Percentage of People in the Labor Force in Yavapai County?
48.7% of People are in the Labor Force in Yavapai County.
What is the Unemployment Rate in Yavapai County?
Unemployment Rate in Yavapai County is 4.9%.