Mohave County, AZ
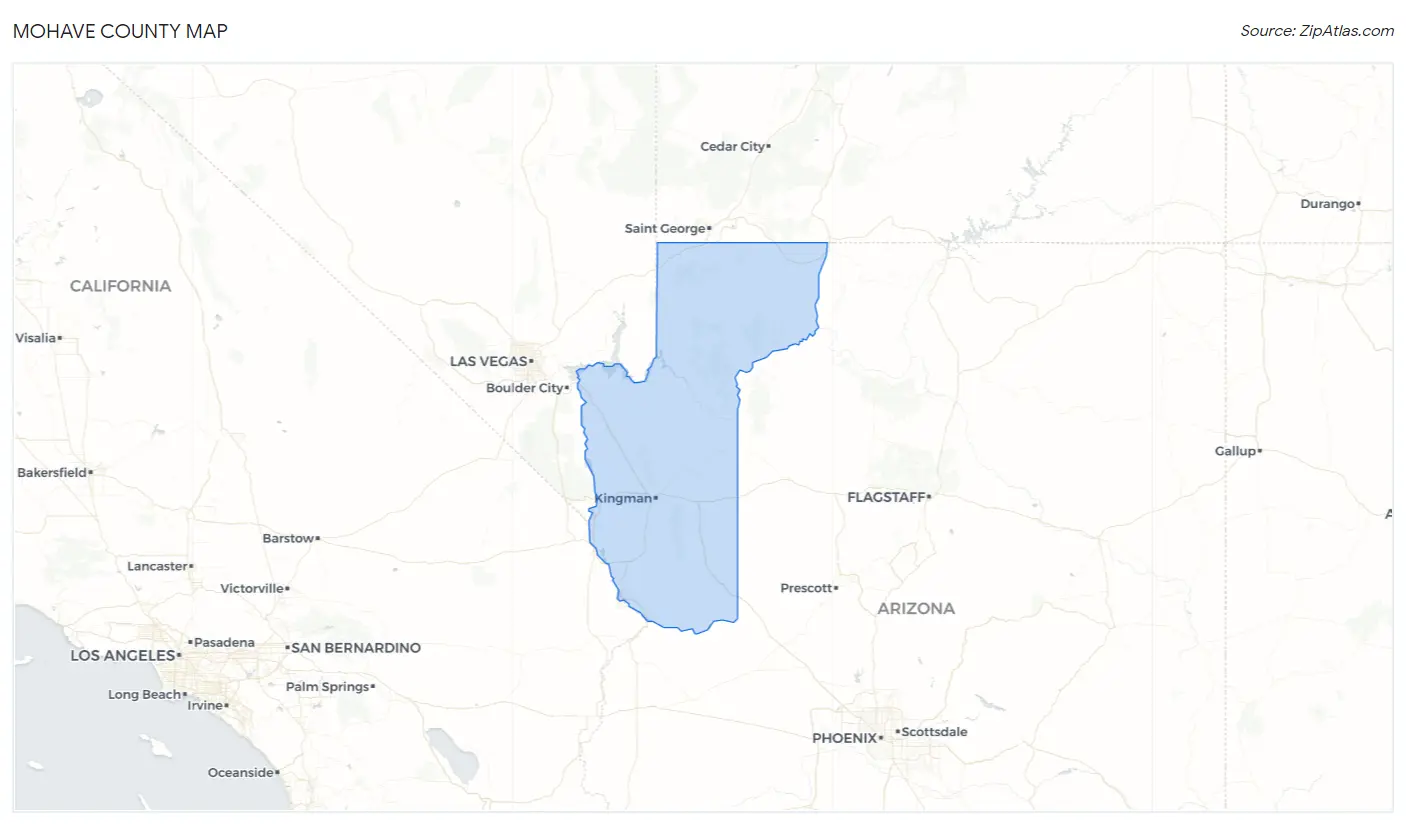
Mohave County Map
Mohave County Overview
214,229
TOTAL POPULATION
108,677
MALE POPULATION
105,552
FEMALE POPULATION
102.96
MALES / 100 FEMALES
97.12
FEMALES / 100 MALES
52.9
MEDIAN AGE
2.7
AVG FAMILY SIZE
2.2
AVG HOUSEHOLD SIZE
$32,835
PER CAPITA INCOME
$64,283
AVG FAMILY INCOME
$53,592
AVG HOUSEHOLD INCOME
13.9%
WAGE / INCOME GAP [ % ]
86.1¢/ $1
WAGE / INCOME GAP [ $ ]
$10,931
FAMILY INCOME DEFICIT
0.46
INEQUALITY / GINI INDEX
82,046
LABOR FORCE [ PEOPLE ]
44.8%
PERCENT IN LABOR FORCE
7.5%
UNEMPLOYMENT RATE
Mohave County Area Codes
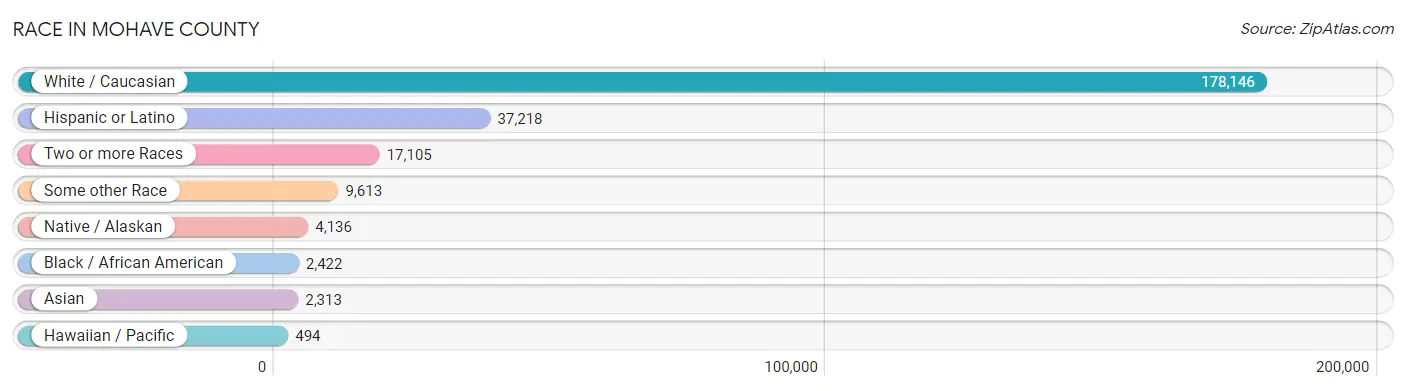
Race in Mohave County
The most populous races in Mohave County are White / Caucasian (178,146 | 83.2%), Hispanic or Latino (37,218 | 17.4%), and Two or more Races (17,105 | 8.0%).
| Race | # Population | % Population |
| Asian | 2,313 | 1.1% |
| Black / African American | 2,422 | 1.1% |
| Hawaiian / Pacific | 494 | 0.2% |
| Hispanic or Latino | 37,218 | 17.4% |
| Native / Alaskan | 4,136 | 1.9% |
| White / Caucasian | 178,146 | 83.2% |
| Two or more Races | 17,105 | 8.0% |
| Some other Race | 9,613 | 4.5% |
| Total | 214,229 | 100.0% |
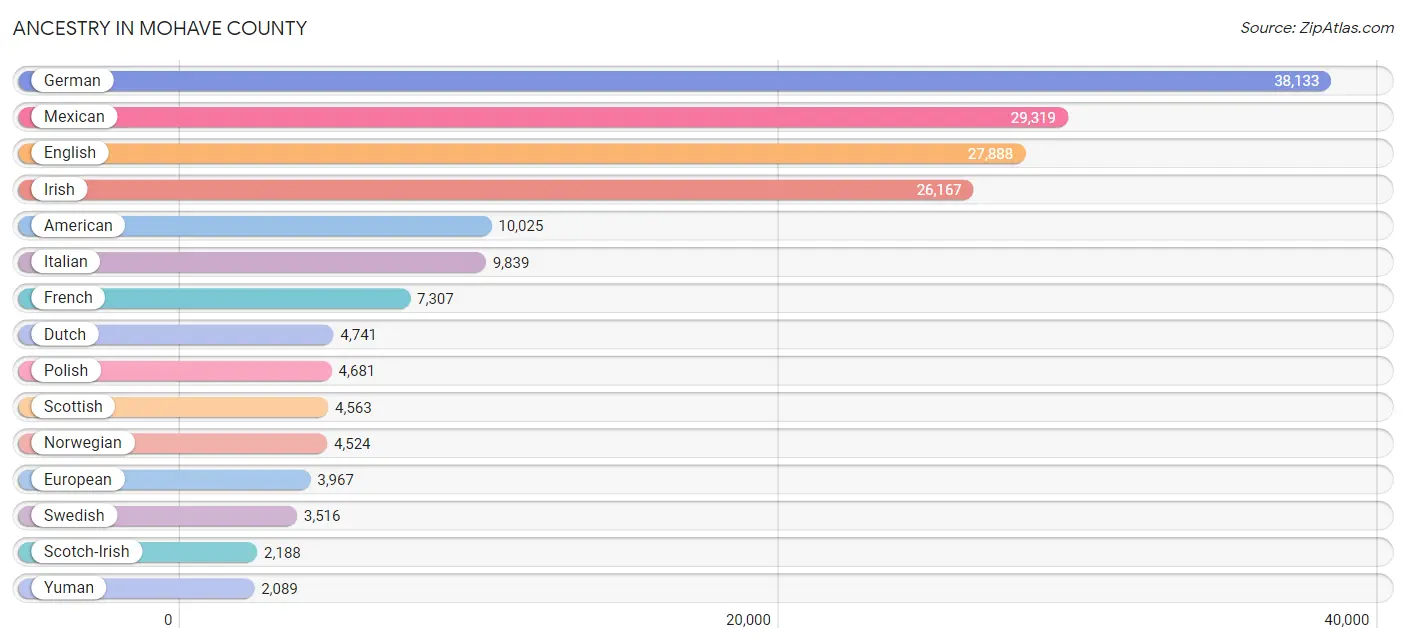
Ancestry in Mohave County
The most populous ancestries reported in Mohave County are German (38,133 | 17.8%), Mexican (29,319 | 13.7%), English (27,888 | 13.0%), Irish (26,167 | 12.2%), and American (10,025 | 4.7%), together accounting for 61.4% of all Mohave County residents.
| Ancestry | # Population | % Population |
| African | 154 | 0.1% |
| Alaska Native | 2 | 0.0% |
| Albanian | 58 | 0.0% |
| Aleut | 11 | 0.0% |
| American | 10,025 | 4.7% |
| Apache | 244 | 0.1% |
| Arab | 581 | 0.3% |
| Argentinean | 283 | 0.1% |
| Armenian | 168 | 0.1% |
| Australian | 132 | 0.1% |
| Austrian | 334 | 0.2% |
| Basque | 69 | 0.0% |
| Belgian | 104 | 0.1% |
| Bhutanese | 482 | 0.2% |
| Blackfeet | 136 | 0.1% |
| Brazilian | 97 | 0.1% |
| British | 1,103 | 0.5% |
| Bulgarian | 5 | 0.0% |
| Burmese | 326 | 0.2% |
| Cajun | 36 | 0.0% |
| Cambodian | 5 | 0.0% |
| Canadian | 473 | 0.2% |
| Central American | 950 | 0.4% |
| Central American Indian | 31 | 0.0% |
| Cherokee | 825 | 0.4% |
| Cheyenne | 47 | 0.0% |
| Chickasaw | 60 | 0.0% |
| Chippewa | 59 | 0.0% |
| Choctaw | 347 | 0.2% |
| Colombian | 60 | 0.0% |
| Comanche | 17 | 0.0% |
| Costa Rican | 100 | 0.1% |
| Cree | 27 | 0.0% |
| Creek | 198 | 0.1% |
| Croatian | 186 | 0.1% |
| Cuban | 780 | 0.4% |
| Czech | 626 | 0.3% |
| Czechoslovakian | 208 | 0.1% |
| Danish | 1,662 | 0.8% |
| Delaware | 6 | 0.0% |
| Dutch | 4,741 | 2.2% |
| Eastern European | 352 | 0.2% |
| Ecuadorian | 80 | 0.0% |
| Egyptian | 227 | 0.1% |
| English | 27,888 | 13.0% |
| Ethiopian | 112 | 0.1% |
| European | 3,967 | 1.8% |
| Filipino | 13 | 0.0% |
| Finnish | 416 | 0.2% |
| French | 7,307 | 3.4% |
| French American Indian | 10 | 0.0% |
| French Canadian | 1,410 | 0.7% |
| German | 38,133 | 17.8% |
| Greek | 550 | 0.3% |
| Guamanian / Chamorro | 158 | 0.1% |
| Guatemalan | 331 | 0.2% |
| Haitian | 8 | 0.0% |
| Honduran | 63 | 0.0% |
| Hopi | 126 | 0.1% |
| Hungarian | 1,475 | 0.7% |
| Icelander | 54 | 0.0% |
| Indian (Asian) | 202 | 0.1% |
| Inupiat | 87 | 0.0% |
| Iranian | 107 | 0.1% |
| Irish | 26,167 | 12.2% |
| Iroquois | 53 | 0.0% |
| Israeli | 118 | 0.1% |
| Italian | 9,839 | 4.6% |
| Jamaican | 5 | 0.0% |
| Japanese | 72 | 0.0% |
| Korean | 1,783 | 0.8% |
| Laotian | 73 | 0.0% |
| Latvian | 8 | 0.0% |
| Lebanese | 106 | 0.1% |
| Lithuanian | 245 | 0.1% |
| Lumbee | 23 | 0.0% |
| Luxembourger | 61 | 0.0% |
| Malaysian | 13 | 0.0% |
| Mexican | 29,319 | 13.7% |
| Mexican American Indian | 81 | 0.0% |
| Native Hawaiian | 585 | 0.3% |
| Navajo | 735 | 0.3% |
| Nicaraguan | 103 | 0.1% |
| Nigerian | 29 | 0.0% |
| Northern European | 259 | 0.1% |
| Norwegian | 4,524 | 2.1% |
| Osage | 9 | 0.0% |
| Paiute | 242 | 0.1% |
| Pakistani | 309 | 0.1% |
| Palestinian | 91 | 0.0% |
| Panamanian | 16 | 0.0% |
| Pennsylvania German | 193 | 0.1% |
| Peruvian | 291 | 0.1% |
| Pima | 155 | 0.1% |
| Polish | 4,681 | 2.2% |
| Portuguese | 1,030 | 0.5% |
| Potawatomi | 12 | 0.0% |
| Pueblo | 82 | 0.0% |
| Puerto Rican | 1,554 | 0.7% |
| Puget Sound Salish | 33 | 0.0% |
| Romanian | 282 | 0.1% |
| Russian | 1,528 | 0.7% |
| Salvadoran | 337 | 0.2% |
| Samoan | 26 | 0.0% |
| Scandinavian | 890 | 0.4% |
| Scotch-Irish | 2,188 | 1.0% |
| Scottish | 4,563 | 2.1% |
| Seminole | 8 | 0.0% |
| Serbian | 155 | 0.1% |
| Sioux | 172 | 0.1% |
| Slavic | 128 | 0.1% |
| Slovak | 114 | 0.1% |
| Slovene | 85 | 0.0% |
| South African | 25 | 0.0% |
| South American | 755 | 0.4% |
| Spaniard | 1,487 | 0.7% |
| Spanish | 804 | 0.4% |
| Sri Lankan | 250 | 0.1% |
| Subsaharan African | 413 | 0.2% |
| Swedish | 3,516 | 1.6% |
| Swiss | 536 | 0.3% |
| Syrian | 65 | 0.0% |
| Thai | 189 | 0.1% |
| Tohono O'Odham | 18 | 0.0% |
| Trinidadian and Tobagonian | 21 | 0.0% |
| Turkish | 13 | 0.0% |
| Ugandan | 47 | 0.0% |
| Ukrainian | 320 | 0.2% |
| Uruguayan | 31 | 0.0% |
| Venezuelan | 10 | 0.0% |
| Welsh | 1,818 | 0.9% |
| West Indian | 9 | 0.0% |
| Yaqui | 309 | 0.1% |
| Yugoslavian | 143 | 0.1% |
| Yuman | 2,089 | 1.0% | View All 135 Rows |
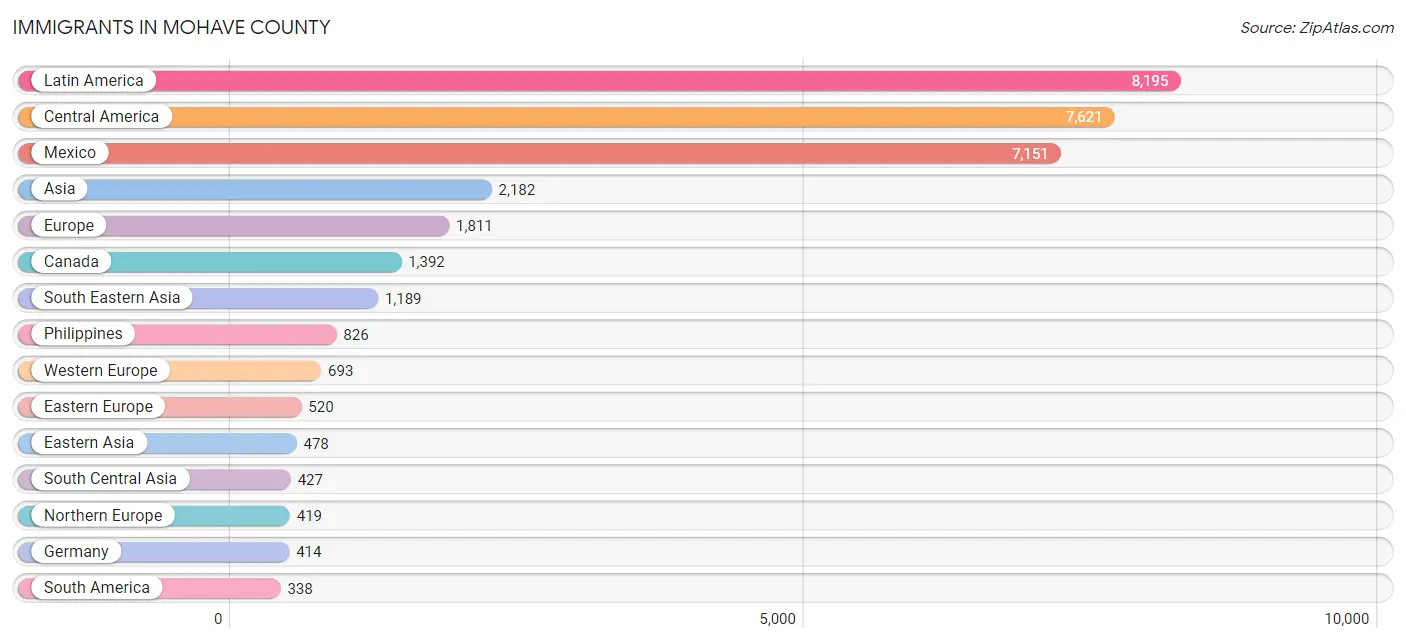
Immigrants in Mohave County
The most numerous immigrant groups reported in Mohave County came from Latin America (8,195 | 3.8%), Central America (7,621 | 3.6%), Mexico (7,151 | 3.3%), Asia (2,182 | 1.0%), and Europe (1,811 | 0.9%), together accounting for 12.6% of all Mohave County residents.
| Immigration Origin | # Population | % Population |
| Africa | 236 | 0.1% |
| Argentina | 88 | 0.0% |
| Asia | 2,182 | 1.0% |
| Australia | 5 | 0.0% |
| Austria | 26 | 0.0% |
| Bangladesh | 10 | 0.0% |
| Belgium | 21 | 0.0% |
| Bolivia | 2 | 0.0% |
| Cambodia | 20 | 0.0% |
| Canada | 1,392 | 0.6% |
| Caribbean | 236 | 0.1% |
| Central America | 7,621 | 3.6% |
| China | 182 | 0.1% |
| Colombia | 61 | 0.0% |
| Croatia | 66 | 0.0% |
| Cuba | 171 | 0.1% |
| Czechoslovakia | 50 | 0.0% |
| Denmark | 29 | 0.0% |
| Eastern Africa | 188 | 0.1% |
| Eastern Asia | 478 | 0.2% |
| Eastern Europe | 520 | 0.2% |
| Ecuador | 67 | 0.0% |
| El Salvador | 70 | 0.0% |
| England | 231 | 0.1% |
| Eritrea | 12 | 0.0% |
| Ethiopia | 109 | 0.1% |
| Europe | 1,811 | 0.9% |
| Fiji | 17 | 0.0% |
| France | 94 | 0.0% |
| Germany | 414 | 0.2% |
| Guatemala | 175 | 0.1% |
| Haiti | 8 | 0.0% |
| Honduras | 141 | 0.1% |
| Hong Kong | 15 | 0.0% |
| Hungary | 166 | 0.1% |
| India | 83 | 0.0% |
| Indonesia | 35 | 0.0% |
| Iran | 139 | 0.1% |
| Ireland | 42 | 0.0% |
| Italy | 158 | 0.1% |
| Jamaica | 36 | 0.0% |
| Japan | 115 | 0.1% |
| Kazakhstan | 17 | 0.0% |
| Korea | 176 | 0.1% |
| Laos | 5 | 0.0% |
| Latin America | 8,195 | 3.8% |
| Lebanon | 13 | 0.0% |
| Mexico | 7,151 | 3.3% |
| Morocco | 7 | 0.0% |
| Netherlands | 127 | 0.1% |
| Nicaragua | 79 | 0.0% |
| Nigeria | 25 | 0.0% |
| Northern Africa | 7 | 0.0% |
| Northern Europe | 419 | 0.2% |
| Oceania | 26 | 0.0% |
| Pakistan | 80 | 0.0% |
| Panama | 5 | 0.0% |
| Peru | 79 | 0.0% |
| Philippines | 826 | 0.4% |
| Poland | 46 | 0.0% |
| Portugal | 21 | 0.0% |
| Romania | 30 | 0.0% |
| Scotland | 21 | 0.0% |
| Serbia | 40 | 0.0% |
| South Africa | 16 | 0.0% |
| South America | 338 | 0.2% |
| South Central Asia | 427 | 0.2% |
| South Eastern Asia | 1,189 | 0.6% |
| Southern Europe | 179 | 0.1% |
| Sri Lanka | 98 | 0.1% |
| Sweden | 33 | 0.0% |
| Switzerland | 11 | 0.0% |
| Taiwan | 75 | 0.0% |
| Thailand | 197 | 0.1% |
| Trinidad and Tobago | 21 | 0.0% |
| Turkey | 8 | 0.0% |
| Uganda | 21 | 0.0% |
| Ukraine | 103 | 0.1% |
| Uruguay | 31 | 0.0% |
| Venezuela | 10 | 0.0% |
| Vietnam | 94 | 0.0% |
| Western Africa | 25 | 0.0% |
| Western Asia | 65 | 0.0% |
| Western Europe | 693 | 0.3% | View All 84 Rows |
Sex and Age in Mohave County
Sex and Age in Mohave County
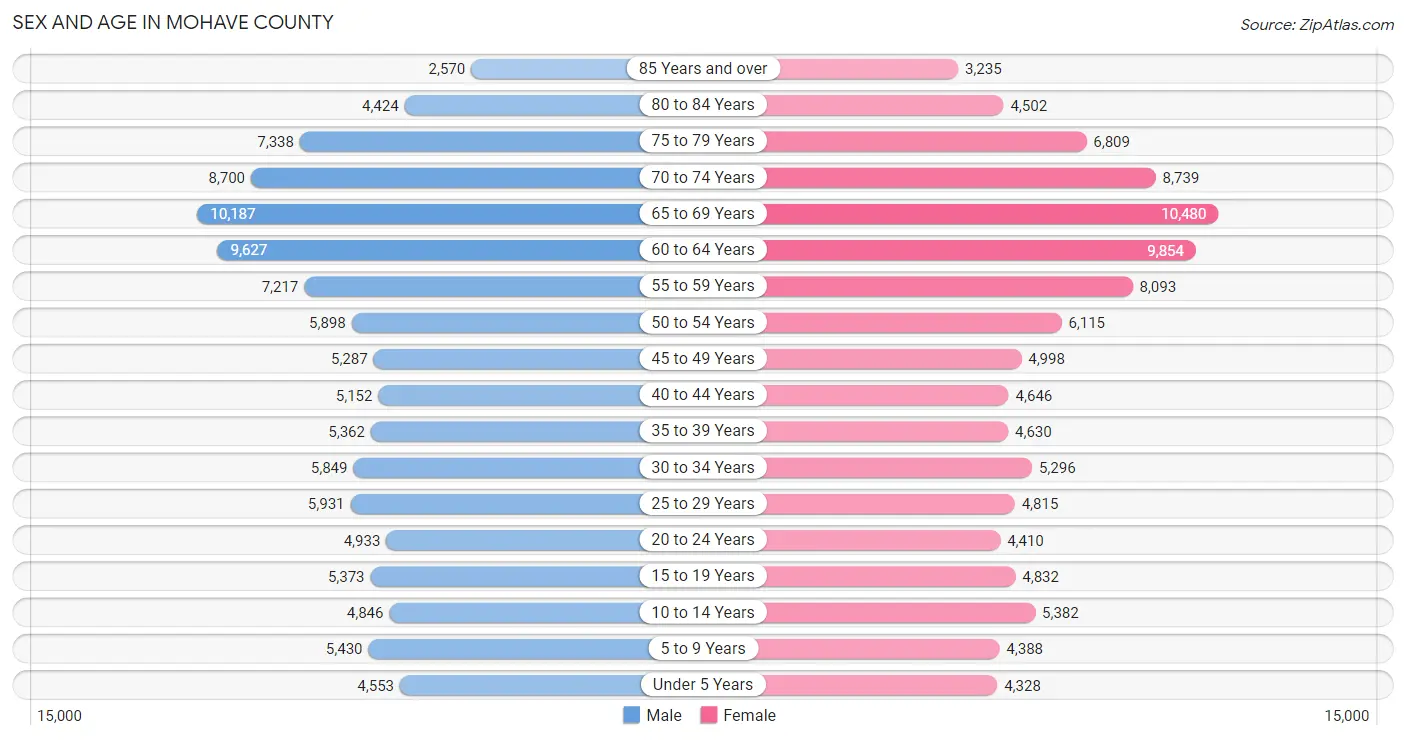
The most populous age groups in Mohave County are 65 to 69 Years (10,187 | 9.4%) for men and 65 to 69 Years (10,480 | 9.9%) for women.
| Age Bracket | Male | Female |
| Under 5 Years | 4,553 (4.2%) | 4,328 (4.1%) |
| 5 to 9 Years | 5,430 (5.0%) | 4,388 (4.2%) |
| 10 to 14 Years | 4,846 (4.5%) | 5,382 (5.1%) |
| 15 to 19 Years | 5,373 (4.9%) | 4,832 (4.6%) |
| 20 to 24 Years | 4,933 (4.5%) | 4,410 (4.2%) |
| 25 to 29 Years | 5,931 (5.5%) | 4,815 (4.6%) |
| 30 to 34 Years | 5,849 (5.4%) | 5,296 (5.0%) |
| 35 to 39 Years | 5,362 (4.9%) | 4,630 (4.4%) |
| 40 to 44 Years | 5,152 (4.7%) | 4,646 (4.4%) |
| 45 to 49 Years | 5,287 (4.9%) | 4,998 (4.7%) |
| 50 to 54 Years | 5,898 (5.4%) | 6,115 (5.8%) |
| 55 to 59 Years | 7,217 (6.6%) | 8,093 (7.7%) |
| 60 to 64 Years | 9,627 (8.9%) | 9,854 (9.3%) |
| 65 to 69 Years | 10,187 (9.4%) | 10,480 (9.9%) |
| 70 to 74 Years | 8,700 (8.0%) | 8,739 (8.3%) |
| 75 to 79 Years | 7,338 (6.8%) | 6,809 (6.5%) |
| 80 to 84 Years | 4,424 (4.1%) | 4,502 (4.3%) |
| 85 Years and over | 2,570 (2.4%) | 3,235 (3.1%) |
| Total | 108,677 (100.0%) | 105,552 (100.0%) |
Families and Households in Mohave County
Median Family Size in Mohave County
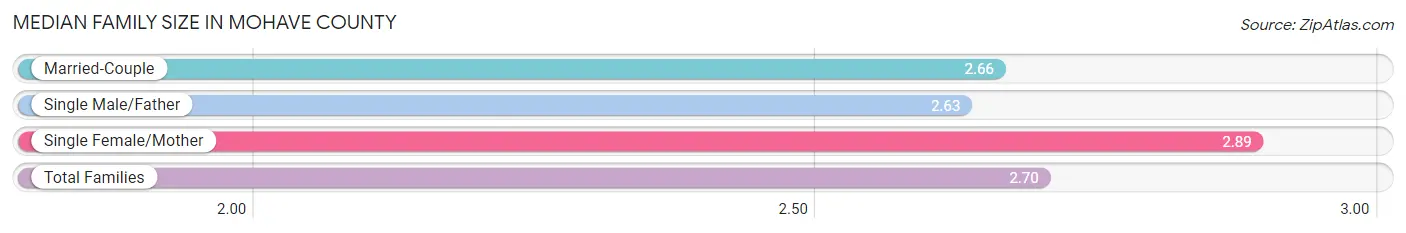
The median family size in Mohave County is 2.70 persons per family, with single female/mother families (10,196 | 17.1%) accounting for the largest median family size of 2.89 persons per family. On the other hand, single male/father families (5,808 | 9.8%) represent the smallest median family size with 2.63 persons per family.
| Family Type | # Families | Family Size |
| Married-Couple | 43,489 (73.1%) | 2.66 |
| Single Male/Father | 5,808 (9.8%) | 2.63 |
| Single Female/Mother | 10,196 (17.1%) | 2.89 |
| Total Families | 59,493 (100.0%) | 2.70 |
Median Household Size in Mohave County
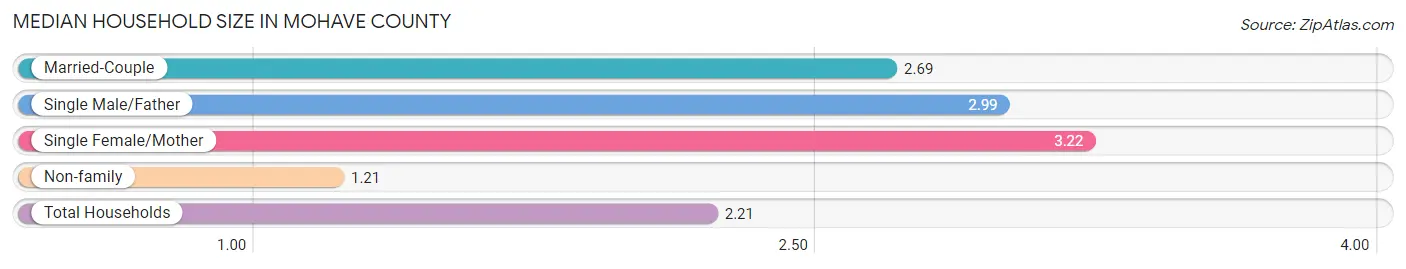
The median household size in Mohave County is 2.21 persons per household, with single female/mother households (10,196 | 10.7%) accounting for the largest median household size of 3.22 persons per household. non-family households (35,676 | 37.5%) represent the smallest median household size with 1.21 persons per household.
| Household Type | # Households | Household Size |
| Married-Couple | 43,489 (45.7%) | 2.69 |
| Single Male/Father | 5,808 (6.1%) | 2.99 |
| Single Female/Mother | 10,196 (10.7%) | 3.22 |
| Non-family | 35,676 (37.5%) | 1.21 |
| Total Households | 95,169 (100.0%) | 2.21 |
Household Size by Marriage Status in Mohave County
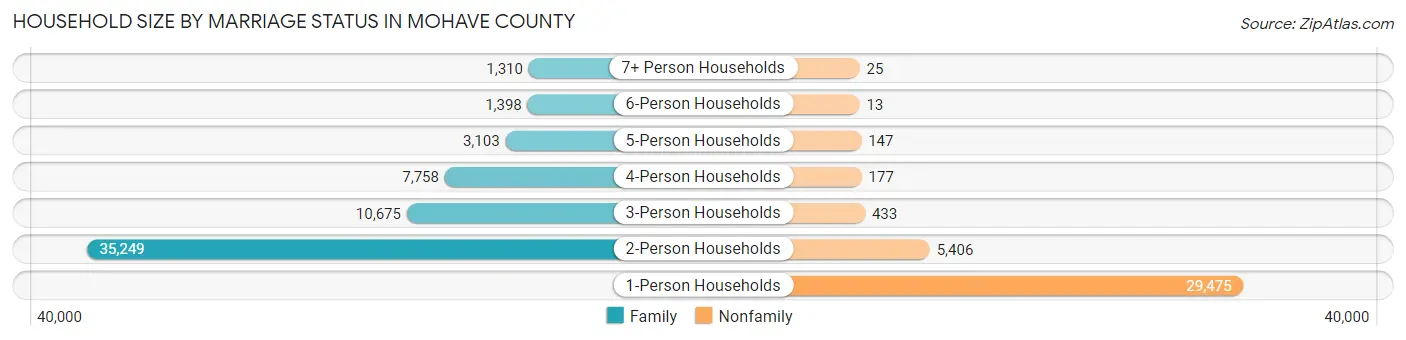
Out of a total of 95,169 households in Mohave County, 59,493 (62.5%) are family households, while 35,676 (37.5%) are nonfamily households. The most numerous type of family households are 2-person households, comprising 35,249, and the most common type of nonfamily households are 1-person households, comprising 29,475.
| Household Size | Family Households | Nonfamily Households |
| 1-Person Households | - | 29,475 (31.0%) |
| 2-Person Households | 35,249 (37.0%) | 5,406 (5.7%) |
| 3-Person Households | 10,675 (11.2%) | 433 (0.4%) |
| 4-Person Households | 7,758 (8.2%) | 177 (0.2%) |
| 5-Person Households | 3,103 (3.3%) | 147 (0.2%) |
| 6-Person Households | 1,398 (1.5%) | 13 (0.0%) |
| 7+ Person Households | 1,310 (1.4%) | 25 (0.0%) |
| Total | 59,493 (62.5%) | 35,676 (37.5%) |
Female Fertility in Mohave County
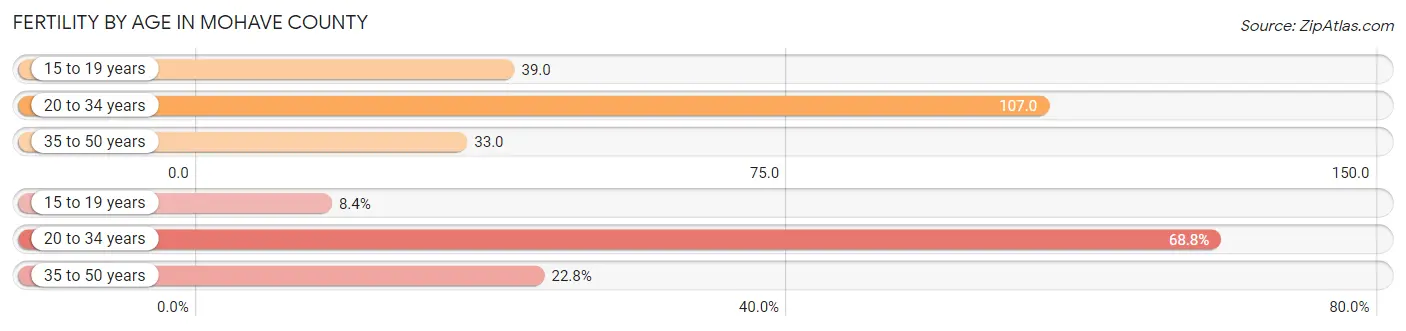
Fertility by Age in Mohave County
Average fertility rate in Mohave County is 65.0 births per 1,000 women. Women in the age bracket of 20 to 34 years have the highest fertility rate with 107.0 births per 1,000 women. Women in the age bracket of 20 to 34 years acount for 68.8% of all women with births.
| Age Bracket | Women with Births | Births / 1,000 Women |
| 15 to 19 years | 190 (8.4%) | 39.0 |
| 20 to 34 years | 1,553 (68.8%) | 107.0 |
| 35 to 50 years | 516 (22.8%) | 33.0 |
| Total | 2,259 (100.0%) | 65.0 |
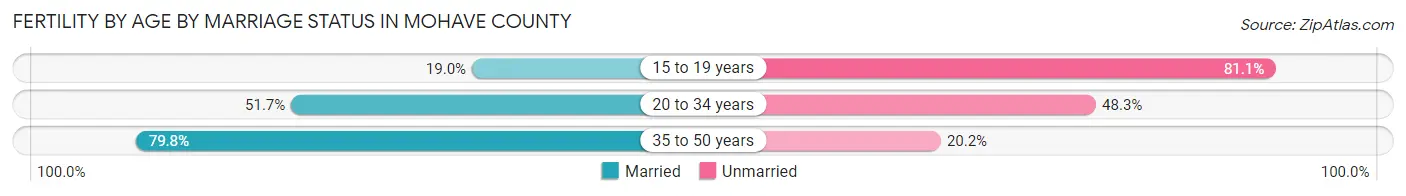
Fertility by Age by Marriage Status in Mohave County
55.4% of women with births (2,259) in Mohave County are married. The highest percentage of unmarried women with births falls into 15 to 19 years age bracket with 81.0% of them unmarried at the time of birth, while the lowest percentage of unmarried women with births belong to 35 to 50 years age bracket with 20.2% of them unmarried.
| Age Bracket | Married | Unmarried |
| 15 to 19 years | 36 (19.0%) | 154 (81.0%) |
| 20 to 34 years | 803 (51.7%) | 750 (48.3%) |
| 35 to 50 years | 412 (79.8%) | 104 (20.2%) |
| Total | 1,251 (55.4%) | 1,008 (44.6%) |
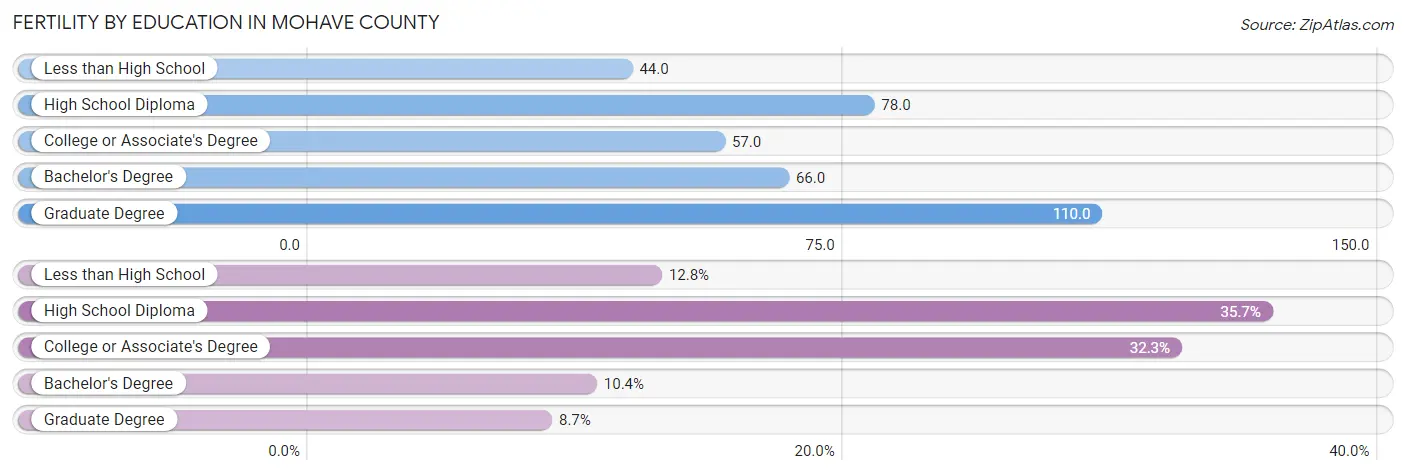
Fertility by Education in Mohave County
Average fertility rate in Mohave County is 65.0 births per 1,000 women. Women with the education attainment of graduate degree have the highest fertility rate of 110.0 births per 1,000 women, while women with the education attainment of less than high school have the lowest fertility at 44.0 births per 1,000 women. Women with the education attainment of high school diploma represent 35.7% of all women with births.
| Educational Attainment | Women with Births | Births / 1,000 Women |
| Less than High School | 290 (12.8%) | 44.0 |
| High School Diploma | 807 (35.7%) | 78.0 |
| College or Associate's Degree | 730 (32.3%) | 57.0 |
| Bachelor's Degree | 235 (10.4%) | 66.0 |
| Graduate Degree | 197 (8.7%) | 110.0 |
| Total | 2,259 (100.0%) | 65.0 |
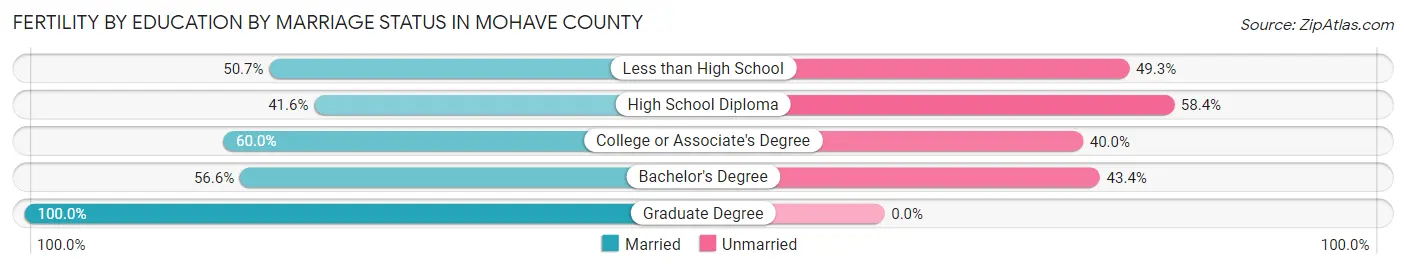
Fertility by Education by Marriage Status in Mohave County
44.6% of women with births in Mohave County are unmarried. Women with the educational attainment of graduate degree are most likely to be married with 100.0% of them married at childbirth, while women with the educational attainment of high school diploma are least likely to be married with 58.4% of them unmarried at childbirth.
| Educational Attainment | Married | Unmarried |
| Less than High School | 147 (50.7%) | 143 (49.3%) |
| High School Diploma | 336 (41.6%) | 471 (58.4%) |
| College or Associate's Degree | 438 (60.0%) | 292 (40.0%) |
| Bachelor's Degree | 133 (56.6%) | 102 (43.4%) |
| Graduate Degree | 197 (100.0%) | 0 (0.0%) |
| Total | 1,251 (55.4%) | 1,008 (44.6%) |
Income in Mohave County
Income Overview in Mohave County
Per Capita Income in Mohave County is $32,835, while median incomes of families and households are $64,283 and $53,592 respectively.
| Characteristic | Number | Measure |
| Per Capita Income | 214,229 | $32,835 |
| Median Family Income | 59,493 | $64,283 |
| Mean Family Income | 59,493 | $83,869 |
| Median Household Income | 95,169 | $53,592 |
| Mean Household Income | 95,169 | $73,093 |
| Income Deficit | 59,493 | $10,931 |
| Wage / Income Gap (%) | 214,229 | 13.87% |
| Wage / Income Gap ($) | 214,229 | 86.13¢ per $1 |
| Gini / Inequality Index | 214,229 | 0.46 |
Earnings by Sex in Mohave County
Average Earnings in Mohave County are $33,132, $35,753 for men and $30,795 for women, a difference of 13.9%.
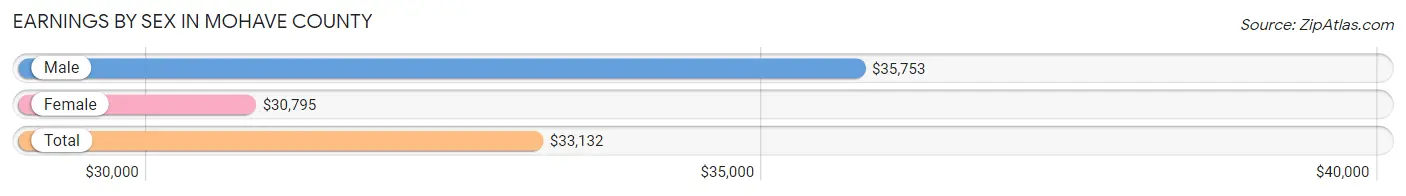
| Sex | Number | Average Earnings |
| Male | 45,945 (53.4%) | $35,753 |
| Female | 40,029 (46.6%) | $30,795 |
| Total | 85,974 (100.0%) | $33,132 |
Earnings by Sex by Income Bracket in Mohave County
The most common earnings brackets in Mohave County are $100,000+ for men (4,959 | 10.8%) and $30,000 to $34,999 for women (3,885 | 9.7%).
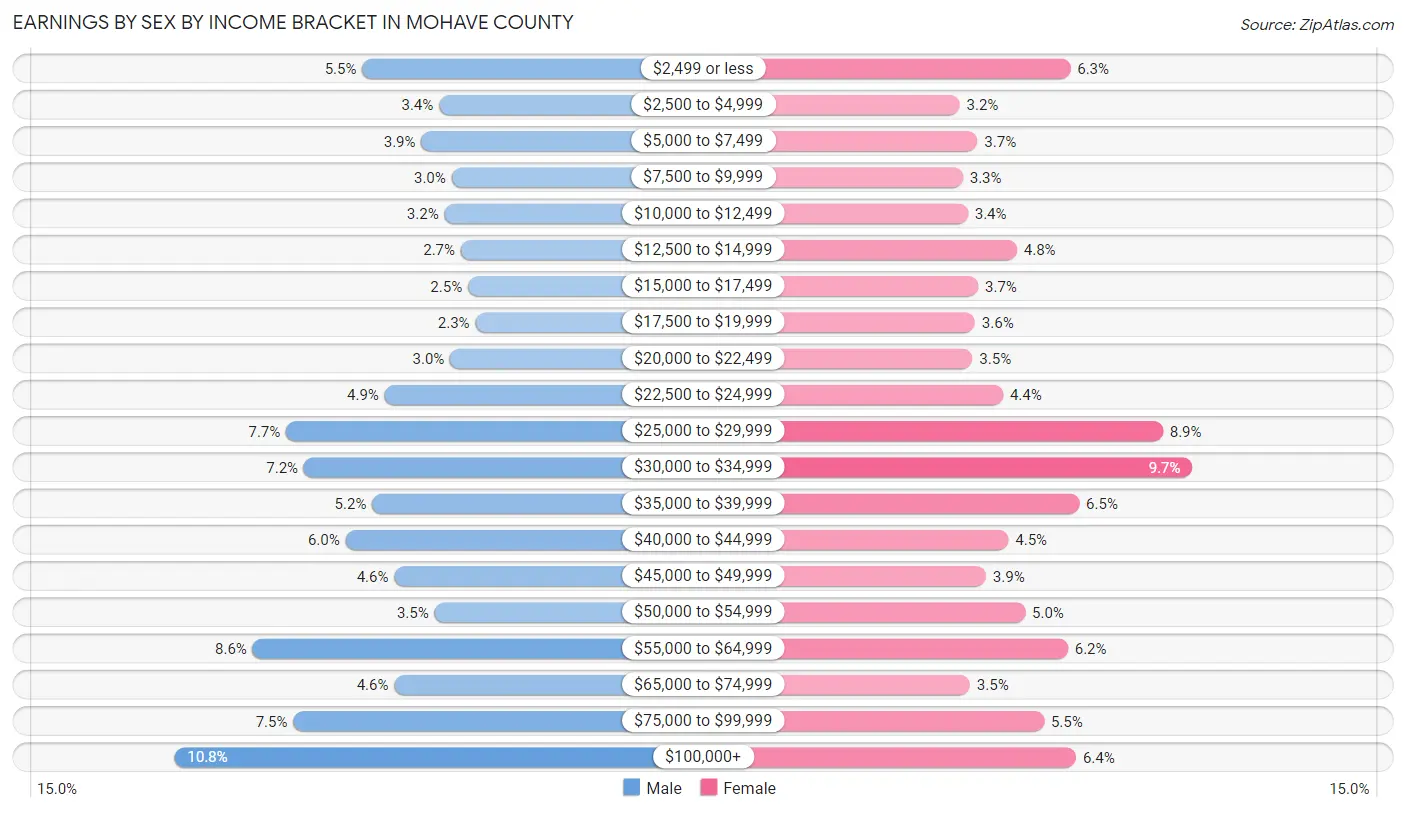
| Income | Male | Female |
| $2,499 or less | 2,532 (5.5%) | 2,513 (6.3%) |
| $2,500 to $4,999 | 1,538 (3.4%) | 1,269 (3.2%) |
| $5,000 to $7,499 | 1,770 (3.8%) | 1,469 (3.7%) |
| $7,500 to $9,999 | 1,378 (3.0%) | 1,305 (3.3%) |
| $10,000 to $12,499 | 1,471 (3.2%) | 1,360 (3.4%) |
| $12,500 to $14,999 | 1,260 (2.7%) | 1,914 (4.8%) |
| $15,000 to $17,499 | 1,166 (2.5%) | 1,478 (3.7%) |
| $17,500 to $19,999 | 1,070 (2.3%) | 1,443 (3.6%) |
| $20,000 to $22,499 | 1,399 (3.0%) | 1,413 (3.5%) |
| $22,500 to $24,999 | 2,241 (4.9%) | 1,758 (4.4%) |
| $25,000 to $29,999 | 3,516 (7.6%) | 3,553 (8.9%) |
| $30,000 to $34,999 | 3,286 (7.1%) | 3,885 (9.7%) |
| $35,000 to $39,999 | 2,402 (5.2%) | 2,612 (6.5%) |
| $40,000 to $44,999 | 2,748 (6.0%) | 1,819 (4.5%) |
| $45,000 to $49,999 | 2,120 (4.6%) | 1,565 (3.9%) |
| $50,000 to $54,999 | 1,601 (3.5%) | 2,007 (5.0%) |
| $55,000 to $64,999 | 3,947 (8.6%) | 2,487 (6.2%) |
| $65,000 to $74,999 | 2,119 (4.6%) | 1,384 (3.5%) |
| $75,000 to $99,999 | 3,422 (7.4%) | 2,218 (5.5%) |
| $100,000+ | 4,959 (10.8%) | 2,577 (6.4%) |
| Total | 45,945 (100.0%) | 40,029 (100.0%) |
Earnings by Sex by Educational Attainment in Mohave County
Average earnings in Mohave County are $40,147 for men and $33,220 for women, a difference of 17.2%. Men with an educational attainment of graduate degree enjoy the highest average annual earnings of $77,224, while those with less than high school education earn the least with $28,417. Women with an educational attainment of graduate degree earn the most with the average annual earnings of $63,003, while those with less than high school education have the smallest earnings of $22,892.
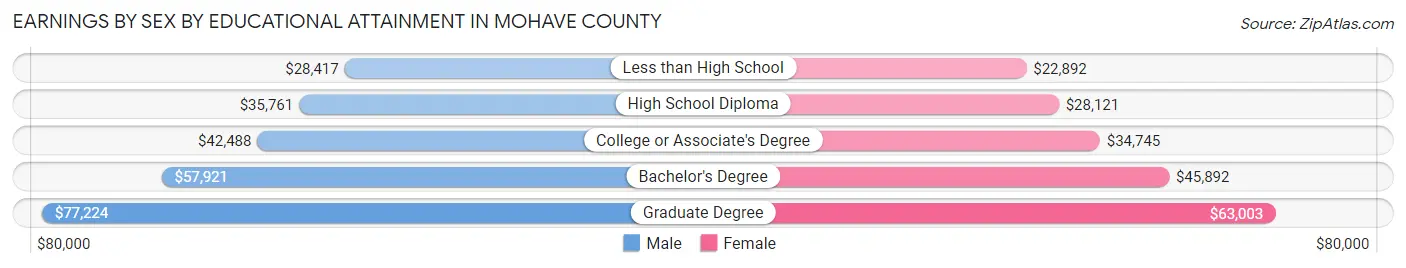
| Educational Attainment | Male Income | Female Income |
| Less than High School | $28,417 | $22,892 |
| High School Diploma | $35,761 | $28,121 |
| College or Associate's Degree | $42,488 | $34,745 |
| Bachelor's Degree | $57,921 | $45,892 |
| Graduate Degree | $77,224 | $63,003 |
| Total | $40,147 | $33,220 |
Family Income in Mohave County
Family Income Brackets in Mohave County
According to the Mohave County family income data, there are 12,613 families falling into the $50,000 to $74,999 income range, which is the most common income bracket and makes up 21.2% of all families. Conversely, the $10,000 to $14,999 income bracket is the least frequent group with only 1,606 families (2.7%) belonging to this category.
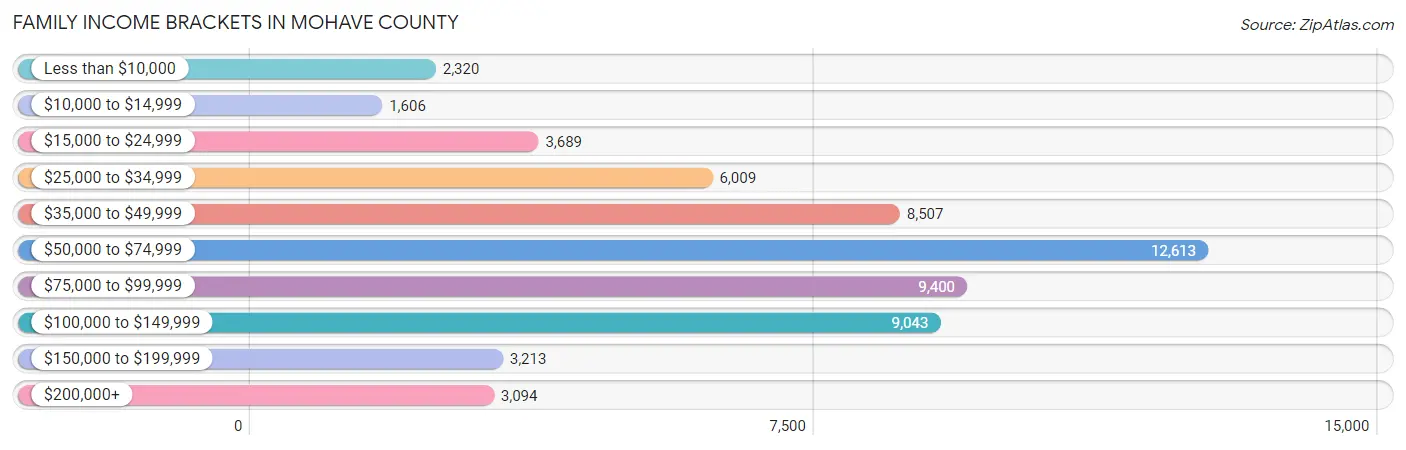
| Income Bracket | # Families | % Families |
| Less than $10,000 | 2,320 | 3.9% |
| $10,000 to $14,999 | 1,606 | 2.7% |
| $15,000 to $24,999 | 3,689 | 6.2% |
| $25,000 to $34,999 | 6,009 | 10.1% |
| $35,000 to $49,999 | 8,507 | 14.3% |
| $50,000 to $74,999 | 12,613 | 21.2% |
| $75,000 to $99,999 | 9,400 | 15.8% |
| $100,000 to $149,999 | 9,043 | 15.2% |
| $150,000 to $199,999 | 3,213 | 5.4% |
| $200,000+ | 3,094 | 5.2% |
Family Income by Famaliy Size in Mohave County
4-person families (6,528 | 11.0%) account for the highest median family income in Mohave County with $84,328 per family, while 2-person families (37,590 | 63.2%) have the highest median income of $30,211 per family member.
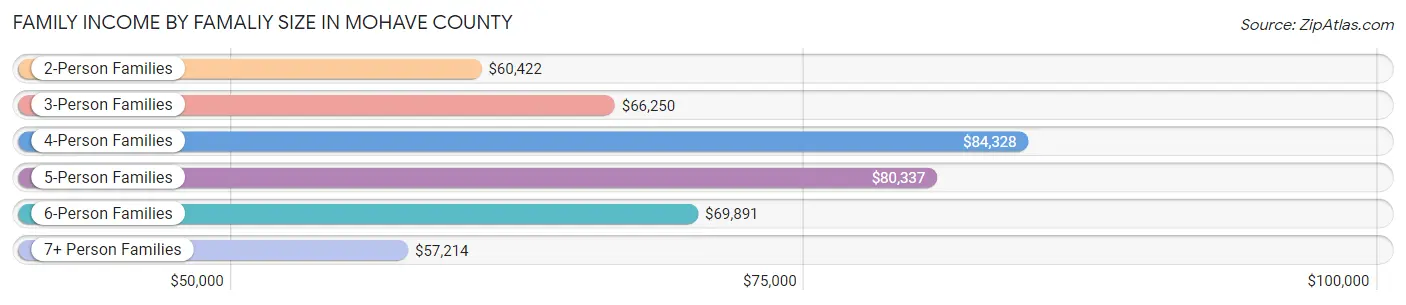
| Income Bracket | # Families | Median Income |
| 2-Person Families | 37,590 (63.2%) | $60,422 |
| 3-Person Families | 10,528 (17.7%) | $66,250 |
| 4-Person Families | 6,528 (11.0%) | $84,328 |
| 5-Person Families | 2,579 (4.3%) | $80,337 |
| 6-Person Families | 1,262 (2.1%) | $69,891 |
| 7+ Person Families | 1,006 (1.7%) | $57,214 |
| Total | 59,493 (100.0%) | $64,283 |
Family Income by Number of Earners in Mohave County
The median family income in Mohave County is $64,283, with families comprising 3+ earners (3,217) having the highest median family income of $109,349, while families with no earners (20,834) have the lowest median family income of $50,347, accounting for 5.4% and 35.0% of families, respectively.
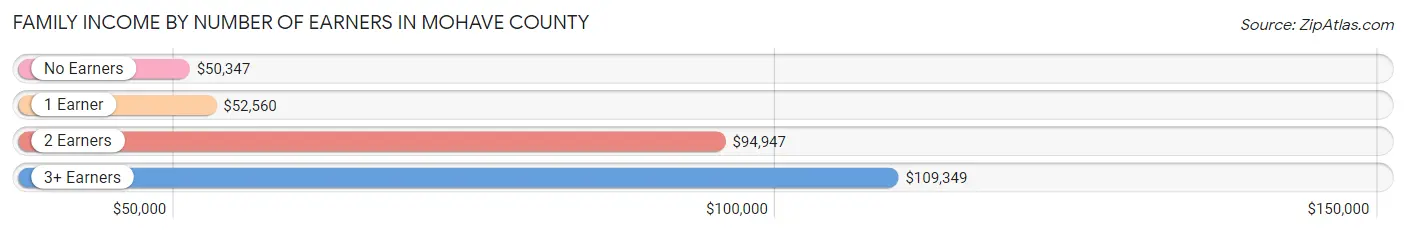
| Number of Earners | # Families | Median Income |
| No Earners | 20,834 (35.0%) | $50,347 |
| 1 Earner | 19,624 (33.0%) | $52,560 |
| 2 Earners | 15,818 (26.6%) | $94,947 |
| 3+ Earners | 3,217 (5.4%) | $109,349 |
| Total | 59,493 (100.0%) | $64,283 |
Household Income in Mohave County
Household Income Brackets in Mohave County
With 18,939 households falling in the category, the $50,000 to $74,999 income range is the most frequent in Mohave County, accounting for 19.9% of all households. In contrast, only 3,807 households (4.0%) fall into the $150,000 to $199,999 income bracket, making it the least populous group.
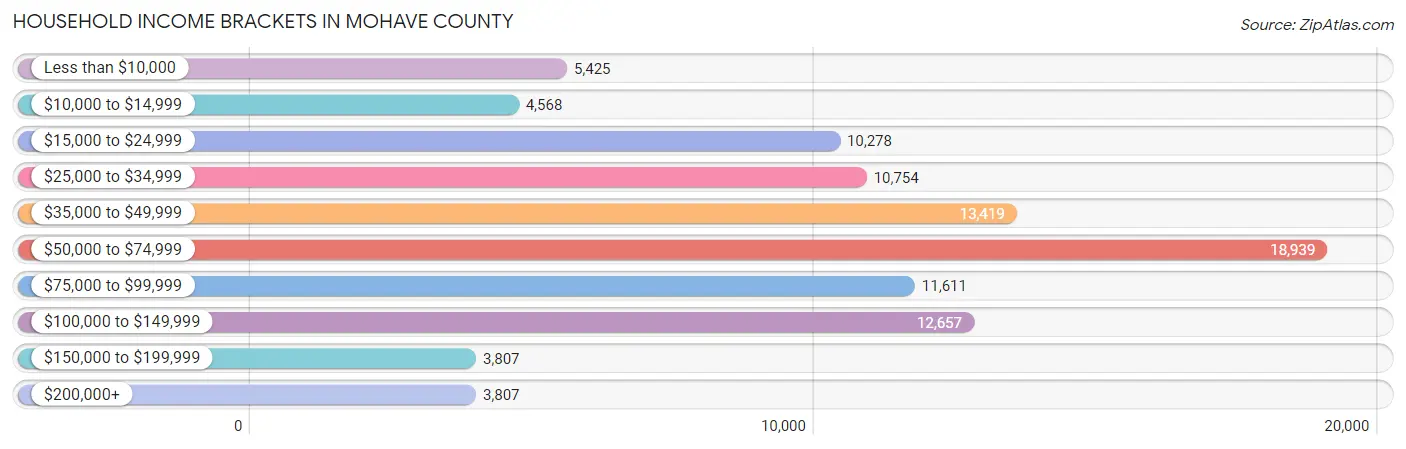
| Income Bracket | # Households | % Households |
| Less than $10,000 | 5,425 | 5.7% |
| $10,000 to $14,999 | 4,568 | 4.8% |
| $15,000 to $24,999 | 10,278 | 10.8% |
| $25,000 to $34,999 | 10,754 | 11.3% |
| $35,000 to $49,999 | 13,419 | 14.1% |
| $50,000 to $74,999 | 18,939 | 19.9% |
| $75,000 to $99,999 | 11,611 | 12.2% |
| $100,000 to $149,999 | 12,657 | 13.3% |
| $150,000 to $199,999 | 3,807 | 4.0% |
| $200,000+ | 3,807 | 4.0% |
Household Income by Householder Age in Mohave County
The median household income in Mohave County is $53,592, with the highest median household income of $63,056 found in the 25 to 44 years age bracket for the primary householder. A total of 19,231 households (20.2%) fall into this category. Meanwhile, the 65+ years age bracket for the primary householder has the lowest median household income of $47,155, with 42,543 households (44.7%) in this group.
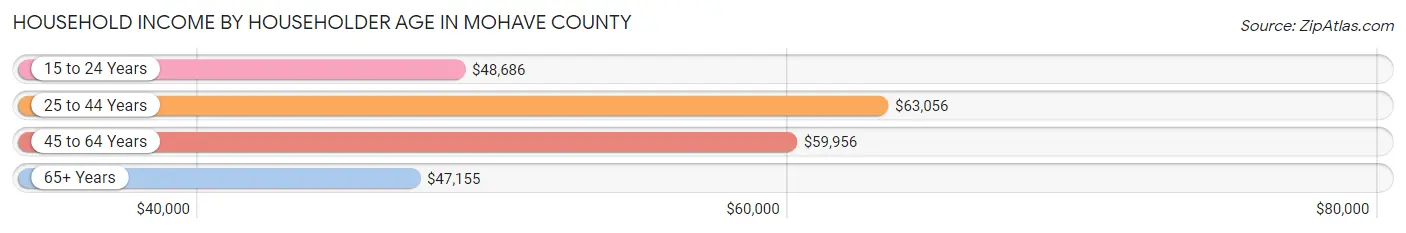
| Income Bracket | # Households | Median Income |
| 15 to 24 Years | 2,493 (2.6%) | $48,686 |
| 25 to 44 Years | 19,231 (20.2%) | $63,056 |
| 45 to 64 Years | 30,902 (32.5%) | $59,956 |
| 65+ Years | 42,543 (44.7%) | $47,155 |
| Total | 95,169 (100.0%) | $53,592 |
Poverty in Mohave County
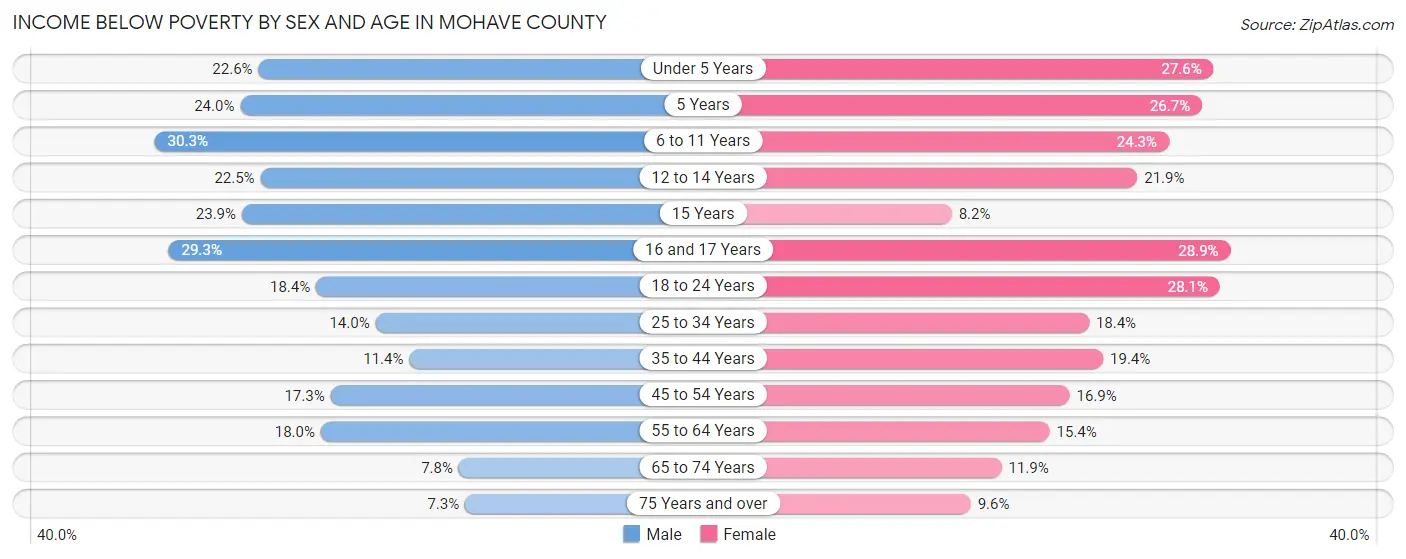
Income Below Poverty by Sex and Age in Mohave County
With 15.1% poverty level for males and 16.9% for females among the residents of Mohave County, 6 to 11 year old males and 16 and 17 year old females are the most vulnerable to poverty, with 2,020 males (30.3%) and 579 females (28.8%) in their respective age groups living below the poverty level.
| Age Bracket | Male | Female |
| Under 5 Years | 958 (22.6%) | 1,141 (27.6%) |
| 5 Years | 195 (24.0%) | 284 (26.7%) |
| 6 to 11 Years | 2,020 (30.3%) | 1,331 (24.3%) |
| 12 to 14 Years | 582 (22.5%) | 671 (21.9%) |
| 15 Years | 258 (23.9%) | 88 (8.2%) |
| 16 and 17 Years | 677 (29.3%) | 579 (28.8%) |
| 18 to 24 Years | 1,224 (18.4%) | 1,722 (28.1%) |
| 25 to 34 Years | 1,543 (14.0%) | 1,823 (18.3%) |
| 35 to 44 Years | 1,125 (11.4%) | 1,785 (19.4%) |
| 45 to 54 Years | 1,864 (17.3%) | 1,867 (16.9%) |
| 55 to 64 Years | 2,982 (18.0%) | 2,764 (15.4%) |
| 65 to 74 Years | 1,454 (7.8%) | 2,267 (11.9%) |
| 75 Years and over | 1,032 (7.3%) | 1,361 (9.6%) |
| Total | 15,914 (15.1%) | 17,683 (16.9%) |
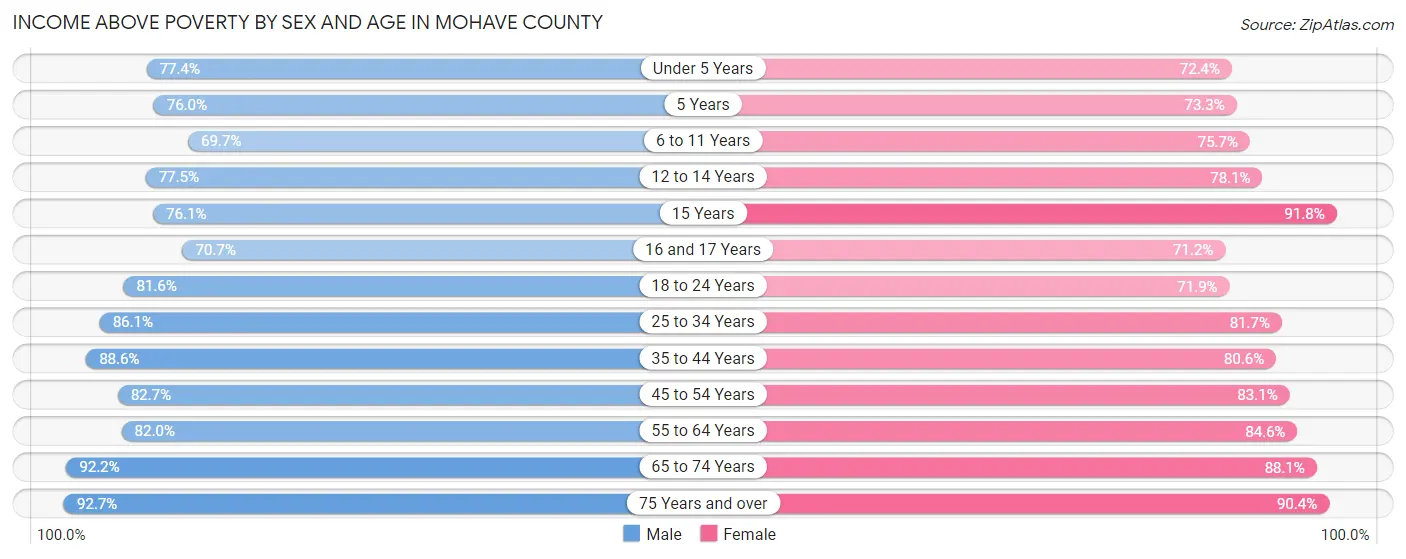
Income Above Poverty by Sex and Age in Mohave County
According to the poverty statistics in Mohave County, males aged 75 years and over and females aged 15 years are the age groups that are most secure financially, with 92.7% of males and 91.8% of females in these age groups living above the poverty line.
| Age Bracket | Male | Female |
| Under 5 Years | 3,274 (77.4%) | 2,993 (72.4%) |
| 5 Years | 618 (76.0%) | 778 (73.3%) |
| 6 to 11 Years | 4,638 (69.7%) | 4,152 (75.7%) |
| 12 to 14 Years | 2,006 (77.5%) | 2,388 (78.1%) |
| 15 Years | 823 (76.1%) | 991 (91.8%) |
| 16 and 17 Years | 1,633 (70.7%) | 1,428 (71.2%) |
| 18 to 24 Years | 5,442 (81.6%) | 4,415 (71.9%) |
| 25 to 34 Years | 9,514 (86.1%) | 8,109 (81.7%) |
| 35 to 44 Years | 8,709 (88.6%) | 7,415 (80.6%) |
| 45 to 54 Years | 8,915 (82.7%) | 9,176 (83.1%) |
| 55 to 64 Years | 13,573 (82.0%) | 15,154 (84.6%) |
| 65 to 74 Years | 17,280 (92.2%) | 16,854 (88.1%) |
| 75 Years and over | 13,114 (92.7%) | 12,859 (90.4%) |
| Total | 89,539 (84.9%) | 86,712 (83.1%) |
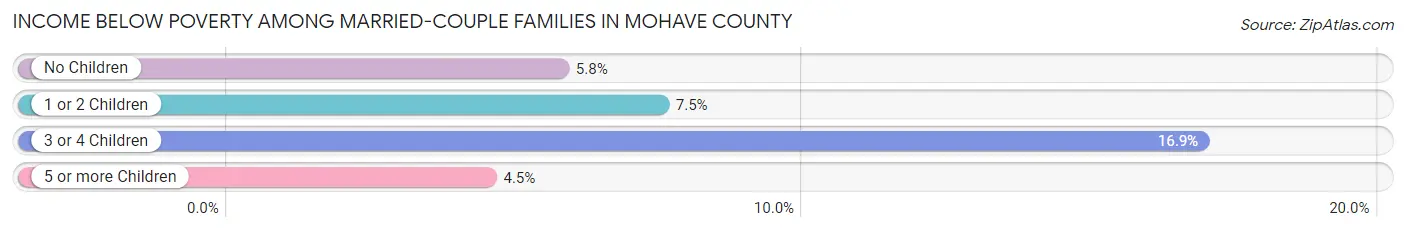
Income Below Poverty Among Married-Couple Families in Mohave County
The poverty statistics for married-couple families in Mohave County show that 6.6% or 2,886 of the total 43,489 families live below the poverty line. Families with 3 or 4 children have the highest poverty rate of 16.9%, comprising of 378 families. On the other hand, families with 5 or more children have the lowest poverty rate of 4.5%, which includes 14 families.
| Children | Above Poverty | Below Poverty |
| No Children | 31,220 (94.2%) | 1,908 (5.8%) |
| 1 or 2 Children | 7,230 (92.5%) | 586 (7.5%) |
| 3 or 4 Children | 1,856 (83.1%) | 378 (16.9%) |
| 5 or more Children | 297 (95.5%) | 14 (4.5%) |
| Total | 40,603 (93.4%) | 2,886 (6.6%) |
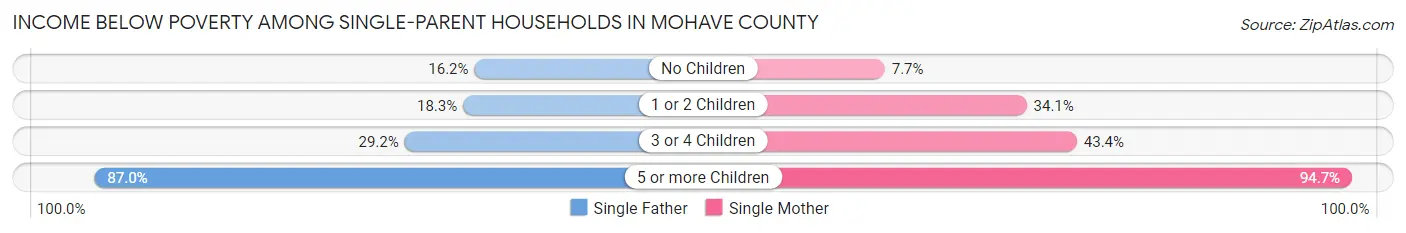
Income Below Poverty Among Single-Parent Households in Mohave County
According to the poverty data in Mohave County, 19.8% or 1,150 single-father households and 24.5% or 2,498 single-mother households are living below the poverty line. Among single-father households, those with 5 or more children have the highest poverty rate, with 127 households (87.0%) experiencing poverty. Likewise, among single-mother households, those with 5 or more children have the highest poverty rate, with 355 households (94.7%) falling below the poverty line.
| Children | Single Father | Single Mother |
| No Children | 478 (16.2%) | 371 (7.7%) |
| 1 or 2 Children | 419 (18.3%) | 1,418 (34.1%) |
| 3 or 4 Children | 126 (29.2%) | 354 (43.4%) |
| 5 or more Children | 127 (87.0%) | 355 (94.7%) |
| Total | 1,150 (19.8%) | 2,498 (24.5%) |
Income Below Poverty Among Married-Couple vs Single-Parent Households in Mohave County
The poverty data for Mohave County shows that 2,886 of the married-couple family households (6.6%) and 3,648 of the single-parent households (22.8%) are living below the poverty level. Within the married-couple family households, those with 3 or 4 children have the highest poverty rate, with 378 households (16.9%) falling below the poverty line. Among the single-parent households, those with 5 or more children have the highest poverty rate, with 482 household (92.5%) living below poverty.
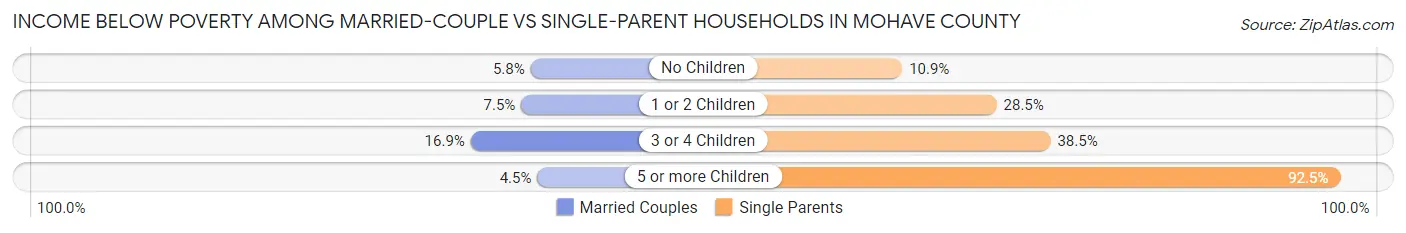
| Children | Married-Couple Families | Single-Parent Households |
| No Children | 1,908 (5.8%) | 849 (10.9%) |
| 1 or 2 Children | 586 (7.5%) | 1,837 (28.5%) |
| 3 or 4 Children | 378 (16.9%) | 480 (38.5%) |
| 5 or more Children | 14 (4.5%) | 482 (92.5%) |
| Total | 2,886 (6.6%) | 3,648 (22.8%) |
Employment Characteristics in Mohave County
Employment by Class of Employer in Mohave County
Among the 74,493 employed individuals in Mohave County, private company employees (49,891 | 67.0%), local government employees (6,974 | 9.4%), and self-employed (not incorporated) (5,375 | 7.2%) make up the most common classes of employment.
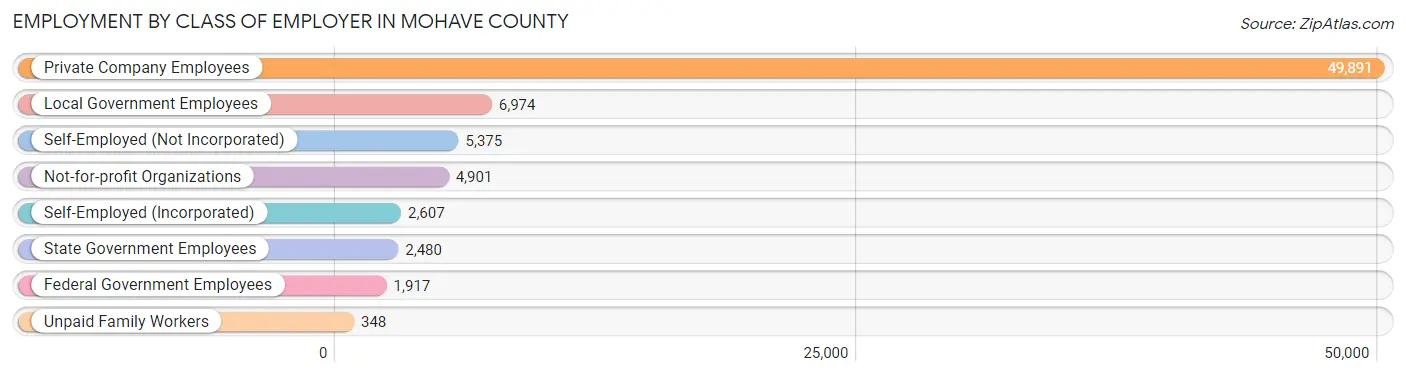
| Employer Class | # Employees | % Employees |
| Private Company Employees | 49,891 | 67.0% |
| Self-Employed (Incorporated) | 2,607 | 3.5% |
| Self-Employed (Not Incorporated) | 5,375 | 7.2% |
| Not-for-profit Organizations | 4,901 | 6.6% |
| Local Government Employees | 6,974 | 9.4% |
| State Government Employees | 2,480 | 3.3% |
| Federal Government Employees | 1,917 | 2.6% |
| Unpaid Family Workers | 348 | 0.5% |
| Total | 74,493 | 100.0% |
Employment Status by Age in Mohave County
According to the labor force statistics for Mohave County, out of the total population over 16 years of age (183,139), 44.8% or 82,046 individuals are in the labor force, with 7.5% or 6,153 of them unemployed. The age group with the highest labor force participation rate is 25 to 29 years, with 80.7% or 8,672 individuals in the labor force. Within the labor force, the 16 to 19 years age range has the highest percentage of unemployed individuals, with 23.3% or 759 of them being unemployed.
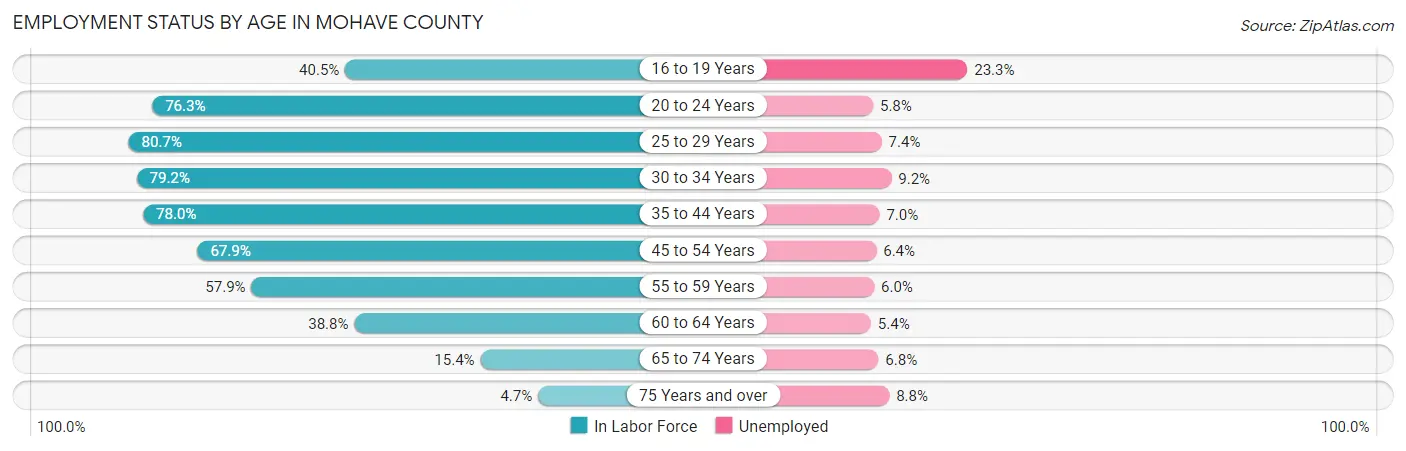
| Age Bracket | In Labor Force | Unemployed |
| 16 to 19 Years | 3,257 (40.5%) | 759 (23.3%) |
| 20 to 24 Years | 7,129 (76.3%) | 413 (5.8%) |
| 25 to 29 Years | 8,672 (80.7%) | 642 (7.4%) |
| 30 to 34 Years | 8,827 (79.2%) | 812 (9.2%) |
| 35 to 44 Years | 15,436 (78.0%) | 1,081 (7.0%) |
| 45 to 54 Years | 15,140 (67.9%) | 969 (6.4%) |
| 55 to 59 Years | 8,864 (57.9%) | 532 (6.0%) |
| 60 to 64 Years | 7,559 (38.8%) | 408 (5.4%) |
| 65 to 74 Years | 5,868 (15.4%) | 399 (6.8%) |
| 75 Years and over | 1,357 (4.7%) | 119 (8.8%) |
| Total | 82,046 (44.8%) | 6,153 (7.5%) |
Employment Status by Educational Attainment in Mohave County
According to labor force statistics for Mohave County, 65.3% of individuals (64,497) out of the total population between 25 and 64 years of age (98,770) are in the labor force, with 6.9% or 4,450 of them being unemployed. The group with the highest labor force participation rate are those with the educational attainment of bachelor's degree or higher, with 76.3% or 11,107 individuals in the labor force. Within the labor force, individuals with less than high school education have the highest percentage of unemployment, with 11.8% or 818 of them being unemployed.
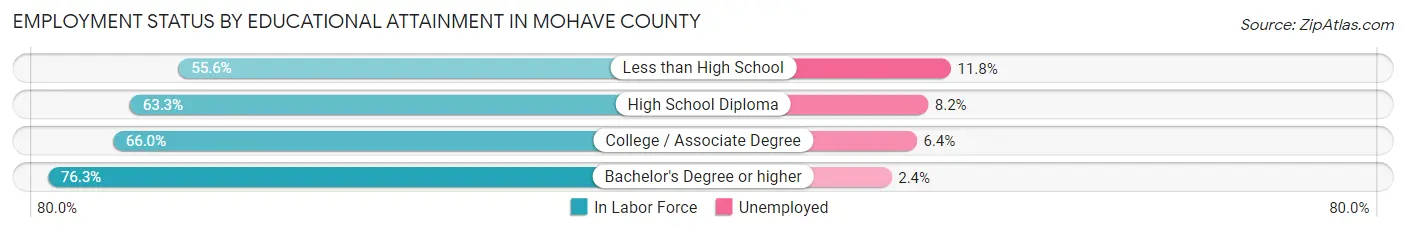
| Educational Attainment | In Labor Force | Unemployed |
| Less than High School | 6,933 (55.6%) | 1,471 (11.8%) |
| High School Diploma | 20,992 (63.3%) | 2,719 (8.2%) |
| College / Associate Degree | 25,464 (66.0%) | 2,469 (6.4%) |
| Bachelor's Degree or higher | 11,107 (76.3%) | 349 (2.4%) |
| Total | 64,497 (65.3%) | 6,815 (6.9%) |
Employment Occupations by Sex in Mohave County
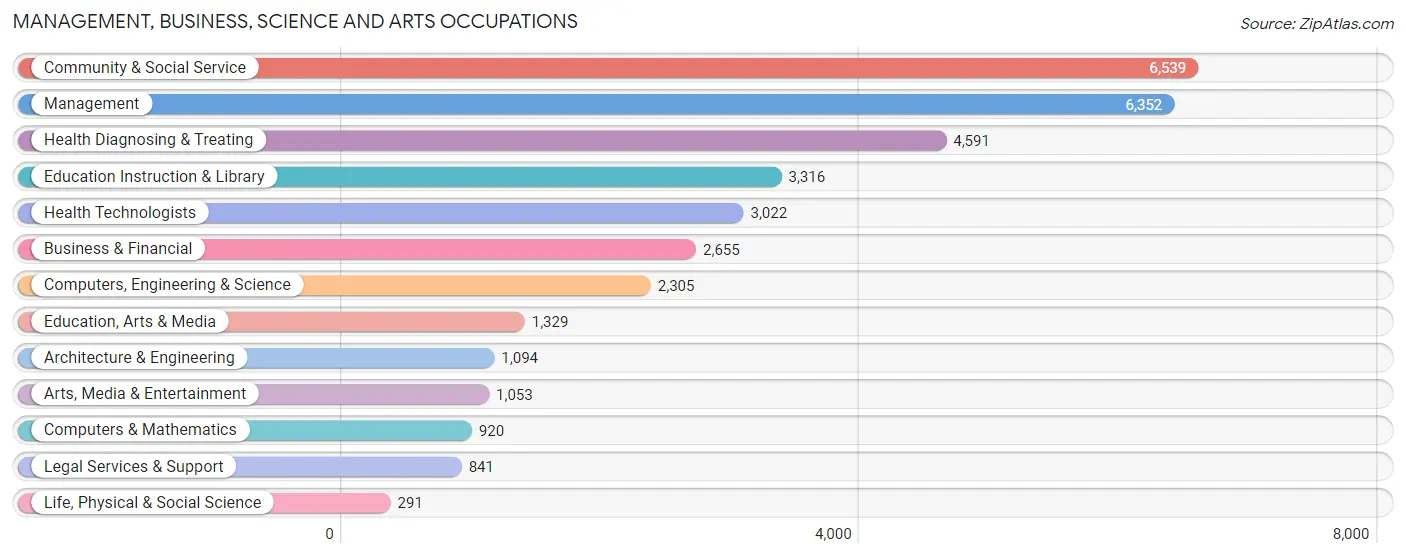
Management, Business, Science and Arts Occupations
The most common Management, Business, Science and Arts occupations in Mohave County are Community & Social Service (6,539 | 8.6%), Management (6,352 | 8.4%), Health Diagnosing & Treating (4,591 | 6.0%), Education Instruction & Library (3,316 | 4.4%), and Health Technologists (3,022 | 4.0%).
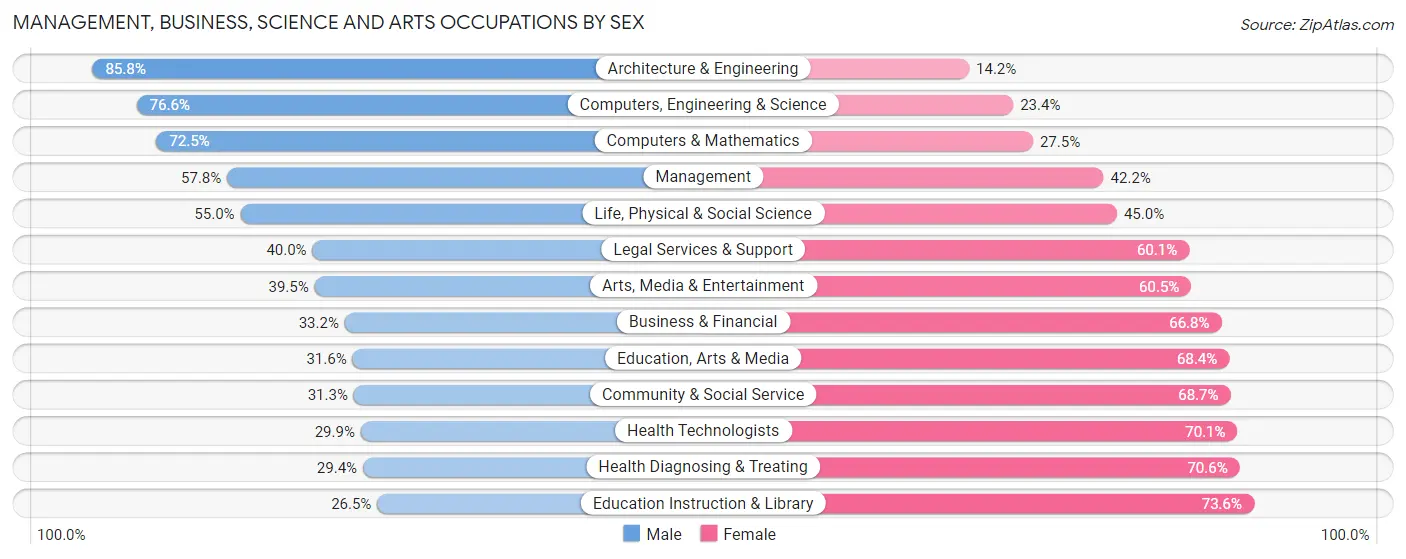
Management, Business, Science and Arts Occupations by Sex
Within the Management, Business, Science and Arts occupations in Mohave County, the most male-oriented occupations are Architecture & Engineering (85.8%), Computers, Engineering & Science (76.6%), and Computers & Mathematics (72.5%), while the most female-oriented occupations are Education Instruction & Library (73.6%), Health Diagnosing & Treating (70.6%), and Health Technologists (70.1%).
| Occupation | Male | Female |
| Management | 3,669 (57.8%) | 2,683 (42.2%) |
| Business & Financial | 882 (33.2%) | 1,773 (66.8%) |
| Computers, Engineering & Science | 1,766 (76.6%) | 539 (23.4%) |
| Computers & Mathematics | 667 (72.5%) | 253 (27.5%) |
| Architecture & Engineering | 939 (85.8%) | 155 (14.2%) |
| Life, Physical & Social Science | 160 (55.0%) | 131 (45.0%) |
| Community & Social Service | 2,049 (31.3%) | 4,490 (68.7%) |
| Education, Arts & Media | 420 (31.6%) | 909 (68.4%) |
| Legal Services & Support | 336 (40.0%) | 505 (60.1%) |
| Education Instruction & Library | 877 (26.5%) | 2,439 (73.6%) |
| Arts, Media & Entertainment | 416 (39.5%) | 637 (60.5%) |
| Health Diagnosing & Treating | 1,351 (29.4%) | 3,240 (70.6%) |
| Health Technologists | 903 (29.9%) | 2,119 (70.1%) |
| Total (Category) | 9,717 (43.3%) | 12,725 (56.7%) |
| Total (Overall) | 39,456 (52.0%) | 36,409 (48.0%) |
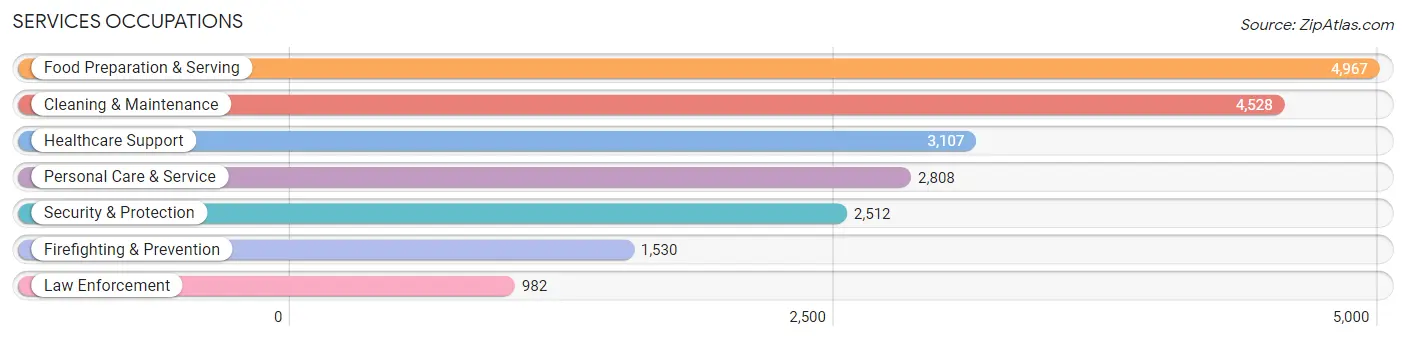
Services Occupations
The most common Services occupations in Mohave County are Food Preparation & Serving (4,967 | 6.6%), Cleaning & Maintenance (4,528 | 6.0%), Healthcare Support (3,107 | 4.1%), Personal Care & Service (2,808 | 3.7%), and Security & Protection (2,512 | 3.3%).
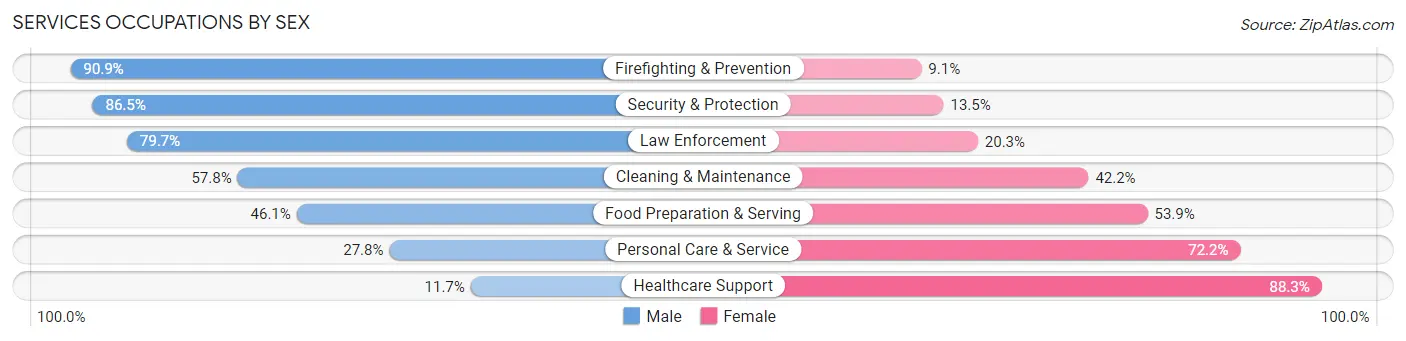
Services Occupations by Sex
Within the Services occupations in Mohave County, the most male-oriented occupations are Firefighting & Prevention (90.9%), Security & Protection (86.5%), and Law Enforcement (79.7%), while the most female-oriented occupations are Healthcare Support (88.3%), Personal Care & Service (72.2%), and Food Preparation & Serving (53.9%).
| Occupation | Male | Female |
| Healthcare Support | 363 (11.7%) | 2,744 (88.3%) |
| Security & Protection | 2,174 (86.5%) | 338 (13.5%) |
| Firefighting & Prevention | 1,391 (90.9%) | 139 (9.1%) |
| Law Enforcement | 783 (79.7%) | 199 (20.3%) |
| Food Preparation & Serving | 2,292 (46.1%) | 2,675 (53.9%) |
| Cleaning & Maintenance | 2,619 (57.8%) | 1,909 (42.2%) |
| Personal Care & Service | 780 (27.8%) | 2,028 (72.2%) |
| Total (Category) | 8,228 (45.9%) | 9,694 (54.1%) |
| Total (Overall) | 39,456 (52.0%) | 36,409 (48.0%) |
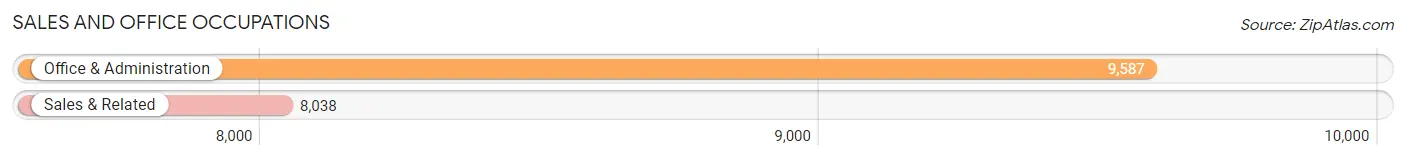
Sales and Office Occupations
The most common Sales and Office occupations in Mohave County are Office & Administration (9,587 | 12.6%), and Sales & Related (8,038 | 10.6%).
Sales and Office Occupations by Sex
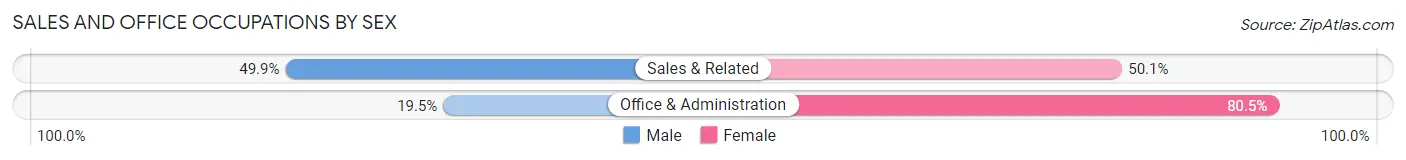
| Occupation | Male | Female |
| Sales & Related | 4,008 (49.9%) | 4,030 (50.1%) |
| Office & Administration | 1,869 (19.5%) | 7,718 (80.5%) |
| Total (Category) | 5,877 (33.3%) | 11,748 (66.7%) |
| Total (Overall) | 39,456 (52.0%) | 36,409 (48.0%) |
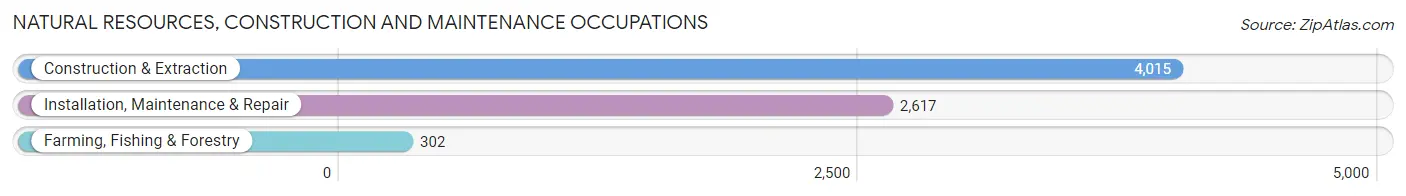
Natural Resources, Construction and Maintenance Occupations
The most common Natural Resources, Construction and Maintenance occupations in Mohave County are Construction & Extraction (4,015 | 5.3%), Installation, Maintenance & Repair (2,617 | 3.5%), and Farming, Fishing & Forestry (302 | 0.4%).
Natural Resources, Construction and Maintenance Occupations by Sex
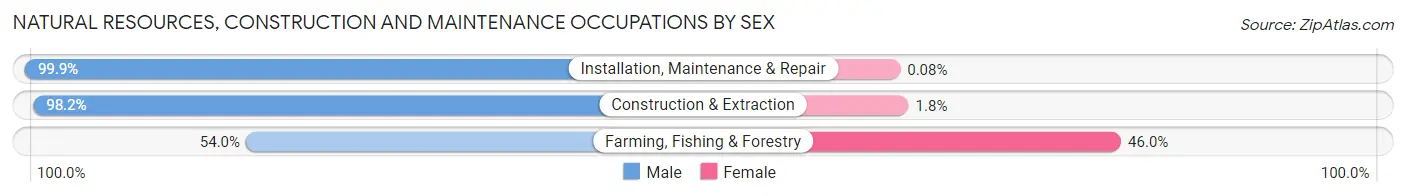
| Occupation | Male | Female |
| Farming, Fishing & Forestry | 163 (54.0%) | 139 (46.0%) |
| Construction & Extraction | 3,942 (98.2%) | 73 (1.8%) |
| Installation, Maintenance & Repair | 2,615 (99.9%) | 2 (0.1%) |
| Total (Category) | 6,720 (96.9%) | 214 (3.1%) |
| Total (Overall) | 39,456 (52.0%) | 36,409 (48.0%) |
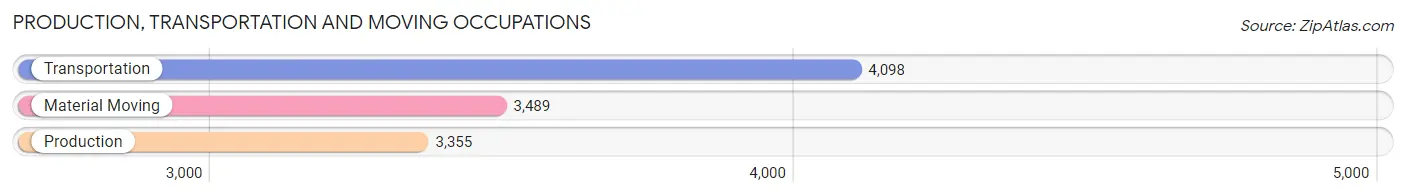
Production, Transportation and Moving Occupations
The most common Production, Transportation and Moving occupations in Mohave County are Transportation (4,098 | 5.4%), Material Moving (3,489 | 4.6%), and Production (3,355 | 4.4%).
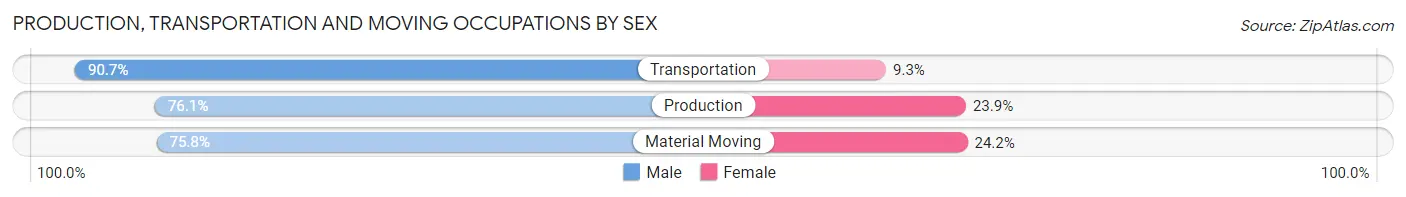
Production, Transportation and Moving Occupations by Sex
| Occupation | Male | Female |
| Production | 2,552 (76.1%) | 803 (23.9%) |
| Transportation | 3,718 (90.7%) | 380 (9.3%) |
| Material Moving | 2,644 (75.8%) | 845 (24.2%) |
| Total (Category) | 8,914 (81.5%) | 2,028 (18.5%) |
| Total (Overall) | 39,456 (52.0%) | 36,409 (48.0%) |
Employment Industries by Sex in Mohave County
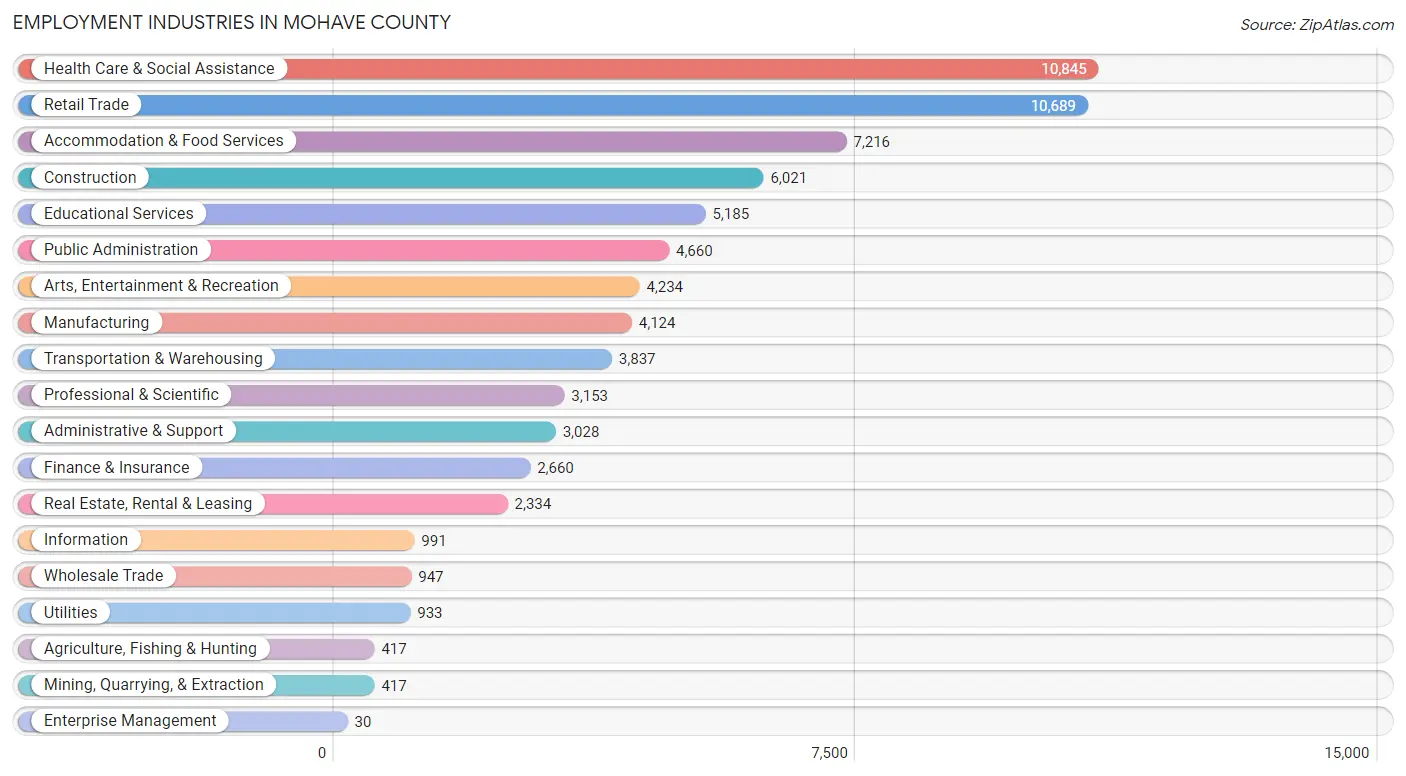
Employment Industries in Mohave County
The major employment industries in Mohave County include Health Care & Social Assistance (10,845 | 14.3%), Retail Trade (10,689 | 14.1%), Accommodation & Food Services (7,216 | 9.5%), Construction (6,021 | 7.9%), and Educational Services (5,185 | 6.8%).
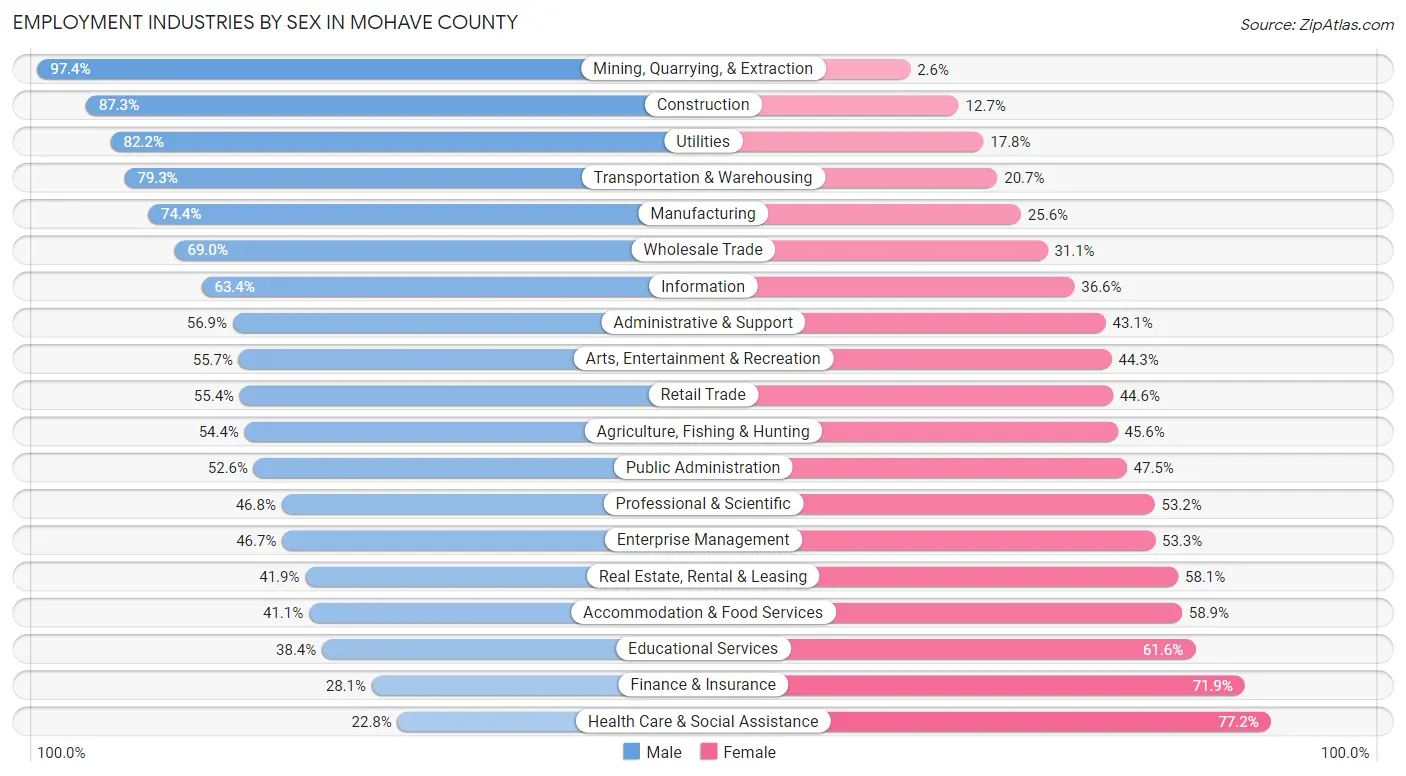
Employment Industries by Sex in Mohave County
The Mohave County industries that see more men than women are Mining, Quarrying, & Extraction (97.4%), Construction (87.3%), and Utilities (82.2%), whereas the industries that tend to have a higher number of women are Health Care & Social Assistance (77.2%), Finance & Insurance (71.9%), and Educational Services (61.6%).
| Industry | Male | Female |
| Agriculture, Fishing & Hunting | 227 (54.4%) | 190 (45.6%) |
| Mining, Quarrying, & Extraction | 406 (97.4%) | 11 (2.6%) |
| Construction | 5,258 (87.3%) | 763 (12.7%) |
| Manufacturing | 3,070 (74.4%) | 1,054 (25.6%) |
| Wholesale Trade | 653 (69.0%) | 294 (31.0%) |
| Retail Trade | 5,925 (55.4%) | 4,764 (44.6%) |
| Transportation & Warehousing | 3,044 (79.3%) | 793 (20.7%) |
| Utilities | 767 (82.2%) | 166 (17.8%) |
| Information | 628 (63.4%) | 363 (36.6%) |
| Finance & Insurance | 748 (28.1%) | 1,912 (71.9%) |
| Real Estate, Rental & Leasing | 978 (41.9%) | 1,356 (58.1%) |
| Professional & Scientific | 1,475 (46.8%) | 1,678 (53.2%) |
| Enterprise Management | 14 (46.7%) | 16 (53.3%) |
| Administrative & Support | 1,723 (56.9%) | 1,305 (43.1%) |
| Educational Services | 1,992 (38.4%) | 3,193 (61.6%) |
| Health Care & Social Assistance | 2,472 (22.8%) | 8,373 (77.2%) |
| Arts, Entertainment & Recreation | 2,357 (55.7%) | 1,877 (44.3%) |
| Accommodation & Food Services | 2,968 (41.1%) | 4,248 (58.9%) |
| Public Administration | 2,449 (52.5%) | 2,211 (47.4%) |
| Total | 39,456 (52.0%) | 36,409 (48.0%) |
Education in Mohave County
School Enrollment in Mohave County
The most common levels of schooling among the 34,958 students in Mohave County are middle school (8,217 | 23.5%), high school (7,835 | 22.4%), and elementary school (7,646 | 21.9%).
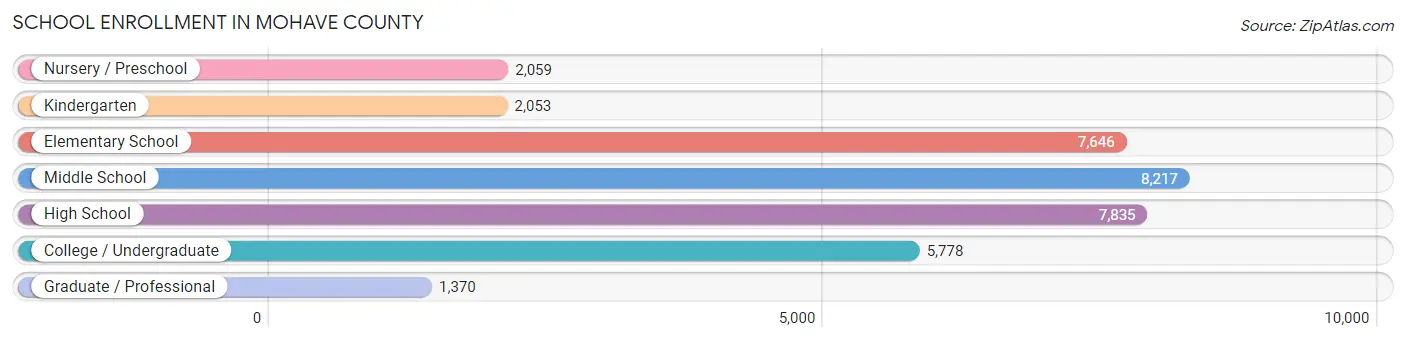
| School Level | # Students | % Students |
| Nursery / Preschool | 2,059 | 5.9% |
| Kindergarten | 2,053 | 5.9% |
| Elementary School | 7,646 | 21.9% |
| Middle School | 8,217 | 23.5% |
| High School | 7,835 | 22.4% |
| College / Undergraduate | 5,778 | 16.5% |
| Graduate / Professional | 1,370 | 3.9% |
| Total | 34,958 | 100.0% |
School Enrollment by Age by Funding Source in Mohave County
Out of a total of 34,958 students who are enrolled in schools in Mohave County, 5,209 (14.9%) attend a private institution, while the remaining 29,749 (85.1%) are enrolled in public schools. The age group of 3 to 4 year olds has the highest likelihood of being enrolled in private schools, with 405 (28.8% in the age bracket) enrolled. Conversely, the age group of 25 to 34 year olds has the lowest likelihood of being enrolled in a private school, with 2,193 (90.7% in the age bracket) attending a public institution.
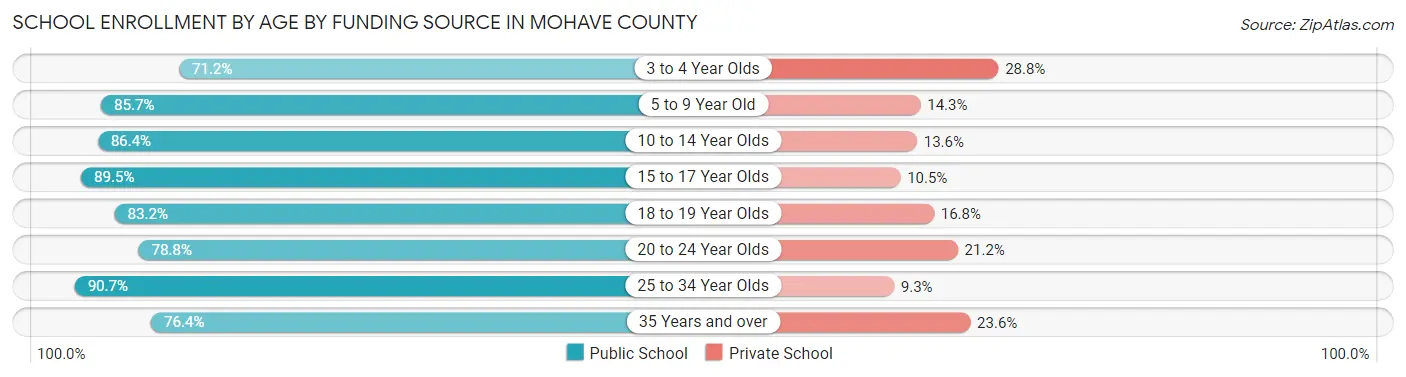
| Age Bracket | Public School | Private School |
| 3 to 4 Year Olds | 1,002 (71.2%) | 405 (28.8%) |
| 5 to 9 Year Old | 8,028 (85.7%) | 1,336 (14.3%) |
| 10 to 14 Year Olds | 8,305 (86.4%) | 1,309 (13.6%) |
| 15 to 17 Year Olds | 5,225 (89.5%) | 615 (10.5%) |
| 18 to 19 Year Olds | 1,533 (83.2%) | 309 (16.8%) |
| 20 to 24 Year Olds | 1,647 (78.8%) | 444 (21.2%) |
| 25 to 34 Year Olds | 2,193 (90.7%) | 226 (9.3%) |
| 35 Years and over | 1,820 (76.4%) | 561 (23.6%) |
| Total | 29,749 (85.1%) | 5,209 (14.9%) |
Educational Attainment by Field of Study in Mohave County
Business (5,056 | 19.9%), education (4,436 | 17.4%), science & technology (3,089 | 12.1%), bio, nature & agricultural (1,768 | 6.9%), and arts & humanities (1,701 | 6.7%) are the most common fields of study among 25,466 individuals in Mohave County who have obtained a bachelor's degree or higher.
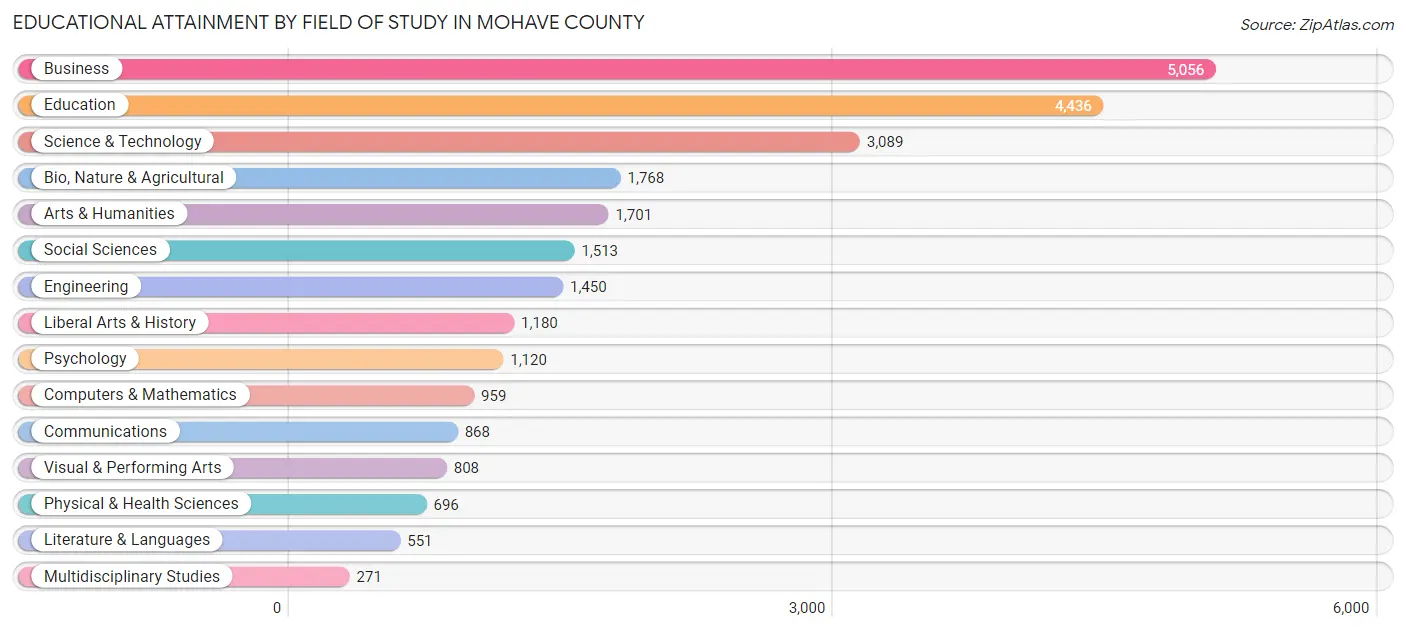
| Field of Study | # Graduates | % Graduates |
| Computers & Mathematics | 959 | 3.8% |
| Bio, Nature & Agricultural | 1,768 | 6.9% |
| Physical & Health Sciences | 696 | 2.7% |
| Psychology | 1,120 | 4.4% |
| Social Sciences | 1,513 | 5.9% |
| Engineering | 1,450 | 5.7% |
| Multidisciplinary Studies | 271 | 1.1% |
| Science & Technology | 3,089 | 12.1% |
| Business | 5,056 | 19.9% |
| Education | 4,436 | 17.4% |
| Literature & Languages | 551 | 2.2% |
| Liberal Arts & History | 1,180 | 4.6% |
| Visual & Performing Arts | 808 | 3.2% |
| Communications | 868 | 3.4% |
| Arts & Humanities | 1,701 | 6.7% |
| Total | 25,466 | 100.0% |
Transportation & Commute in Mohave County
Vehicle Availability by Sex in Mohave County
The most prevalent vehicle ownership categories in Mohave County are males with 2 vehicles (15,219, accounting for 39.0%) and females with 2 vehicles (13,545, making up 43.0%).
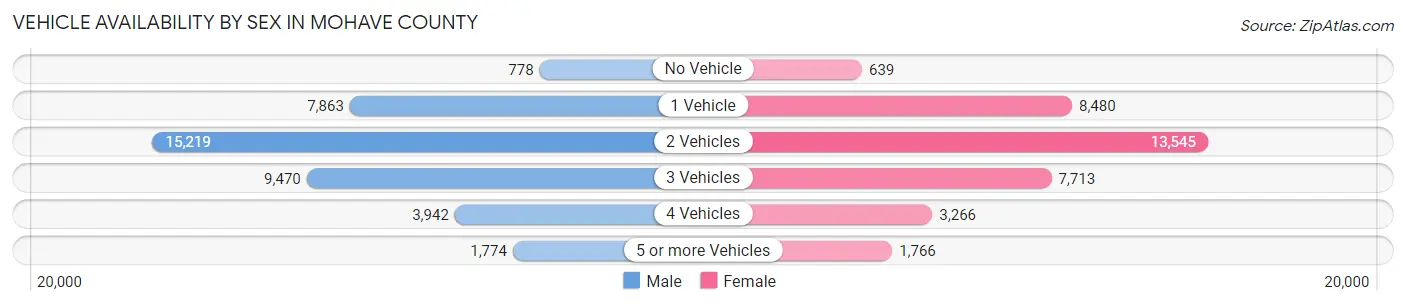
| Vehicles Available | Male | Female |
| No Vehicle | 778 (2.0%) | 639 (1.8%) |
| 1 Vehicle | 7,863 (20.1%) | 8,480 (23.9%) |
| 2 Vehicles | 15,219 (39.0%) | 13,545 (38.3%) |
| 3 Vehicles | 9,470 (24.2%) | 7,713 (21.8%) |
| 4 Vehicles | 3,942 (10.1%) | 3,266 (9.2%) |
| 5 or more Vehicles | 1,774 (4.5%) | 1,766 (5.0%) |
| Total | 39,046 (100.0%) | 35,409 (100.0%) |
Commute Time in Mohave County
The most frequently occuring commute durations in Mohave County are 10 to 14 minutes (17,088 commuters, 24.5%), 15 to 19 minutes (12,801 commuters, 18.4%), and 5 to 9 minutes (11,469 commuters, 16.5%).
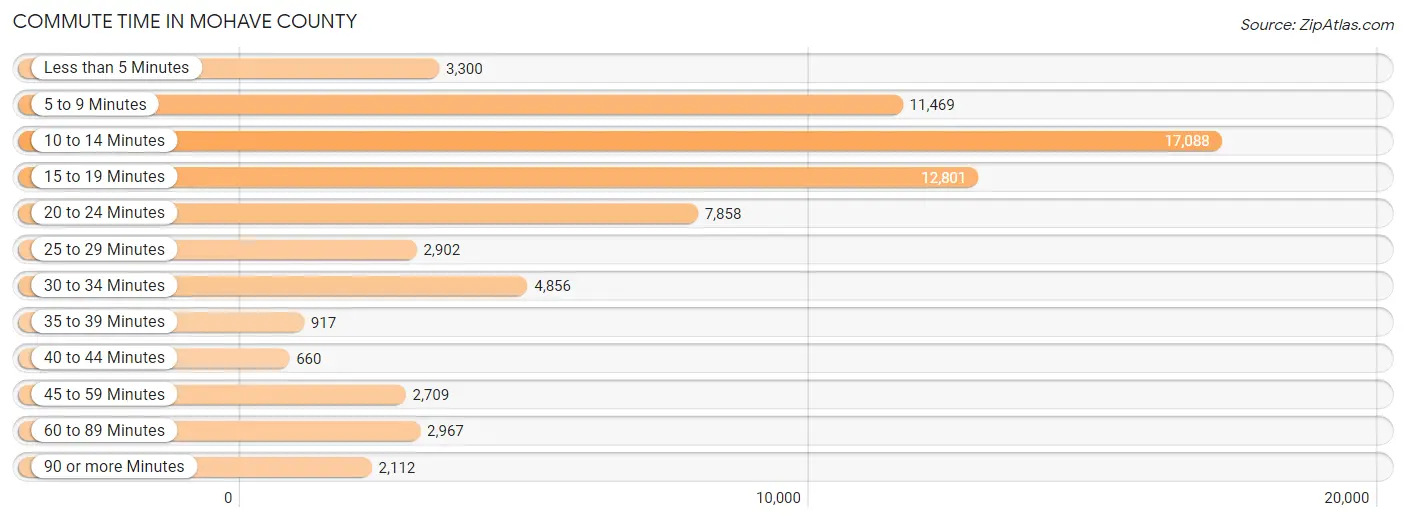
| Commute Time | # Commuters | % Commuters |
| Less than 5 Minutes | 3,300 | 4.7% |
| 5 to 9 Minutes | 11,469 | 16.5% |
| 10 to 14 Minutes | 17,088 | 24.5% |
| 15 to 19 Minutes | 12,801 | 18.4% |
| 20 to 24 Minutes | 7,858 | 11.3% |
| 25 to 29 Minutes | 2,902 | 4.2% |
| 30 to 34 Minutes | 4,856 | 7.0% |
| 35 to 39 Minutes | 917 | 1.3% |
| 40 to 44 Minutes | 660 | 0.9% |
| 45 to 59 Minutes | 2,709 | 3.9% |
| 60 to 89 Minutes | 2,967 | 4.3% |
| 90 or more Minutes | 2,112 | 3.0% |
Commute Time by Sex in Mohave County
The most common commute times in Mohave County are 10 to 14 minutes (8,491 commuters, 22.9%) for males and 10 to 14 minutes (8,597 commuters, 26.4%) for females.
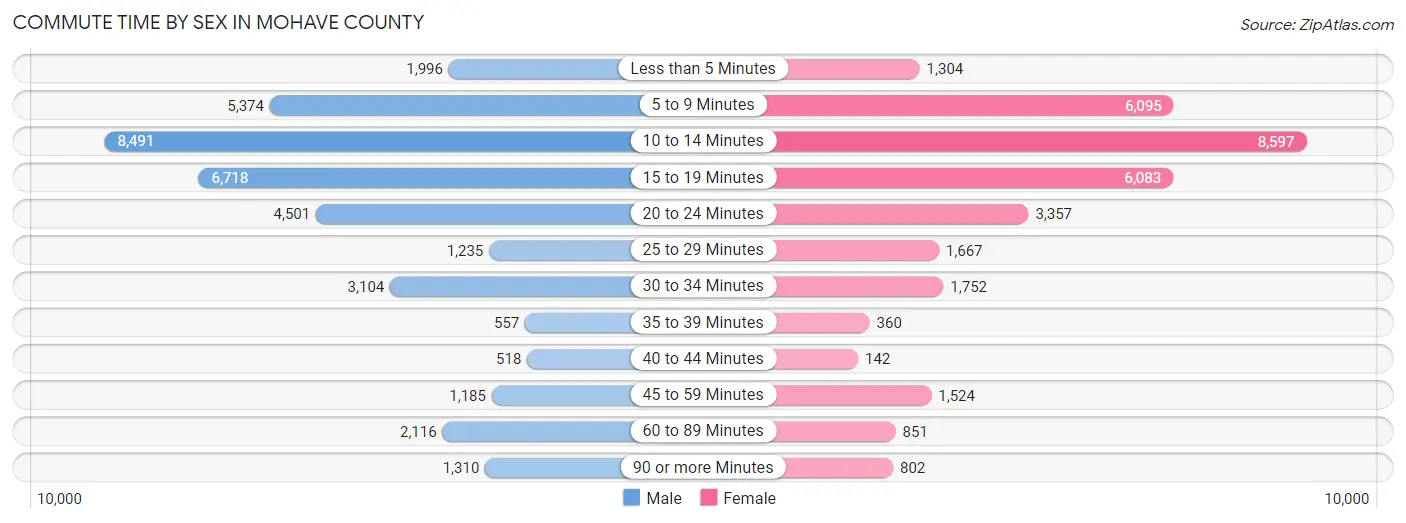
| Commute Time | Male | Female |
| Less than 5 Minutes | 1,996 (5.4%) | 1,304 (4.0%) |
| 5 to 9 Minutes | 5,374 (14.5%) | 6,095 (18.7%) |
| 10 to 14 Minutes | 8,491 (22.9%) | 8,597 (26.4%) |
| 15 to 19 Minutes | 6,718 (18.1%) | 6,083 (18.7%) |
| 20 to 24 Minutes | 4,501 (12.1%) | 3,357 (10.3%) |
| 25 to 29 Minutes | 1,235 (3.3%) | 1,667 (5.1%) |
| 30 to 34 Minutes | 3,104 (8.4%) | 1,752 (5.4%) |
| 35 to 39 Minutes | 557 (1.5%) | 360 (1.1%) |
| 40 to 44 Minutes | 518 (1.4%) | 142 (0.4%) |
| 45 to 59 Minutes | 1,185 (3.2%) | 1,524 (4.7%) |
| 60 to 89 Minutes | 2,116 (5.7%) | 851 (2.6%) |
| 90 or more Minutes | 1,310 (3.5%) | 802 (2.5%) |
Time of Departure to Work by Sex in Mohave County
The most frequent times of departure to work in Mohave County are 7:30 AM to 7:59 AM (4,233, 11.4%) for males and 7:30 AM to 7:59 AM (4,766, 14.6%) for females.
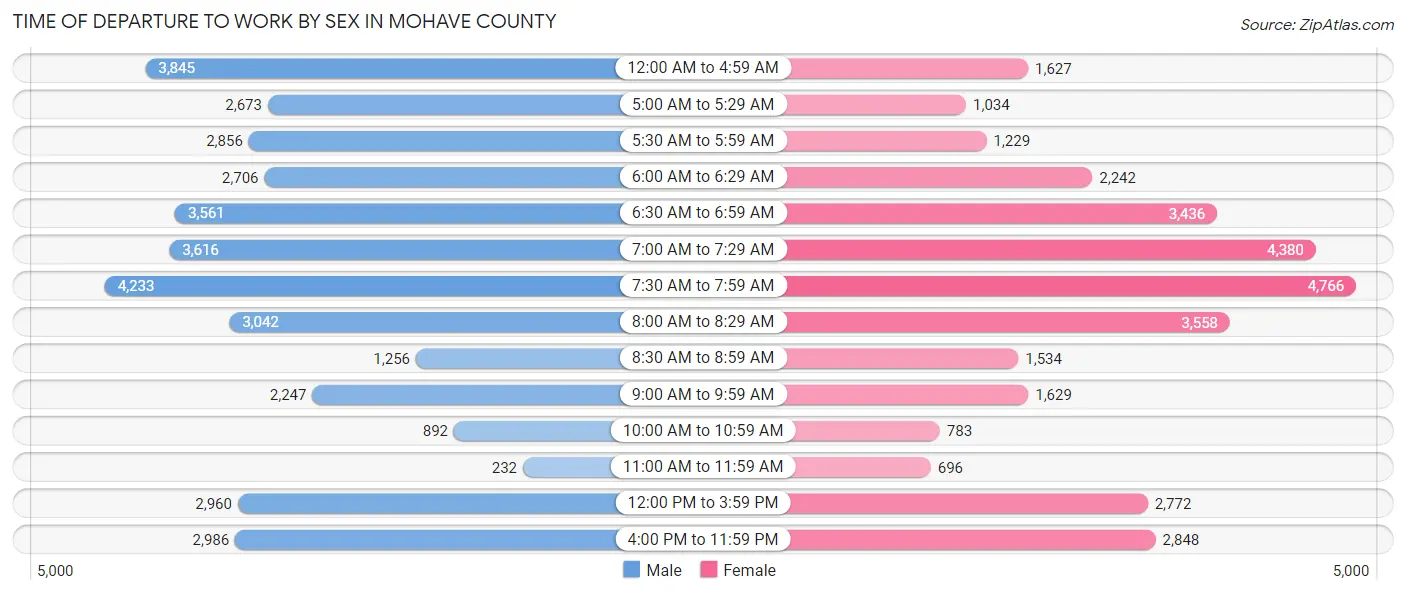
| Time of Departure | Male | Female |
| 12:00 AM to 4:59 AM | 3,845 (10.4%) | 1,627 (5.0%) |
| 5:00 AM to 5:29 AM | 2,673 (7.2%) | 1,034 (3.2%) |
| 5:30 AM to 5:59 AM | 2,856 (7.7%) | 1,229 (3.8%) |
| 6:00 AM to 6:29 AM | 2,706 (7.3%) | 2,242 (6.9%) |
| 6:30 AM to 6:59 AM | 3,561 (9.6%) | 3,436 (10.6%) |
| 7:00 AM to 7:29 AM | 3,616 (9.8%) | 4,380 (13.5%) |
| 7:30 AM to 7:59 AM | 4,233 (11.4%) | 4,766 (14.6%) |
| 8:00 AM to 8:29 AM | 3,042 (8.2%) | 3,558 (10.9%) |
| 8:30 AM to 8:59 AM | 1,256 (3.4%) | 1,534 (4.7%) |
| 9:00 AM to 9:59 AM | 2,247 (6.1%) | 1,629 (5.0%) |
| 10:00 AM to 10:59 AM | 892 (2.4%) | 783 (2.4%) |
| 11:00 AM to 11:59 AM | 232 (0.6%) | 696 (2.1%) |
| 12:00 PM to 3:59 PM | 2,960 (8.0%) | 2,772 (8.5%) |
| 4:00 PM to 11:59 PM | 2,986 (8.1%) | 2,848 (8.7%) |
| Total | 37,105 (100.0%) | 32,534 (100.0%) |
Housing Occupancy in Mohave County
Occupancy by Ownership in Mohave County
Of the total 95,169 dwellings in Mohave County, owner-occupied units account for 69,067 (72.6%), while renter-occupied units make up 26,102 (27.4%).
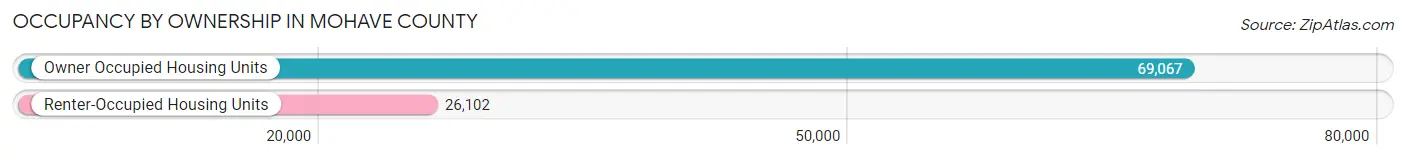
| Occupancy | # Housing Units | % Housing Units |
| Owner Occupied Housing Units | 69,067 | 72.6% |
| Renter-Occupied Housing Units | 26,102 | 27.4% |
| Total Occupied Housing Units | 95,169 | 100.0% |
Occupancy by Household Size in Mohave County
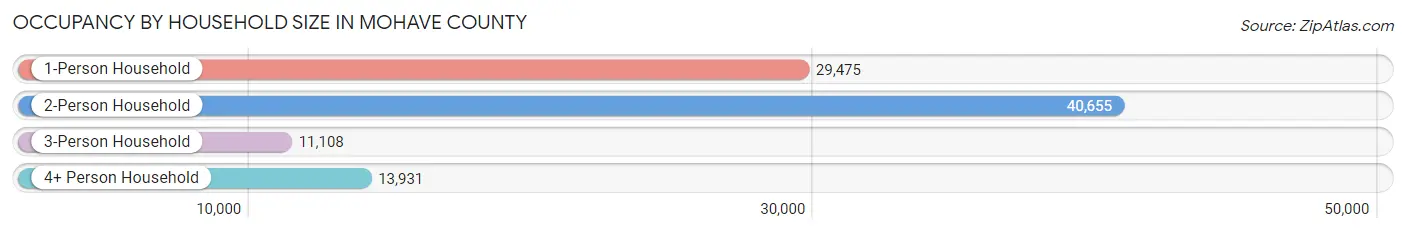
| Household Size | # Housing Units | % Housing Units |
| 1-Person Household | 29,475 | 31.0% |
| 2-Person Household | 40,655 | 42.7% |
| 3-Person Household | 11,108 | 11.7% |
| 4+ Person Household | 13,931 | 14.6% |
| Total Housing Units | 95,169 | 100.0% |
Occupancy by Ownership by Household Size in Mohave County
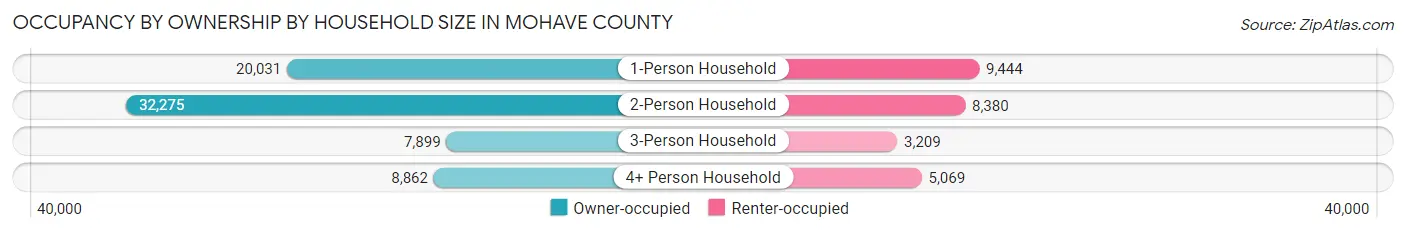
| Household Size | Owner-occupied | Renter-occupied |
| 1-Person Household | 20,031 (68.0%) | 9,444 (32.0%) |
| 2-Person Household | 32,275 (79.4%) | 8,380 (20.6%) |
| 3-Person Household | 7,899 (71.1%) | 3,209 (28.9%) |
| 4+ Person Household | 8,862 (63.6%) | 5,069 (36.4%) |
| Total Housing Units | 69,067 (72.6%) | 26,102 (27.4%) |
Occupancy by Educational Attainment in Mohave County
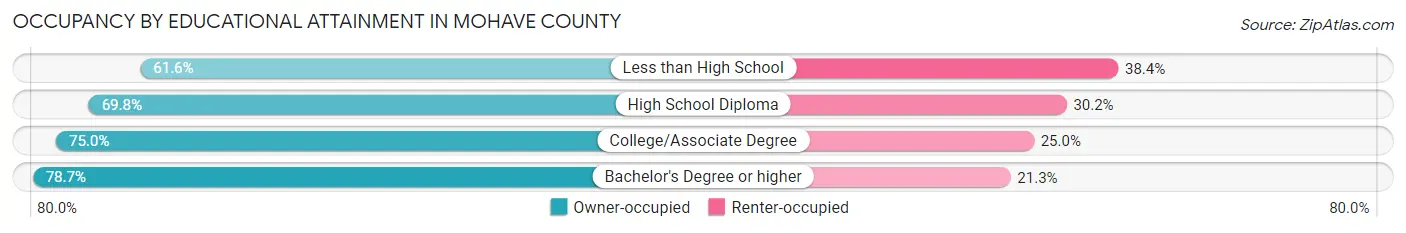
| Household Size | Owner-occupied | Renter-occupied |
| Less than High School | 6,121 (61.6%) | 3,811 (38.4%) |
| High School Diploma | 20,839 (69.8%) | 9,009 (30.2%) |
| College/Associate Degree | 30,238 (75.0%) | 10,072 (25.0%) |
| Bachelor's Degree or higher | 11,869 (78.7%) | 3,210 (21.3%) |
Occupancy by Age of Householder in Mohave County
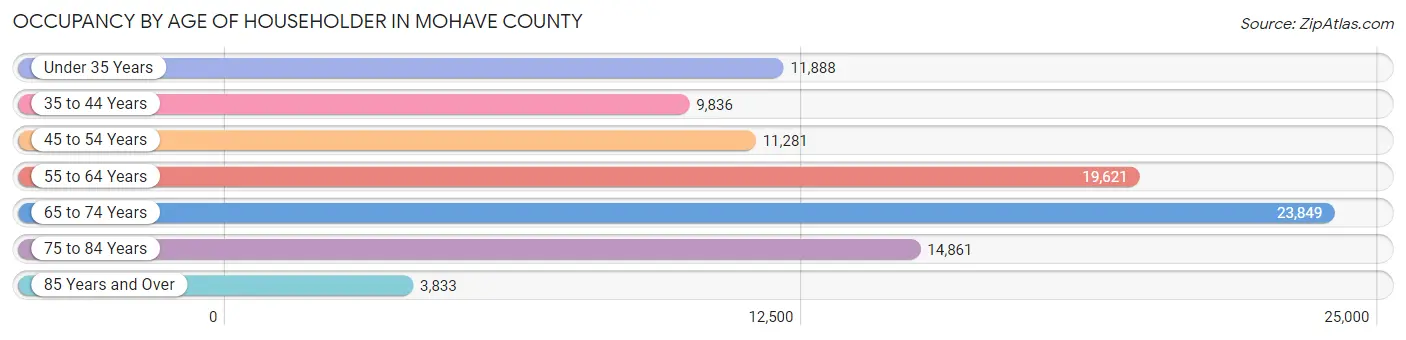
| Age Bracket | # Households | % Households |
| Under 35 Years | 11,888 | 12.5% |
| 35 to 44 Years | 9,836 | 10.3% |
| 45 to 54 Years | 11,281 | 11.8% |
| 55 to 64 Years | 19,621 | 20.6% |
| 65 to 74 Years | 23,849 | 25.1% |
| 75 to 84 Years | 14,861 | 15.6% |
| 85 Years and Over | 3,833 | 4.0% |
| Total | 95,169 | 100.0% |
Housing Finances in Mohave County
Median Income by Occupancy in Mohave County
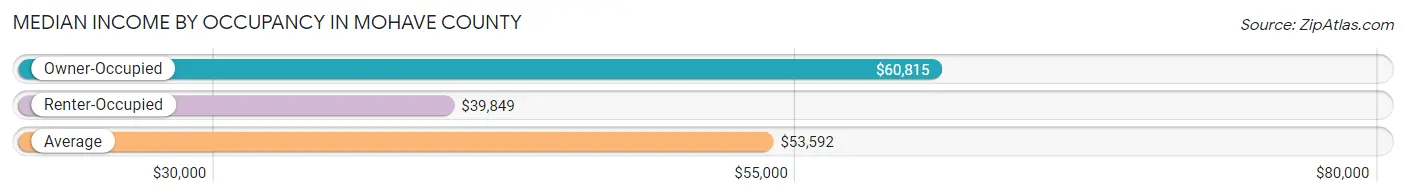
| Occupancy Type | # Households | Median Income |
| Owner-Occupied | 69,067 (72.6%) | $60,815 |
| Renter-Occupied | 26,102 (27.4%) | $39,849 |
| Average | 95,169 (100.0%) | $53,592 |
Occupancy by Householder Income Bracket in Mohave County
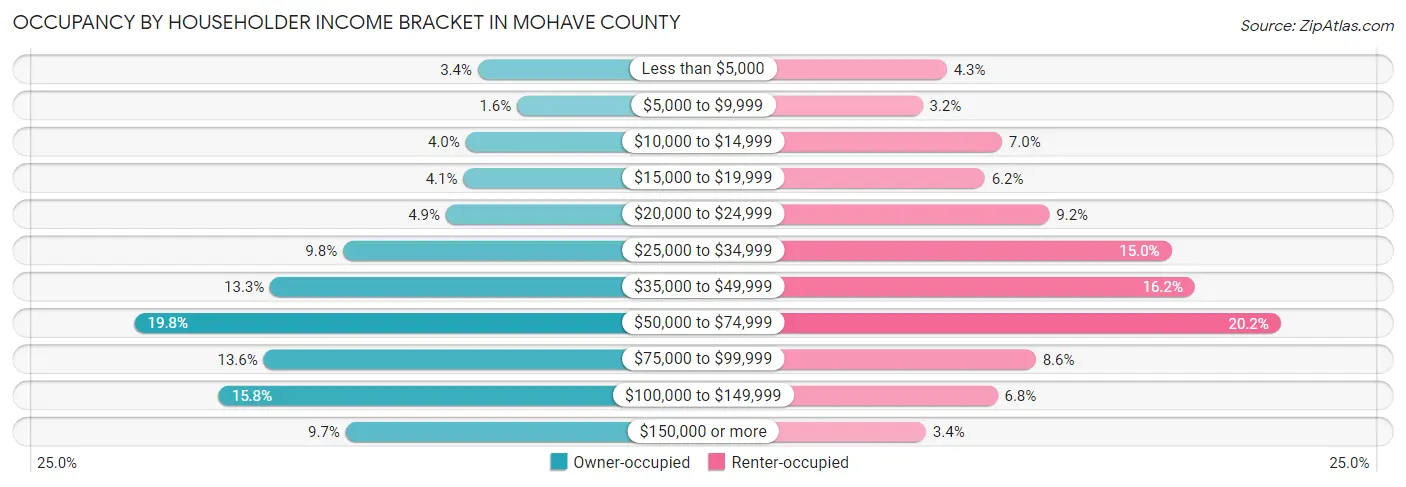
| Income Bracket | Owner-occupied | Renter-occupied |
| Less than $5,000 | 2,365 (3.4%) | 1,134 (4.3%) |
| $5,000 to $9,999 | 1,069 (1.5%) | 833 (3.2%) |
| $10,000 to $14,999 | 2,762 (4.0%) | 1,819 (7.0%) |
| $15,000 to $19,999 | 2,836 (4.1%) | 1,604 (6.1%) |
| $20,000 to $24,999 | 3,414 (4.9%) | 2,409 (9.2%) |
| $25,000 to $34,999 | 6,796 (9.8%) | 3,927 (15.0%) |
| $35,000 to $49,999 | 9,190 (13.3%) | 4,215 (16.2%) |
| $50,000 to $74,999 | 13,646 (19.8%) | 5,284 (20.2%) |
| $75,000 to $99,999 | 9,410 (13.6%) | 2,239 (8.6%) |
| $100,000 to $149,999 | 10,876 (15.8%) | 1,764 (6.8%) |
| $150,000 or more | 6,703 (9.7%) | 874 (3.4%) |
| Total | 69,067 (100.0%) | 26,102 (100.0%) |
Monthly Housing Cost Tiers in Mohave County
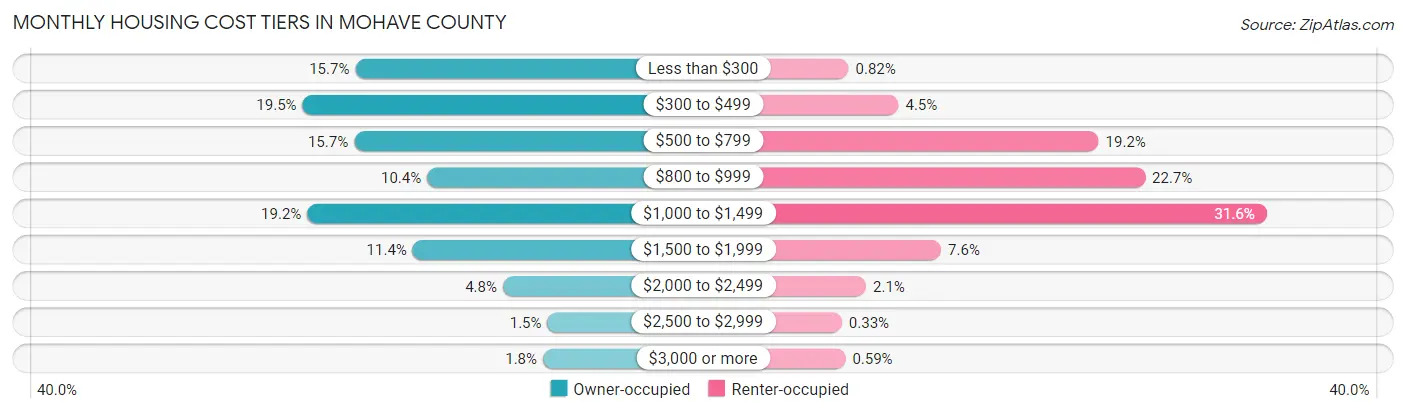
| Monthly Cost | Owner-occupied | Renter-occupied |
| Less than $300 | 10,806 (15.7%) | 215 (0.8%) |
| $300 to $499 | 13,498 (19.5%) | 1,175 (4.5%) |
| $500 to $799 | 10,870 (15.7%) | 5,023 (19.2%) |
| $800 to $999 | 7,155 (10.4%) | 5,916 (22.7%) |
| $1,000 to $1,499 | 13,251 (19.2%) | 8,252 (31.6%) |
| $1,500 to $1,999 | 7,884 (11.4%) | 1,993 (7.6%) |
| $2,000 to $2,499 | 3,300 (4.8%) | 551 (2.1%) |
| $2,500 to $2,999 | 1,039 (1.5%) | 86 (0.3%) |
| $3,000 or more | 1,264 (1.8%) | 153 (0.6%) |
| Total | 69,067 (100.0%) | 26,102 (100.0%) |
Physical Housing Characteristics in Mohave County
Housing Structures in Mohave County
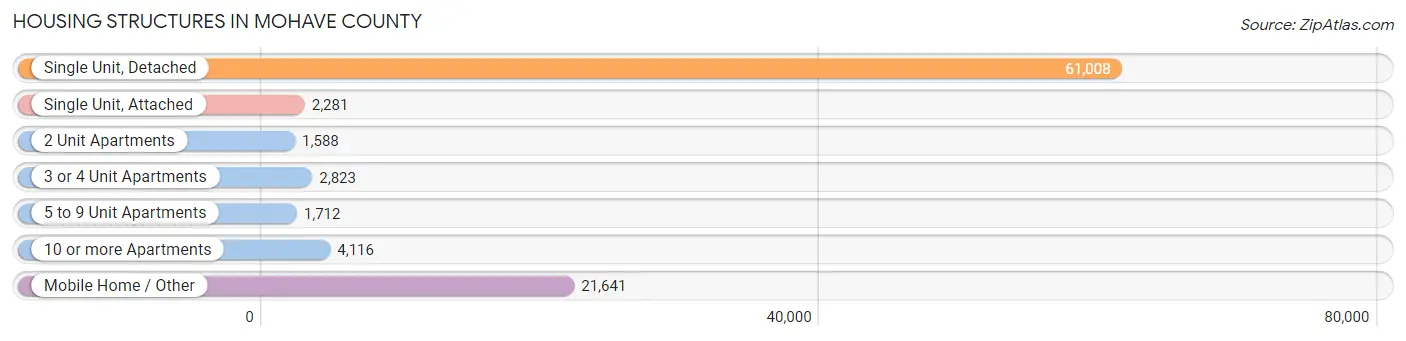
| Structure Type | # Housing Units | % Housing Units |
| Single Unit, Detached | 61,008 | 64.1% |
| Single Unit, Attached | 2,281 | 2.4% |
| 2 Unit Apartments | 1,588 | 1.7% |
| 3 or 4 Unit Apartments | 2,823 | 3.0% |
| 5 to 9 Unit Apartments | 1,712 | 1.8% |
| 10 or more Apartments | 4,116 | 4.3% |
| Mobile Home / Other | 21,641 | 22.7% |
| Total | 95,169 | 100.0% |
Housing Structures by Occupancy in Mohave County
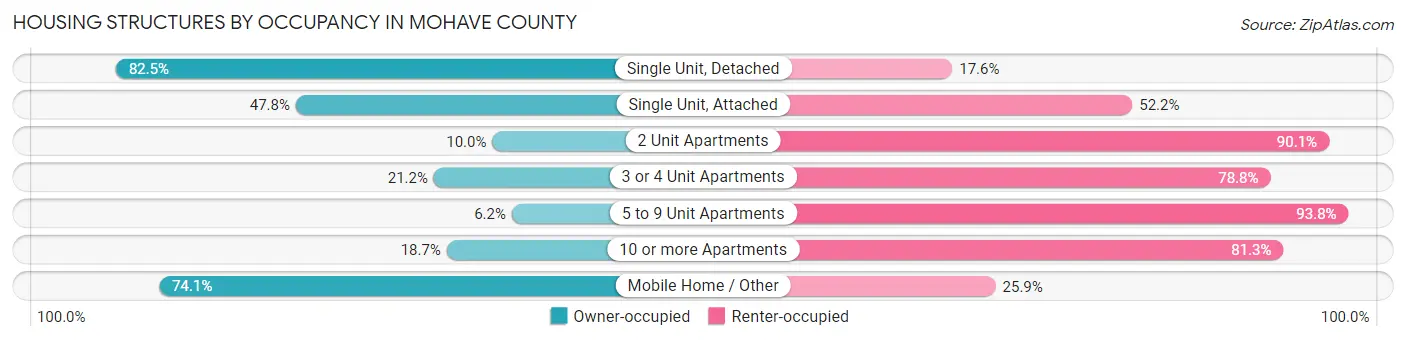
| Structure Type | Owner-occupied | Renter-occupied |
| Single Unit, Detached | 50,303 (82.5%) | 10,705 (17.5%) |
| Single Unit, Attached | 1,090 (47.8%) | 1,191 (52.2%) |
| 2 Unit Apartments | 158 (10.0%) | 1,430 (90.0%) |
| 3 or 4 Unit Apartments | 599 (21.2%) | 2,224 (78.8%) |
| 5 to 9 Unit Apartments | 106 (6.2%) | 1,606 (93.8%) |
| 10 or more Apartments | 771 (18.7%) | 3,345 (81.3%) |
| Mobile Home / Other | 16,040 (74.1%) | 5,601 (25.9%) |
| Total | 69,067 (72.6%) | 26,102 (27.4%) |
Housing Structures by Number of Rooms in Mohave County
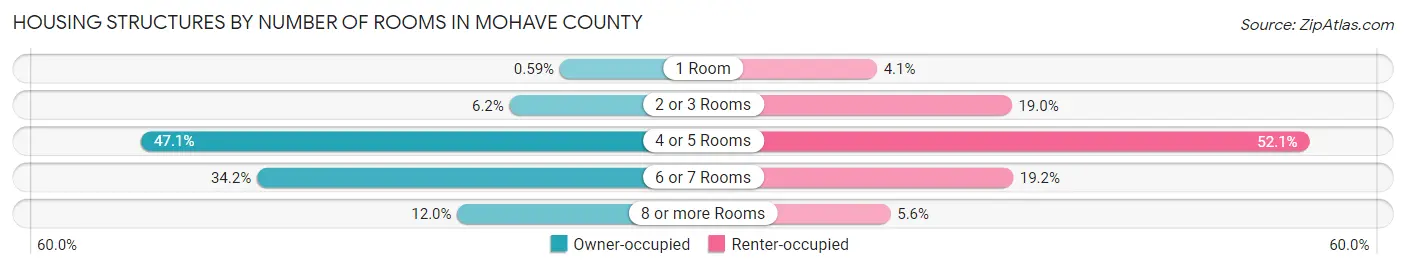
| Number of Rooms | Owner-occupied | Renter-occupied |
| 1 Room | 405 (0.6%) | 1,065 (4.1%) |
| 2 or 3 Rooms | 4,258 (6.2%) | 4,970 (19.0%) |
| 4 or 5 Rooms | 32,514 (47.1%) | 13,599 (52.1%) |
| 6 or 7 Rooms | 23,626 (34.2%) | 5,008 (19.2%) |
| 8 or more Rooms | 8,264 (12.0%) | 1,460 (5.6%) |
| Total | 69,067 (100.0%) | 26,102 (100.0%) |
Housing Structure by Heating Type in Mohave County
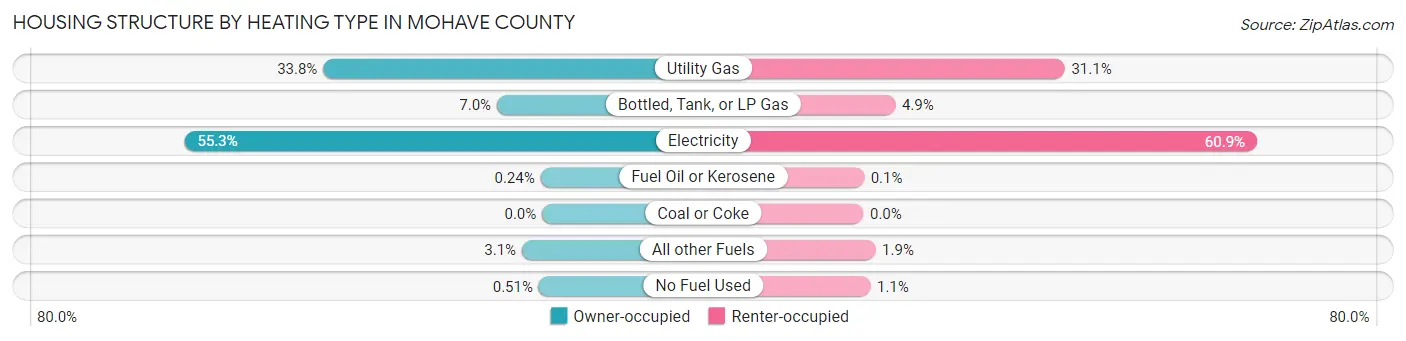
| Heating Type | Owner-occupied | Renter-occupied |
| Utility Gas | 23,374 (33.8%) | 8,127 (31.1%) |
| Bottled, Tank, or LP Gas | 4,821 (7.0%) | 1,286 (4.9%) |
| Electricity | 38,195 (55.3%) | 15,891 (60.9%) |
| Fuel Oil or Kerosene | 169 (0.2%) | 27 (0.1%) |
| Coal or Coke | 0 (0.0%) | 0 (0.0%) |
| All other Fuels | 2,158 (3.1%) | 489 (1.9%) |
| No Fuel Used | 350 (0.5%) | 282 (1.1%) |
| Total | 69,067 (100.0%) | 26,102 (100.0%) |
Household Vehicle Usage in Mohave County
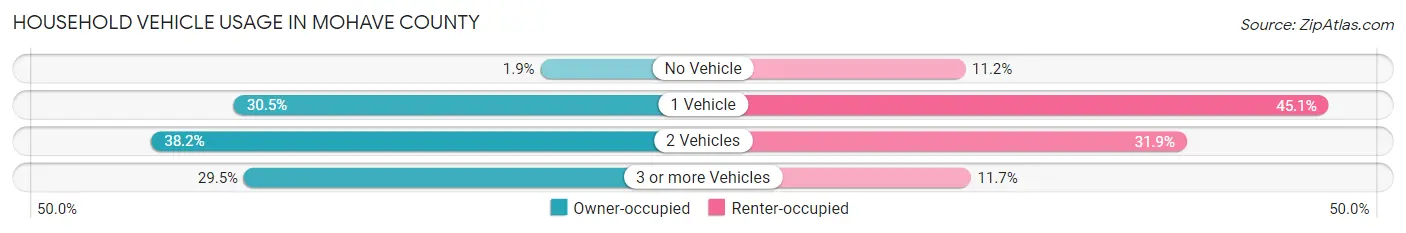
| Vehicles per Household | Owner-occupied | Renter-occupied |
| No Vehicle | 1,276 (1.8%) | 2,929 (11.2%) |
| 1 Vehicle | 21,037 (30.5%) | 11,783 (45.1%) |
| 2 Vehicles | 26,360 (38.2%) | 8,329 (31.9%) |
| 3 or more Vehicles | 20,394 (29.5%) | 3,061 (11.7%) |
| Total | 69,067 (100.0%) | 26,102 (100.0%) |
Real Estate & Mortgages in Mohave County
Real Estate and Mortgage Overview in Mohave County
| Characteristic | Without Mortgage | With Mortgage |
| Housing Units | 31,895 | 37,172 |
| Median Property Value | $194,000 | $264,700 |
| Median Household Income | $47,264 | $4,777 |
| Monthly Housing Costs | $367 | $1,233 |
| Real Estate Taxes | $1,018 | $1,231 |
Property Value by Mortgage Status in Mohave County
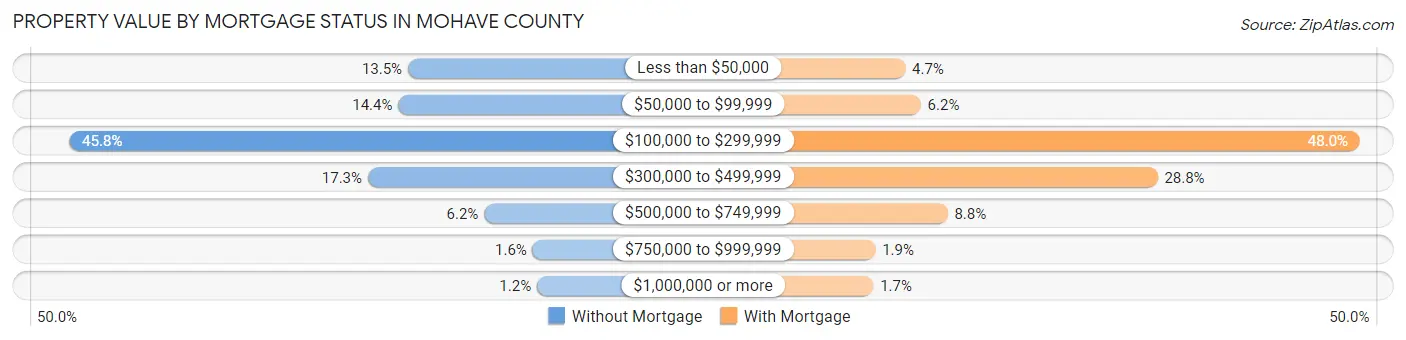
| Property Value | Without Mortgage | With Mortgage |
| Less than $50,000 | 4,303 (13.5%) | 1,753 (4.7%) |
| $50,000 to $99,999 | 4,596 (14.4%) | 2,305 (6.2%) |
| $100,000 to $299,999 | 14,594 (45.8%) | 17,854 (48.0%) |
| $300,000 to $499,999 | 5,520 (17.3%) | 10,687 (28.7%) |
| $500,000 to $749,999 | 1,988 (6.2%) | 3,253 (8.7%) |
| $750,000 to $999,999 | 512 (1.6%) | 696 (1.9%) |
| $1,000,000 or more | 382 (1.2%) | 624 (1.7%) |
| Total | 31,895 (100.0%) | 37,172 (100.0%) |
Household Income by Mortgage Status in Mohave County
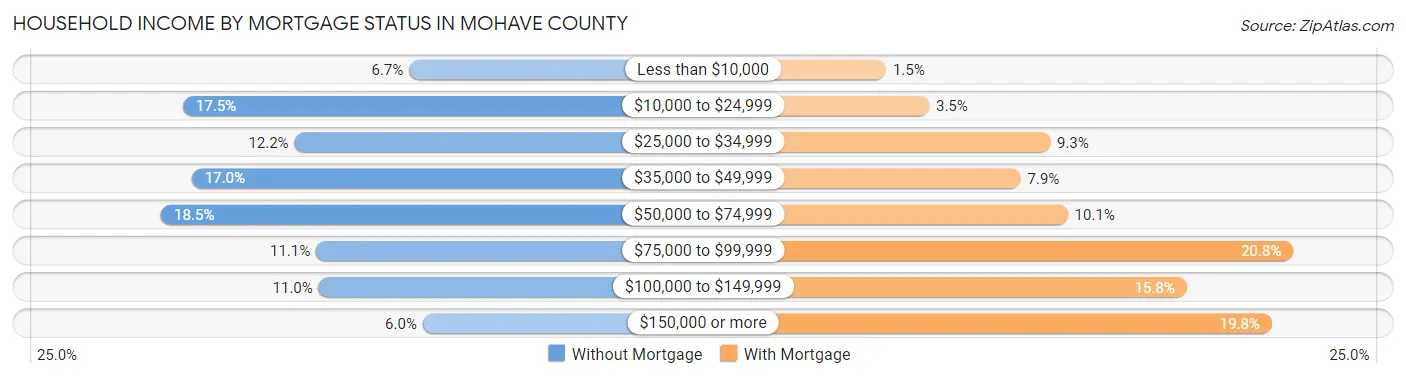
| Household Income | Without Mortgage | With Mortgage |
| Less than $10,000 | 2,134 (6.7%) | 538 (1.5%) |
| $10,000 to $24,999 | 5,570 (17.5%) | 1,300 (3.5%) |
| $25,000 to $34,999 | 3,874 (12.1%) | 3,442 (9.3%) |
| $35,000 to $49,999 | 5,435 (17.0%) | 2,922 (7.9%) |
| $50,000 to $74,999 | 5,900 (18.5%) | 3,755 (10.1%) |
| $75,000 to $99,999 | 3,548 (11.1%) | 7,746 (20.8%) |
| $100,000 to $149,999 | 3,508 (11.0%) | 5,862 (15.8%) |
| $150,000 or more | 1,926 (6.0%) | 7,368 (19.8%) |
| Total | 31,895 (100.0%) | 37,172 (100.0%) |
Property Value to Household Income Ratio in Mohave County
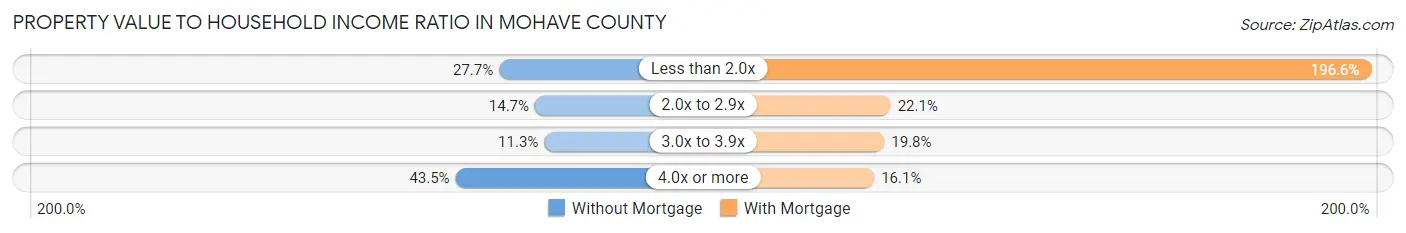
| Value-to-Income Ratio | Without Mortgage | With Mortgage |
| Less than 2.0x | 8,830 (27.7%) | 73,095 (196.6%) |
| 2.0x to 2.9x | 4,672 (14.6%) | 8,207 (22.1%) |
| 3.0x to 3.9x | 3,598 (11.3%) | 7,350 (19.8%) |
| 4.0x or more | 13,878 (43.5%) | 5,986 (16.1%) |
| Total | 31,895 (100.0%) | 37,172 (100.0%) |
Real Estate Taxes by Mortgage Status in Mohave County
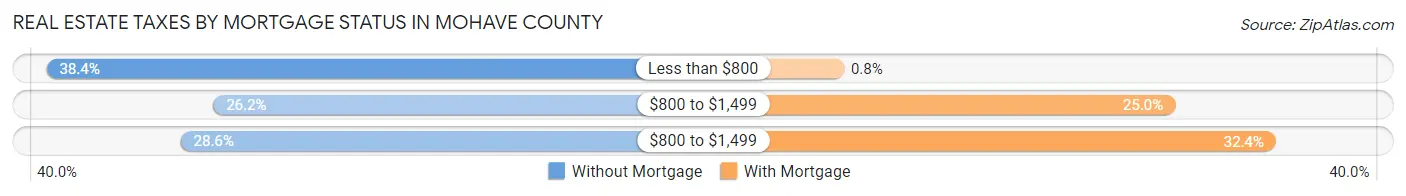
| Property Taxes | Without Mortgage | With Mortgage |
| Less than $800 | 12,249 (38.4%) | 299 (0.8%) |
| $800 to $1,499 | 8,363 (26.2%) | 9,290 (25.0%) |
| $800 to $1,499 | 9,123 (28.6%) | 12,024 (32.4%) |
| Total | 31,895 (100.0%) | 37,172 (100.0%) |
Health & Disability in Mohave County
Health Insurance Coverage by Age in Mohave County
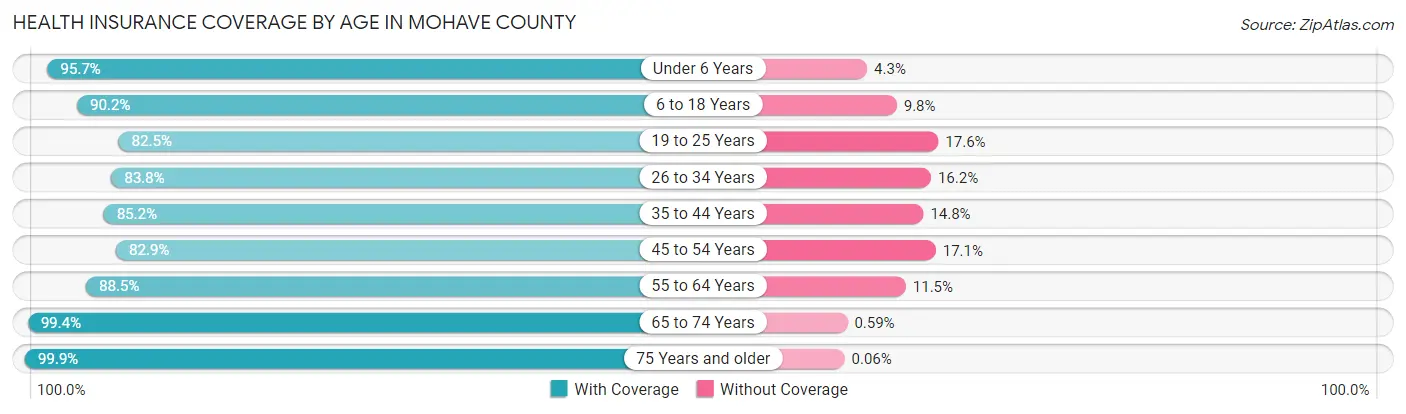
| Age Bracket | With Coverage | Without Coverage |
| Under 6 Years | 10,365 (95.7%) | 461 (4.3%) |
| 6 to 18 Years | 23,908 (90.2%) | 2,594 (9.8%) |
| 19 to 25 Years | 10,497 (82.5%) | 2,235 (17.5%) |
| 26 to 34 Years | 15,981 (83.8%) | 3,082 (16.2%) |
| 35 to 44 Years | 16,204 (85.2%) | 2,806 (14.8%) |
| 45 to 54 Years | 18,096 (82.9%) | 3,726 (17.1%) |
| 55 to 64 Years | 30,517 (88.5%) | 3,956 (11.5%) |
| 65 to 74 Years | 37,630 (99.4%) | 225 (0.6%) |
| 75 Years and older | 28,348 (99.9%) | 18 (0.1%) |
| Total | 191,546 (90.9%) | 19,103 (9.1%) |
Health Insurance Coverage by Citizenship Status in Mohave County
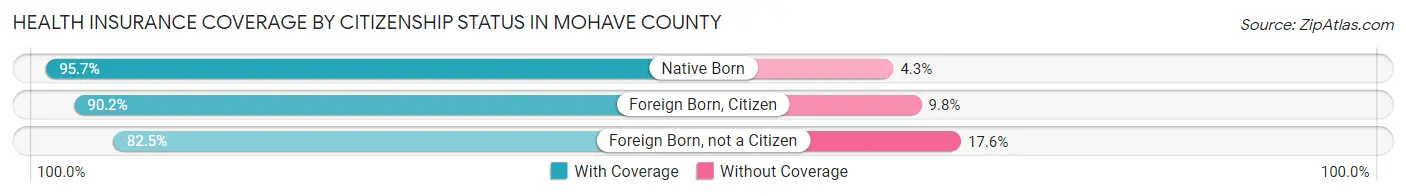
| Citizenship Status | With Coverage | Without Coverage |
| Native Born | 10,365 (95.7%) | 461 (4.3%) |
| Foreign Born, Citizen | 23,908 (90.2%) | 2,594 (9.8%) |
| Foreign Born, not a Citizen | 10,497 (82.5%) | 2,235 (17.5%) |
Health Insurance Coverage by Household Income in Mohave County
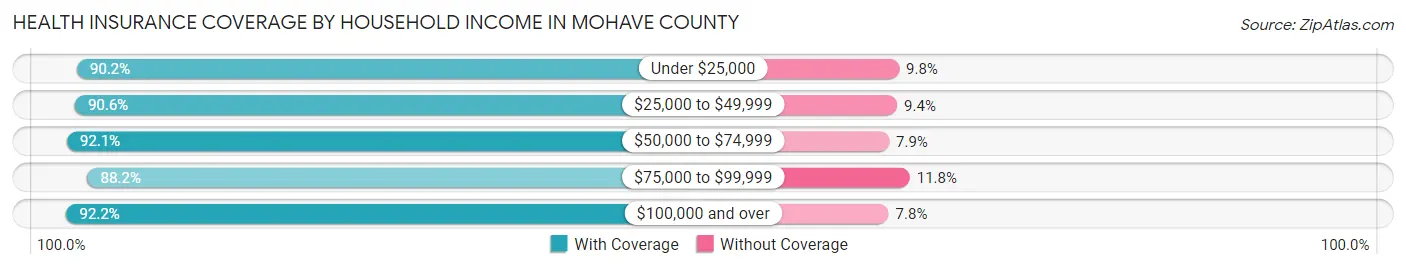
| Household Income | With Coverage | Without Coverage |
| Under $25,000 | 29,087 (90.2%) | 3,159 (9.8%) |
| $25,000 to $49,999 | 44,136 (90.6%) | 4,600 (9.4%) |
| $50,000 to $74,999 | 39,846 (92.1%) | 3,432 (7.9%) |
| $75,000 to $99,999 | 25,388 (88.2%) | 3,396 (11.8%) |
| $100,000 and over | 52,845 (92.2%) | 4,495 (7.8%) |
Public vs Private Health Insurance Coverage by Age in Mohave County
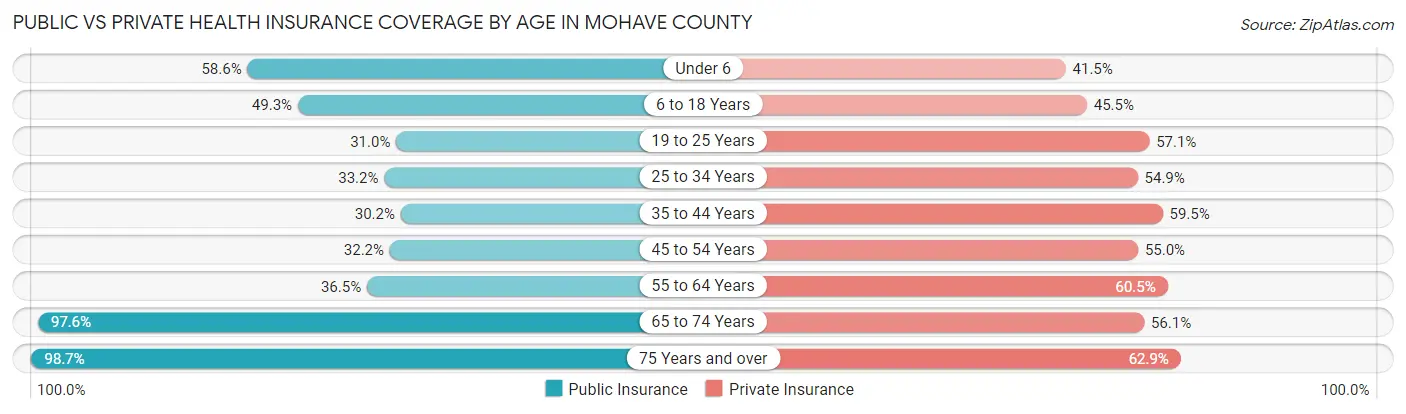
| Age Bracket | Public Insurance | Private Insurance |
| Under 6 | 6,347 (58.6%) | 4,497 (41.5%) |
| 6 to 18 Years | 13,057 (49.3%) | 12,051 (45.5%) |
| 19 to 25 Years | 3,949 (31.0%) | 7,265 (57.1%) |
| 25 to 34 Years | 6,336 (33.2%) | 10,467 (54.9%) |
| 35 to 44 Years | 5,735 (30.2%) | 11,316 (59.5%) |
| 45 to 54 Years | 7,027 (32.2%) | 11,996 (55.0%) |
| 55 to 64 Years | 12,566 (36.4%) | 20,844 (60.5%) |
| 65 to 74 Years | 36,929 (97.6%) | 21,234 (56.1%) |
| 75 Years and over | 28,009 (98.7%) | 17,842 (62.9%) |
| Total | 119,955 (57.0%) | 117,512 (55.8%) |
Disability Status by Sex by Age in Mohave County
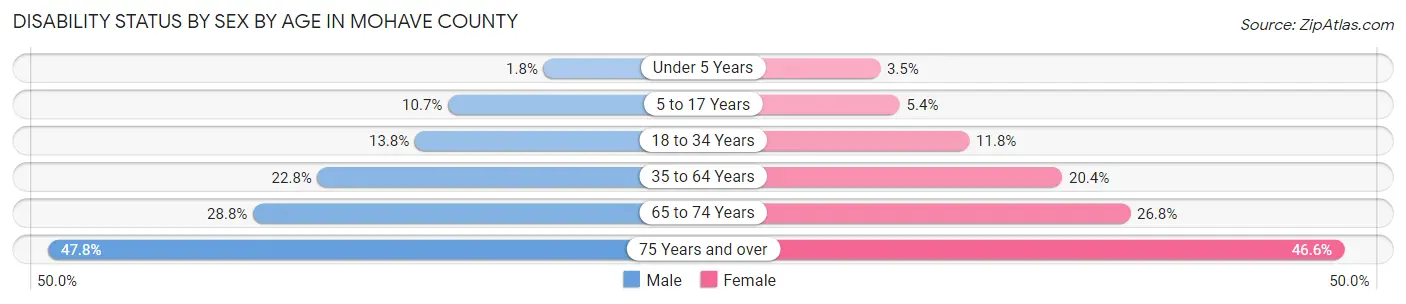
| Age Bracket | Male | Female |
| Under 5 Years | 83 (1.8%) | 153 (3.5%) |
| 5 to 17 Years | 1,461 (10.7%) | 691 (5.4%) |
| 18 to 34 Years | 2,429 (13.8%) | 1,900 (11.8%) |
| 35 to 64 Years | 8,472 (22.8%) | 7,797 (20.4%) |
| 65 to 74 Years | 5,393 (28.8%) | 5,115 (26.8%) |
| 75 Years and over | 6,765 (47.8%) | 6,627 (46.6%) |
Disability Class by Sex by Age in Mohave County
Disability Class: Hearing Difficulty
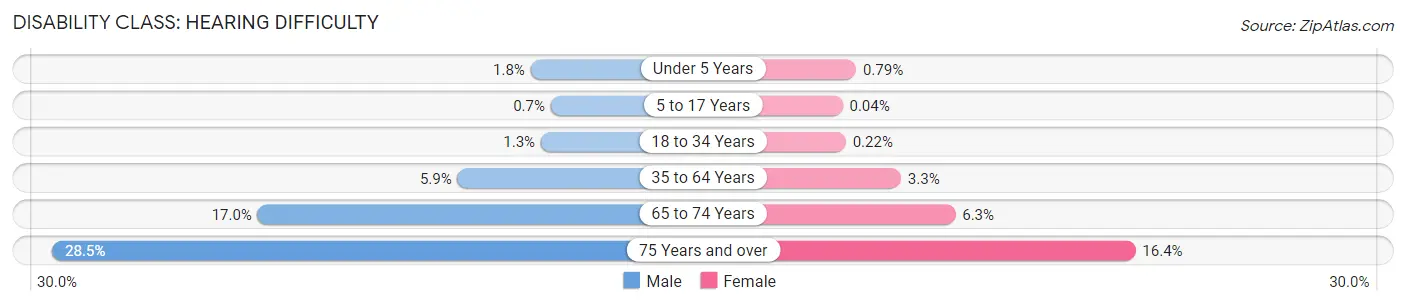
| Age Bracket | Male | Female |
| Under 5 Years | 83 (1.8%) | 34 (0.8%) |
| 5 to 17 Years | 96 (0.7%) | 5 (0.0%) |
| 18 to 34 Years | 221 (1.3%) | 35 (0.2%) |
| 35 to 64 Years | 2,189 (5.9%) | 1,255 (3.3%) |
| 65 to 74 Years | 3,189 (17.0%) | 1,208 (6.3%) |
| 75 Years and over | 4,028 (28.5%) | 2,325 (16.4%) |
Disability Class: Vision Difficulty
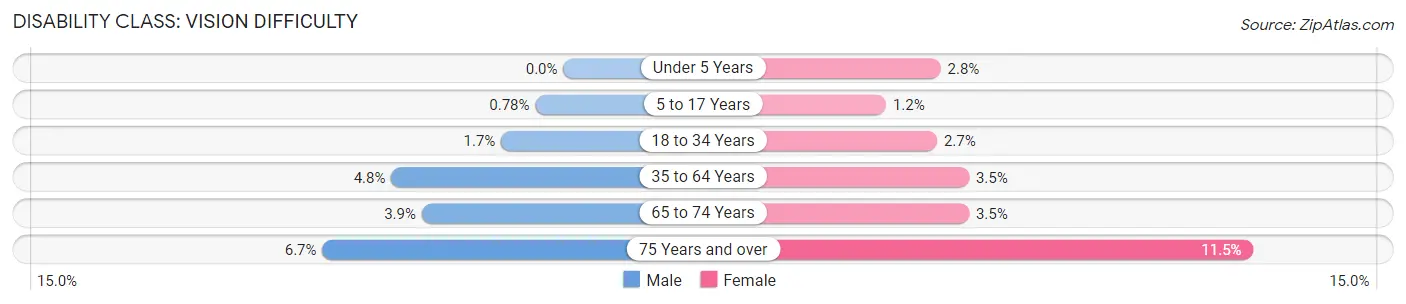
| Age Bracket | Male | Female |
| Under 5 Years | 0 (0.0%) | 119 (2.8%) |
| 5 to 17 Years | 107 (0.8%) | 158 (1.2%) |
| 18 to 34 Years | 305 (1.7%) | 426 (2.6%) |
| 35 to 64 Years | 1,778 (4.8%) | 1,350 (3.5%) |
| 65 to 74 Years | 739 (3.9%) | 677 (3.5%) |
| 75 Years and over | 949 (6.7%) | 1,629 (11.5%) |
Disability Class: Cognitive Difficulty
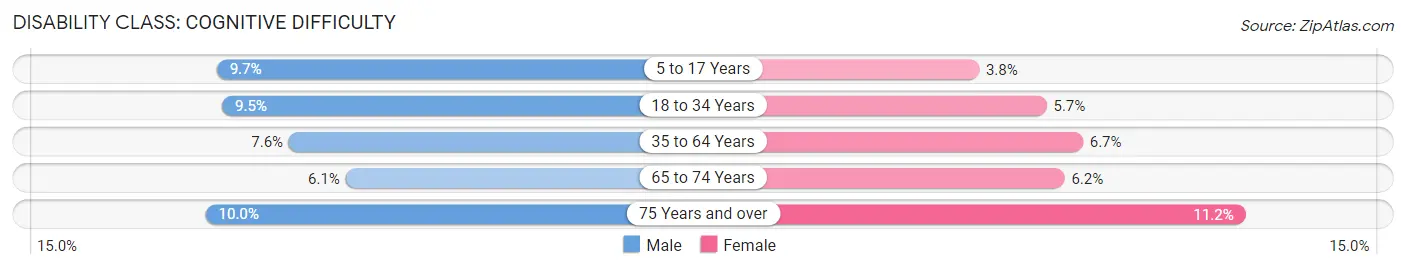
| Age Bracket | Male | Female |
| 5 to 17 Years | 1,318 (9.7%) | 491 (3.8%) |
| 18 to 34 Years | 1,678 (9.5%) | 916 (5.7%) |
| 35 to 64 Years | 2,839 (7.6%) | 2,558 (6.7%) |
| 65 to 74 Years | 1,136 (6.1%) | 1,186 (6.2%) |
| 75 Years and over | 1,409 (10.0%) | 1,598 (11.2%) |
Disability Class: Ambulatory Difficulty
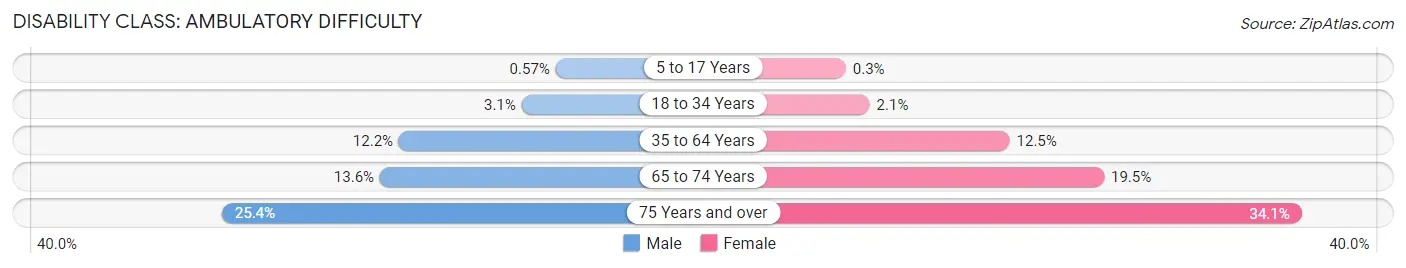
| Age Bracket | Male | Female |
| 5 to 17 Years | 78 (0.6%) | 38 (0.3%) |
| 18 to 34 Years | 547 (3.1%) | 332 (2.1%) |
| 35 to 64 Years | 4,536 (12.2%) | 4,753 (12.5%) |
| 65 to 74 Years | 2,551 (13.6%) | 3,723 (19.5%) |
| 75 Years and over | 3,586 (25.4%) | 4,853 (34.1%) |
Disability Class: Self-Care Difficulty
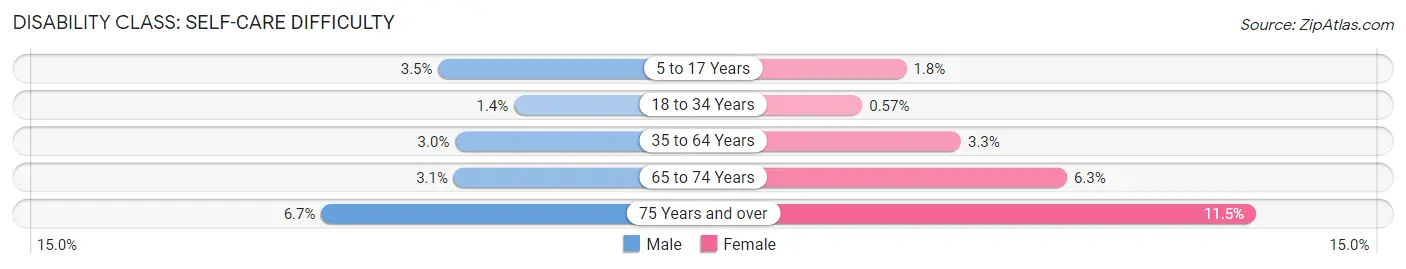
| Age Bracket | Male | Female |
| 5 to 17 Years | 475 (3.5%) | 232 (1.8%) |
| 18 to 34 Years | 242 (1.4%) | 91 (0.6%) |
| 35 to 64 Years | 1,118 (3.0%) | 1,265 (3.3%) |
| 65 to 74 Years | 572 (3.0%) | 1,198 (6.3%) |
| 75 Years and over | 954 (6.7%) | 1,639 (11.5%) |
Technology Access in Mohave County
Computing Device Access in Mohave County
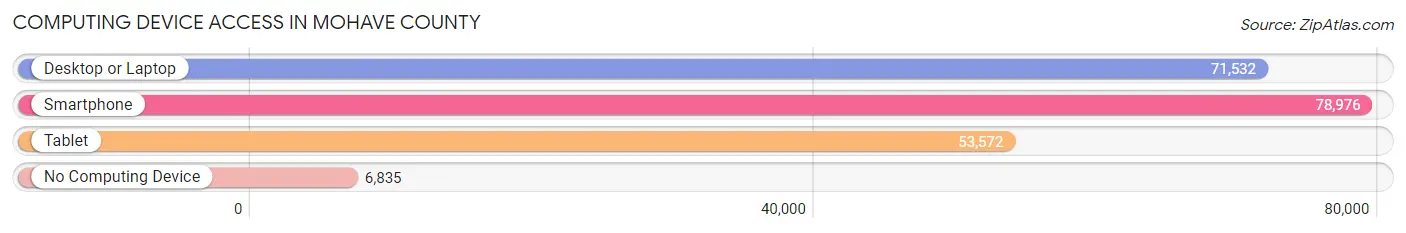
| Device Type | # Households | % Households |
| Desktop or Laptop | 71,532 | 75.2% |
| Smartphone | 78,976 | 83.0% |
| Tablet | 53,572 | 56.3% |
| No Computing Device | 6,835 | 7.2% |
| Total | 95,169 | 100.0% |
Internet Access in Mohave County
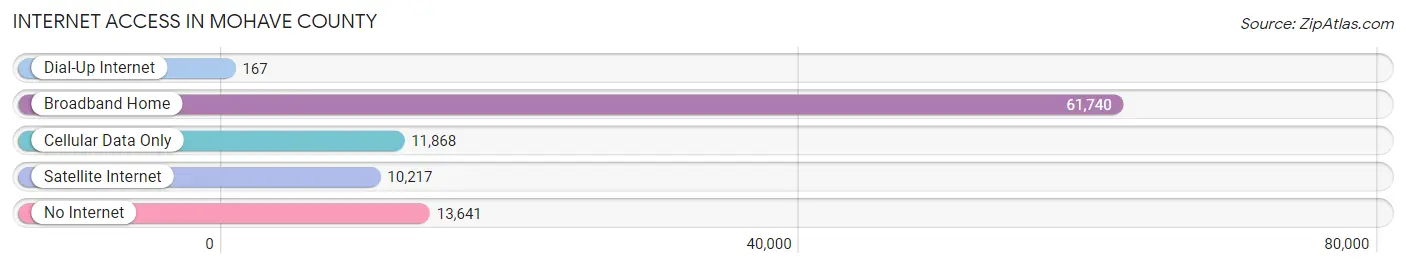
| Internet Type | # Households | % Households |
| Dial-Up Internet | 167 | 0.2% |
| Broadband Home | 61,740 | 64.9% |
| Cellular Data Only | 11,868 | 12.5% |
| Satellite Internet | 10,217 | 10.7% |
| No Internet | 13,641 | 14.3% |
| Total | 95,169 | 100.0% |
Mohave County Summary
Introduction
Located in the northwestern corner of Arizona, Mohave County is the second largest county in the state. It is bordered by Nevada and California to the west, Utah to the north, and Coconino County to the east. The county seat is Kingman, and the largest city is Bullhead City. The county is home to the Grand Canyon National Park, Lake Mead National Recreation Area, and the Colorado River.
History
The area that is now Mohave County was first inhabited by the Mojave people, who were hunter-gatherers. The first Europeans to explore the area were Spanish missionaries in the late 1700s. The area was part of the New Mexico Territory until 1863, when it became part of the Arizona Territory. In 1864, the county was created and named after the Mojave people.
In the late 1800s, the area was settled by miners and ranchers. The county was also home to the Hualapai and Havasupai tribes, who still live in the area today. The county was also home to the famous outlaws, the Wild Bunch, who were active in the area in the late 1800s.
In the early 1900s, the county was home to the Grand Canyon Railway, which ran from Williams, Arizona to the Grand Canyon. The railway was a major tourist attraction and helped to spur the growth of the county.
Geography
Mohave County covers an area of 13,461 square miles, making it the second largest county in Arizona. The county is located in the northwestern corner of the state and is bordered by Nevada and California to the west, Utah to the north, and Coconino County to the east. The county is home to the Grand Canyon National Park, Lake Mead National Recreation Area, and the Colorado River.
The county is mostly desert, with the exception of the higher elevations in the north. The highest point in the county is the summit of Mount Trumbull, which is 8,028 feet above sea level. The lowest point is the Colorado River, which is at an elevation of 479 feet.
Economy
The economy of Mohave County is largely based on tourism, mining, and agriculture. The county is home to the Grand Canyon National Park, which is a major tourist attraction. The county is also home to several large mining operations, including copper, gold, and uranium. Agriculture is also an important part of the economy, with cattle ranching and farming being the main activities.
The county is also home to several military installations, including the Marine Corps Air Station Yuma and the Army National Guard Training Center. These installations provide jobs and economic activity to the county.
Demographics
As of the 2010 census, the population of Mohave County was 200,186. The population is mostly white (83.3%), with smaller percentages of Native American (7.2%), Hispanic (6.2%), and African American (2.2%) populations. The median household income is $41,945, and the median age is 41.
Conclusion
Mohave County is a large county located in the northwestern corner of Arizona. It is home to the Grand Canyon National Park, Lake Mead National Recreation Area, and the Colorado River. The economy of the county is largely based on tourism, mining, and agriculture. The population of the county is mostly white, with smaller percentages of Native American, Hispanic, and African American populations.
Common Questions
What is the Total Population of Mohave County?
Total Population of Mohave County is 214,229.
What is the Total Male Population of Mohave County?
Total Male Population of Mohave County is 108,677.
What is the Total Female Population of Mohave County?
Total Female Population of Mohave County is 105,552.
What is the Ratio of Males per 100 Females in Mohave County?
There are 102.96 Males per 100 Females in Mohave County.
What is the Ratio of Females per 100 Males in Mohave County?
There are 97.12 Females per 100 Males in Mohave County.
What is the Median Population Age in Mohave County?
Median Population Age in Mohave County is 52.9 Years.
What is the Average Family Size in Mohave County
Average Family Size in Mohave County is 2.7 People.
What is the Average Household Size in Mohave County
Average Household Size in Mohave County is 2.2 People.
What is Per Capita Income in Mohave County?
Per Capita income in Mohave County is $32,835.
What is the Median Family Income in Mohave County?
Median Family Income in Mohave County is $64,283.
What is the Median Household income in Mohave County?
Median Household Income in Mohave County is $53,592.
What is Income or Wage Gap in Mohave County?
Income or Wage Gap in Mohave County is 13.9%.
Women in Mohave County earn 86.1 cents for every dollar earned by a man.
What is Family Income Deficit in Mohave County?
Family Income Deficit in Mohave County is $10,931.
Families that are below poverty line in Mohave County earn $10,931 less on average than the poverty threshold level.
What is Inequality or Gini Index in Mohave County?
Inequality or Gini Index in Mohave County is 0.46.
How Large is the Labor Force in Mohave County?
There are 82,046 People in the Labor Forcein in Mohave County.
What is the Percentage of People in the Labor Force in Mohave County?
44.8% of People are in the Labor Force in Mohave County.
What is the Unemployment Rate in Mohave County?
Unemployment Rate in Mohave County is 7.5%.