Greenlee County, AZ
Greenlee County Map
Greenlee County Overview
9,483
TOTAL POPULATION
5,027
MALE POPULATION
4,456
FEMALE POPULATION
112.81
MALES / 100 FEMALES
88.64
FEMALES / 100 MALES
35.5
MEDIAN AGE
3.6
AVG FAMILY SIZE
2.8
AVG HOUSEHOLD SIZE
$29,394
PER CAPITA INCOME
$78,172
AVG FAMILY INCOME
$73,756
AVG HOUSEHOLD INCOME
50.2%
WAGE / INCOME GAP [ % ]
49.8¢/ $1
WAGE / INCOME GAP [ $ ]
0.38
INEQUALITY / GINI INDEX
4,274
LABOR FORCE [ PEOPLE ]
59.1%
PERCENT IN LABOR FORCE
3.0%
UNEMPLOYMENT RATE
Greenlee County Area Codes
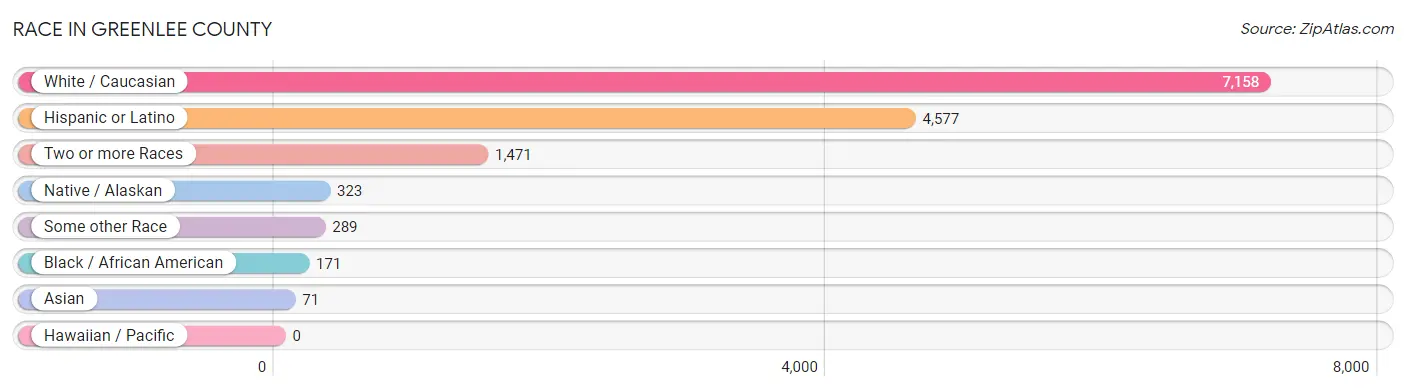
Race in Greenlee County
The most populous races in Greenlee County are White / Caucasian (7,158 | 75.5%), Hispanic or Latino (4,577 | 48.3%), and Two or more Races (1,471 | 15.5%).
| Race | # Population | % Population |
| Asian | 71 | 0.7% |
| Black / African American | 171 | 1.8% |
| Hawaiian / Pacific | 0 | 0.0% |
| Hispanic or Latino | 4,577 | 48.3% |
| Native / Alaskan | 323 | 3.4% |
| White / Caucasian | 7,158 | 75.5% |
| Two or more Races | 1,471 | 15.5% |
| Some other Race | 289 | 3.0% |
| Total | 9,483 | 100.0% |
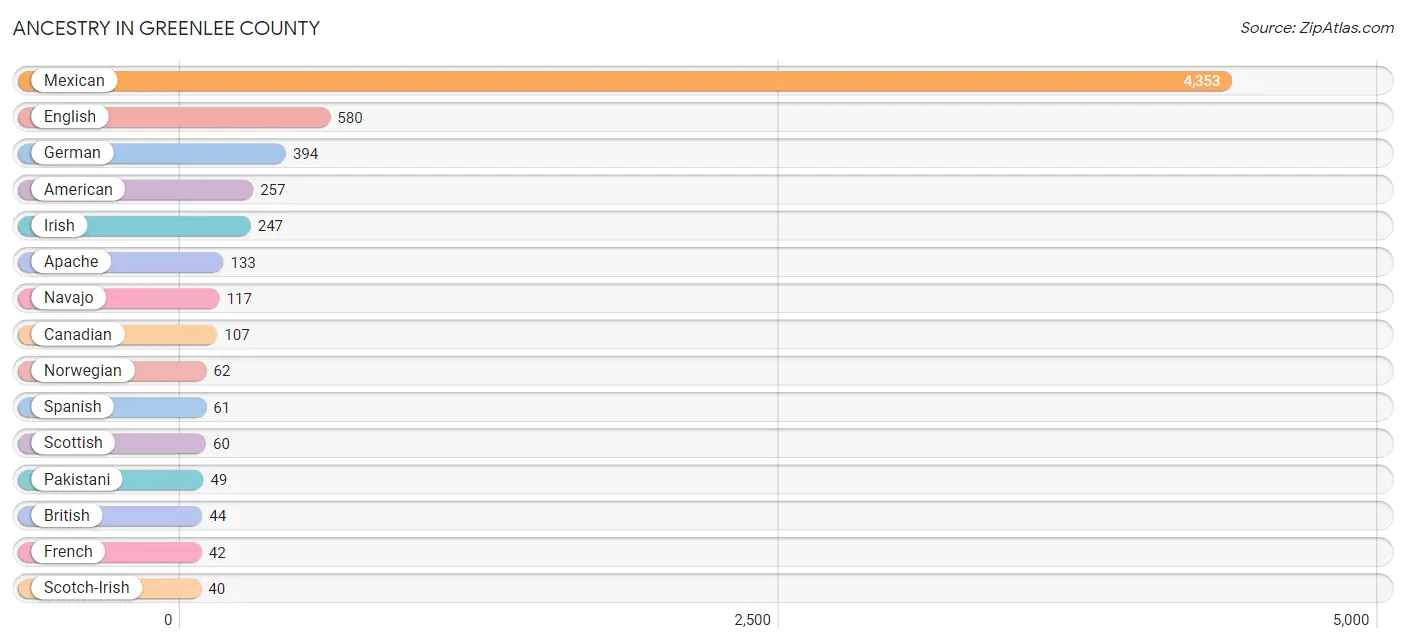
Ancestry in Greenlee County
The most populous ancestries reported in Greenlee County are Mexican (4,353 | 45.9%), English (580 | 6.1%), German (394 | 4.2%), American (257 | 2.7%), and Irish (247 | 2.6%), together accounting for 61.5% of all Greenlee County residents.
| Ancestry | # Population | % Population |
| American | 257 | 2.7% |
| Apache | 133 | 1.4% |
| Arab | 8 | 0.1% |
| Bahamian | 6 | 0.1% |
| British | 44 | 0.5% |
| Burmese | 9 | 0.1% |
| Canadian | 107 | 1.1% |
| Cherokee | 2 | 0.0% |
| Chickasaw | 13 | 0.1% |
| Choctaw | 4 | 0.0% |
| Croatian | 32 | 0.3% |
| Cuban | 23 | 0.2% |
| Danish | 12 | 0.1% |
| Dutch | 2 | 0.0% |
| Dutch West Indian | 8 | 0.1% |
| Eastern European | 8 | 0.1% |
| English | 580 | 6.1% |
| European | 37 | 0.4% |
| Finnish | 3 | 0.0% |
| French | 42 | 0.4% |
| French Canadian | 7 | 0.1% |
| German | 394 | 4.2% |
| Irish | 247 | 2.6% |
| Italian | 35 | 0.4% |
| Jamaican | 5 | 0.1% |
| Kiowa | 21 | 0.2% |
| Korean | 13 | 0.1% |
| Lebanese | 8 | 0.1% |
| Mexican | 4,353 | 45.9% |
| Navajo | 117 | 1.2% |
| Nigerian | 1 | 0.0% |
| Northern European | 11 | 0.1% |
| Norwegian | 62 | 0.6% |
| Pakistani | 49 | 0.5% |
| Pennsylvania German | 11 | 0.1% |
| Peruvian | 26 | 0.3% |
| Pima | 4 | 0.0% |
| Puerto Rican | 32 | 0.3% |
| Samoan | 36 | 0.4% |
| Scandinavian | 24 | 0.3% |
| Scotch-Irish | 40 | 0.4% |
| Scottish | 60 | 0.6% |
| Sioux | 14 | 0.2% |
| Slovene | 32 | 0.3% |
| South American | 26 | 0.3% |
| Spaniard | 12 | 0.1% |
| Spanish | 61 | 0.6% |
| Subsaharan African | 29 | 0.3% |
| Swedish | 7 | 0.1% |
| Tohono O'Odham | 17 | 0.2% |
| Welsh | 37 | 0.4% | View All 51 Rows |
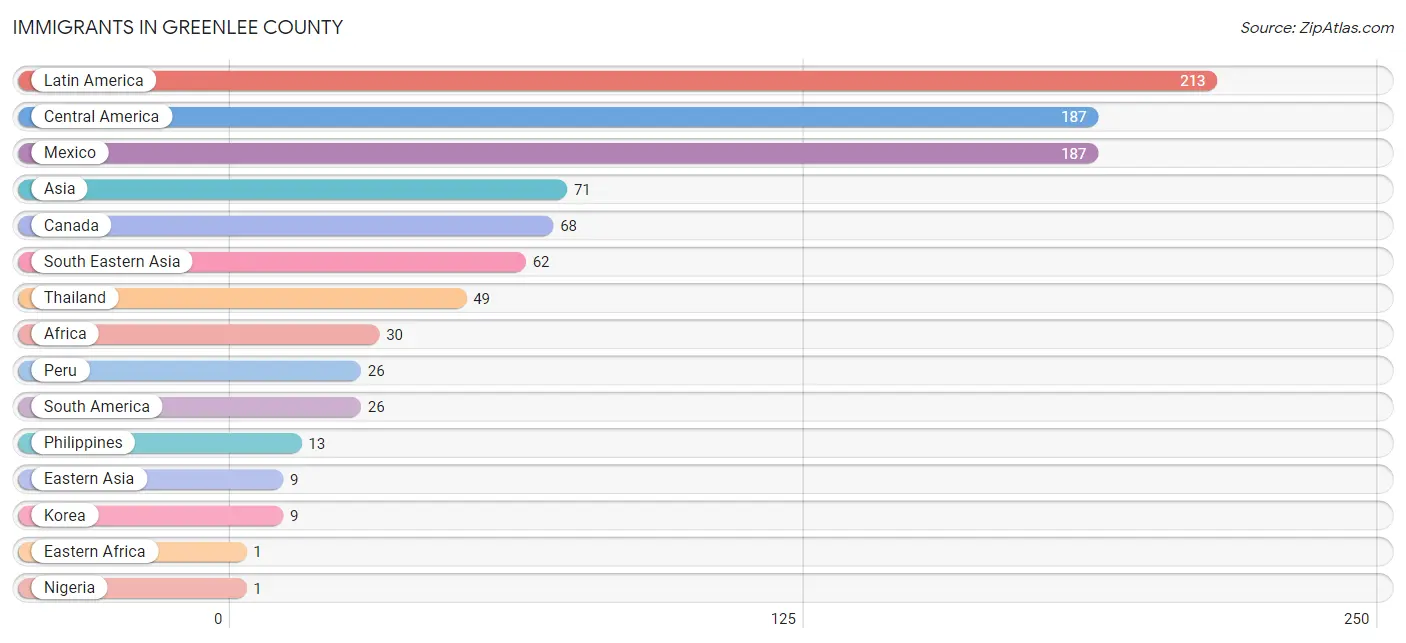
Immigrants in Greenlee County
The most numerous immigrant groups reported in Greenlee County came from Latin America (213 | 2.2%), Central America (187 | 2.0%), Mexico (187 | 2.0%), Asia (71 | 0.7%), and Canada (68 | 0.7%), together accounting for 7.7% of all Greenlee County residents.
| Immigration Origin | # Population | % Population |
| Africa | 30 | 0.3% |
| Asia | 71 | 0.7% |
| Canada | 68 | 0.7% |
| Central America | 187 | 2.0% |
| Eastern Africa | 1 | 0.0% |
| Eastern Asia | 9 | 0.1% |
| Korea | 9 | 0.1% |
| Latin America | 213 | 2.2% |
| Mexico | 187 | 2.0% |
| Nigeria | 1 | 0.0% |
| Peru | 26 | 0.3% |
| Philippines | 13 | 0.1% |
| South America | 26 | 0.3% |
| South Eastern Asia | 62 | 0.6% |
| Thailand | 49 | 0.5% |
| Western Africa | 1 | 0.0% | View All 16 Rows |
Sex and Age in Greenlee County
Sex and Age in Greenlee County
The most populous age groups in Greenlee County are 35 to 39 Years (529 | 10.5%) for men and 5 to 9 Years (416 | 9.3%) for women.
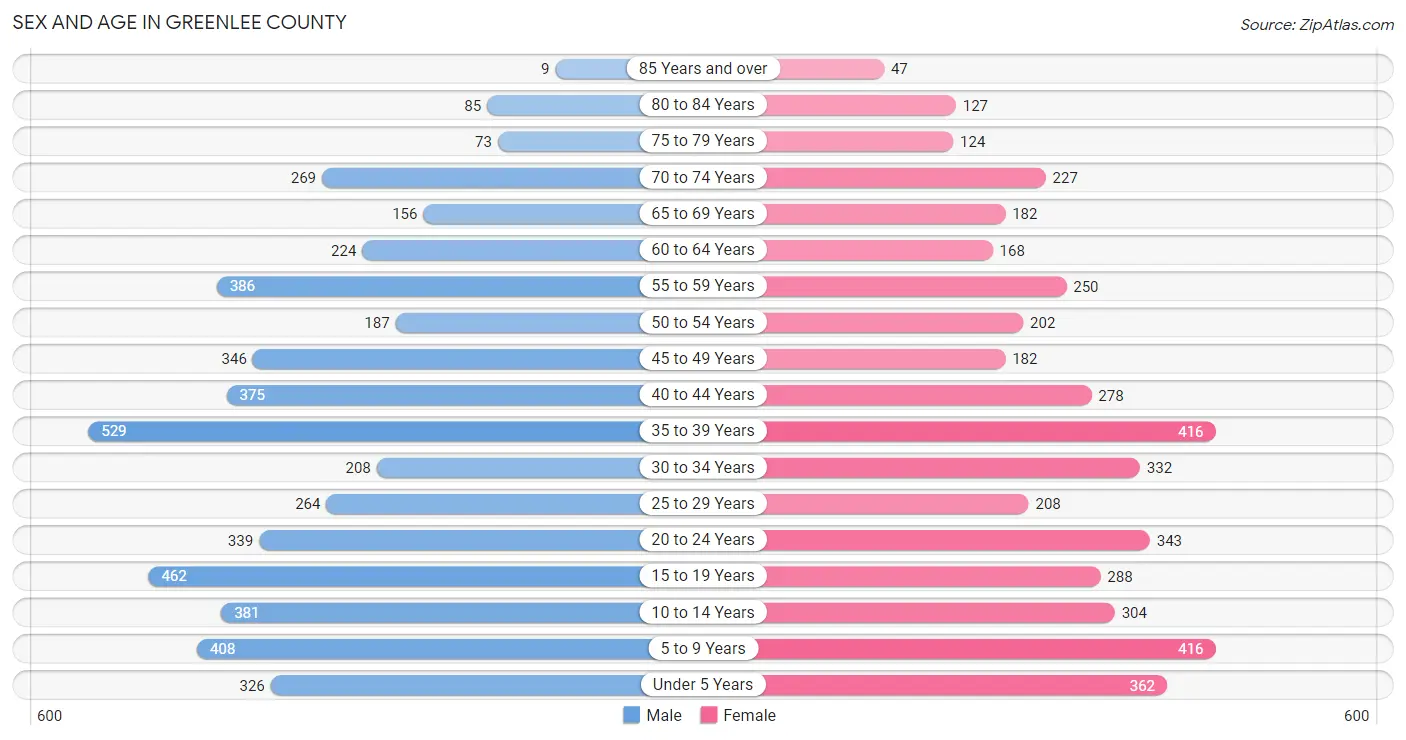
| Age Bracket | Male | Female |
| Under 5 Years | 326 (6.5%) | 362 (8.1%) |
| 5 to 9 Years | 408 (8.1%) | 416 (9.3%) |
| 10 to 14 Years | 381 (7.6%) | 304 (6.8%) |
| 15 to 19 Years | 462 (9.2%) | 288 (6.5%) |
| 20 to 24 Years | 339 (6.7%) | 343 (7.7%) |
| 25 to 29 Years | 264 (5.2%) | 208 (4.7%) |
| 30 to 34 Years | 208 (4.1%) | 332 (7.4%) |
| 35 to 39 Years | 529 (10.5%) | 416 (9.3%) |
| 40 to 44 Years | 375 (7.5%) | 278 (6.2%) |
| 45 to 49 Years | 346 (6.9%) | 182 (4.1%) |
| 50 to 54 Years | 187 (3.7%) | 202 (4.5%) |
| 55 to 59 Years | 386 (7.7%) | 250 (5.6%) |
| 60 to 64 Years | 224 (4.5%) | 168 (3.8%) |
| 65 to 69 Years | 156 (3.1%) | 182 (4.1%) |
| 70 to 74 Years | 269 (5.3%) | 227 (5.1%) |
| 75 to 79 Years | 73 (1.5%) | 124 (2.8%) |
| 80 to 84 Years | 85 (1.7%) | 127 (2.9%) |
| 85 Years and over | 9 (0.2%) | 47 (1.1%) |
| Total | 5,027 (100.0%) | 4,456 (100.0%) |
Families and Households in Greenlee County
Median Family Size in Greenlee County
The median family size in Greenlee County is 3.64 persons per family, with single female/mother families (285 | 13.3%) accounting for the largest median family size of 3.93 persons per family. On the other hand, married-couple families (1,638 | 76.3%) represent the smallest median family size with 3.57 persons per family.
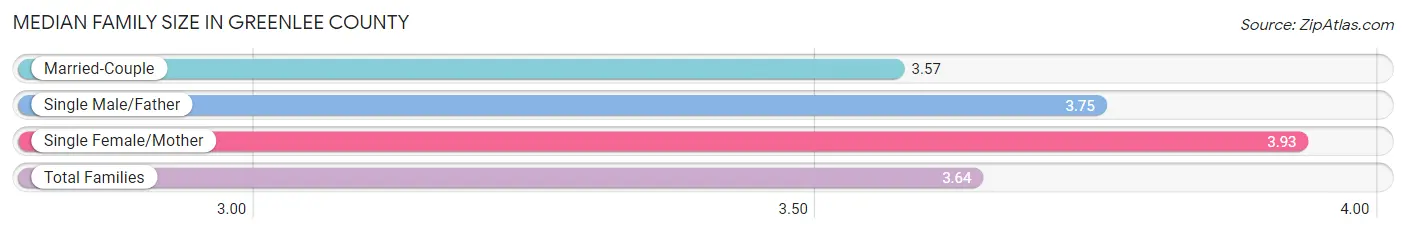
| Family Type | # Families | Family Size |
| Married-Couple | 1,638 (76.3%) | 3.57 |
| Single Male/Father | 225 (10.5%) | 3.75 |
| Single Female/Mother | 285 (13.3%) | 3.93 |
| Total Families | 2,148 (100.0%) | 3.64 |
Median Household Size in Greenlee County
The median household size in Greenlee County is 2.84 persons per household, with single male/father households (225 | 6.8%) accounting for the largest median household size of 4.23 persons per household. non-family households (1,156 | 35.0%) represent the smallest median household size with 1.17 persons per household.
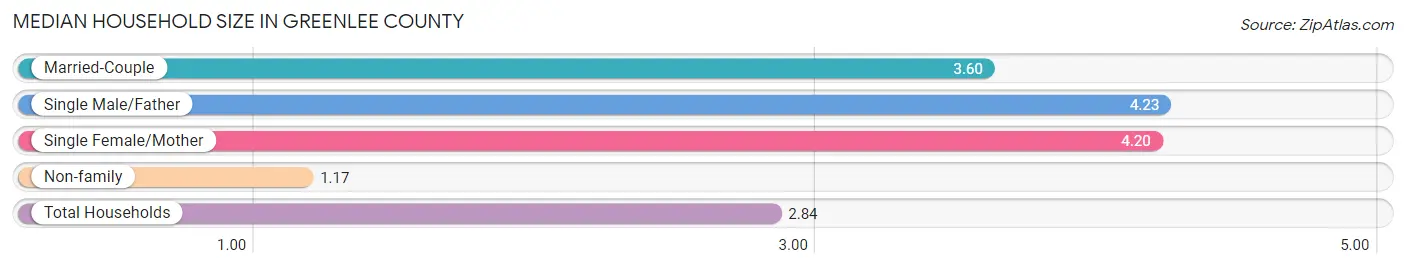
| Household Type | # Households | Household Size |
| Married-Couple | 1,638 (49.6%) | 3.60 |
| Single Male/Father | 225 (6.8%) | 4.23 |
| Single Female/Mother | 285 (8.6%) | 4.20 |
| Non-family | 1,156 (35.0%) | 1.17 |
| Total Households | 3,304 (100.0%) | 2.84 |
Household Size by Marriage Status in Greenlee County
Out of a total of 3,304 households in Greenlee County, 2,148 (65.0%) are family households, while 1,156 (35.0%) are nonfamily households. The most numerous type of family households are 2-person households, comprising 936, and the most common type of nonfamily households are 1-person households, comprising 987.
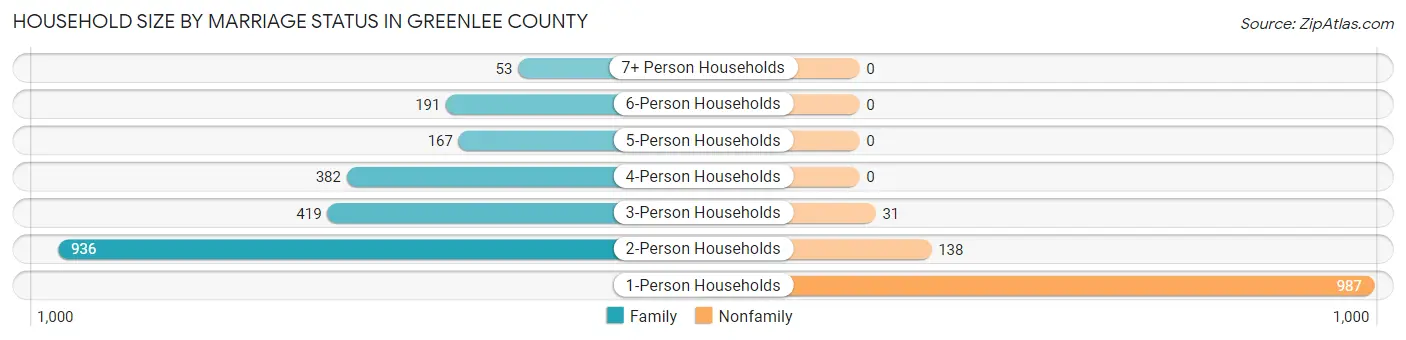
| Household Size | Family Households | Nonfamily Households |
| 1-Person Households | - | 987 (29.9%) |
| 2-Person Households | 936 (28.3%) | 138 (4.2%) |
| 3-Person Households | 419 (12.7%) | 31 (0.9%) |
| 4-Person Households | 382 (11.6%) | 0 (0.0%) |
| 5-Person Households | 167 (5.1%) | 0 (0.0%) |
| 6-Person Households | 191 (5.8%) | 0 (0.0%) |
| 7+ Person Households | 53 (1.6%) | 0 (0.0%) |
| Total | 2,148 (65.0%) | 1,156 (35.0%) |
Female Fertility in Greenlee County
Fertility by Age in Greenlee County
Average fertility rate in Greenlee County is 50.0 births per 1,000 women. Women in the age bracket of 20 to 34 years have the highest fertility rate with 108.0 births per 1,000 women. Women in the age bracket of 20 to 34 years acount for 91.3% of all women with births.
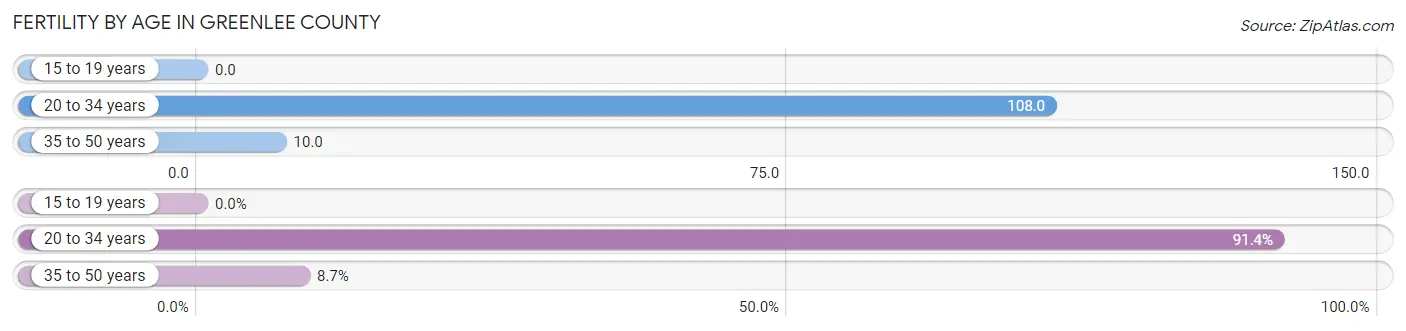
| Age Bracket | Women with Births | Births / 1,000 Women |
| 15 to 19 years | 0 (0.0%) | 0.0 |
| 20 to 34 years | 95 (91.3%) | 108.0 |
| 35 to 50 years | 9 (8.6%) | 10.0 |
| Total | 104 (100.0%) | 50.0 |
Fertility by Age by Marriage Status in Greenlee County
59.6% of women with births (104) in Greenlee County are married. The highest percentage of unmarried women with births falls into 20 to 34 years age bracket with 44.2% of them unmarried at the time of birth, while the lowest percentage of unmarried women with births belong to 35 to 50 years age bracket with 0.0% of them unmarried.
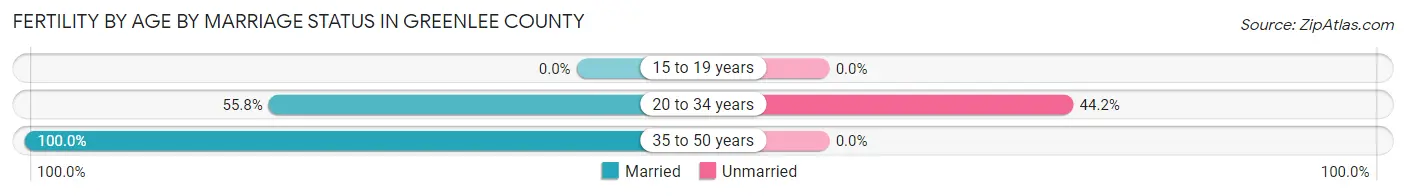
| Age Bracket | Married | Unmarried |
| 15 to 19 years | 0 (0.0%) | 0 (0.0%) |
| 20 to 34 years | 53 (55.8%) | 42 (44.2%) |
| 35 to 50 years | 9 (100.0%) | 0 (0.0%) |
| Total | 62 (59.6%) | 42 (40.4%) |
Fertility by Education in Greenlee County
Average fertility rate in Greenlee County is 50.0 births per 1,000 women. Women with the education attainment of graduate degree have the highest fertility rate of 455.0 births per 1,000 women, while women with the education attainment of less than high school have the lowest fertility at 7.0 births per 1,000 women. Women with the education attainment of high school diploma represent 46.2% of all women with births.
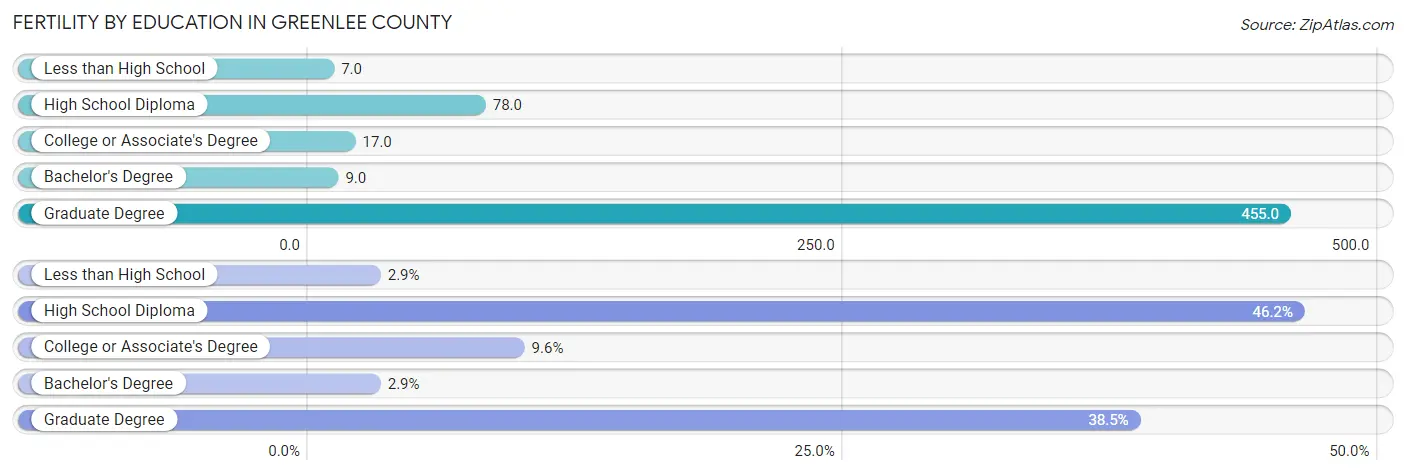
| Educational Attainment | Women with Births | Births / 1,000 Women |
| Less than High School | 3 (2.9%) | 7.0 |
| High School Diploma | 48 (46.2%) | 78.0 |
| College or Associate's Degree | 10 (9.6%) | 17.0 |
| Bachelor's Degree | 3 (2.9%) | 9.0 |
| Graduate Degree | 40 (38.5%) | 455.0 |
| Total | 104 (100.0%) | 50.0 |
Fertility by Education by Marriage Status in Greenlee County
40.4% of women with births in Greenlee County are unmarried. Women with the educational attainment of college or associate's degree are most likely to be married with 100.0% of them married at childbirth, while women with the educational attainment of less than high school are least likely to be married with 100.0% of them unmarried at childbirth.
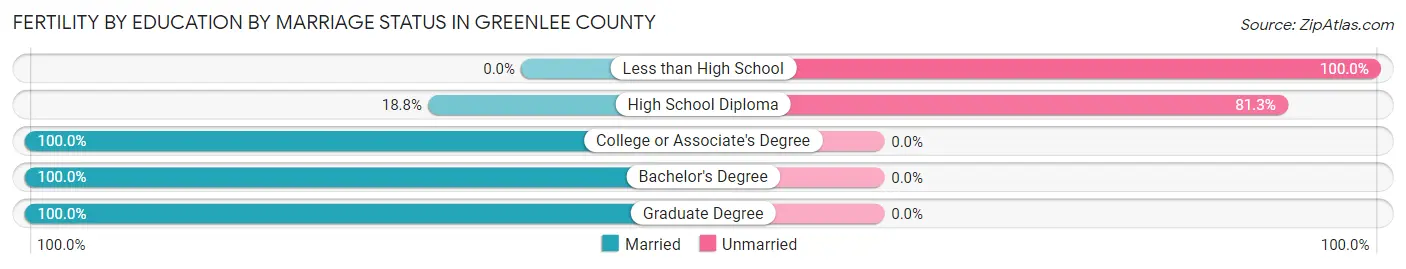
| Educational Attainment | Married | Unmarried |
| Less than High School | 0 (0.0%) | 3 (100.0%) |
| High School Diploma | 9 (18.8%) | 39 (81.2%) |
| College or Associate's Degree | 10 (100.0%) | 0 (0.0%) |
| Bachelor's Degree | 3 (100.0%) | 0 (0.0%) |
| Graduate Degree | 40 (100.0%) | 0 (0.0%) |
| Total | 62 (59.6%) | 42 (40.4%) |
Income in Greenlee County
Income Overview in Greenlee County
Per Capita Income in Greenlee County is $29,394, while median incomes of families and households are $78,172 and $73,756 respectively.
| Characteristic | Number | Measure |
| Per Capita Income | 9,483 | $29,394 |
| Median Family Income | 2,148 | $78,172 |
| Mean Family Income | 2,148 | $92,535 |
| Median Household Income | 3,304 | $73,756 |
| Mean Household Income | 3,304 | $79,905 |
| Income Deficit | 2,148 | $0 |
| Wage / Income Gap (%) | 9,483 | 50.18% |
| Wage / Income Gap ($) | 9,483 | 49.82¢ per $1 |
| Gini / Inequality Index | 9,483 | 0.38 |
Earnings by Sex in Greenlee County
Average Earnings in Greenlee County are $45,731, $56,637 for men and $28,214 for women, a difference of 50.2%.
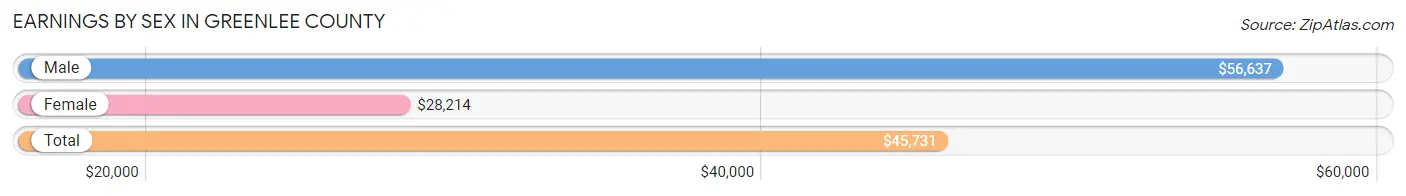
| Sex | Number | Average Earnings |
| Male | 2,706 (62.0%) | $56,637 |
| Female | 1,656 (38.0%) | $28,214 |
| Total | 4,362 (100.0%) | $45,731 |
Earnings by Sex by Income Bracket in Greenlee County
The most common earnings brackets in Greenlee County are $75,000 to $99,999 for men (527 | 19.5%) and $25,000 to $29,999 for women (312 | 18.8%).
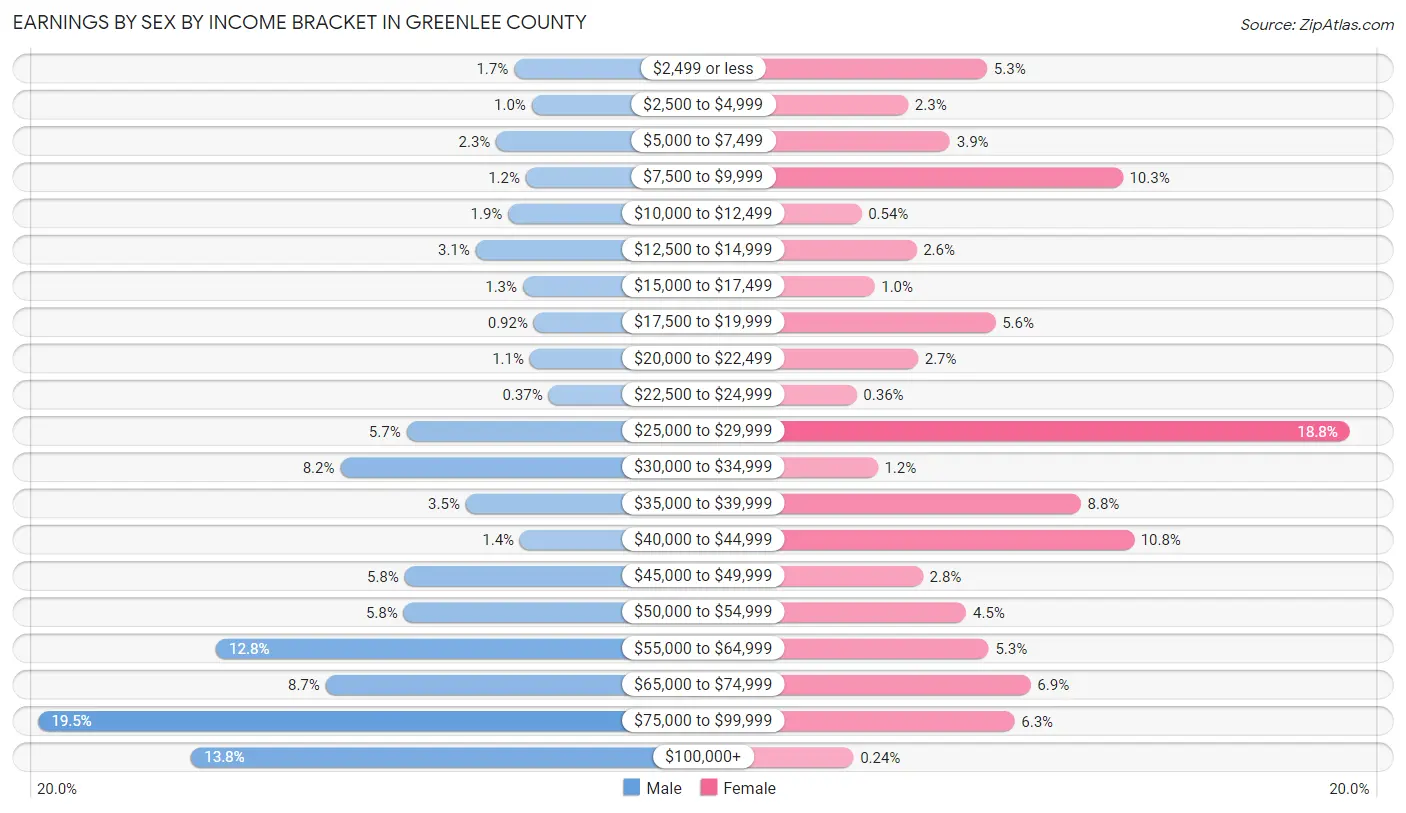
| Income | Male | Female |
| $2,499 or less | 45 (1.7%) | 87 (5.2%) |
| $2,500 to $4,999 | 27 (1.0%) | 38 (2.3%) |
| $5,000 to $7,499 | 63 (2.3%) | 64 (3.9%) |
| $7,500 to $9,999 | 33 (1.2%) | 171 (10.3%) |
| $10,000 to $12,499 | 51 (1.9%) | 9 (0.5%) |
| $12,500 to $14,999 | 84 (3.1%) | 43 (2.6%) |
| $15,000 to $17,499 | 36 (1.3%) | 17 (1.0%) |
| $17,500 to $19,999 | 25 (0.9%) | 92 (5.6%) |
| $20,000 to $22,499 | 29 (1.1%) | 44 (2.7%) |
| $22,500 to $24,999 | 10 (0.4%) | 6 (0.4%) |
| $25,000 to $29,999 | 154 (5.7%) | 312 (18.8%) |
| $30,000 to $34,999 | 221 (8.2%) | 19 (1.1%) |
| $35,000 to $39,999 | 94 (3.5%) | 145 (8.8%) |
| $40,000 to $44,999 | 39 (1.4%) | 178 (10.7%) |
| $45,000 to $49,999 | 156 (5.8%) | 47 (2.8%) |
| $50,000 to $54,999 | 157 (5.8%) | 74 (4.5%) |
| $55,000 to $64,999 | 347 (12.8%) | 88 (5.3%) |
| $65,000 to $74,999 | 236 (8.7%) | 114 (6.9%) |
| $75,000 to $99,999 | 527 (19.5%) | 104 (6.3%) |
| $100,000+ | 372 (13.8%) | 4 (0.2%) |
| Total | 2,706 (100.0%) | 1,656 (100.0%) |
Earnings by Sex by Educational Attainment in Greenlee County
Average earnings in Greenlee County are $59,861 for men and $36,286 for women, a difference of 39.4%. Men with an educational attainment of graduate degree enjoy the highest average annual earnings of $99,792, while those with high school diploma education earn the least with $48,537. Women with an educational attainment of high school diploma earn the most with the average annual earnings of $40,318, while those with less than high school education have the smallest earnings of $21,667.
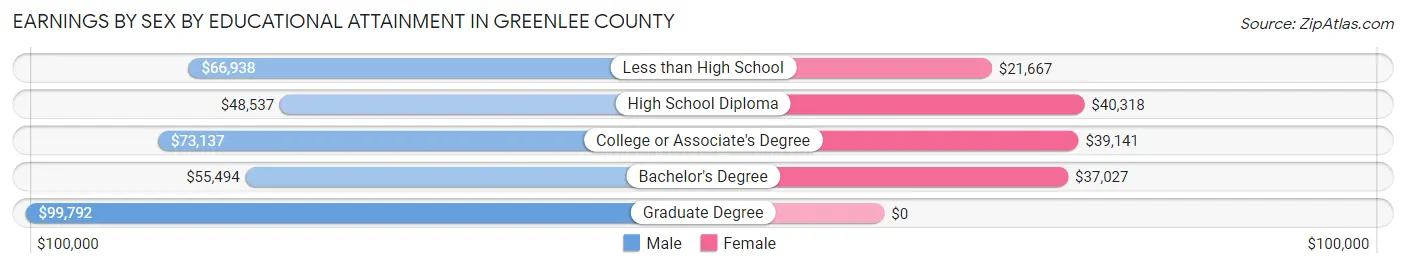
| Educational Attainment | Male Income | Female Income |
| Less than High School | $66,938 | $21,667 |
| High School Diploma | $48,537 | $40,318 |
| College or Associate's Degree | $73,137 | $39,141 |
| Bachelor's Degree | $55,494 | $37,027 |
| Graduate Degree | $99,792 | $0 |
| Total | $59,861 | $36,286 |
Family Income in Greenlee County
Family Income Brackets in Greenlee County
According to the Greenlee County family income data, there are 647 families falling into the $50,000 to $74,999 income range, which is the most common income bracket and makes up 30.1% of all families. Conversely, the $10,000 to $14,999 income bracket is the least frequent group with only 34 families (1.6%) belonging to this category.
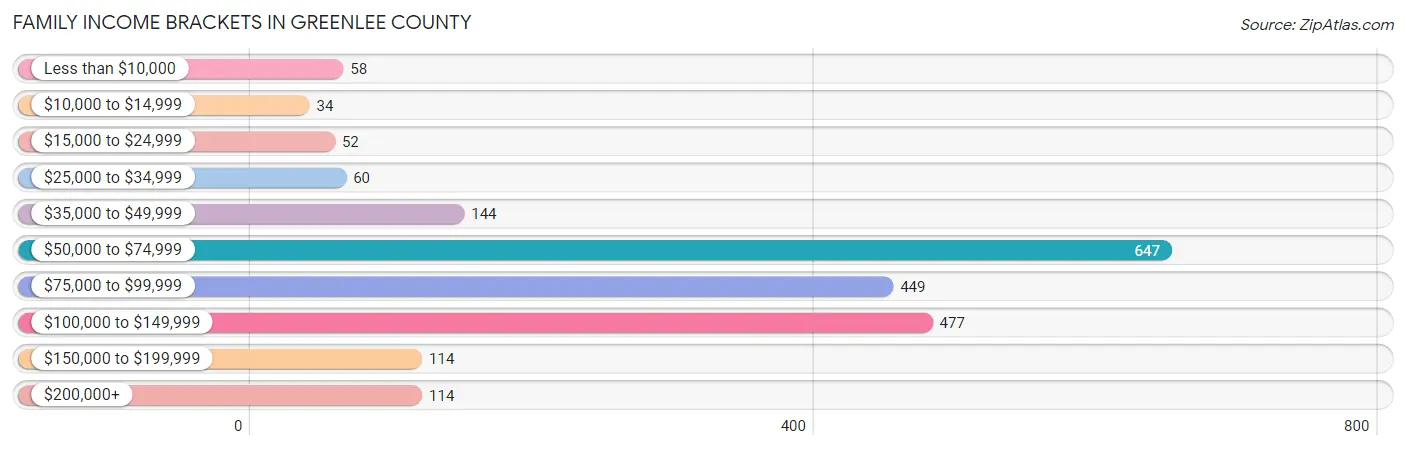
| Income Bracket | # Families | % Families |
| Less than $10,000 | 58 | 2.7% |
| $10,000 to $14,999 | 34 | 1.6% |
| $15,000 to $24,999 | 52 | 2.4% |
| $25,000 to $34,999 | 60 | 2.8% |
| $35,000 to $49,999 | 144 | 6.7% |
| $50,000 to $74,999 | 647 | 30.1% |
| $75,000 to $99,999 | 449 | 20.9% |
| $100,000 to $149,999 | 477 | 22.2% |
| $150,000 to $199,999 | 114 | 5.3% |
| $200,000+ | 114 | 5.3% |
Family Income by Famaliy Size in Greenlee County
5-person families (155 | 7.2%) account for the highest median family income in Greenlee County with $89,044 per family, while 2-person families (968 | 45.1%) have the highest median income of $36,863 per family member.
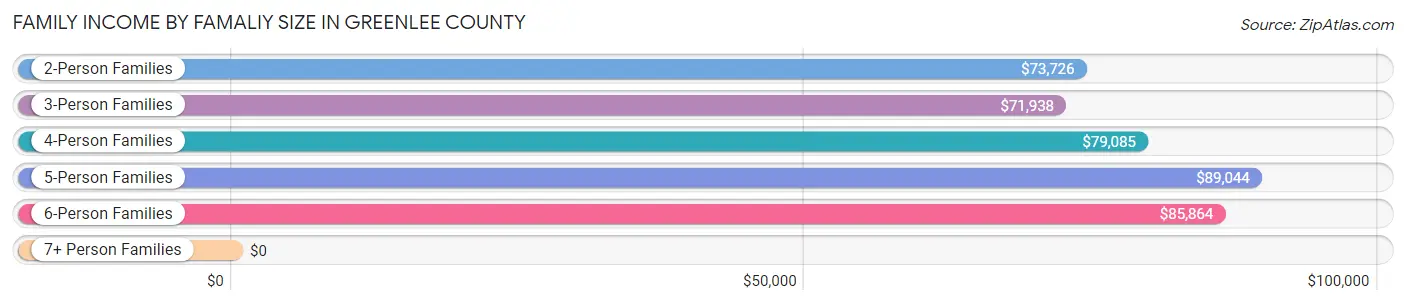
| Income Bracket | # Families | Median Income |
| 2-Person Families | 968 (45.1%) | $73,726 |
| 3-Person Families | 429 (20.0%) | $71,938 |
| 4-Person Families | 365 (17.0%) | $79,085 |
| 5-Person Families | 155 (7.2%) | $89,044 |
| 6-Person Families | 180 (8.4%) | $85,864 |
| 7+ Person Families | 51 (2.4%) | $0 |
| Total | 2,148 (100.0%) | $78,172 |
Family Income by Number of Earners in Greenlee County
The median family income in Greenlee County is $78,172, with families comprising 3+ earners (161) having the highest median family income of $137,298, while families with no earners (355) have the lowest median family income of $49,922, accounting for 7.5% and 16.5% of families, respectively.
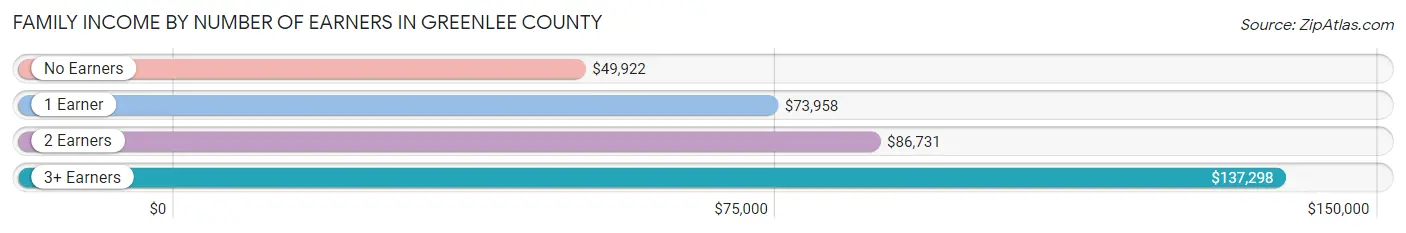
| Number of Earners | # Families | Median Income |
| No Earners | 355 (16.5%) | $49,922 |
| 1 Earner | 940 (43.8%) | $73,958 |
| 2 Earners | 692 (32.2%) | $86,731 |
| 3+ Earners | 161 (7.5%) | $137,298 |
| Total | 2,148 (100.0%) | $78,172 |
Household Income in Greenlee County
Household Income Brackets in Greenlee County
With 691 households falling in the category, the $50,000 to $74,999 income range is the most frequent in Greenlee County, accounting for 20.9% of all households. In contrast, only 106 households (3.2%) fall into the $10,000 to $14,999 income bracket, making it the least populous group.
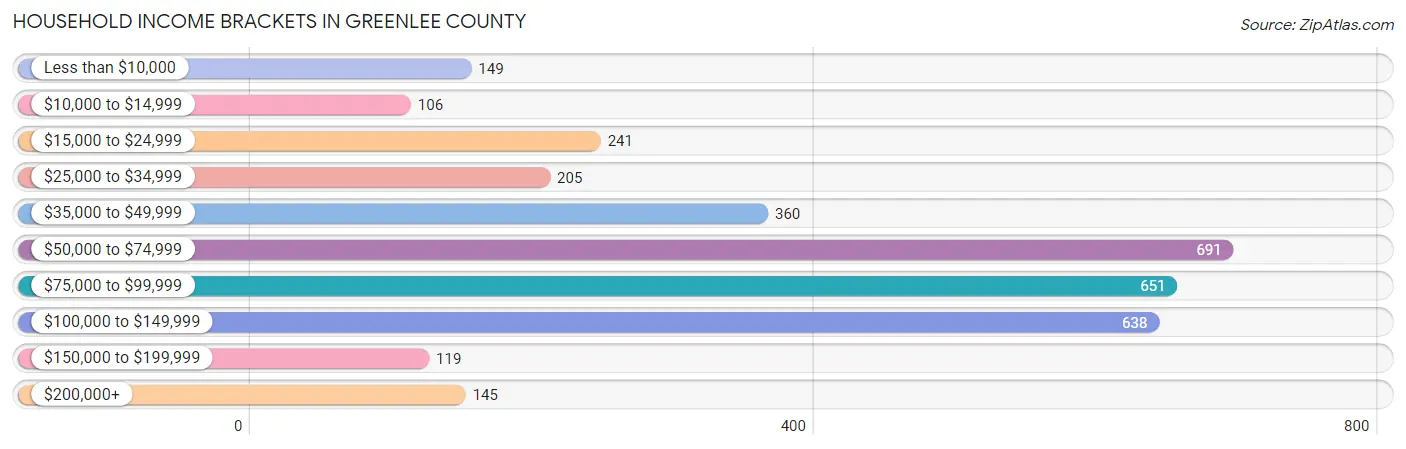
| Income Bracket | # Households | % Households |
| Less than $10,000 | 149 | 4.5% |
| $10,000 to $14,999 | 106 | 3.2% |
| $15,000 to $24,999 | 241 | 7.3% |
| $25,000 to $34,999 | 205 | 6.2% |
| $35,000 to $49,999 | 360 | 10.9% |
| $50,000 to $74,999 | 691 | 20.9% |
| $75,000 to $99,999 | 651 | 19.7% |
| $100,000 to $149,999 | 638 | 19.3% |
| $150,000 to $199,999 | 119 | 3.6% |
| $200,000+ | 145 | 4.4% |
Household Income by Householder Age in Greenlee County
The median household income in Greenlee County is $73,756, with the highest median household income of $79,615 found in the 45 to 64 years age bracket for the primary householder. A total of 1,182 households (35.8%) fall into this category. Meanwhile, the 65+ years age bracket for the primary householder has the lowest median household income of $35,949, with 811 households (24.5%) in this group.
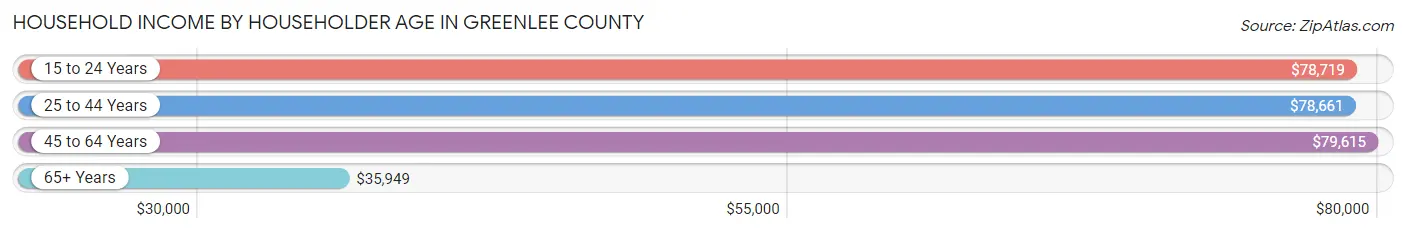
| Income Bracket | # Households | Median Income |
| 15 to 24 Years | 111 (3.4%) | $78,719 |
| 25 to 44 Years | 1,200 (36.3%) | $78,661 |
| 45 to 64 Years | 1,182 (35.8%) | $79,615 |
| 65+ Years | 811 (24.5%) | $35,949 |
| Total | 3,304 (100.0%) | $73,756 |
Poverty in Greenlee County
Income Below Poverty by Sex and Age in Greenlee County
With 10.7% poverty level for males and 15.1% for females among the residents of Greenlee County, 12 to 14 year old males and 6 to 11 year old females are the most vulnerable to poverty, with 115 males (34.7%) and 138 females (26.8%) in their respective age groups living below the poverty level.
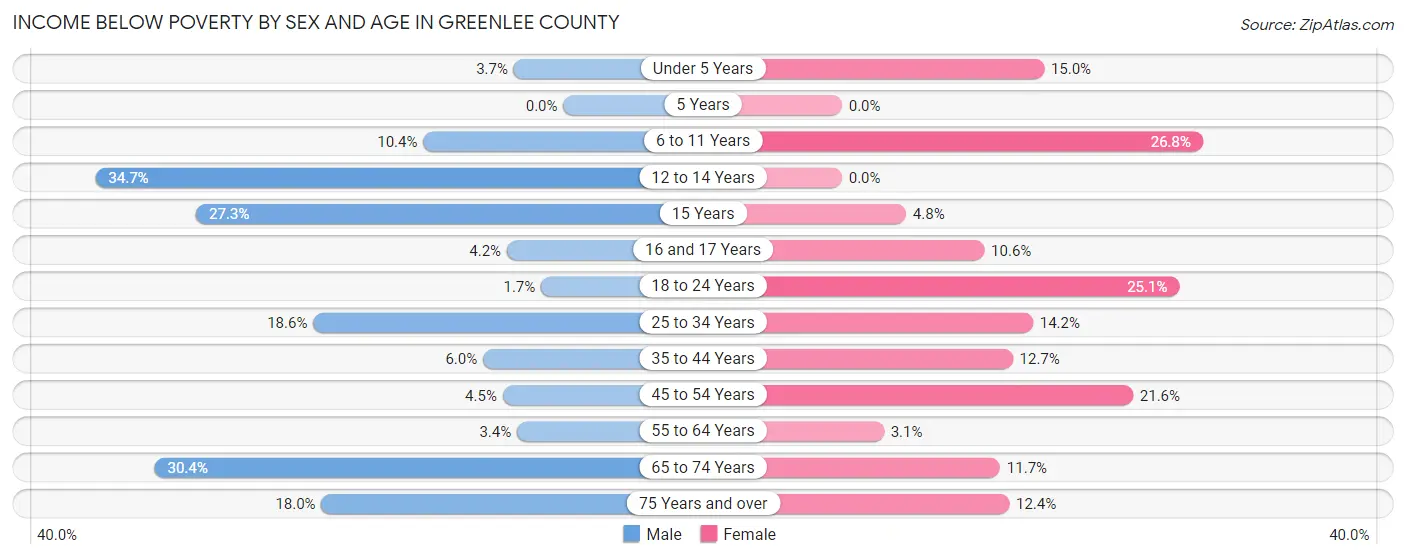
| Age Bracket | Male | Female |
| Under 5 Years | 12 (3.7%) | 53 (15.0%) |
| 5 Years | 0 (0.0%) | 0 (0.0%) |
| 6 to 11 Years | 39 (10.4%) | 138 (26.8%) |
| 12 to 14 Years | 115 (34.7%) | 0 (0.0%) |
| 15 Years | 9 (27.3%) | 1 (4.8%) |
| 16 and 17 Years | 9 (4.2%) | 13 (10.6%) |
| 18 to 24 Years | 9 (1.7%) | 122 (25.1%) |
| 25 to 34 Years | 86 (18.6%) | 76 (14.2%) |
| 35 to 44 Years | 53 (6.0%) | 88 (12.7%) |
| 45 to 54 Years | 24 (4.5%) | 83 (21.6%) |
| 55 to 64 Years | 21 (3.4%) | 13 (3.1%) |
| 65 to 74 Years | 129 (30.3%) | 48 (11.7%) |
| 75 Years and over | 30 (18.0%) | 37 (12.4%) |
| Total | 536 (10.7%) | 672 (15.1%) |
Income Above Poverty by Sex and Age in Greenlee County
According to the poverty statistics in Greenlee County, males aged 5 years and females aged 12 to 14 years are the age groups that are most secure financially, with 100.0% of males and 100.0% of females in these age groups living above the poverty line.
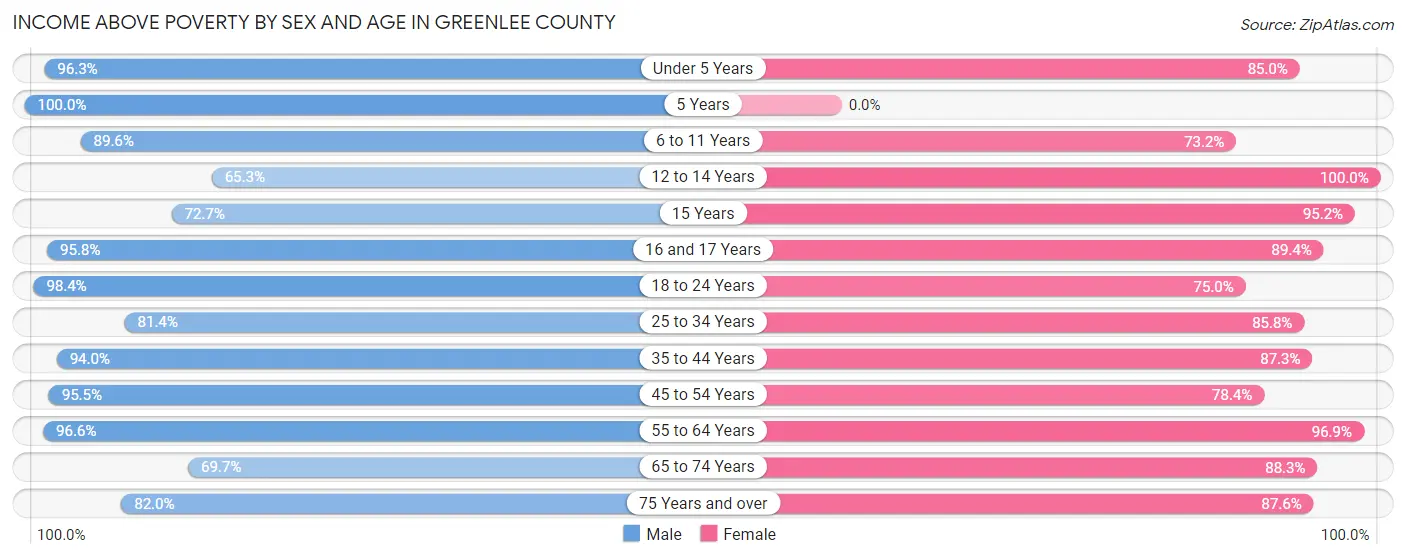
| Age Bracket | Male | Female |
| Under 5 Years | 314 (96.3%) | 300 (85.0%) |
| 5 Years | 74 (100.0%) | 0 (0.0%) |
| 6 to 11 Years | 336 (89.6%) | 377 (73.2%) |
| 12 to 14 Years | 216 (65.3%) | 205 (100.0%) |
| 15 Years | 24 (72.7%) | 20 (95.2%) |
| 16 and 17 Years | 206 (95.8%) | 110 (89.4%) |
| 18 to 24 Years | 535 (98.4%) | 365 (75.0%) |
| 25 to 34 Years | 377 (81.4%) | 460 (85.8%) |
| 35 to 44 Years | 836 (94.0%) | 606 (87.3%) |
| 45 to 54 Years | 509 (95.5%) | 301 (78.4%) |
| 55 to 64 Years | 589 (96.6%) | 405 (96.9%) |
| 65 to 74 Years | 296 (69.7%) | 361 (88.3%) |
| 75 Years and over | 137 (82.0%) | 261 (87.6%) |
| Total | 4,449 (89.2%) | 3,771 (84.9%) |
Income Below Poverty Among Married-Couple Families in Greenlee County
The poverty statistics for married-couple families in Greenlee County show that 6.4% or 105 of the total 1,638 families live below the poverty line. Families with 5 or more children have the highest poverty rate of 31.8%, comprising of 14 families. On the other hand, families with no children have the lowest poverty rate of 3.7%, which includes 33 families.
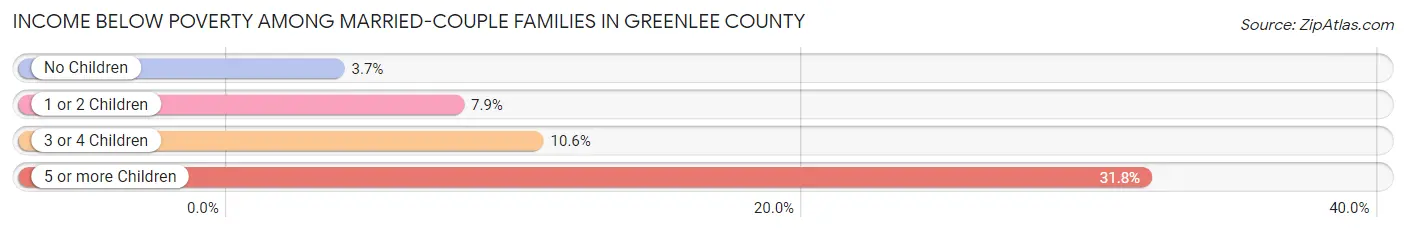
| Children | Above Poverty | Below Poverty |
| No Children | 857 (96.3%) | 33 (3.7%) |
| 1 or 2 Children | 562 (92.1%) | 48 (7.9%) |
| 3 or 4 Children | 84 (89.4%) | 10 (10.6%) |
| 5 or more Children | 30 (68.2%) | 14 (31.8%) |
| Total | 1,533 (93.6%) | 105 (6.4%) |
Income Below Poverty Among Single-Parent Households in Greenlee County
According to the poverty data in Greenlee County, 1.3% or 3 single-father households and 17.2% or 49 single-mother households are living below the poverty line. Among single-father households, those with 1 or 2 children have the highest poverty rate, with 3 households (3.6%) experiencing poverty. Likewise, among single-mother households, those with 5 or more children have the highest poverty rate, with 1 households (100.0%) falling below the poverty line.
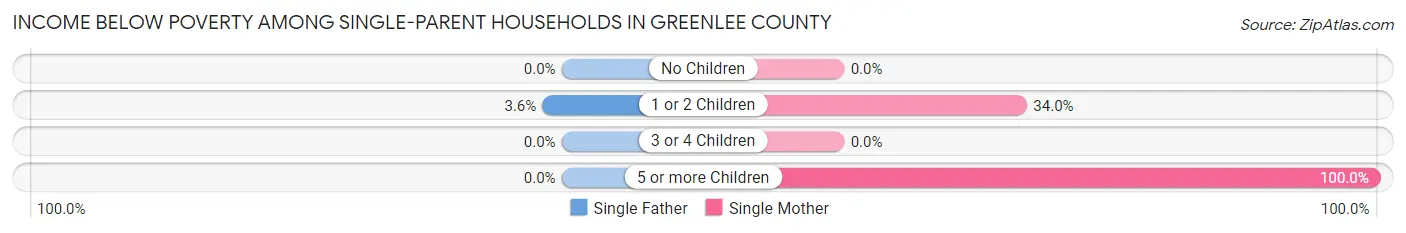
| Children | Single Father | Single Mother |
| No Children | 0 (0.0%) | 0 (0.0%) |
| 1 or 2 Children | 3 (3.6%) | 48 (34.0%) |
| 3 or 4 Children | 0 (0.0%) | 0 (0.0%) |
| 5 or more Children | 0 (0.0%) | 1 (100.0%) |
| Total | 3 (1.3%) | 49 (17.2%) |
Income Below Poverty Among Married-Couple vs Single-Parent Households in Greenlee County
The poverty data for Greenlee County shows that 105 of the married-couple family households (6.4%) and 52 of the single-parent households (10.2%) are living below the poverty level. Within the married-couple family households, those with 5 or more children have the highest poverty rate, with 14 households (31.8%) falling below the poverty line. Among the single-parent households, those with 5 or more children have the highest poverty rate, with 1 household (33.3%) living below poverty.
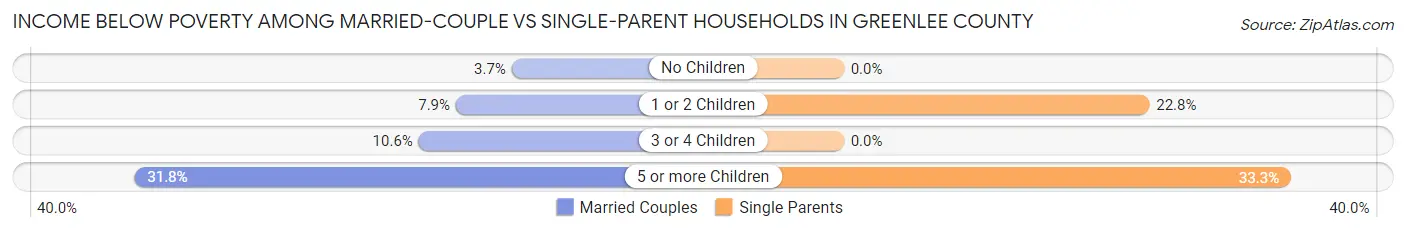
| Children | Married-Couple Families | Single-Parent Households |
| No Children | 33 (3.7%) | 0 (0.0%) |
| 1 or 2 Children | 48 (7.9%) | 51 (22.8%) |
| 3 or 4 Children | 10 (10.6%) | 0 (0.0%) |
| 5 or more Children | 14 (31.8%) | 1 (33.3%) |
| Total | 105 (6.4%) | 52 (10.2%) |
Employment Characteristics in Greenlee County
Employment by Class of Employer in Greenlee County
Among the 4,129 employed individuals in Greenlee County, private company employees (3,116 | 75.5%), local government employees (409 | 9.9%), and state government employees (238 | 5.8%) make up the most common classes of employment.
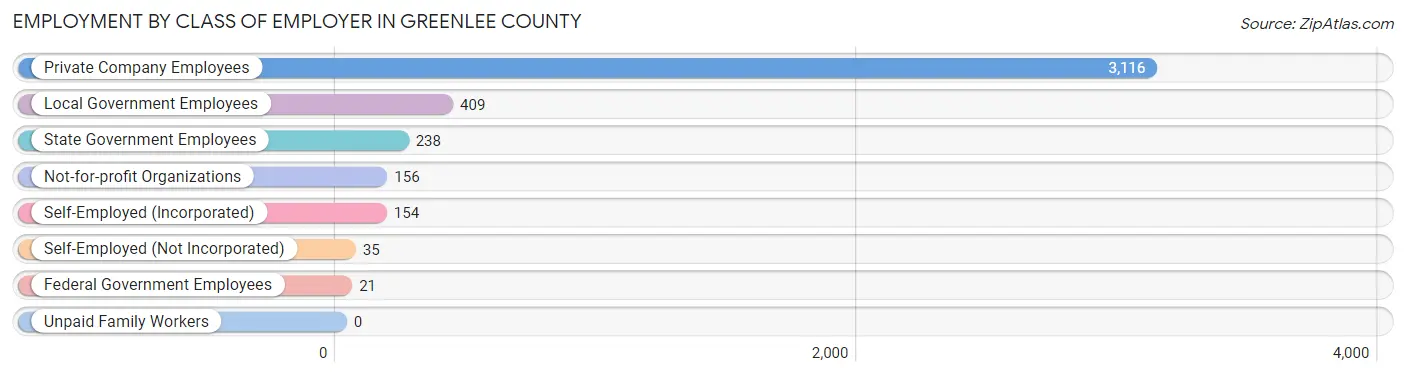
| Employer Class | # Employees | % Employees |
| Private Company Employees | 3,116 | 75.5% |
| Self-Employed (Incorporated) | 154 | 3.7% |
| Self-Employed (Not Incorporated) | 35 | 0.9% |
| Not-for-profit Organizations | 156 | 3.8% |
| Local Government Employees | 409 | 9.9% |
| State Government Employees | 238 | 5.8% |
| Federal Government Employees | 21 | 0.5% |
| Unpaid Family Workers | 0 | 0.0% |
| Total | 4,129 | 100.0% |
Employment Status by Age in Greenlee County
According to the labor force statistics for Greenlee County, out of the total population over 16 years of age (7,232), 59.1% or 4,274 individuals are in the labor force, with 3.0% or 128 of them unemployed. The age group with the highest labor force participation rate is 25 to 29 years, with 82.2% or 388 individuals in the labor force. Within the labor force, the 16 to 19 years age range has the highest percentage of unemployed individuals, with 32.6% or 77 of them being unemployed.
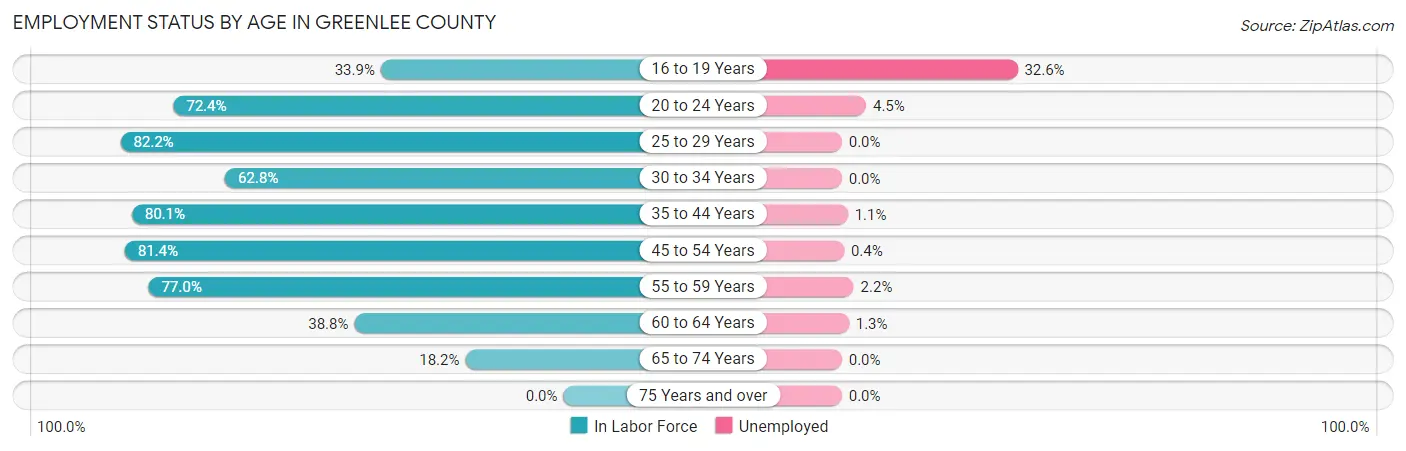
| Age Bracket | In Labor Force | Unemployed |
| 16 to 19 Years | 236 (33.9%) | 77 (32.6%) |
| 20 to 24 Years | 494 (72.4%) | 22 (4.5%) |
| 25 to 29 Years | 388 (82.2%) | 0 (0.0%) |
| 30 to 34 Years | 339 (62.8%) | 0 (0.0%) |
| 35 to 44 Years | 1,280 (80.1%) | 14 (1.1%) |
| 45 to 54 Years | 746 (81.4%) | 3 (0.4%) |
| 55 to 59 Years | 490 (77.0%) | 11 (2.2%) |
| 60 to 64 Years | 152 (38.8%) | 2 (1.3%) |
| 65 to 74 Years | 152 (18.2%) | 0 (0.0%) |
| 75 Years and over | 0 (0.0%) | 0 (0.0%) |
| Total | 4,274 (59.1%) | 128 (3.0%) |
Employment Status by Educational Attainment in Greenlee County
According to labor force statistics for Greenlee County, 74.5% of individuals (3,393) out of the total population between 25 and 64 years of age (4,555) are in the labor force, with 0.9% or 31 of them being unemployed. The group with the highest labor force participation rate are those with the educational attainment of bachelor's degree or higher, with 86.7% or 778 individuals in the labor force. Within the labor force, individuals with less than high school education have the highest percentage of unemployment, with 5.1% or 18 of them being unemployed.
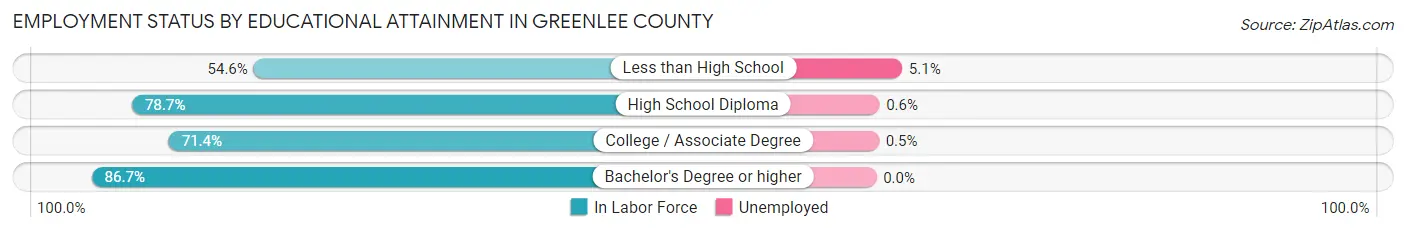
| Educational Attainment | In Labor Force | Unemployed |
| Less than High School | 351 (54.6%) | 33 (5.1%) |
| High School Diploma | 1,216 (78.7%) | 9 (0.6%) |
| College / Associate Degree | 1,050 (71.4%) | 7 (0.5%) |
| Bachelor's Degree or higher | 778 (86.7%) | 0 (0.0%) |
| Total | 3,393 (74.5%) | 41 (0.9%) |
Employment Occupations by Sex in Greenlee County
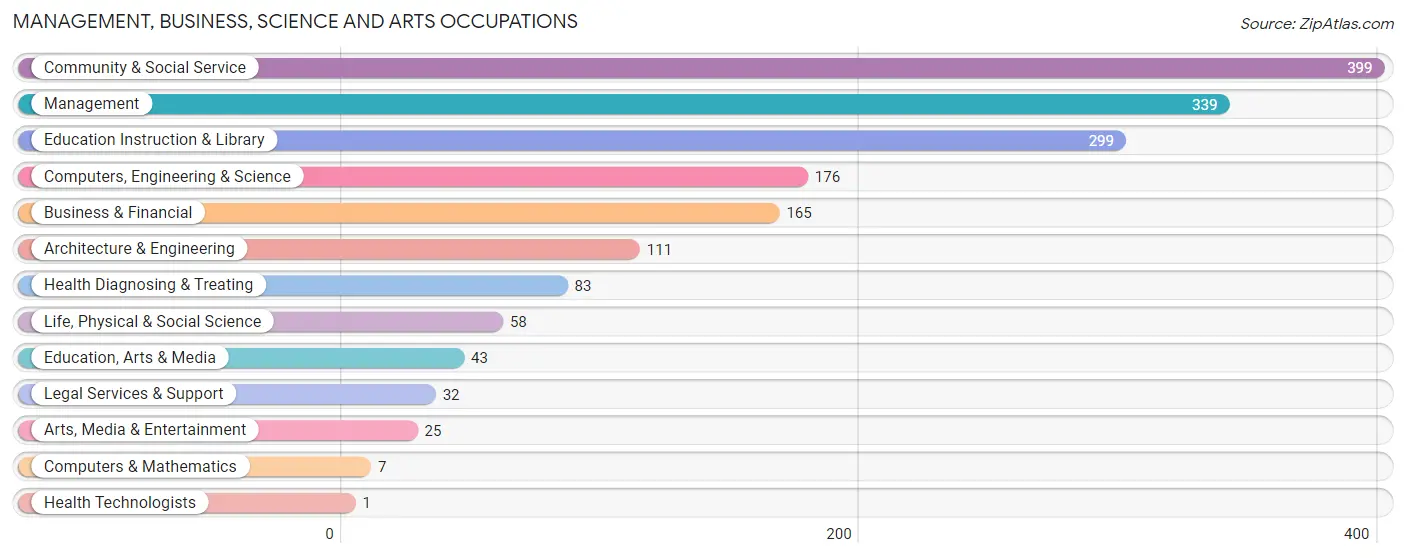
Management, Business, Science and Arts Occupations
The most common Management, Business, Science and Arts occupations in Greenlee County are Community & Social Service (399 | 9.6%), Management (339 | 8.2%), Education Instruction & Library (299 | 7.2%), Computers, Engineering & Science (176 | 4.2%), and Business & Financial (165 | 4.0%).
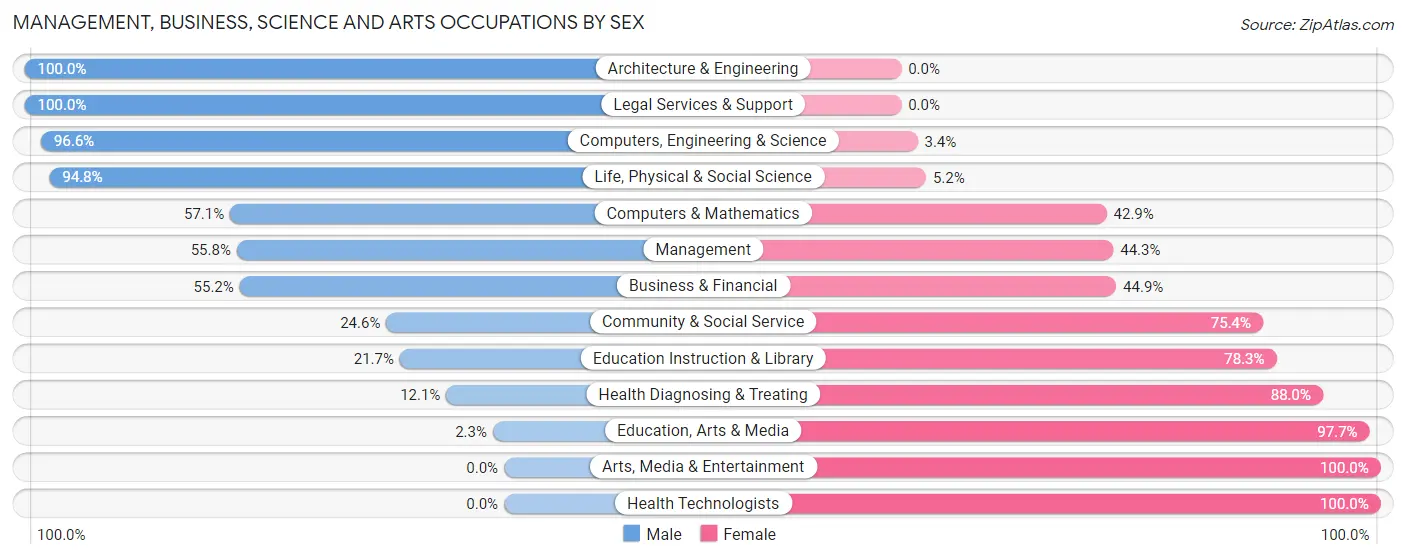
Management, Business, Science and Arts Occupations by Sex
Within the Management, Business, Science and Arts occupations in Greenlee County, the most male-oriented occupations are Architecture & Engineering (100.0%), Legal Services & Support (100.0%), and Computers, Engineering & Science (96.6%), while the most female-oriented occupations are Arts, Media & Entertainment (100.0%), Health Technologists (100.0%), and Education, Arts & Media (97.7%).
| Occupation | Male | Female |
| Management | 189 (55.7%) | 150 (44.3%) |
| Business & Financial | 91 (55.1%) | 74 (44.9%) |
| Computers, Engineering & Science | 170 (96.6%) | 6 (3.4%) |
| Computers & Mathematics | 4 (57.1%) | 3 (42.9%) |
| Architecture & Engineering | 111 (100.0%) | 0 (0.0%) |
| Life, Physical & Social Science | 55 (94.8%) | 3 (5.2%) |
| Community & Social Service | 98 (24.6%) | 301 (75.4%) |
| Education, Arts & Media | 1 (2.3%) | 42 (97.7%) |
| Legal Services & Support | 32 (100.0%) | 0 (0.0%) |
| Education Instruction & Library | 65 (21.7%) | 234 (78.3%) |
| Arts, Media & Entertainment | 0 (0.0%) | 25 (100.0%) |
| Health Diagnosing & Treating | 10 (12.0%) | 73 (87.9%) |
| Health Technologists | 0 (0.0%) | 1 (100.0%) |
| Total (Category) | 558 (48.0%) | 604 (52.0%) |
| Total (Overall) | 2,634 (63.5%) | 1,514 (36.5%) |
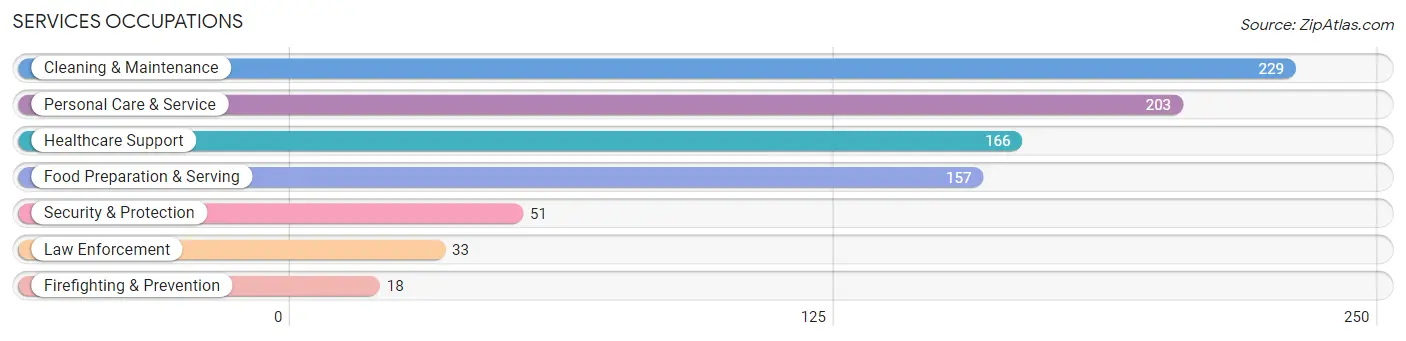
Services Occupations
The most common Services occupations in Greenlee County are Cleaning & Maintenance (229 | 5.5%), Personal Care & Service (203 | 4.9%), Healthcare Support (166 | 4.0%), Food Preparation & Serving (157 | 3.8%), and Security & Protection (51 | 1.2%).
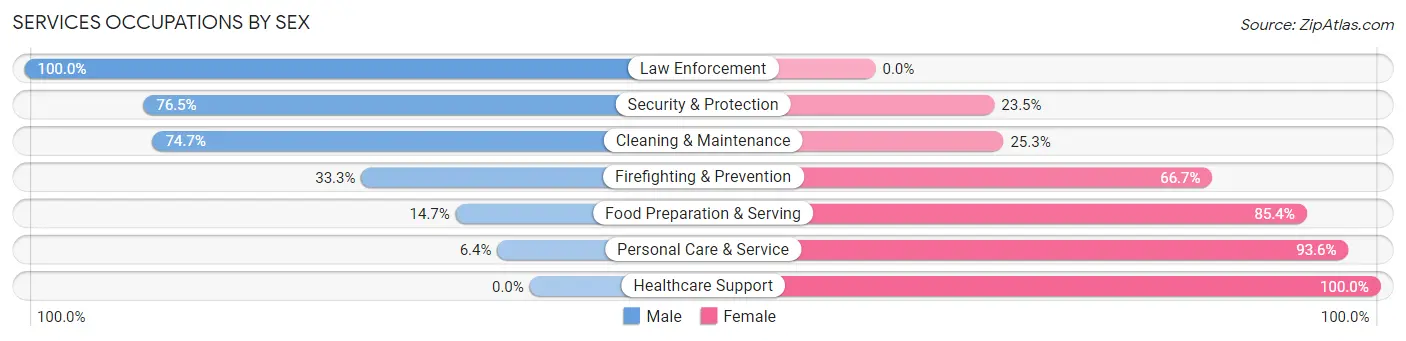
Services Occupations by Sex
Within the Services occupations in Greenlee County, the most male-oriented occupations are Law Enforcement (100.0%), Security & Protection (76.5%), and Cleaning & Maintenance (74.7%), while the most female-oriented occupations are Healthcare Support (100.0%), Personal Care & Service (93.6%), and Food Preparation & Serving (85.4%).
| Occupation | Male | Female |
| Healthcare Support | 0 (0.0%) | 166 (100.0%) |
| Security & Protection | 39 (76.5%) | 12 (23.5%) |
| Firefighting & Prevention | 6 (33.3%) | 12 (66.7%) |
| Law Enforcement | 33 (100.0%) | 0 (0.0%) |
| Food Preparation & Serving | 23 (14.6%) | 134 (85.4%) |
| Cleaning & Maintenance | 171 (74.7%) | 58 (25.3%) |
| Personal Care & Service | 13 (6.4%) | 190 (93.6%) |
| Total (Category) | 246 (30.5%) | 560 (69.5%) |
| Total (Overall) | 2,634 (63.5%) | 1,514 (36.5%) |
Sales and Office Occupations
The most common Sales and Office occupations in Greenlee County are Office & Administration (290 | 7.0%), and Sales & Related (113 | 2.7%).
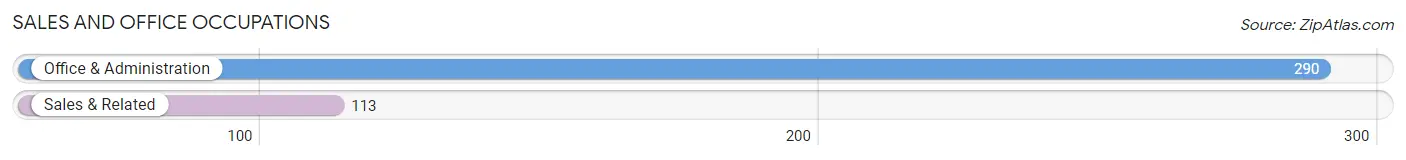
Sales and Office Occupations by Sex
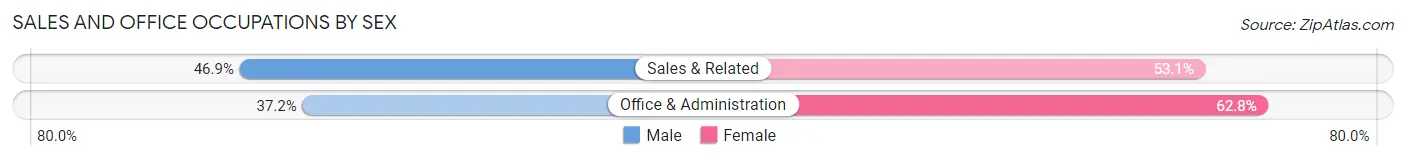
| Occupation | Male | Female |
| Sales & Related | 53 (46.9%) | 60 (53.1%) |
| Office & Administration | 108 (37.2%) | 182 (62.8%) |
| Total (Category) | 161 (40.0%) | 242 (60.1%) |
| Total (Overall) | 2,634 (63.5%) | 1,514 (36.5%) |
Natural Resources, Construction and Maintenance Occupations
The most common Natural Resources, Construction and Maintenance occupations in Greenlee County are Construction & Extraction (570 | 13.7%), Installation, Maintenance & Repair (493 | 11.9%), and Farming, Fishing & Forestry (111 | 2.7%).
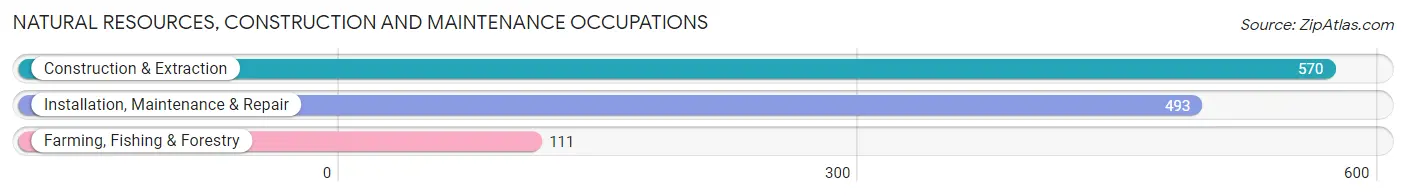
Natural Resources, Construction and Maintenance Occupations by Sex
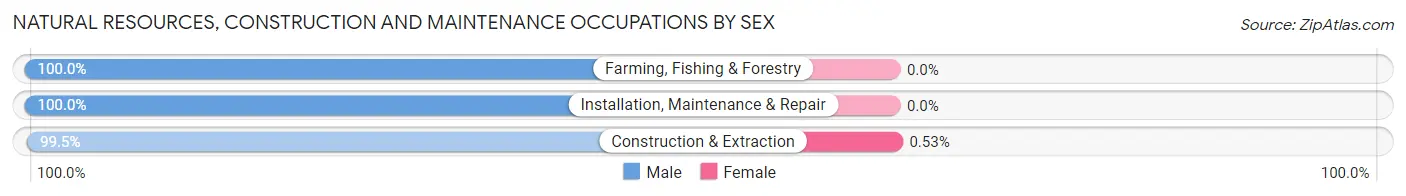
| Occupation | Male | Female |
| Farming, Fishing & Forestry | 111 (100.0%) | 0 (0.0%) |
| Construction & Extraction | 567 (99.5%) | 3 (0.5%) |
| Installation, Maintenance & Repair | 493 (100.0%) | 0 (0.0%) |
| Total (Category) | 1,171 (99.7%) | 3 (0.3%) |
| Total (Overall) | 2,634 (63.5%) | 1,514 (36.5%) |
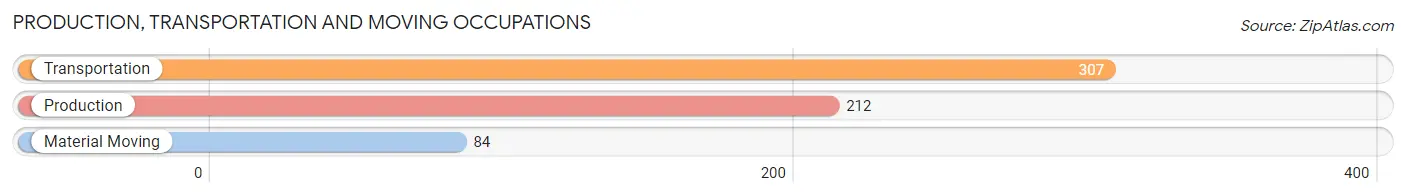
Production, Transportation and Moving Occupations
The most common Production, Transportation and Moving occupations in Greenlee County are Transportation (307 | 7.4%), Production (212 | 5.1%), and Material Moving (84 | 2.0%).
Production, Transportation and Moving Occupations by Sex
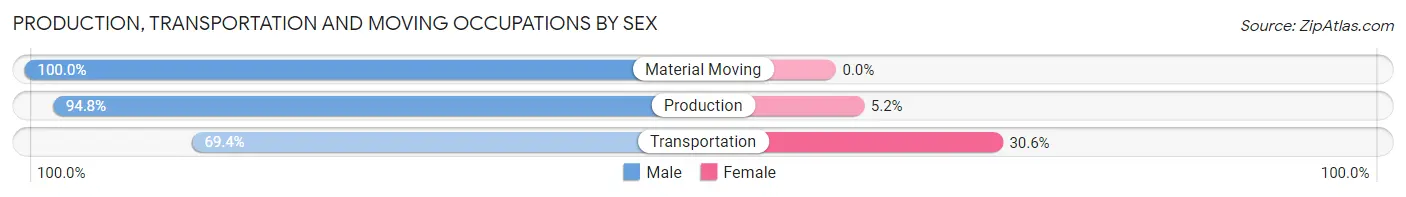
| Occupation | Male | Female |
| Production | 201 (94.8%) | 11 (5.2%) |
| Transportation | 213 (69.4%) | 94 (30.6%) |
| Material Moving | 84 (100.0%) | 0 (0.0%) |
| Total (Category) | 498 (82.6%) | 105 (17.4%) |
| Total (Overall) | 2,634 (63.5%) | 1,514 (36.5%) |
Employment Industries by Sex in Greenlee County
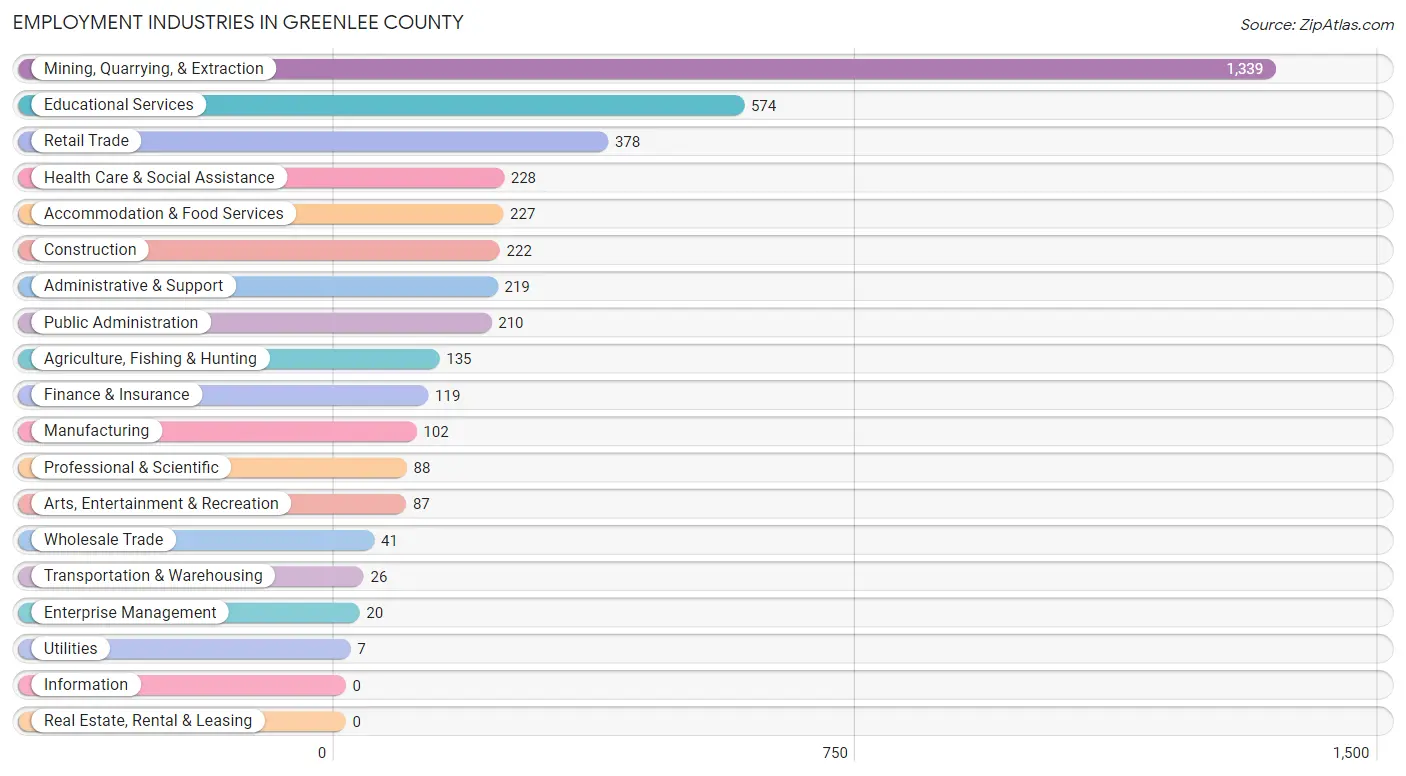
Employment Industries in Greenlee County
The major employment industries in Greenlee County include Mining, Quarrying, & Extraction (1,339 | 32.3%), Educational Services (574 | 13.8%), Retail Trade (378 | 9.1%), Health Care & Social Assistance (228 | 5.5%), and Accommodation & Food Services (227 | 5.5%).
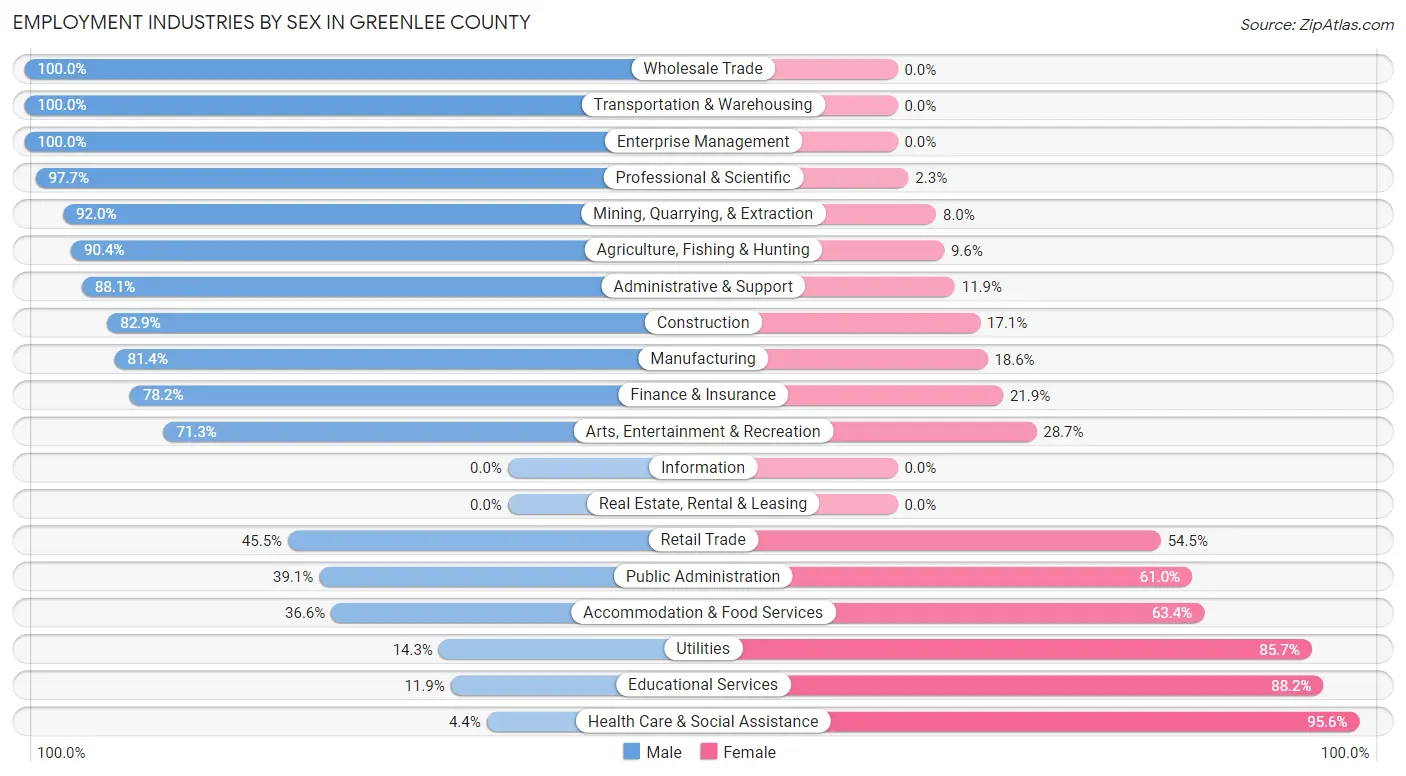
Employment Industries by Sex in Greenlee County
The Greenlee County industries that see more men than women are Wholesale Trade (100.0%), Transportation & Warehousing (100.0%), and Enterprise Management (100.0%), whereas the industries that tend to have a higher number of women are Health Care & Social Assistance (95.6%), Educational Services (88.1%), and Utilities (85.7%).
| Industry | Male | Female |
| Agriculture, Fishing & Hunting | 122 (90.4%) | 13 (9.6%) |
| Mining, Quarrying, & Extraction | 1,232 (92.0%) | 107 (8.0%) |
| Construction | 184 (82.9%) | 38 (17.1%) |
| Manufacturing | 83 (81.4%) | 19 (18.6%) |
| Wholesale Trade | 41 (100.0%) | 0 (0.0%) |
| Retail Trade | 172 (45.5%) | 206 (54.5%) |
| Transportation & Warehousing | 26 (100.0%) | 0 (0.0%) |
| Utilities | 1 (14.3%) | 6 (85.7%) |
| Information | 0 (0.0%) | 0 (0.0%) |
| Finance & Insurance | 93 (78.1%) | 26 (21.8%) |
| Real Estate, Rental & Leasing | 0 (0.0%) | 0 (0.0%) |
| Professional & Scientific | 86 (97.7%) | 2 (2.3%) |
| Enterprise Management | 20 (100.0%) | 0 (0.0%) |
| Administrative & Support | 193 (88.1%) | 26 (11.9%) |
| Educational Services | 68 (11.8%) | 506 (88.1%) |
| Health Care & Social Assistance | 10 (4.4%) | 218 (95.6%) |
| Arts, Entertainment & Recreation | 62 (71.3%) | 25 (28.7%) |
| Accommodation & Food Services | 83 (36.6%) | 144 (63.4%) |
| Public Administration | 82 (39.1%) | 128 (61.0%) |
| Total | 2,634 (63.5%) | 1,514 (36.5%) |
Education in Greenlee County
School Enrollment in Greenlee County
The most common levels of schooling among the 2,294 students in Greenlee County are elementary school (658 | 28.7%), middle school (612 | 26.7%), and high school (547 | 23.8%).
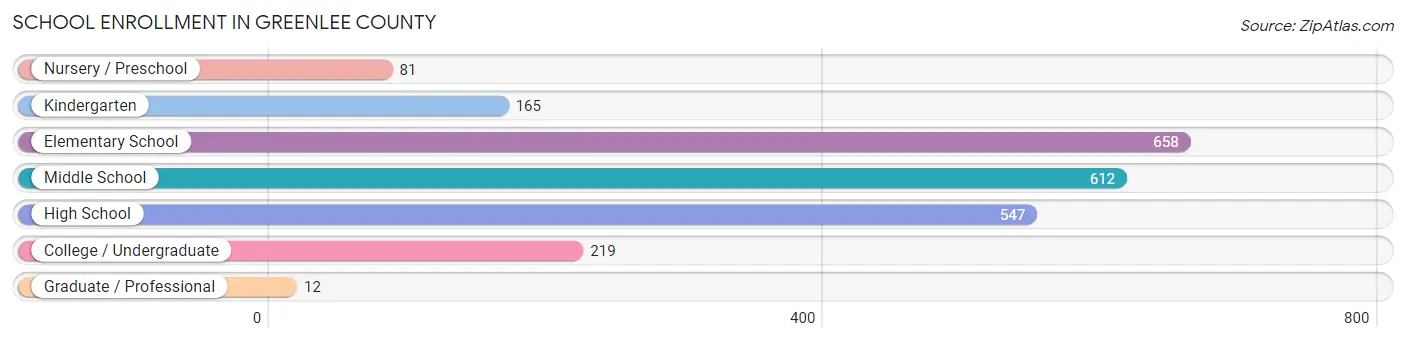
| School Level | # Students | % Students |
| Nursery / Preschool | 81 | 3.5% |
| Kindergarten | 165 | 7.2% |
| Elementary School | 658 | 28.7% |
| Middle School | 612 | 26.7% |
| High School | 547 | 23.8% |
| College / Undergraduate | 219 | 9.6% |
| Graduate / Professional | 12 | 0.5% |
| Total | 2,294 | 100.0% |
School Enrollment by Age by Funding Source in Greenlee County
Out of a total of 2,294 students who are enrolled in schools in Greenlee County, 243 (10.6%) attend a private institution, while the remaining 2,051 (89.4%) are enrolled in public schools. The age group of 3 to 4 year olds has the highest likelihood of being enrolled in private schools, with 38 (43.2% in the age bracket) enrolled. Conversely, the age group of 18 to 19 year olds has the lowest likelihood of being enrolled in a private school, with 145 (100.0% in the age bracket) attending a public institution.
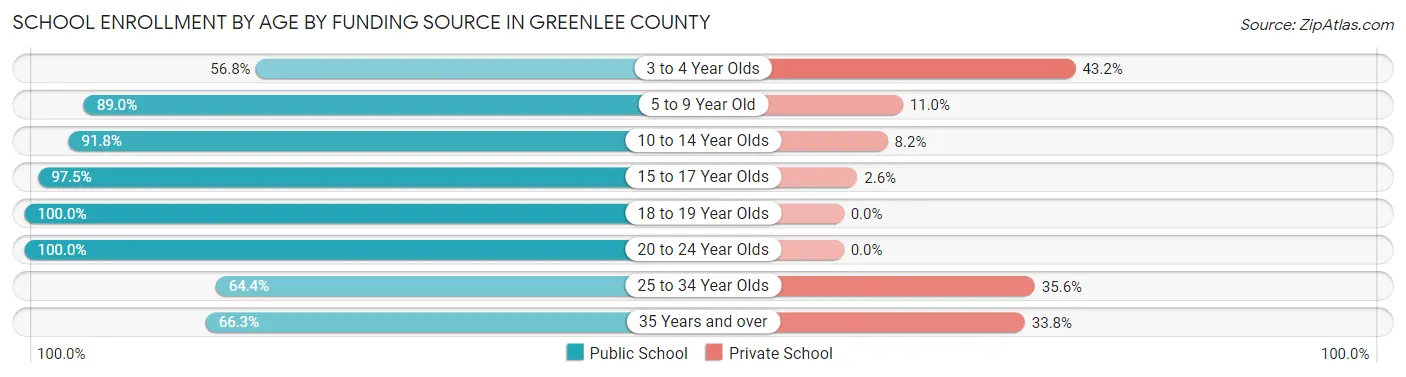
| Age Bracket | Public School | Private School |
| 3 to 4 Year Olds | 50 (56.8%) | 38 (43.2%) |
| 5 to 9 Year Old | 718 (89.0%) | 89 (11.0%) |
| 10 to 14 Year Olds | 605 (91.8%) | 54 (8.2%) |
| 15 to 17 Year Olds | 382 (97.5%) | 10 (2.5%) |
| 18 to 19 Year Olds | 145 (100.0%) | 0 (0.0%) |
| 20 to 24 Year Olds | 50 (100.0%) | 0 (0.0%) |
| 25 to 34 Year Olds | 47 (64.4%) | 26 (35.6%) |
| 35 Years and over | 53 (66.2%) | 27 (33.8%) |
| Total | 2,051 (89.4%) | 243 (10.6%) |
Educational Attainment by Field of Study in Greenlee County
Social sciences (200 | 19.9%), science & technology (149 | 14.8%), business (112 | 11.1%), education (112 | 11.1%), and engineering (106 | 10.5%) are the most common fields of study among 1,006 individuals in Greenlee County who have obtained a bachelor's degree or higher.
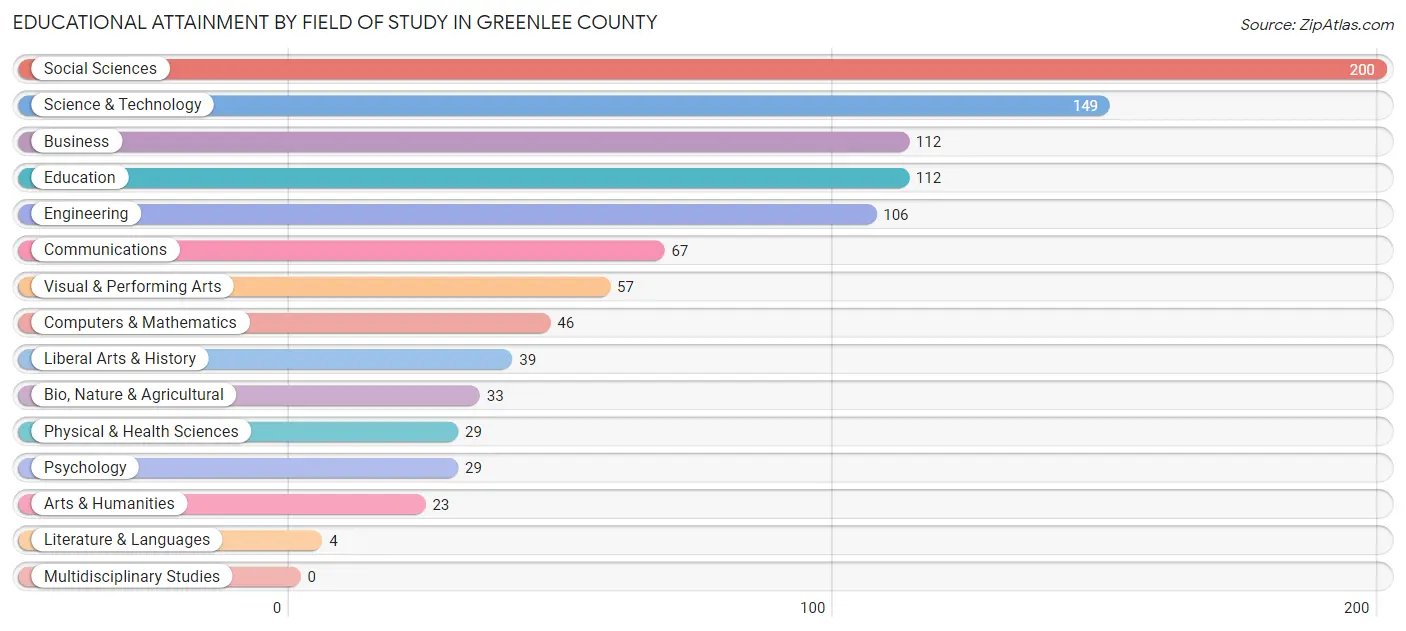
| Field of Study | # Graduates | % Graduates |
| Computers & Mathematics | 46 | 4.6% |
| Bio, Nature & Agricultural | 33 | 3.3% |
| Physical & Health Sciences | 29 | 2.9% |
| Psychology | 29 | 2.9% |
| Social Sciences | 200 | 19.9% |
| Engineering | 106 | 10.5% |
| Multidisciplinary Studies | 0 | 0.0% |
| Science & Technology | 149 | 14.8% |
| Business | 112 | 11.1% |
| Education | 112 | 11.1% |
| Literature & Languages | 4 | 0.4% |
| Liberal Arts & History | 39 | 3.9% |
| Visual & Performing Arts | 57 | 5.7% |
| Communications | 67 | 6.7% |
| Arts & Humanities | 23 | 2.3% |
| Total | 1,006 | 100.0% |
Transportation & Commute in Greenlee County
Vehicle Availability by Sex in Greenlee County
The most prevalent vehicle ownership categories in Greenlee County are males with 2 vehicles (894, accounting for 34.5%) and females with 2 vehicles (527, making up 59.8%).
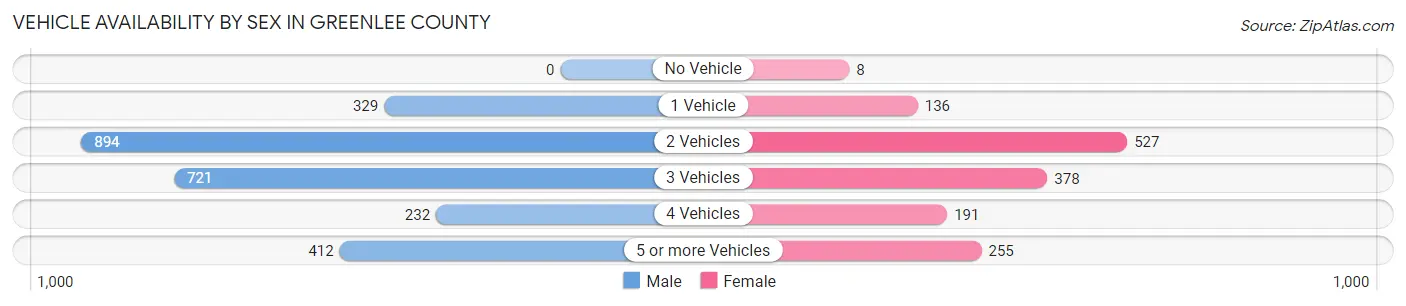
| Vehicles Available | Male | Female |
| No Vehicle | 0 (0.0%) | 8 (0.5%) |
| 1 Vehicle | 329 (12.7%) | 136 (9.1%) |
| 2 Vehicles | 894 (34.5%) | 527 (35.2%) |
| 3 Vehicles | 721 (27.9%) | 378 (25.3%) |
| 4 Vehicles | 232 (9.0%) | 191 (12.8%) |
| 5 or more Vehicles | 412 (15.9%) | 255 (17.1%) |
| Total | 2,588 (100.0%) | 1,495 (100.0%) |
Commute Time in Greenlee County
The most frequently occuring commute durations in Greenlee County are 5 to 9 minutes (1,071 commuters, 26.1%), 10 to 14 minutes (896 commuters, 21.9%), and 15 to 19 minutes (589 commuters, 14.4%).
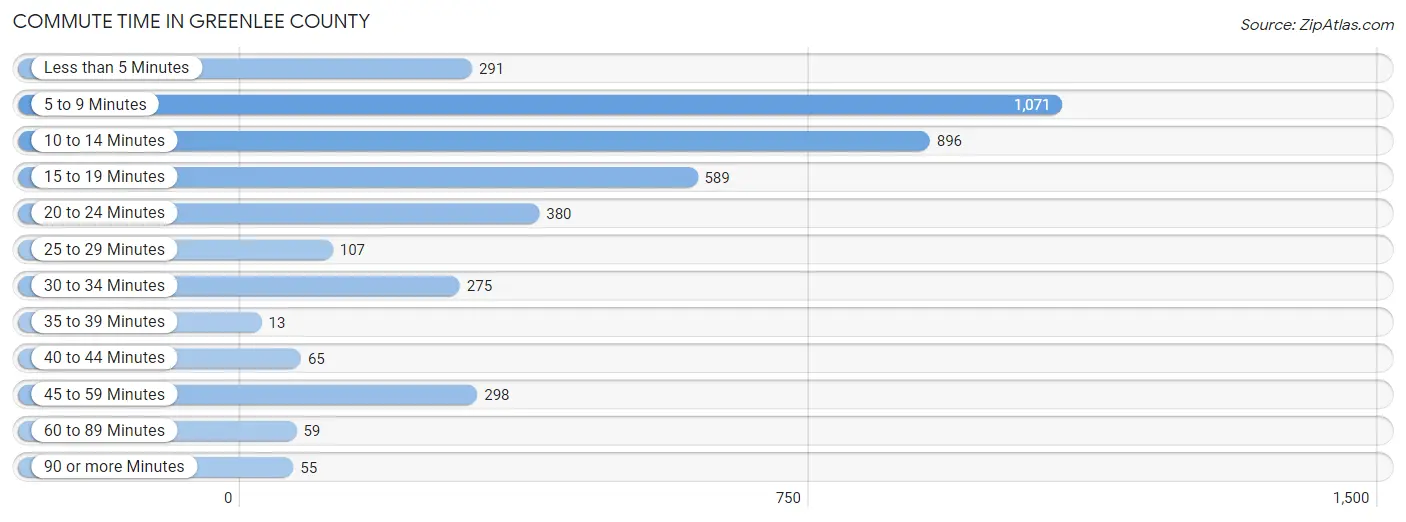
| Commute Time | # Commuters | % Commuters |
| Less than 5 Minutes | 291 | 7.1% |
| 5 to 9 Minutes | 1,071 | 26.1% |
| 10 to 14 Minutes | 896 | 21.9% |
| 15 to 19 Minutes | 589 | 14.4% |
| 20 to 24 Minutes | 380 | 9.3% |
| 25 to 29 Minutes | 107 | 2.6% |
| 30 to 34 Minutes | 275 | 6.7% |
| 35 to 39 Minutes | 13 | 0.3% |
| 40 to 44 Minutes | 65 | 1.6% |
| 45 to 59 Minutes | 298 | 7.3% |
| 60 to 89 Minutes | 59 | 1.4% |
| 90 or more Minutes | 55 | 1.3% |
Commute Time by Sex in Greenlee County
The most common commute times in Greenlee County are 5 to 9 minutes (781 commuters, 29.8%) for males and 15 to 19 minutes (392 commuters, 26.5%) for females.
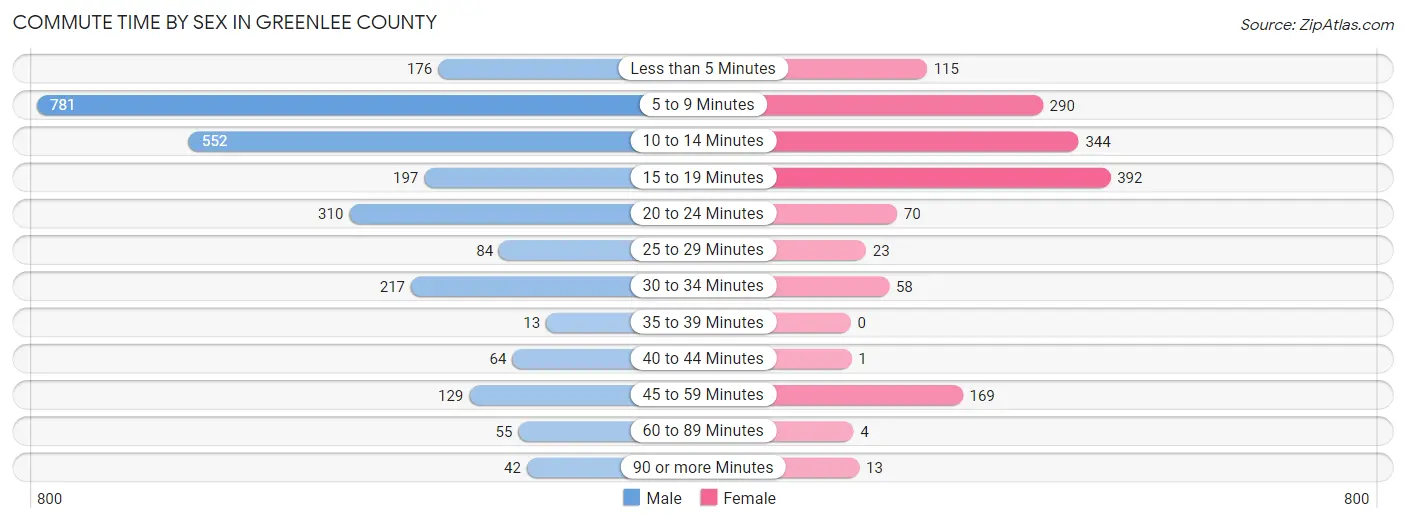
| Commute Time | Male | Female |
| Less than 5 Minutes | 176 (6.7%) | 115 (7.8%) |
| 5 to 9 Minutes | 781 (29.8%) | 290 (19.6%) |
| 10 to 14 Minutes | 552 (21.1%) | 344 (23.3%) |
| 15 to 19 Minutes | 197 (7.5%) | 392 (26.5%) |
| 20 to 24 Minutes | 310 (11.8%) | 70 (4.7%) |
| 25 to 29 Minutes | 84 (3.2%) | 23 (1.6%) |
| 30 to 34 Minutes | 217 (8.3%) | 58 (3.9%) |
| 35 to 39 Minutes | 13 (0.5%) | 0 (0.0%) |
| 40 to 44 Minutes | 64 (2.4%) | 1 (0.1%) |
| 45 to 59 Minutes | 129 (4.9%) | 169 (11.4%) |
| 60 to 89 Minutes | 55 (2.1%) | 4 (0.3%) |
| 90 or more Minutes | 42 (1.6%) | 13 (0.9%) |
Time of Departure to Work by Sex in Greenlee County
The most frequent times of departure to work in Greenlee County are 12:00 AM to 4:59 AM (653, 24.9%) for males and 7:30 AM to 7:59 AM (365, 24.7%) for females.
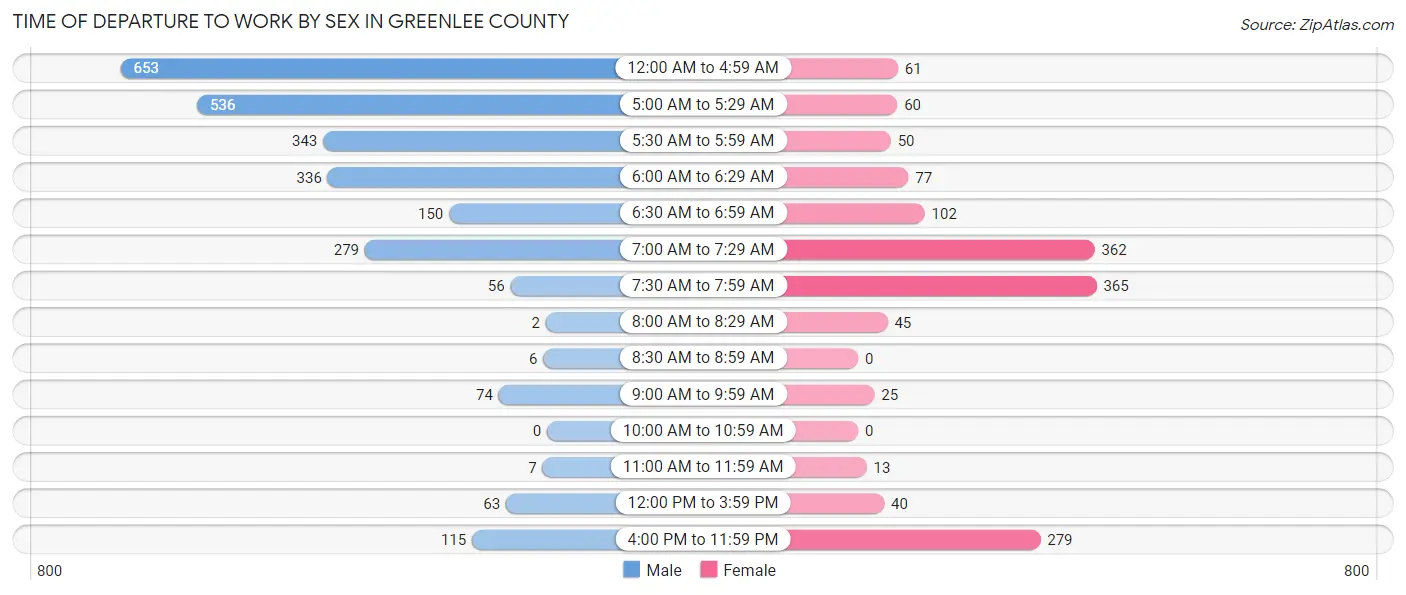
| Time of Departure | Male | Female |
| 12:00 AM to 4:59 AM | 653 (24.9%) | 61 (4.1%) |
| 5:00 AM to 5:29 AM | 536 (20.5%) | 60 (4.1%) |
| 5:30 AM to 5:59 AM | 343 (13.1%) | 50 (3.4%) |
| 6:00 AM to 6:29 AM | 336 (12.8%) | 77 (5.2%) |
| 6:30 AM to 6:59 AM | 150 (5.7%) | 102 (6.9%) |
| 7:00 AM to 7:29 AM | 279 (10.6%) | 362 (24.5%) |
| 7:30 AM to 7:59 AM | 56 (2.1%) | 365 (24.7%) |
| 8:00 AM to 8:29 AM | 2 (0.1%) | 45 (3.0%) |
| 8:30 AM to 8:59 AM | 6 (0.2%) | 0 (0.0%) |
| 9:00 AM to 9:59 AM | 74 (2.8%) | 25 (1.7%) |
| 10:00 AM to 10:59 AM | 0 (0.0%) | 0 (0.0%) |
| 11:00 AM to 11:59 AM | 7 (0.3%) | 13 (0.9%) |
| 12:00 PM to 3:59 PM | 63 (2.4%) | 40 (2.7%) |
| 4:00 PM to 11:59 PM | 115 (4.4%) | 279 (18.9%) |
| Total | 2,620 (100.0%) | 1,479 (100.0%) |
Housing Occupancy in Greenlee County
Occupancy by Ownership in Greenlee County
Of the total 3,304 dwellings in Greenlee County, owner-occupied units account for 1,857 (56.2%), while renter-occupied units make up 1,447 (43.8%).
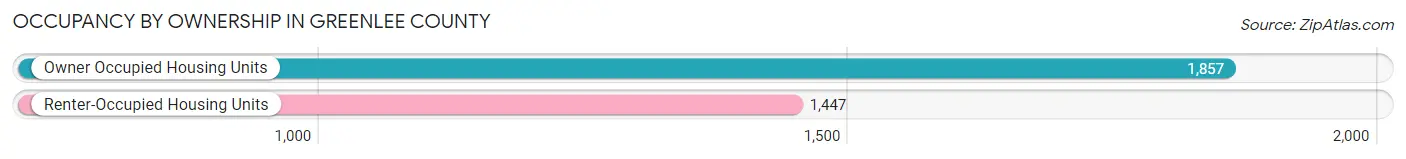
| Occupancy | # Housing Units | % Housing Units |
| Owner Occupied Housing Units | 1,857 | 56.2% |
| Renter-Occupied Housing Units | 1,447 | 43.8% |
| Total Occupied Housing Units | 3,304 | 100.0% |
Occupancy by Household Size in Greenlee County
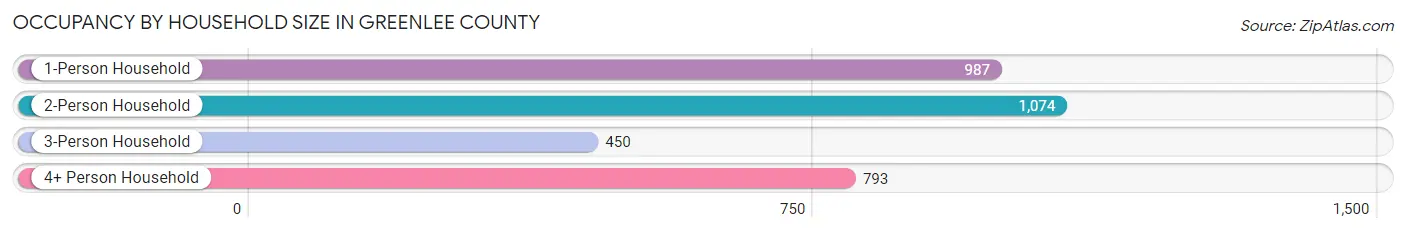
| Household Size | # Housing Units | % Housing Units |
| 1-Person Household | 987 | 29.9% |
| 2-Person Household | 1,074 | 32.5% |
| 3-Person Household | 450 | 13.6% |
| 4+ Person Household | 793 | 24.0% |
| Total Housing Units | 3,304 | 100.0% |
Occupancy by Ownership by Household Size in Greenlee County
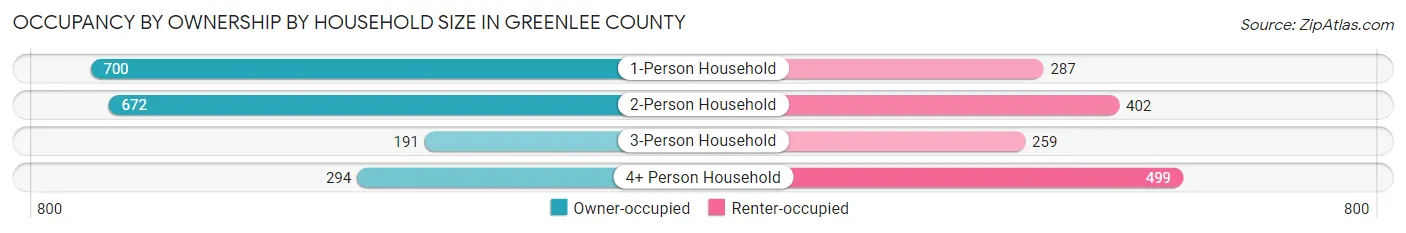
| Household Size | Owner-occupied | Renter-occupied |
| 1-Person Household | 700 (70.9%) | 287 (29.1%) |
| 2-Person Household | 672 (62.6%) | 402 (37.4%) |
| 3-Person Household | 191 (42.4%) | 259 (57.6%) |
| 4+ Person Household | 294 (37.1%) | 499 (62.9%) |
| Total Housing Units | 1,857 (56.2%) | 1,447 (43.8%) |
Occupancy by Educational Attainment in Greenlee County
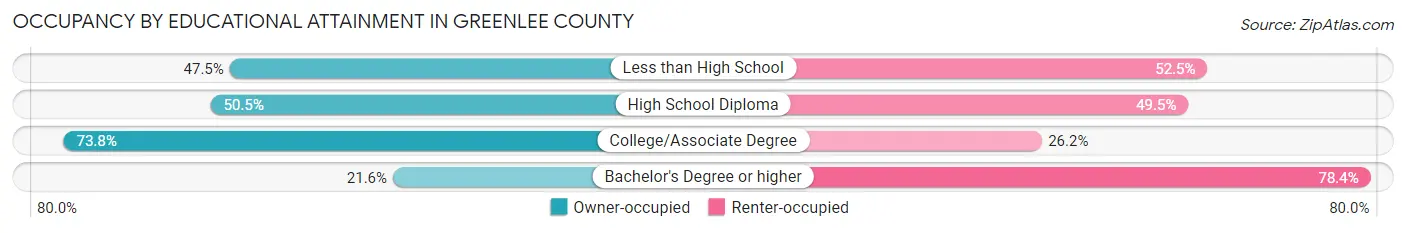
| Household Size | Owner-occupied | Renter-occupied |
| Less than High School | 179 (47.5%) | 198 (52.5%) |
| High School Diploma | 590 (50.5%) | 578 (49.5%) |
| College/Associate Degree | 1,001 (73.8%) | 355 (26.2%) |
| Bachelor's Degree or higher | 87 (21.6%) | 316 (78.4%) |
Occupancy by Age of Householder in Greenlee County
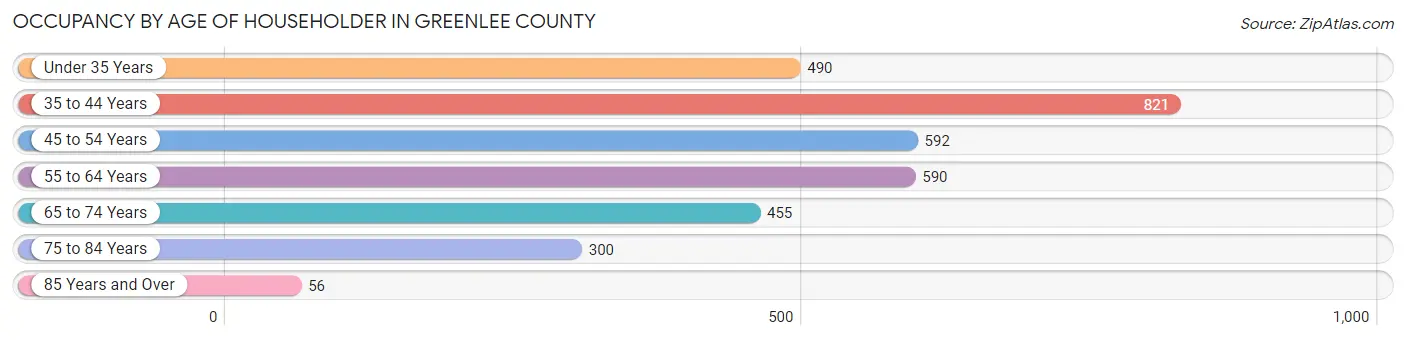
| Age Bracket | # Households | % Households |
| Under 35 Years | 490 | 14.8% |
| 35 to 44 Years | 821 | 24.8% |
| 45 to 54 Years | 592 | 17.9% |
| 55 to 64 Years | 590 | 17.9% |
| 65 to 74 Years | 455 | 13.8% |
| 75 to 84 Years | 300 | 9.1% |
| 85 Years and Over | 56 | 1.7% |
| Total | 3,304 | 100.0% |
Housing Finances in Greenlee County
Median Income by Occupancy in Greenlee County
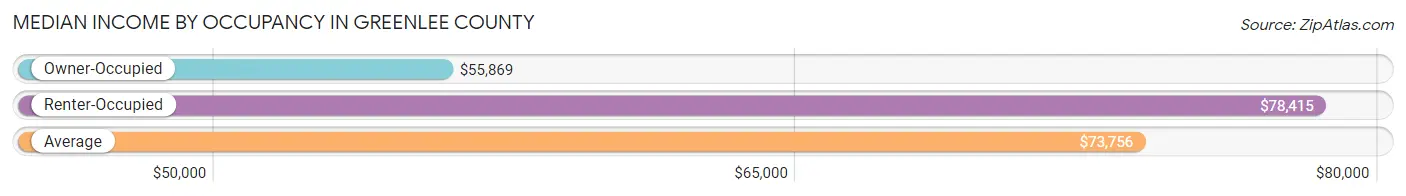
| Occupancy Type | # Households | Median Income |
| Owner-Occupied | 1,857 (56.2%) | $55,869 |
| Renter-Occupied | 1,447 (43.8%) | $78,415 |
| Average | 3,304 (100.0%) | $73,756 |
Occupancy by Householder Income Bracket in Greenlee County
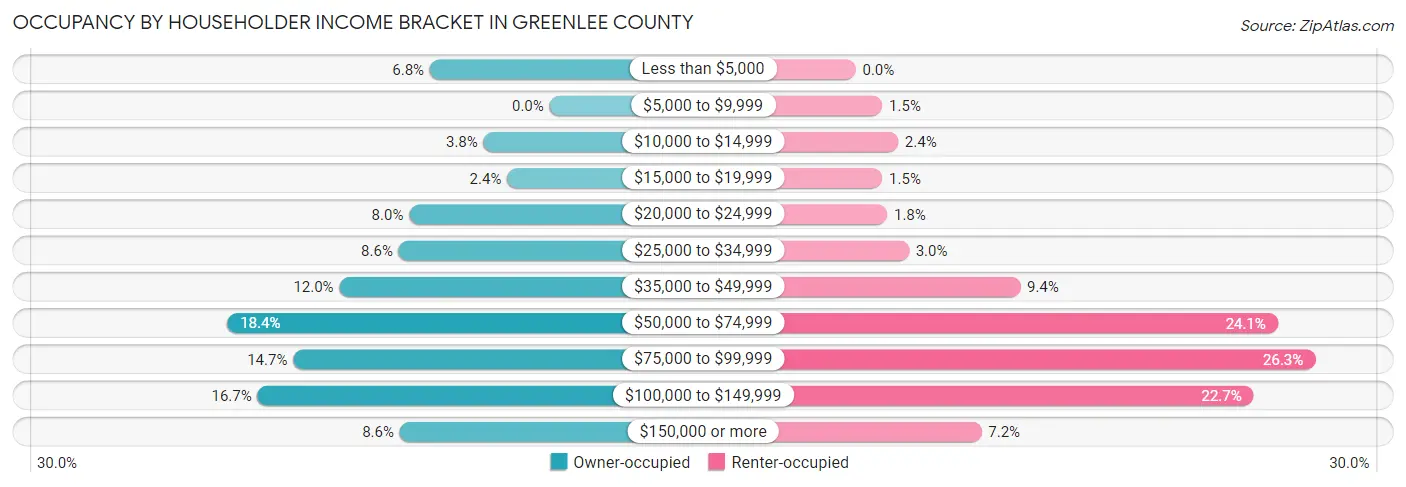
| Income Bracket | Owner-occupied | Renter-occupied |
| Less than $5,000 | 127 (6.8%) | 0 (0.0%) |
| $5,000 to $9,999 | 0 (0.0%) | 22 (1.5%) |
| $10,000 to $14,999 | 70 (3.8%) | 35 (2.4%) |
| $15,000 to $19,999 | 45 (2.4%) | 22 (1.5%) |
| $20,000 to $24,999 | 149 (8.0%) | 26 (1.8%) |
| $25,000 to $34,999 | 160 (8.6%) | 44 (3.0%) |
| $35,000 to $49,999 | 223 (12.0%) | 136 (9.4%) |
| $50,000 to $74,999 | 342 (18.4%) | 349 (24.1%) |
| $75,000 to $99,999 | 272 (14.6%) | 380 (26.3%) |
| $100,000 to $149,999 | 310 (16.7%) | 329 (22.7%) |
| $150,000 or more | 159 (8.6%) | 104 (7.2%) |
| Total | 1,857 (100.0%) | 1,447 (100.0%) |
Monthly Housing Cost Tiers in Greenlee County
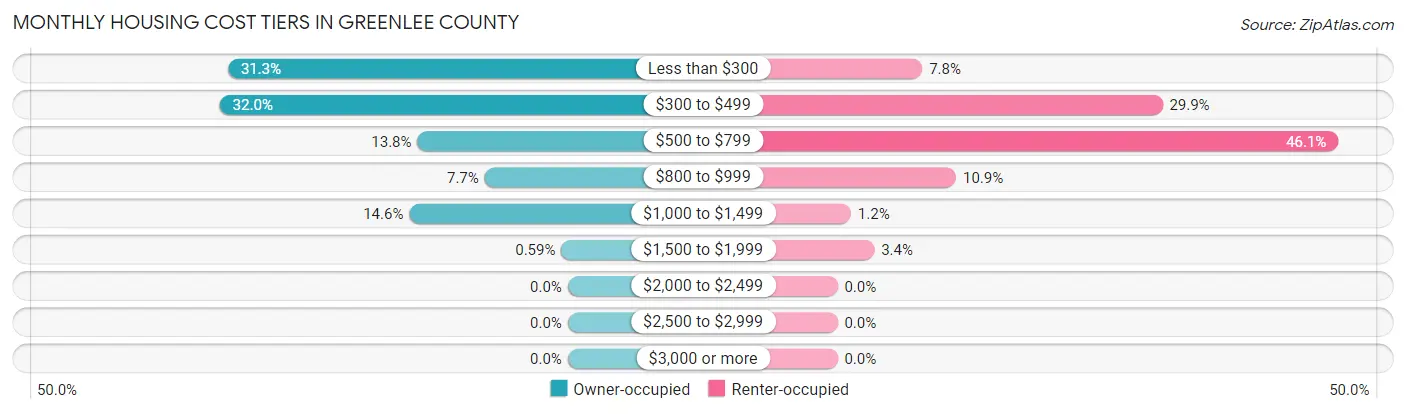
| Monthly Cost | Owner-occupied | Renter-occupied |
| Less than $300 | 581 (31.3%) | 113 (7.8%) |
| $300 to $499 | 595 (32.0%) | 433 (29.9%) |
| $500 to $799 | 257 (13.8%) | 667 (46.1%) |
| $800 to $999 | 142 (7.6%) | 158 (10.9%) |
| $1,000 to $1,499 | 271 (14.6%) | 18 (1.2%) |
| $1,500 to $1,999 | 11 (0.6%) | 49 (3.4%) |
| $2,000 to $2,499 | 0 (0.0%) | 0 (0.0%) |
| $2,500 to $2,999 | 0 (0.0%) | 0 (0.0%) |
| $3,000 or more | 0 (0.0%) | 0 (0.0%) |
| Total | 1,857 (100.0%) | 1,447 (100.0%) |
Physical Housing Characteristics in Greenlee County
Housing Structures in Greenlee County
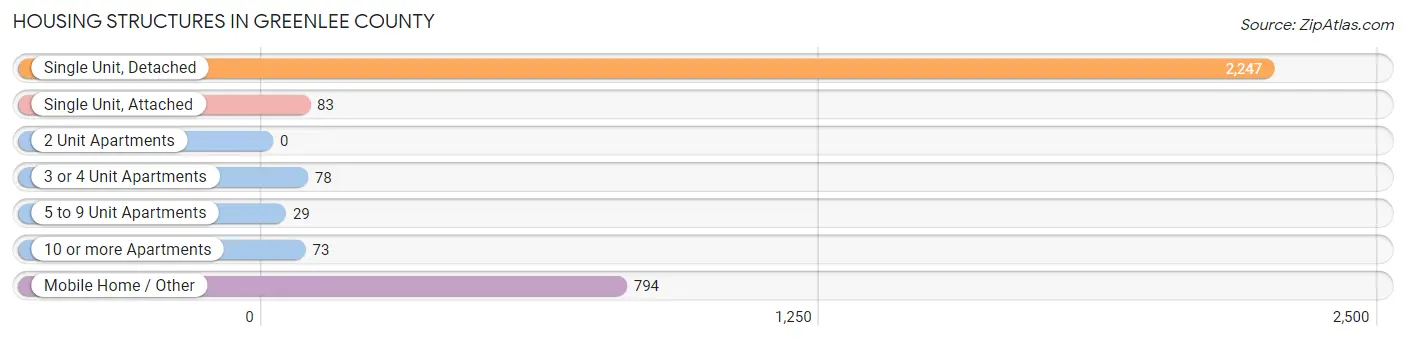
| Structure Type | # Housing Units | % Housing Units |
| Single Unit, Detached | 2,247 | 68.0% |
| Single Unit, Attached | 83 | 2.5% |
| 2 Unit Apartments | 0 | 0.0% |
| 3 or 4 Unit Apartments | 78 | 2.4% |
| 5 to 9 Unit Apartments | 29 | 0.9% |
| 10 or more Apartments | 73 | 2.2% |
| Mobile Home / Other | 794 | 24.0% |
| Total | 3,304 | 100.0% |
Housing Structures by Occupancy in Greenlee County
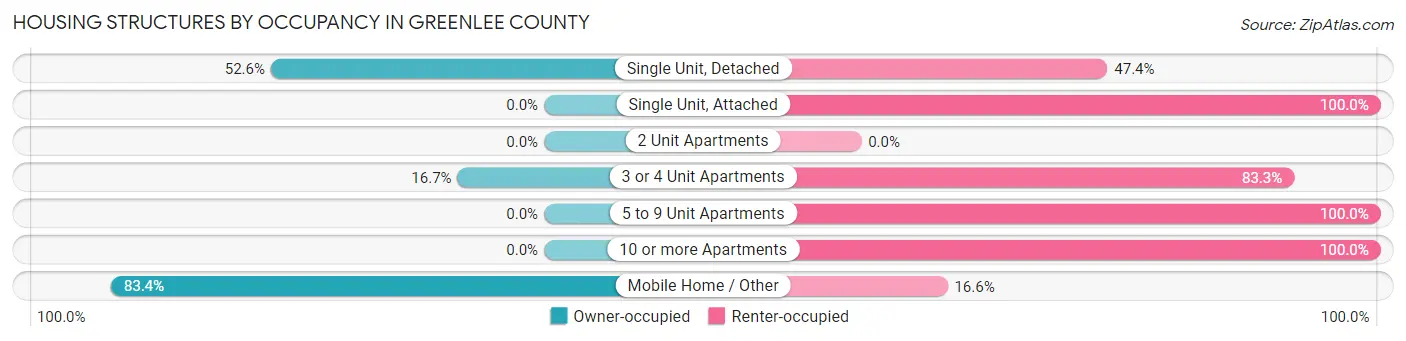
| Structure Type | Owner-occupied | Renter-occupied |
| Single Unit, Detached | 1,182 (52.6%) | 1,065 (47.4%) |
| Single Unit, Attached | 0 (0.0%) | 83 (100.0%) |
| 2 Unit Apartments | 0 (0.0%) | 0 (0.0%) |
| 3 or 4 Unit Apartments | 13 (16.7%) | 65 (83.3%) |
| 5 to 9 Unit Apartments | 0 (0.0%) | 29 (100.0%) |
| 10 or more Apartments | 0 (0.0%) | 73 (100.0%) |
| Mobile Home / Other | 662 (83.4%) | 132 (16.6%) |
| Total | 1,857 (56.2%) | 1,447 (43.8%) |
Housing Structures by Number of Rooms in Greenlee County
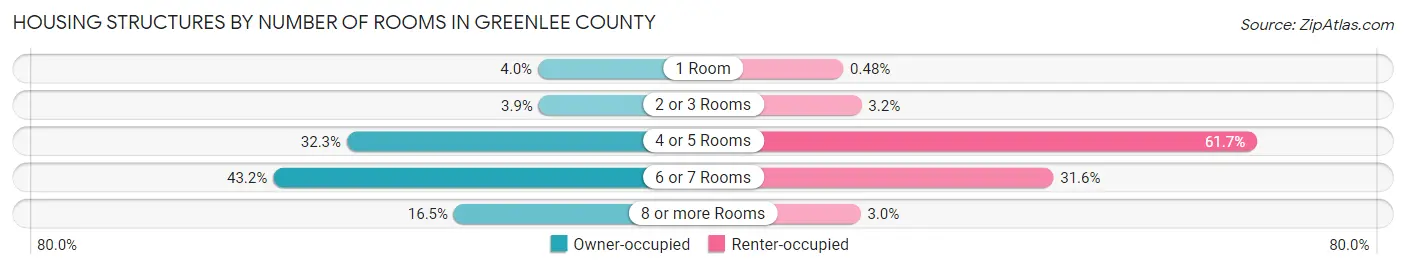
| Number of Rooms | Owner-occupied | Renter-occupied |
| 1 Room | 75 (4.0%) | 7 (0.5%) |
| 2 or 3 Rooms | 73 (3.9%) | 46 (3.2%) |
| 4 or 5 Rooms | 600 (32.3%) | 893 (61.7%) |
| 6 or 7 Rooms | 803 (43.2%) | 457 (31.6%) |
| 8 or more Rooms | 306 (16.5%) | 44 (3.0%) |
| Total | 1,857 (100.0%) | 1,447 (100.0%) |
Housing Structure by Heating Type in Greenlee County
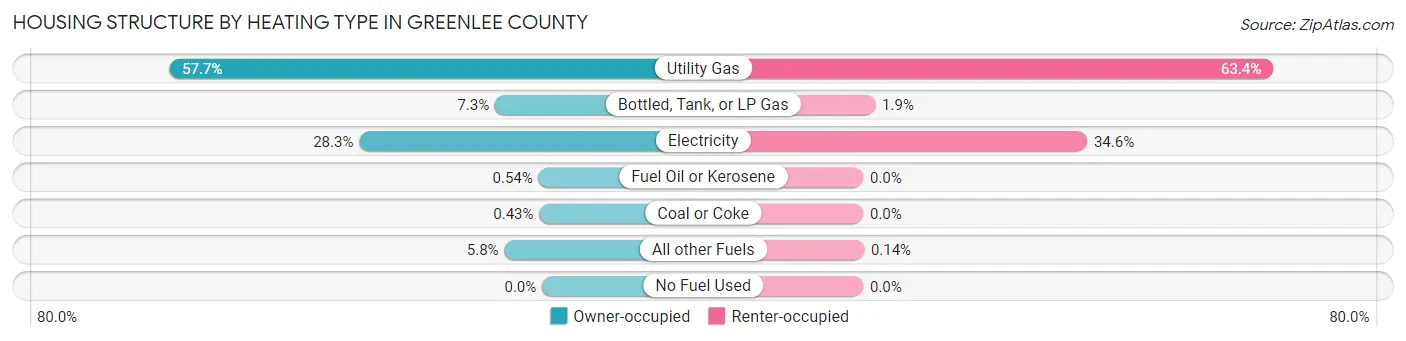
| Heating Type | Owner-occupied | Renter-occupied |
| Utility Gas | 1,071 (57.7%) | 917 (63.4%) |
| Bottled, Tank, or LP Gas | 135 (7.3%) | 27 (1.9%) |
| Electricity | 525 (28.3%) | 501 (34.6%) |
| Fuel Oil or Kerosene | 10 (0.5%) | 0 (0.0%) |
| Coal or Coke | 8 (0.4%) | 0 (0.0%) |
| All other Fuels | 108 (5.8%) | 2 (0.1%) |
| No Fuel Used | 0 (0.0%) | 0 (0.0%) |
| Total | 1,857 (100.0%) | 1,447 (100.0%) |
Household Vehicle Usage in Greenlee County
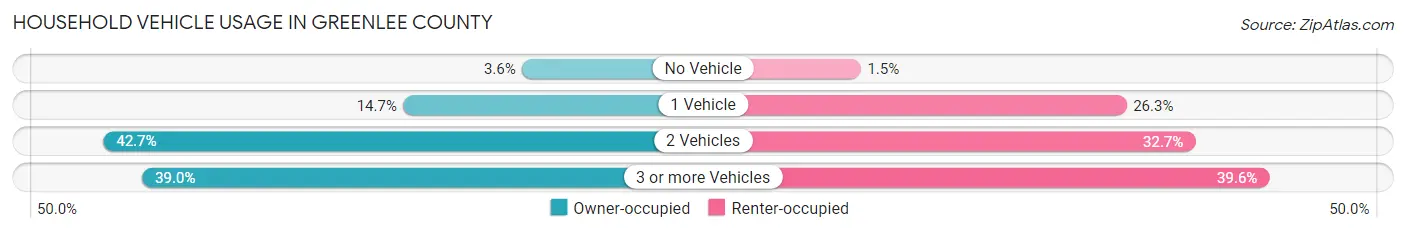
| Vehicles per Household | Owner-occupied | Renter-occupied |
| No Vehicle | 67 (3.6%) | 21 (1.5%) |
| 1 Vehicle | 273 (14.7%) | 380 (26.3%) |
| 2 Vehicles | 792 (42.6%) | 473 (32.7%) |
| 3 or more Vehicles | 725 (39.0%) | 573 (39.6%) |
| Total | 1,857 (100.0%) | 1,447 (100.0%) |
Real Estate & Mortgages in Greenlee County
Real Estate and Mortgage Overview in Greenlee County
| Characteristic | Without Mortgage | With Mortgage |
| Housing Units | 1,207 | 650 |
| Median Property Value | $75,300 | $157,500 |
| Median Household Income | $48,359 | $118 |
| Monthly Housing Costs | $304 | $0 |
| Real Estate Taxes | $291 | $19 |
Property Value by Mortgage Status in Greenlee County
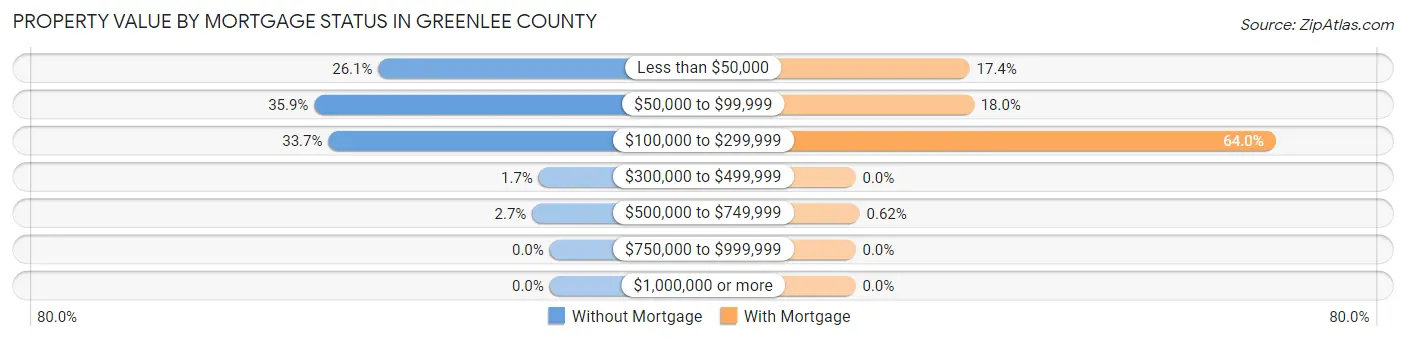
| Property Value | Without Mortgage | With Mortgage |
| Less than $50,000 | 315 (26.1%) | 113 (17.4%) |
| $50,000 to $99,999 | 433 (35.9%) | 117 (18.0%) |
| $100,000 to $299,999 | 407 (33.7%) | 416 (64.0%) |
| $300,000 to $499,999 | 20 (1.7%) | 0 (0.0%) |
| $500,000 to $749,999 | 32 (2.6%) | 4 (0.6%) |
| $750,000 to $999,999 | 0 (0.0%) | 0 (0.0%) |
| $1,000,000 or more | 0 (0.0%) | 0 (0.0%) |
| Total | 1,207 (100.0%) | 650 (100.0%) |
Household Income by Mortgage Status in Greenlee County
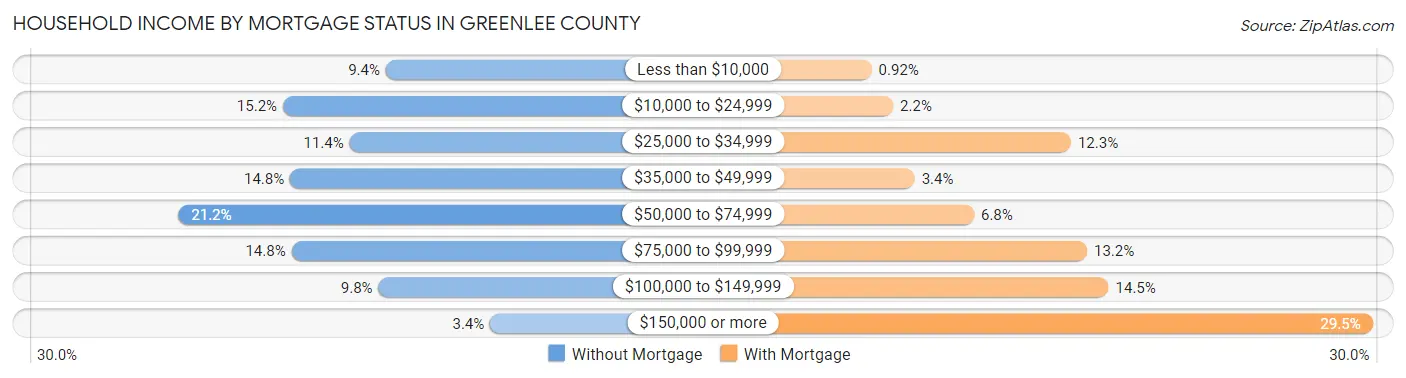
| Household Income | Without Mortgage | With Mortgage |
| Less than $10,000 | 113 (9.4%) | 6 (0.9%) |
| $10,000 to $24,999 | 184 (15.2%) | 14 (2.1%) |
| $25,000 to $34,999 | 138 (11.4%) | 80 (12.3%) |
| $35,000 to $49,999 | 179 (14.8%) | 22 (3.4%) |
| $50,000 to $74,999 | 256 (21.2%) | 44 (6.8%) |
| $75,000 to $99,999 | 178 (14.7%) | 86 (13.2%) |
| $100,000 to $149,999 | 118 (9.8%) | 94 (14.5%) |
| $150,000 or more | 41 (3.4%) | 192 (29.5%) |
| Total | 1,207 (100.0%) | 650 (100.0%) |
Property Value to Household Income Ratio in Greenlee County
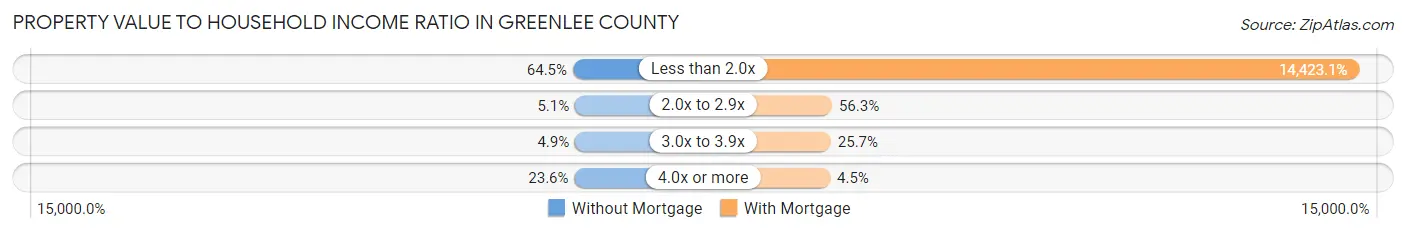
| Value-to-Income Ratio | Without Mortgage | With Mortgage |
| Less than 2.0x | 778 (64.5%) | 93,750 (14,423.1%) |
| 2.0x to 2.9x | 61 (5.1%) | 366 (56.3%) |
| 3.0x to 3.9x | 59 (4.9%) | 167 (25.7%) |
| 4.0x or more | 285 (23.6%) | 29 (4.5%) |
| Total | 1,207 (100.0%) | 650 (100.0%) |
Real Estate Taxes by Mortgage Status in Greenlee County
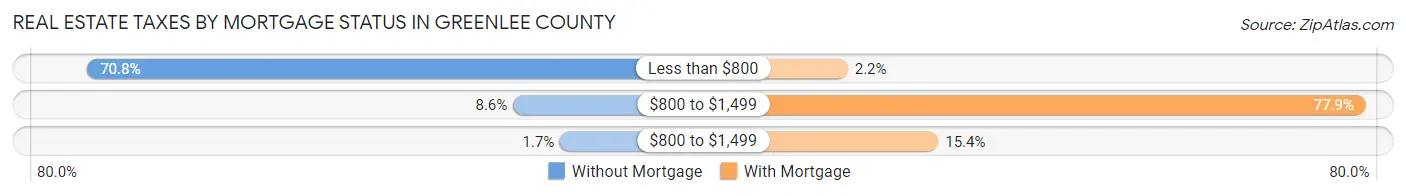
| Property Taxes | Without Mortgage | With Mortgage |
| Less than $800 | 855 (70.8%) | 14 (2.1%) |
| $800 to $1,499 | 104 (8.6%) | 506 (77.8%) |
| $800 to $1,499 | 21 (1.7%) | 100 (15.4%) |
| Total | 1,207 (100.0%) | 650 (100.0%) |
Health & Disability in Greenlee County
Health Insurance Coverage by Age in Greenlee County
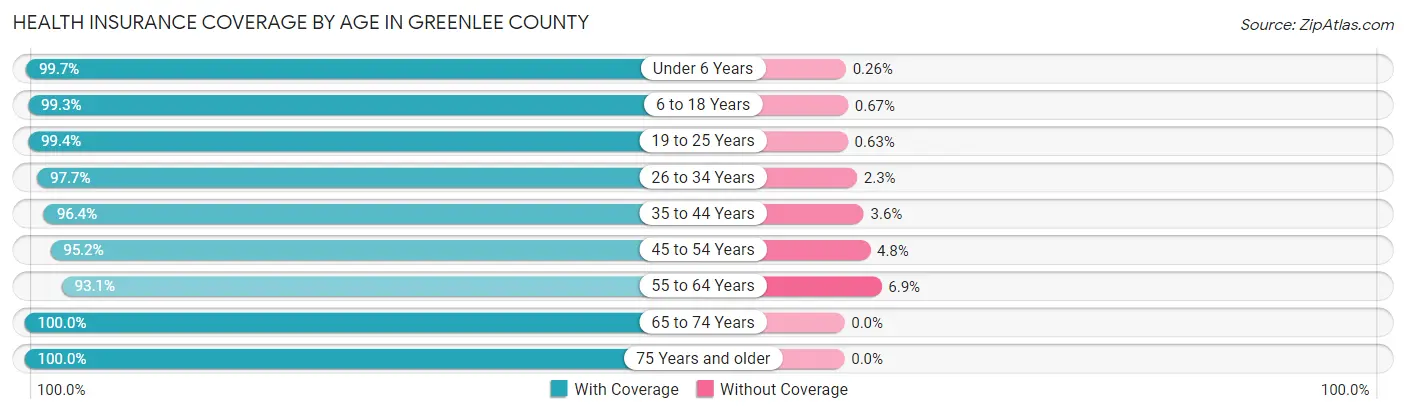
| Age Bracket | With Coverage | Without Coverage |
| Under 6 Years | 760 (99.7%) | 2 (0.3%) |
| 6 to 18 Years | 1,926 (99.3%) | 13 (0.7%) |
| 19 to 25 Years | 1,098 (99.4%) | 7 (0.6%) |
| 26 to 34 Years | 794 (97.7%) | 19 (2.3%) |
| 35 to 44 Years | 1,526 (96.4%) | 57 (3.6%) |
| 45 to 54 Years | 873 (95.2%) | 44 (4.8%) |
| 55 to 64 Years | 957 (93.1%) | 71 (6.9%) |
| 65 to 74 Years | 834 (100.0%) | 0 (0.0%) |
| 75 Years and older | 465 (100.0%) | 0 (0.0%) |
| Total | 9,233 (97.8%) | 213 (2.2%) |
Health Insurance Coverage by Citizenship Status in Greenlee County
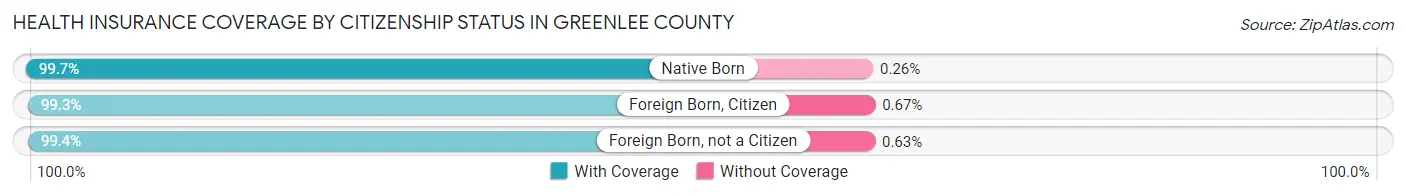
| Citizenship Status | With Coverage | Without Coverage |
| Native Born | 760 (99.7%) | 2 (0.3%) |
| Foreign Born, Citizen | 1,926 (99.3%) | 13 (0.7%) |
| Foreign Born, not a Citizen | 1,098 (99.4%) | 7 (0.6%) |
Health Insurance Coverage by Household Income in Greenlee County
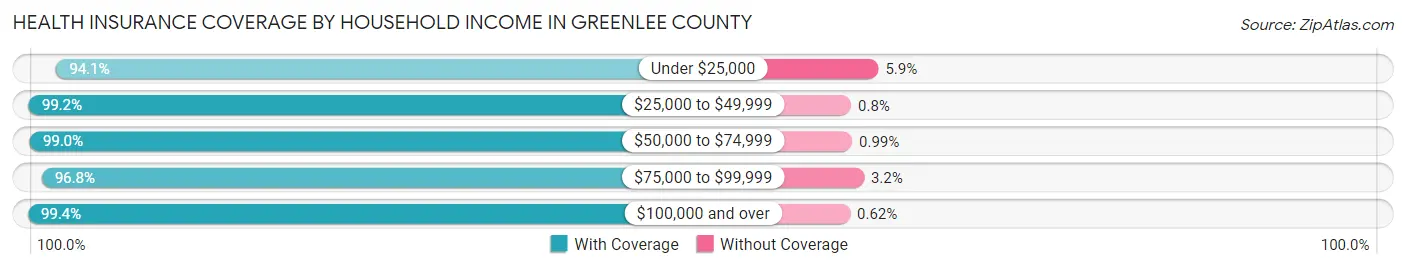
| Household Income | With Coverage | Without Coverage |
| Under $25,000 | 934 (94.1%) | 59 (5.9%) |
| $25,000 to $49,999 | 1,233 (99.2%) | 10 (0.8%) |
| $50,000 to $74,999 | 1,902 (99.0%) | 19 (1.0%) |
| $75,000 to $99,999 | 1,931 (96.8%) | 64 (3.2%) |
| $100,000 and over | 3,224 (99.4%) | 20 (0.6%) |
Public vs Private Health Insurance Coverage by Age in Greenlee County
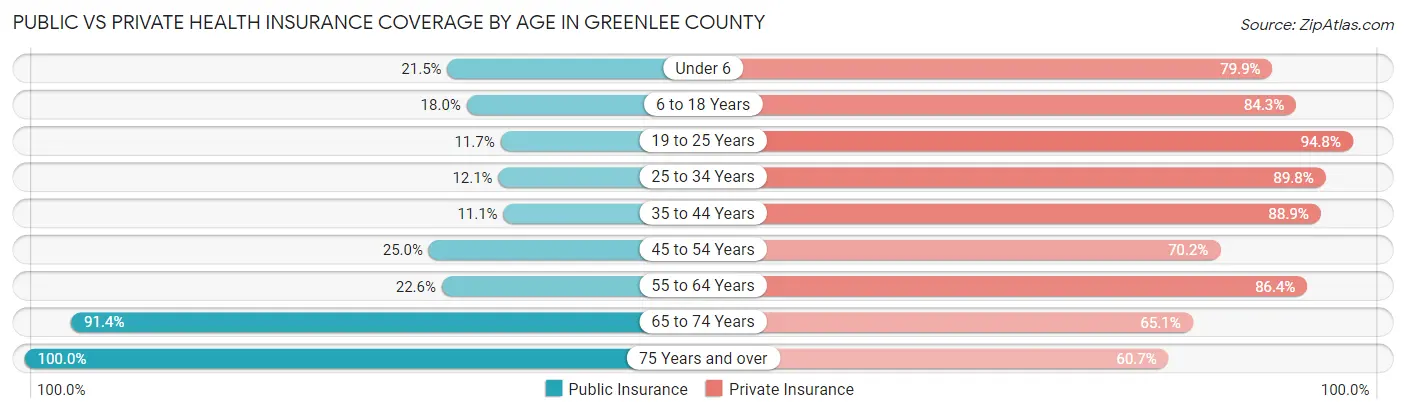
| Age Bracket | Public Insurance | Private Insurance |
| Under 6 | 164 (21.5%) | 609 (79.9%) |
| 6 to 18 Years | 348 (17.9%) | 1,635 (84.3%) |
| 19 to 25 Years | 129 (11.7%) | 1,048 (94.8%) |
| 25 to 34 Years | 98 (12.0%) | 730 (89.8%) |
| 35 to 44 Years | 176 (11.1%) | 1,407 (88.9%) |
| 45 to 54 Years | 229 (25.0%) | 644 (70.2%) |
| 55 to 64 Years | 232 (22.6%) | 888 (86.4%) |
| 65 to 74 Years | 762 (91.4%) | 543 (65.1%) |
| 75 Years and over | 465 (100.0%) | 282 (60.7%) |
| Total | 2,603 (27.6%) | 7,786 (82.4%) |
Disability Status by Sex by Age in Greenlee County
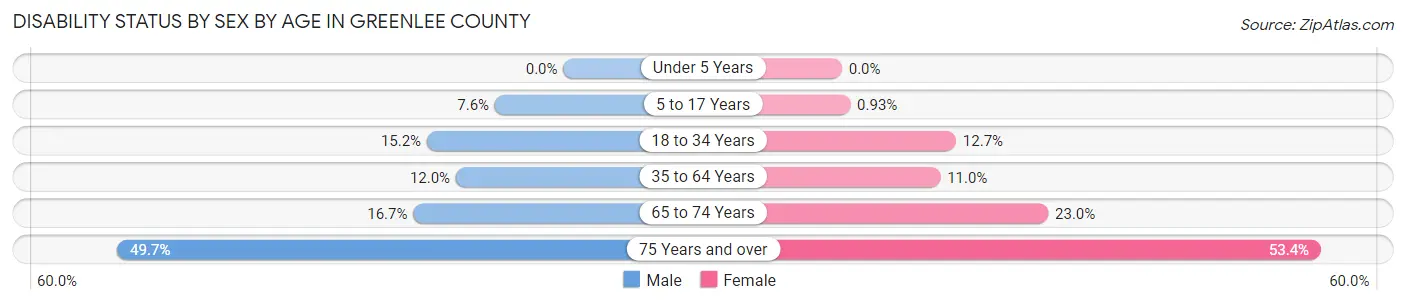
| Age Bracket | Male | Female |
| Under 5 Years | 0 (0.0%) | 0 (0.0%) |
| 5 to 17 Years | 79 (7.6%) | 8 (0.9%) |
| 18 to 34 Years | 153 (15.2%) | 130 (12.7%) |
| 35 to 64 Years | 243 (12.0%) | 164 (11.0%) |
| 65 to 74 Years | 71 (16.7%) | 94 (23.0%) |
| 75 Years and over | 83 (49.7%) | 159 (53.4%) |
Disability Class by Sex by Age in Greenlee County
Disability Class: Hearing Difficulty
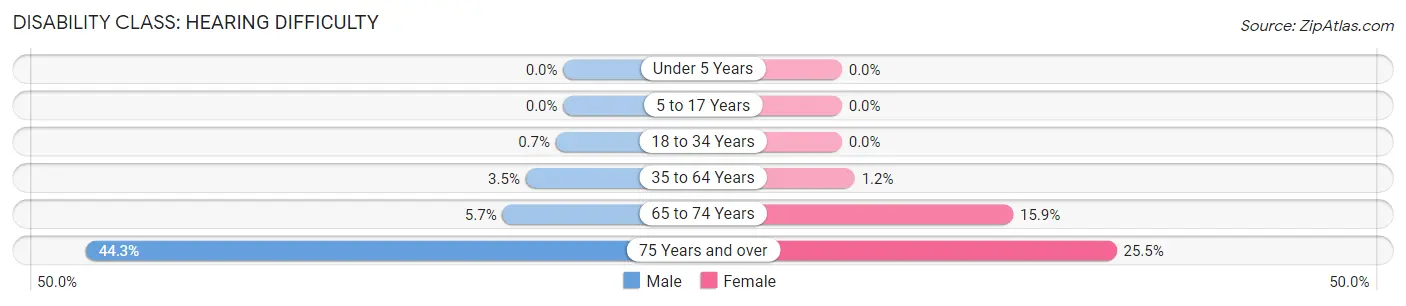
| Age Bracket | Male | Female |
| Under 5 Years | 0 (0.0%) | 0 (0.0%) |
| 5 to 17 Years | 0 (0.0%) | 0 (0.0%) |
| 18 to 34 Years | 7 (0.7%) | 0 (0.0%) |
| 35 to 64 Years | 71 (3.5%) | 18 (1.2%) |
| 65 to 74 Years | 24 (5.7%) | 65 (15.9%) |
| 75 Years and over | 74 (44.3%) | 76 (25.5%) |
Disability Class: Vision Difficulty
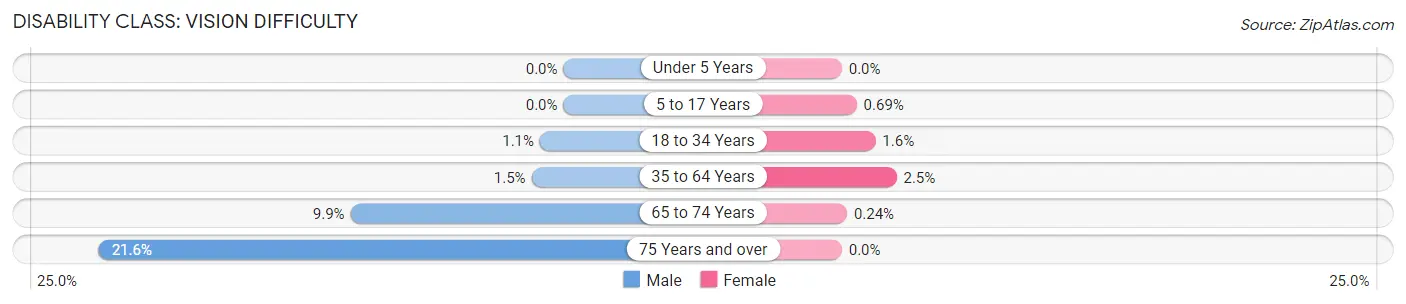
| Age Bracket | Male | Female |
| Under 5 Years | 0 (0.0%) | 0 (0.0%) |
| 5 to 17 Years | 0 (0.0%) | 6 (0.7%) |
| 18 to 34 Years | 11 (1.1%) | 16 (1.6%) |
| 35 to 64 Years | 30 (1.5%) | 38 (2.5%) |
| 65 to 74 Years | 42 (9.9%) | 1 (0.2%) |
| 75 Years and over | 36 (21.6%) | 0 (0.0%) |
Disability Class: Cognitive Difficulty
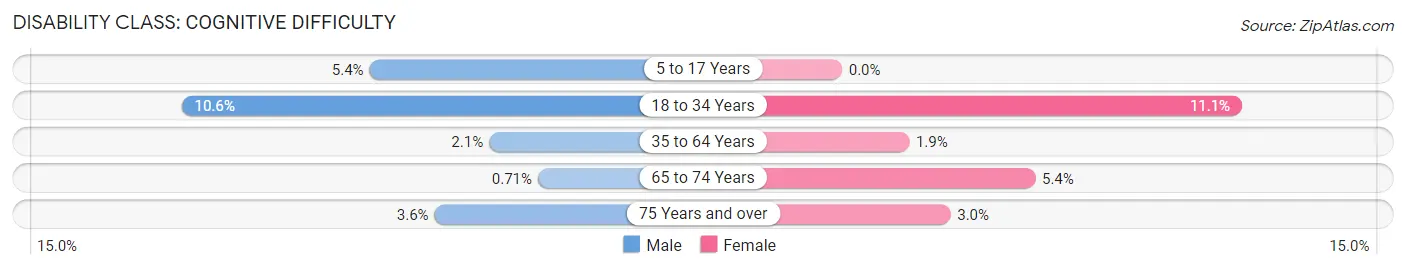
| Age Bracket | Male | Female |
| 5 to 17 Years | 56 (5.4%) | 0 (0.0%) |
| 18 to 34 Years | 107 (10.6%) | 114 (11.1%) |
| 35 to 64 Years | 42 (2.1%) | 28 (1.9%) |
| 65 to 74 Years | 3 (0.7%) | 22 (5.4%) |
| 75 Years and over | 6 (3.6%) | 9 (3.0%) |
Disability Class: Ambulatory Difficulty
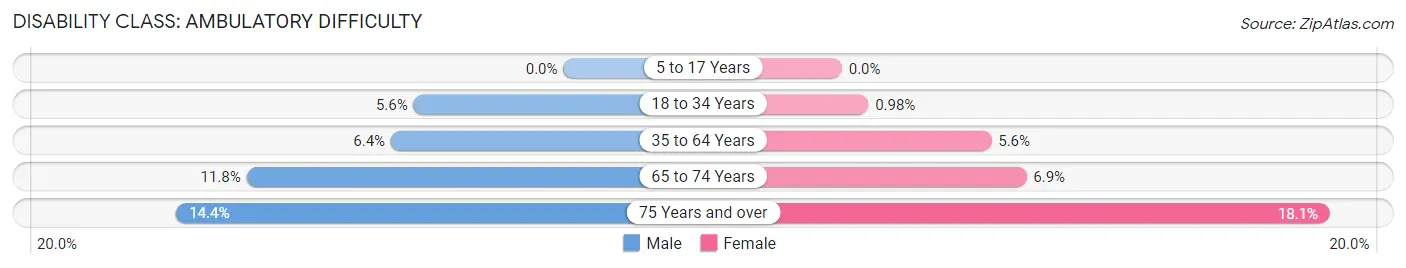
| Age Bracket | Male | Female |
| 5 to 17 Years | 0 (0.0%) | 0 (0.0%) |
| 18 to 34 Years | 56 (5.6%) | 10 (1.0%) |
| 35 to 64 Years | 130 (6.4%) | 83 (5.6%) |
| 65 to 74 Years | 50 (11.8%) | 28 (6.9%) |
| 75 Years and over | 24 (14.4%) | 54 (18.1%) |
Disability Class: Self-Care Difficulty
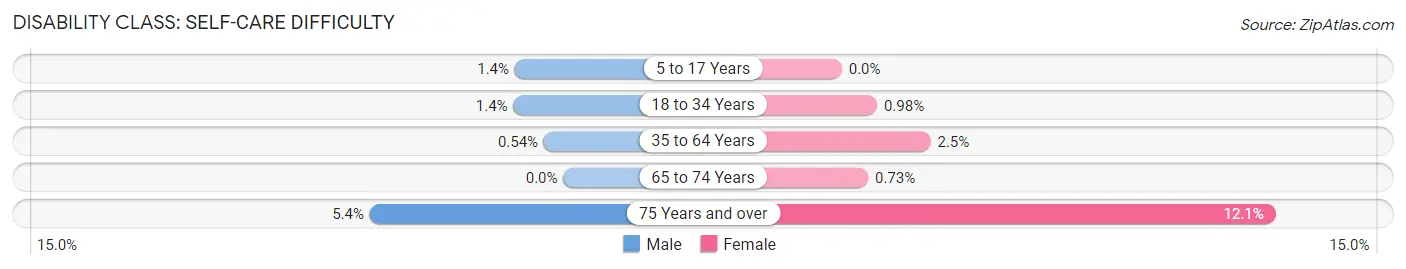
| Age Bracket | Male | Female |
| 5 to 17 Years | 14 (1.3%) | 0 (0.0%) |
| 18 to 34 Years | 14 (1.4%) | 10 (1.0%) |
| 35 to 64 Years | 11 (0.5%) | 37 (2.5%) |
| 65 to 74 Years | 0 (0.0%) | 3 (0.7%) |
| 75 Years and over | 9 (5.4%) | 36 (12.1%) |
Technology Access in Greenlee County
Computing Device Access in Greenlee County
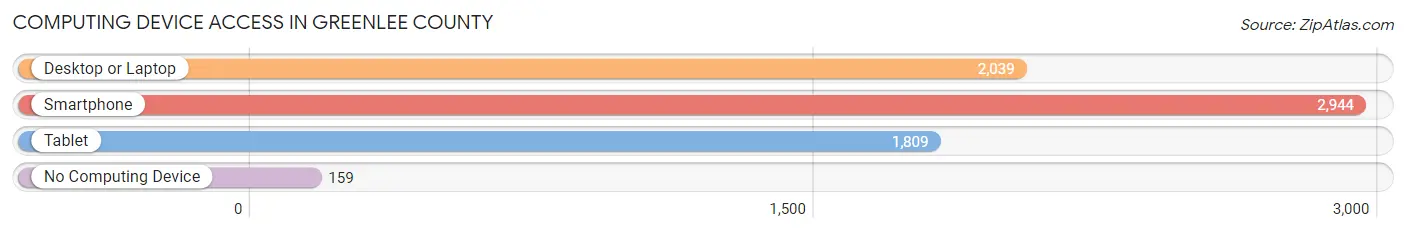
| Device Type | # Households | % Households |
| Desktop or Laptop | 2,039 | 61.7% |
| Smartphone | 2,944 | 89.1% |
| Tablet | 1,809 | 54.7% |
| No Computing Device | 159 | 4.8% |
| Total | 3,304 | 100.0% |
Internet Access in Greenlee County
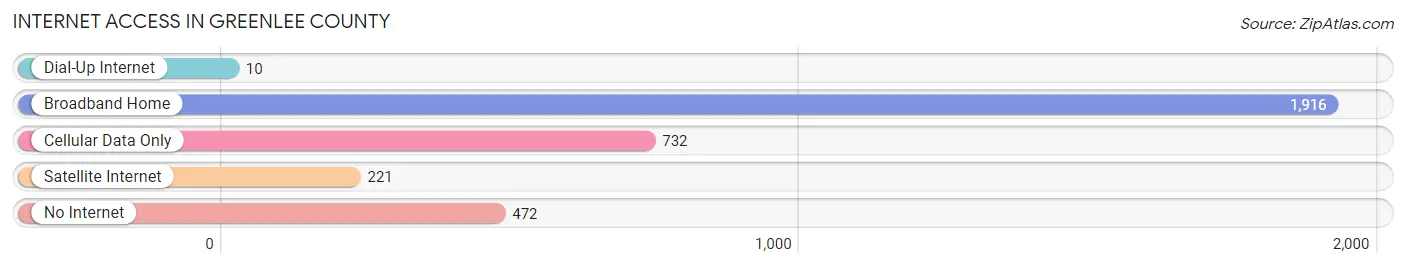
| Internet Type | # Households | % Households |
| Dial-Up Internet | 10 | 0.3% |
| Broadband Home | 1,916 | 58.0% |
| Cellular Data Only | 732 | 22.2% |
| Satellite Internet | 221 | 6.7% |
| No Internet | 472 | 14.3% |
| Total | 3,304 | 100.0% |
Greenlee County Summary
Geography
Greenlee County is located in the southeastern corner of Arizona, bordered by New Mexico to the east and Graham County to the west. The county covers an area of 2,945 square miles and is the second smallest county in the state. The county is divided into two distinct regions, the White Mountains and the San Carlos Apache Indian Reservation. The White Mountains are located in the northern part of the county and are home to the highest peak in Arizona, Mount Baldy, which stands at 11,400 feet. The San Carlos Apache Indian Reservation is located in the southern part of the county and is home to the San Carlos Apache Tribe.
The county is home to several rivers, including the Gila, San Francisco, and San Carlos Rivers. The Gila River is the largest river in the county and is a major tributary of the Colorado River. The San Francisco River is the second largest river in the county and is a tributary of the Gila River. The San Carlos River is the third largest river in the county and is a tributary of the San Francisco River.
The county is home to several mountain ranges, including the Chiricahua Mountains, the Dos Cabezas Mountains, and the White Mountains. The Chiricahua Mountains are located in the western part of the county and are home to the Chiricahua National Monument. The Dos Cabezas Mountains are located in the eastern part of the county and are home to the Dos Cabezas Wilderness. The White Mountains are located in the northern part of the county and are home to the highest peak in Arizona, Mount Baldy.
The county is home to several lakes, including the San Carlos Reservoir, the Apache Lake, and the Roosevelt Lake. The San Carlos Reservoir is located in the southern part of the county and is a major source of water for the San Carlos Apache Tribe. The Apache Lake is located in the eastern part of the county and is a popular destination for fishing and boating. The Roosevelt Lake is located in the western part of the county and is a popular destination for fishing and camping.
History
Greenlee County was established in 1909 from parts of Graham and Cochise counties. The county was named after Mason Greenlee, a pioneer settler in the area. The county was originally inhabited by the Apache and Navajo tribes, who were later displaced by settlers.
The county was initially an agricultural area, with the main crops being cotton, wheat, and corn. The county also had a thriving mining industry, with copper, gold, and silver being mined in the area. The county also had a thriving timber industry, with the White Mountains being home to several sawmills.
The county was also home to several military installations, including Fort Apache, Fort Thomas, and Fort Grant. Fort Apache was established in 1871 and was used to protect settlers from Apache raids. Fort Thomas was established in 1873 and was used to protect settlers from Navajo raids. Fort Grant was established in 1876 and was used to protect settlers from Apache raids.
Economy
Greenlee County has a diverse economy, with the main industries being agriculture, mining, timber, and tourism. The county is home to several large agricultural operations, with the main crops being cotton, wheat, and corn. The county also has a thriving mining industry, with copper, gold, and silver being mined in the area. The county also has a thriving timber industry, with the White Mountains being home to several sawmills.
The county is also home to several tourist attractions, including the Chiricahua National Monument, the Dos Cabezas Wilderness, and the White Mountains. The county is also home to several recreational areas, including the Apache Lake, the San Carlos Reservoir, and the Roosevelt Lake.
Demographics
As of the 2010 census, the population of Greenlee County was 8,437. The population is spread out with 48.3% male and 51.7% female. The median age is 38.2 years. The racial makeup of the county is 73.2% White, 0.7% African American, 1.3% Native American, 0.2% Asian, 0.1% Pacific Islander, 22.2% from other races, and 2.3% from two or more races. Hispanic or Latino of any race make up 44.3% of the population.
The median household income in Greenlee County is $37,917 and the median family income is $41,917. The per capita income is $17,917. The poverty rate is 22.3%. The unemployment rate is 6.3%.
Common Questions
What is the Total Population of Greenlee County?
Total Population of Greenlee County is 9,483.
What is the Total Male Population of Greenlee County?
Total Male Population of Greenlee County is 5,027.
What is the Total Female Population of Greenlee County?
Total Female Population of Greenlee County is 4,456.
What is the Ratio of Males per 100 Females in Greenlee County?
There are 112.81 Males per 100 Females in Greenlee County.
What is the Ratio of Females per 100 Males in Greenlee County?
There are 88.64 Females per 100 Males in Greenlee County.
What is the Median Population Age in Greenlee County?
Median Population Age in Greenlee County is 35.5 Years.
What is the Average Family Size in Greenlee County
Average Family Size in Greenlee County is 3.6 People.
What is the Average Household Size in Greenlee County
Average Household Size in Greenlee County is 2.8 People.
What is Per Capita Income in Greenlee County?
Per Capita income in Greenlee County is $29,394.
What is the Median Family Income in Greenlee County?
Median Family Income in Greenlee County is $78,172.
What is the Median Household income in Greenlee County?
Median Household Income in Greenlee County is $73,756.
What is Income or Wage Gap in Greenlee County?
Income or Wage Gap in Greenlee County is 50.2%.
Women in Greenlee County earn 49.8 cents for every dollar earned by a man.
What is Inequality or Gini Index in Greenlee County?
Inequality or Gini Index in Greenlee County is 0.38.
How Large is the Labor Force in Greenlee County?
There are 4,274 People in the Labor Forcein in Greenlee County.
What is the Percentage of People in the Labor Force in Greenlee County?
59.1% of People are in the Labor Force in Greenlee County.
What is the Unemployment Rate in Greenlee County?
Unemployment Rate in Greenlee County is 3.0%.