Coconino County, AZ
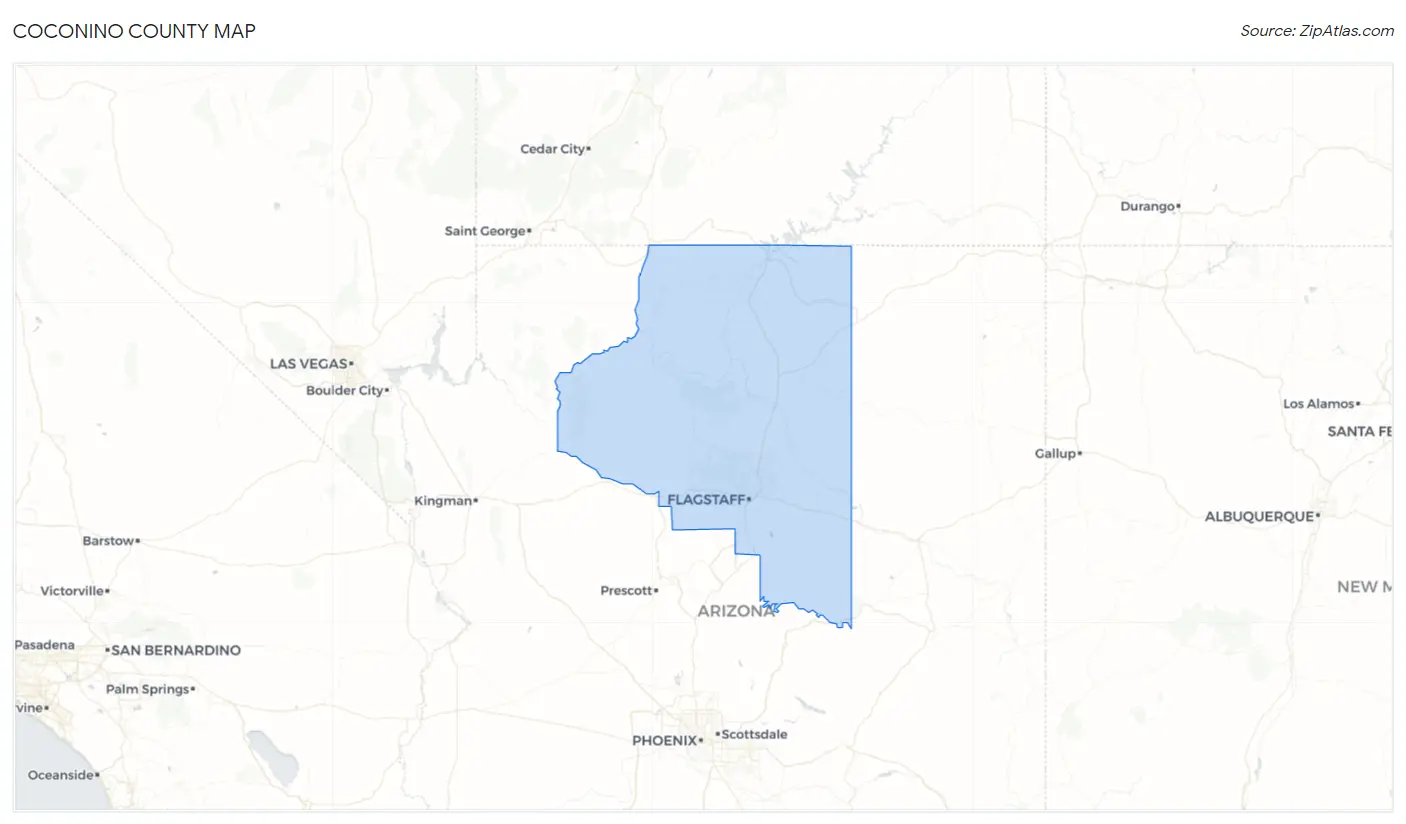
Coconino County Map
Coconino County Overview
144,705
TOTAL POPULATION
71,707
MALE POPULATION
72,998
FEMALE POPULATION
98.23
MALES / 100 FEMALES
101.80
FEMALES / 100 MALES
31.7
MEDIAN AGE
3.2
AVG FAMILY SIZE
2.5
AVG HOUSEHOLD SIZE
$32,592
PER CAPITA INCOME
$86,862
AVG FAMILY INCOME
$67,266
AVG HOUSEHOLD INCOME
25.0%
WAGE / INCOME GAP [ % ]
75.0¢/ $1
WAGE / INCOME GAP [ $ ]
$11,200
FAMILY INCOME DEFICIT
0.46
INEQUALITY / GINI INDEX
73,056
LABOR FORCE [ PEOPLE ]
61.3%
PERCENT IN LABOR FORCE
7.0%
UNEMPLOYMENT RATE
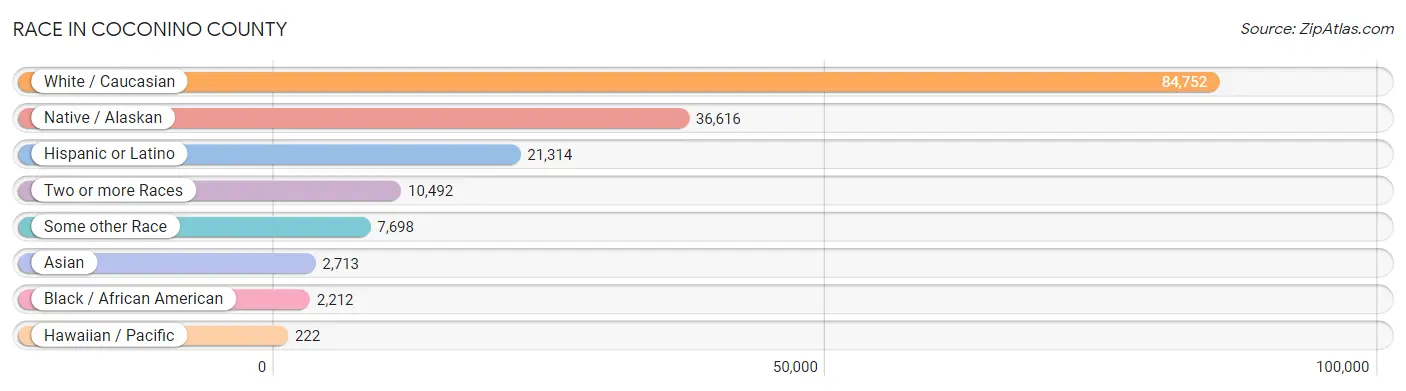
Race in Coconino County
The most populous races in Coconino County are White / Caucasian (84,752 | 58.6%), Native / Alaskan (36,616 | 25.3%), and Hispanic or Latino (21,314 | 14.7%).
| Race | # Population | % Population |
| Asian | 2,713 | 1.9% |
| Black / African American | 2,212 | 1.5% |
| Hawaiian / Pacific | 222 | 0.2% |
| Hispanic or Latino | 21,314 | 14.7% |
| Native / Alaskan | 36,616 | 25.3% |
| White / Caucasian | 84,752 | 58.6% |
| Two or more Races | 10,492 | 7.2% |
| Some other Race | 7,698 | 5.3% |
| Total | 144,705 | 100.0% |
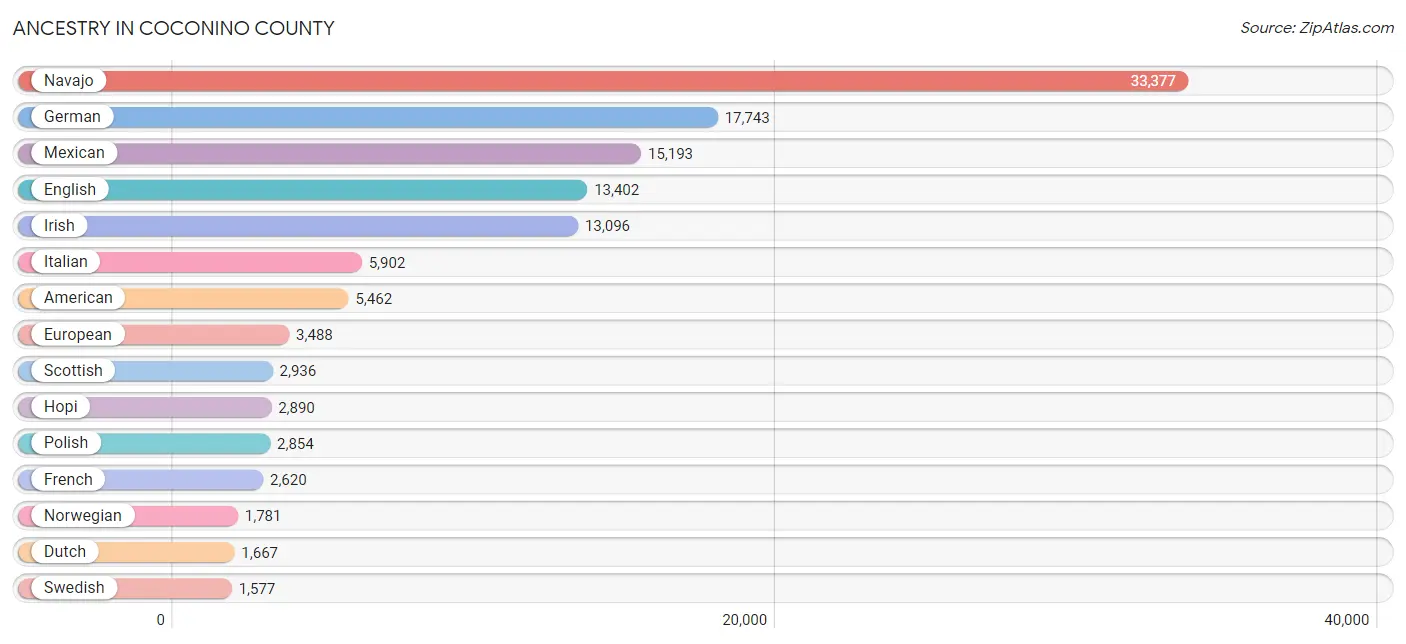
Ancestry in Coconino County
The most populous ancestries reported in Coconino County are Navajo (33,377 | 23.1%), German (17,743 | 12.3%), Mexican (15,193 | 10.5%), English (13,402 | 9.3%), and Irish (13,096 | 9.0%), together accounting for 64.1% of all Coconino County residents.
| Ancestry | # Population | % Population |
| Afghan | 38 | 0.0% |
| African | 135 | 0.1% |
| Alaska Native | 61 | 0.0% |
| Alaskan Athabascan | 62 | 0.0% |
| Albanian | 19 | 0.0% |
| Alsatian | 16 | 0.0% |
| American | 5,462 | 3.8% |
| Apache | 540 | 0.4% |
| Arab | 279 | 0.2% |
| Argentinean | 16 | 0.0% |
| Armenian | 113 | 0.1% |
| Assyrian / Chaldean / Syriac | 5 | 0.0% |
| Australian | 9 | 0.0% |
| Austrian | 222 | 0.2% |
| Basque | 14 | 0.0% |
| Belgian | 110 | 0.1% |
| Bhutanese | 536 | 0.4% |
| Blackfeet | 153 | 0.1% |
| Bolivian | 8 | 0.0% |
| Brazilian | 98 | 0.1% |
| British | 959 | 0.7% |
| Burmese | 475 | 0.3% |
| Cajun | 13 | 0.0% |
| Canadian | 380 | 0.3% |
| Carpatho Rusyn | 28 | 0.0% |
| Central American | 892 | 0.6% |
| Central American Indian | 169 | 0.1% |
| Cherokee | 605 | 0.4% |
| Cheyenne | 6 | 0.0% |
| Chilean | 31 | 0.0% |
| Chippewa | 144 | 0.1% |
| Choctaw | 158 | 0.1% |
| Colombian | 320 | 0.2% |
| Cree | 12 | 0.0% |
| Creek | 29 | 0.0% |
| Croatian | 195 | 0.1% |
| Crow | 4 | 0.0% |
| Cuban | 491 | 0.3% |
| Czech | 470 | 0.3% |
| Czechoslovakian | 138 | 0.1% |
| Danish | 872 | 0.6% |
| Delaware | 14 | 0.0% |
| Dominican | 95 | 0.1% |
| Dutch | 1,667 | 1.1% |
| Dutch West Indian | 27 | 0.0% |
| Eastern European | 542 | 0.4% |
| Ecuadorian | 15 | 0.0% |
| English | 13,402 | 9.3% |
| European | 3,488 | 2.4% |
| Filipino | 43 | 0.0% |
| Finnish | 511 | 0.4% |
| French | 2,620 | 1.8% |
| French American Indian | 1 | 0.0% |
| French Canadian | 588 | 0.4% |
| German | 17,743 | 12.3% |
| Greek | 262 | 0.2% |
| Guamanian / Chamorro | 130 | 0.1% |
| Guatemalan | 195 | 0.1% |
| Haitian | 59 | 0.0% |
| Honduran | 491 | 0.3% |
| Hopi | 2,890 | 2.0% |
| Hungarian | 332 | 0.2% |
| Indian (Asian) | 991 | 0.7% |
| Indonesian | 38 | 0.0% |
| Iranian | 74 | 0.1% |
| Irish | 13,096 | 9.0% |
| Iroquois | 27 | 0.0% |
| Israeli | 74 | 0.1% |
| Italian | 5,902 | 4.1% |
| Jamaican | 141 | 0.1% |
| Jordanian | 29 | 0.0% |
| Kenyan | 19 | 0.0% |
| Korean | 1,382 | 1.0% |
| Laotian | 34 | 0.0% |
| Latvian | 35 | 0.0% |
| Lebanese | 82 | 0.1% |
| Liberian | 14 | 0.0% |
| Lithuanian | 160 | 0.1% |
| Macedonian | 11 | 0.0% |
| Malaysian | 9 | 0.0% |
| Maltese | 27 | 0.0% |
| Mexican | 15,193 | 10.5% |
| Mexican American Indian | 213 | 0.2% |
| Mongolian | 13 | 0.0% |
| Native Hawaiian | 190 | 0.1% |
| Navajo | 33,377 | 23.1% |
| New Zealander | 51 | 0.0% |
| Nicaraguan | 31 | 0.0% |
| Nigerian | 52 | 0.0% |
| Northern European | 314 | 0.2% |
| Norwegian | 1,781 | 1.2% |
| Paiute | 67 | 0.1% |
| Pakistani | 116 | 0.1% |
| Palestinian | 9 | 0.0% |
| Panamanian | 91 | 0.1% |
| Pennsylvania German | 24 | 0.0% |
| Peruvian | 197 | 0.1% |
| Pima | 168 | 0.1% |
| Polish | 2,854 | 2.0% |
| Portuguese | 297 | 0.2% |
| Potawatomi | 17 | 0.0% |
| Pueblo | 713 | 0.5% |
| Puerto Rican | 473 | 0.3% |
| Romanian | 155 | 0.1% |
| Russian | 697 | 0.5% |
| Salvadoran | 84 | 0.1% |
| Samoan | 120 | 0.1% |
| Scandinavian | 907 | 0.6% |
| Scotch-Irish | 1,299 | 0.9% |
| Scottish | 2,936 | 2.0% |
| Serbian | 51 | 0.0% |
| Sierra Leonean | 3 | 0.0% |
| Sioux | 305 | 0.2% |
| Slavic | 71 | 0.1% |
| Slovak | 176 | 0.1% |
| Slovene | 15 | 0.0% |
| Somali | 32 | 0.0% |
| South African | 55 | 0.0% |
| South American | 790 | 0.5% |
| South American Indian | 501 | 0.4% |
| Spaniard | 370 | 0.3% |
| Spanish | 1,207 | 0.8% |
| Sri Lankan | 196 | 0.1% |
| Subsaharan African | 329 | 0.2% |
| Swedish | 1,577 | 1.1% |
| Swiss | 329 | 0.2% |
| Thai | 474 | 0.3% |
| Tohono O'Odham | 218 | 0.2% |
| Ugandan | 8 | 0.0% |
| Ukrainian | 306 | 0.2% |
| Ute | 10 | 0.0% |
| Venezuelan | 203 | 0.1% |
| Welsh | 1,462 | 1.0% |
| West Indian | 76 | 0.1% |
| Yaqui | 36 | 0.0% |
| Yugoslavian | 52 | 0.0% |
| Yuman | 104 | 0.1% |
| Yup'ik | 15 | 0.0% | View All 138 Rows |
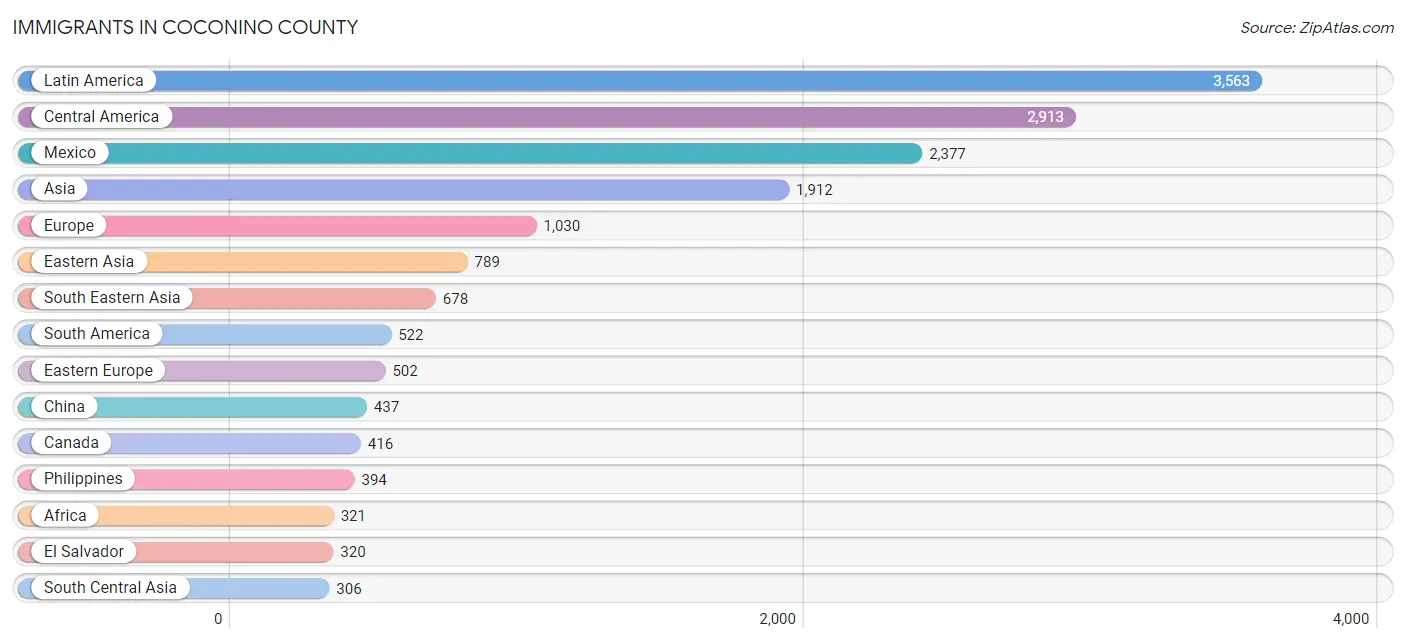
Immigrants in Coconino County
The most numerous immigrant groups reported in Coconino County came from Latin America (3,563 | 2.5%), Central America (2,913 | 2.0%), Mexico (2,377 | 1.6%), Asia (1,912 | 1.3%), and Europe (1,030 | 0.7%), together accounting for 8.1% of all Coconino County residents.
| Immigration Origin | # Population | % Population |
| Afghanistan | 18 | 0.0% |
| Africa | 321 | 0.2% |
| Asia | 1,912 | 1.3% |
| Australia | 10 | 0.0% |
| Belgium | 24 | 0.0% |
| Bolivia | 16 | 0.0% |
| Brazil | 119 | 0.1% |
| Canada | 416 | 0.3% |
| Caribbean | 128 | 0.1% |
| Central America | 2,913 | 2.0% |
| Chile | 31 | 0.0% |
| China | 437 | 0.3% |
| Colombia | 179 | 0.1% |
| Cuba | 5 | 0.0% |
| Czechoslovakia | 236 | 0.2% |
| Denmark | 21 | 0.0% |
| Eastern Africa | 71 | 0.1% |
| Eastern Asia | 789 | 0.5% |
| Eastern Europe | 502 | 0.4% |
| Ecuador | 15 | 0.0% |
| Egypt | 6 | 0.0% |
| El Salvador | 320 | 0.2% |
| England | 44 | 0.0% |
| Ethiopia | 32 | 0.0% |
| Europe | 1,030 | 0.7% |
| France | 76 | 0.1% |
| Germany | 157 | 0.1% |
| Greece | 10 | 0.0% |
| Guatemala | 190 | 0.1% |
| Haiti | 8 | 0.0% |
| Hong Kong | 33 | 0.0% |
| Hungary | 12 | 0.0% |
| India | 133 | 0.1% |
| Iran | 25 | 0.0% |
| Iraq | 31 | 0.0% |
| Ireland | 41 | 0.0% |
| Italy | 15 | 0.0% |
| Jamaica | 68 | 0.1% |
| Japan | 220 | 0.2% |
| Kenya | 11 | 0.0% |
| Korea | 132 | 0.1% |
| Latin America | 3,563 | 2.5% |
| Lebanon | 11 | 0.0% |
| Mexico | 2,377 | 1.6% |
| Middle Africa | 8 | 0.0% |
| Moldova | 14 | 0.0% |
| Nepal | 14 | 0.0% |
| Netherlands | 27 | 0.0% |
| Nigeria | 22 | 0.0% |
| Northern Africa | 6 | 0.0% |
| Northern Europe | 195 | 0.1% |
| Oceania | 68 | 0.1% |
| Pakistan | 62 | 0.0% |
| Panama | 26 | 0.0% |
| Peru | 150 | 0.1% |
| Philippines | 394 | 0.3% |
| Poland | 38 | 0.0% |
| Romania | 37 | 0.0% |
| Russia | 90 | 0.1% |
| Saudi Arabia | 97 | 0.1% |
| Scotland | 6 | 0.0% |
| Serbia | 17 | 0.0% |
| Sierra Leone | 3 | 0.0% |
| South Africa | 145 | 0.1% |
| South America | 522 | 0.4% |
| South Central Asia | 306 | 0.2% |
| South Eastern Asia | 678 | 0.5% |
| Southern Europe | 49 | 0.0% |
| Spain | 24 | 0.0% |
| Sri Lanka | 53 | 0.0% |
| Sweden | 32 | 0.0% |
| Taiwan | 40 | 0.0% |
| Thailand | 145 | 0.1% |
| Trinidad and Tobago | 47 | 0.0% |
| Ukraine | 48 | 0.0% |
| Uruguay | 8 | 0.0% |
| Venezuela | 4 | 0.0% |
| Vietnam | 101 | 0.1% |
| Western Africa | 25 | 0.0% |
| Western Asia | 139 | 0.1% |
| Western Europe | 284 | 0.2% |
| Zimbabwe | 7 | 0.0% | View All 82 Rows |
Sex and Age in Coconino County
Sex and Age in Coconino County
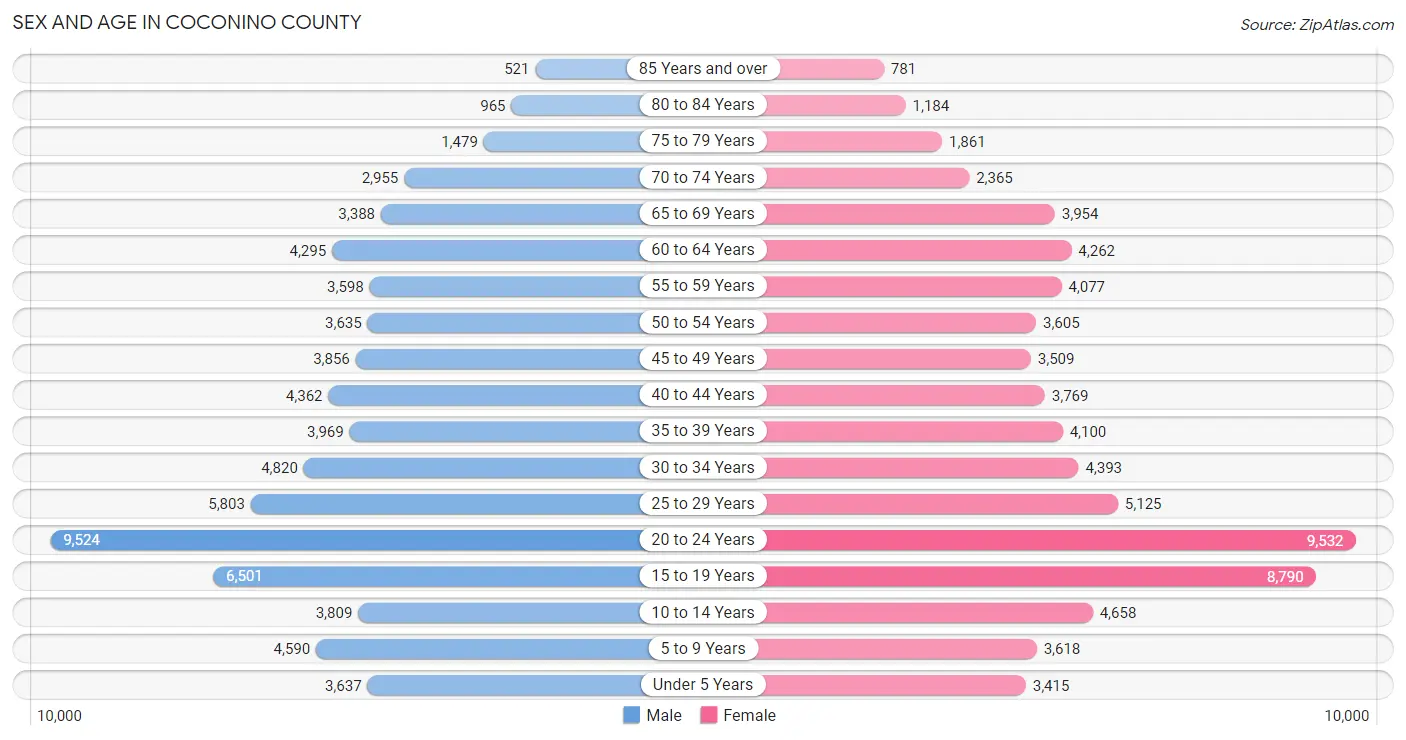
The most populous age groups in Coconino County are 20 to 24 Years (9,524 | 13.3%) for men and 20 to 24 Years (9,532 | 13.1%) for women.
| Age Bracket | Male | Female |
| Under 5 Years | 3,637 (5.1%) | 3,415 (4.7%) |
| 5 to 9 Years | 4,590 (6.4%) | 3,618 (5.0%) |
| 10 to 14 Years | 3,809 (5.3%) | 4,658 (6.4%) |
| 15 to 19 Years | 6,501 (9.1%) | 8,790 (12.0%) |
| 20 to 24 Years | 9,524 (13.3%) | 9,532 (13.1%) |
| 25 to 29 Years | 5,803 (8.1%) | 5,125 (7.0%) |
| 30 to 34 Years | 4,820 (6.7%) | 4,393 (6.0%) |
| 35 to 39 Years | 3,969 (5.5%) | 4,100 (5.6%) |
| 40 to 44 Years | 4,362 (6.1%) | 3,769 (5.2%) |
| 45 to 49 Years | 3,856 (5.4%) | 3,509 (4.8%) |
| 50 to 54 Years | 3,635 (5.1%) | 3,605 (4.9%) |
| 55 to 59 Years | 3,598 (5.0%) | 4,077 (5.6%) |
| 60 to 64 Years | 4,295 (6.0%) | 4,262 (5.8%) |
| 65 to 69 Years | 3,388 (4.7%) | 3,954 (5.4%) |
| 70 to 74 Years | 2,955 (4.1%) | 2,365 (3.2%) |
| 75 to 79 Years | 1,479 (2.1%) | 1,861 (2.5%) |
| 80 to 84 Years | 965 (1.3%) | 1,184 (1.6%) |
| 85 Years and over | 521 (0.7%) | 781 (1.1%) |
| Total | 71,707 (100.0%) | 72,998 (100.0%) |
Families and Households in Coconino County
Median Family Size in Coconino County
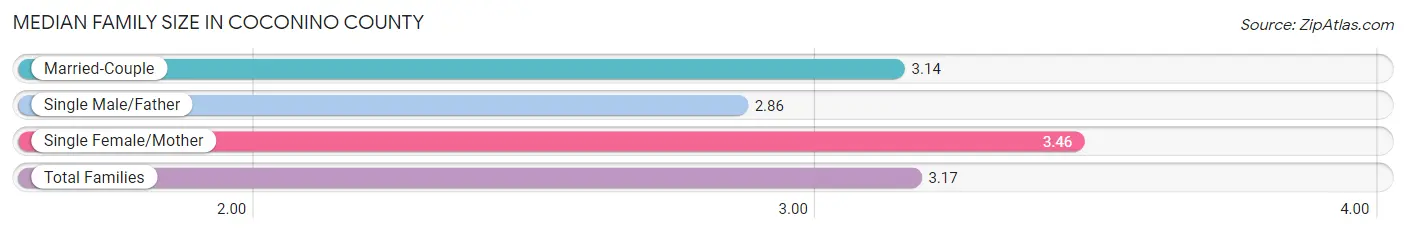
The median family size in Coconino County is 3.17 persons per family, with single female/mother families (5,575 | 18.3%) accounting for the largest median family size of 3.46 persons per family. On the other hand, single male/father families (2,551 | 8.4%) represent the smallest median family size with 2.86 persons per family.
| Family Type | # Families | Family Size |
| Married-Couple | 22,375 (73.4%) | 3.14 |
| Single Male/Father | 2,551 (8.4%) | 2.86 |
| Single Female/Mother | 5,575 (18.3%) | 3.46 |
| Total Families | 30,501 (100.0%) | 3.17 |
Median Household Size in Coconino County
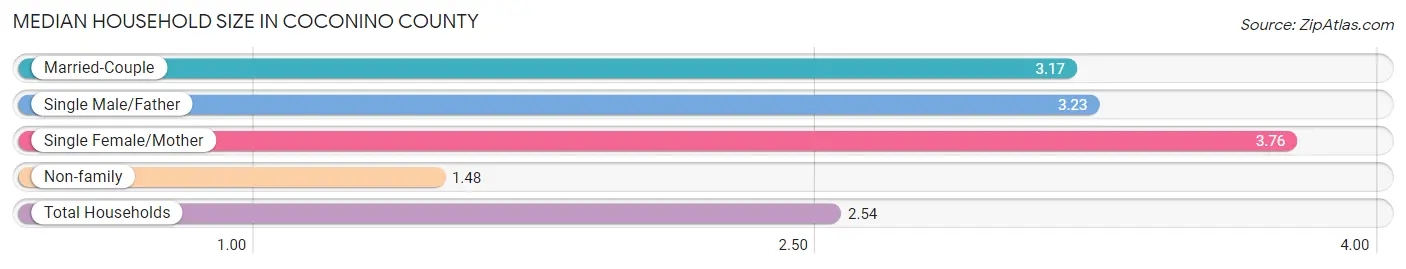
The median household size in Coconino County is 2.54 persons per household, with single female/mother households (5,575 | 10.7%) accounting for the largest median household size of 3.76 persons per household. non-family households (21,492 | 41.3%) represent the smallest median household size with 1.48 persons per household.
| Household Type | # Households | Household Size |
| Married-Couple | 22,375 (43.0%) | 3.17 |
| Single Male/Father | 2,551 (4.9%) | 3.23 |
| Single Female/Mother | 5,575 (10.7%) | 3.76 |
| Non-family | 21,492 (41.3%) | 1.48 |
| Total Households | 51,993 (100.0%) | 2.54 |
Household Size by Marriage Status in Coconino County
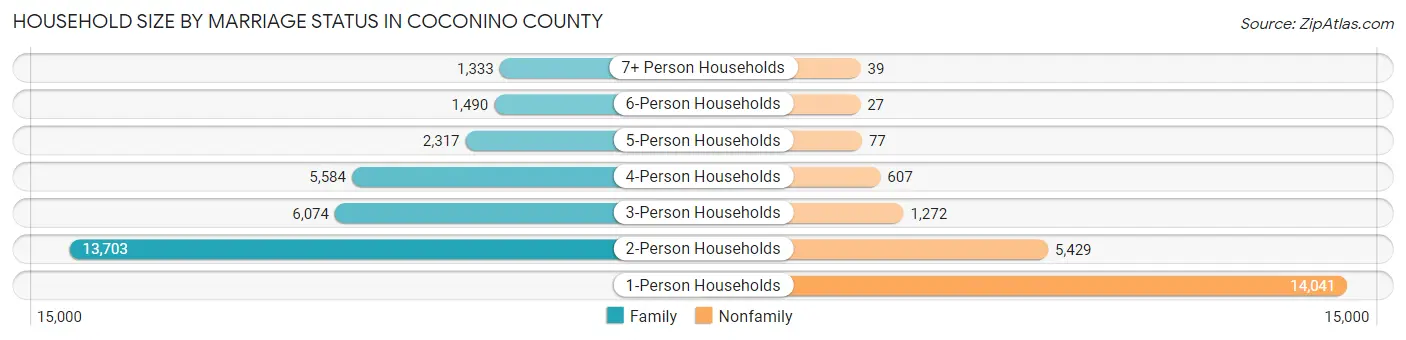
Out of a total of 51,993 households in Coconino County, 30,501 (58.7%) are family households, while 21,492 (41.3%) are nonfamily households. The most numerous type of family households are 2-person households, comprising 13,703, and the most common type of nonfamily households are 1-person households, comprising 14,041.
| Household Size | Family Households | Nonfamily Households |
| 1-Person Households | - | 14,041 (27.0%) |
| 2-Person Households | 13,703 (26.4%) | 5,429 (10.4%) |
| 3-Person Households | 6,074 (11.7%) | 1,272 (2.5%) |
| 4-Person Households | 5,584 (10.7%) | 607 (1.2%) |
| 5-Person Households | 2,317 (4.5%) | 77 (0.2%) |
| 6-Person Households | 1,490 (2.9%) | 27 (0.1%) |
| 7+ Person Households | 1,333 (2.6%) | 39 (0.1%) |
| Total | 30,501 (58.7%) | 21,492 (41.3%) |
Female Fertility in Coconino County
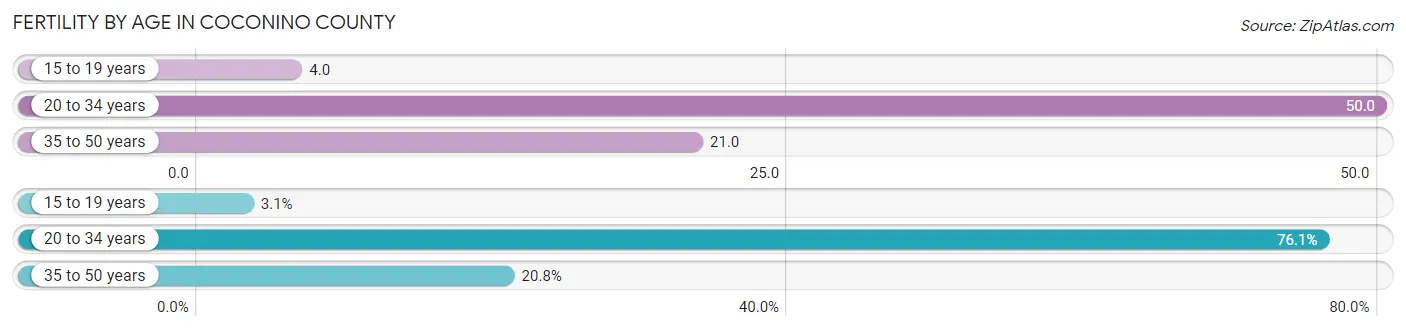
Fertility by Age in Coconino County
Average fertility rate in Coconino County is 31.0 births per 1,000 women. Women in the age bracket of 20 to 34 years have the highest fertility rate with 50.0 births per 1,000 women. Women in the age bracket of 20 to 34 years acount for 76.1% of all women with births.
| Age Bracket | Women with Births | Births / 1,000 Women |
| 15 to 19 years | 39 (3.1%) | 4.0 |
| 20 to 34 years | 954 (76.1%) | 50.0 |
| 35 to 50 years | 261 (20.8%) | 21.0 |
| Total | 1,254 (100.0%) | 31.0 |
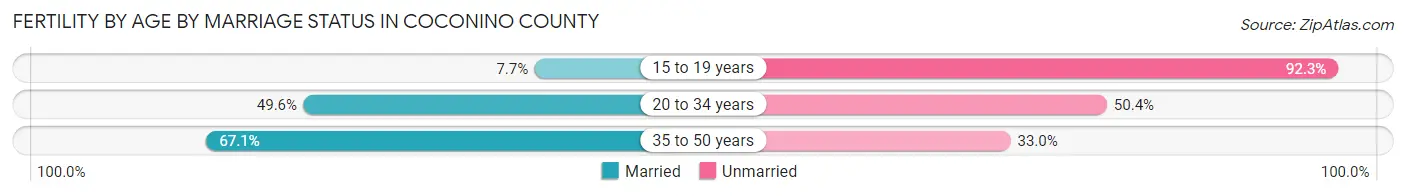
Fertility by Age by Marriage Status in Coconino County
51.9% of women with births (1,254) in Coconino County are married. The highest percentage of unmarried women with births falls into 15 to 19 years age bracket with 92.3% of them unmarried at the time of birth, while the lowest percentage of unmarried women with births belong to 35 to 50 years age bracket with 33.0% of them unmarried.
| Age Bracket | Married | Unmarried |
| 15 to 19 years | 3 (7.7%) | 36 (92.3%) |
| 20 to 34 years | 473 (49.6%) | 481 (50.4%) |
| 35 to 50 years | 175 (67.0%) | 86 (33.0%) |
| Total | 651 (51.9%) | 603 (48.1%) |
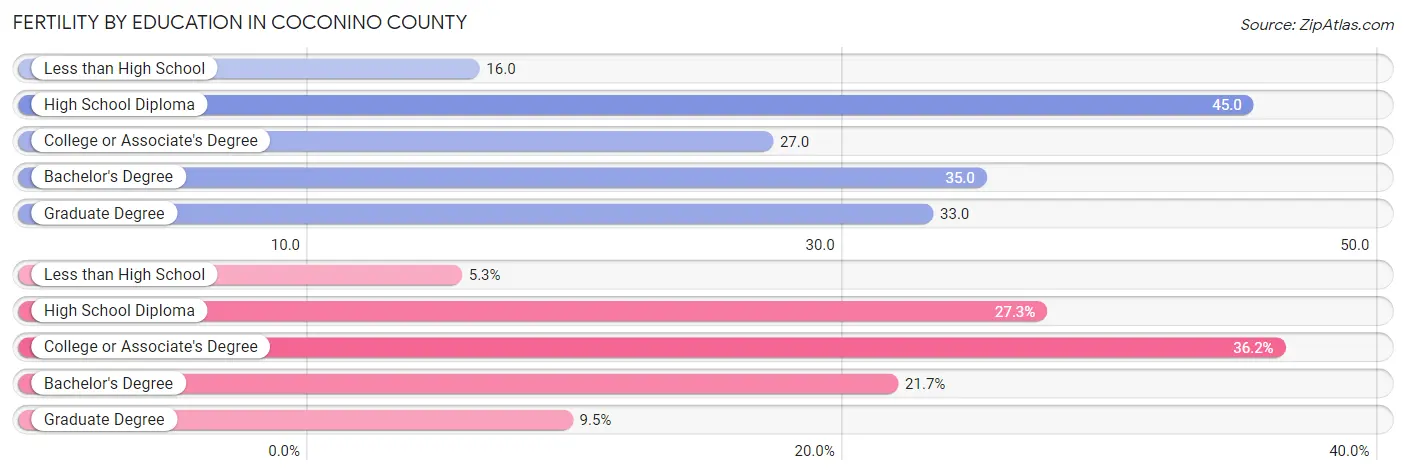
Fertility by Education in Coconino County
Average fertility rate in Coconino County is 31.0 births per 1,000 women. Women with the education attainment of high school diploma have the highest fertility rate of 45.0 births per 1,000 women, while women with the education attainment of less than high school have the lowest fertility at 16.0 births per 1,000 women. Women with the education attainment of college or associate's degree represent 36.2% of all women with births.
| Educational Attainment | Women with Births | Births / 1,000 Women |
| Less than High School | 67 (5.3%) | 16.0 |
| High School Diploma | 342 (27.3%) | 45.0 |
| College or Associate's Degree | 454 (36.2%) | 27.0 |
| Bachelor's Degree | 272 (21.7%) | 35.0 |
| Graduate Degree | 119 (9.5%) | 33.0 |
| Total | 1,254 (100.0%) | 31.0 |
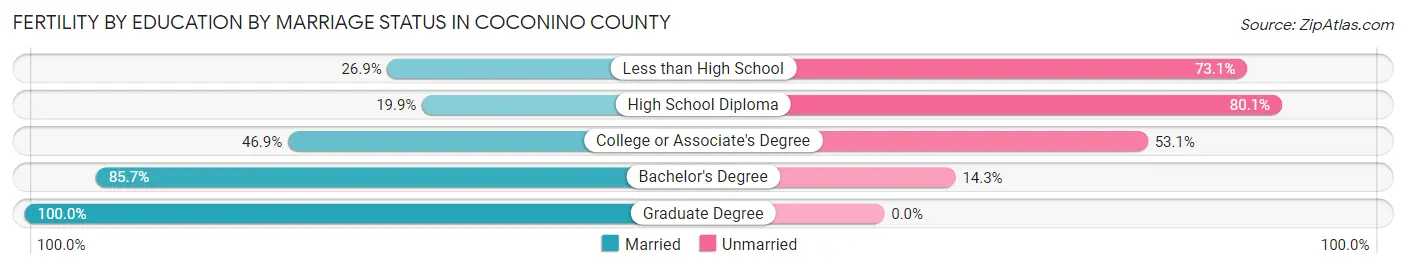
Fertility by Education by Marriage Status in Coconino County
48.1% of women with births in Coconino County are unmarried. Women with the educational attainment of graduate degree are most likely to be married with 100.0% of them married at childbirth, while women with the educational attainment of high school diploma are least likely to be married with 80.1% of them unmarried at childbirth.
| Educational Attainment | Married | Unmarried |
| Less than High School | 18 (26.9%) | 49 (73.1%) |
| High School Diploma | 68 (19.9%) | 274 (80.1%) |
| College or Associate's Degree | 213 (46.9%) | 241 (53.1%) |
| Bachelor's Degree | 233 (85.7%) | 39 (14.3%) |
| Graduate Degree | 119 (100.0%) | 0 (0.0%) |
| Total | 651 (51.9%) | 603 (48.1%) |
Income in Coconino County
Income Overview in Coconino County
Per Capita Income in Coconino County is $32,592, while median incomes of families and households are $86,862 and $67,266 respectively.
| Characteristic | Number | Measure |
| Per Capita Income | 144,705 | $32,592 |
| Median Family Income | 30,501 | $86,862 |
| Mean Family Income | 30,501 | $110,825 |
| Median Household Income | 51,993 | $67,266 |
| Mean Household Income | 51,993 | $89,188 |
| Income Deficit | 30,501 | $11,200 |
| Wage / Income Gap (%) | 144,705 | 25.00% |
| Wage / Income Gap ($) | 144,705 | 75.00¢ per $1 |
| Gini / Inequality Index | 144,705 | 0.46 |
Earnings by Sex in Coconino County
Average Earnings in Coconino County are $31,389, $36,378 for men and $27,282 for women, a difference of 25.0%.
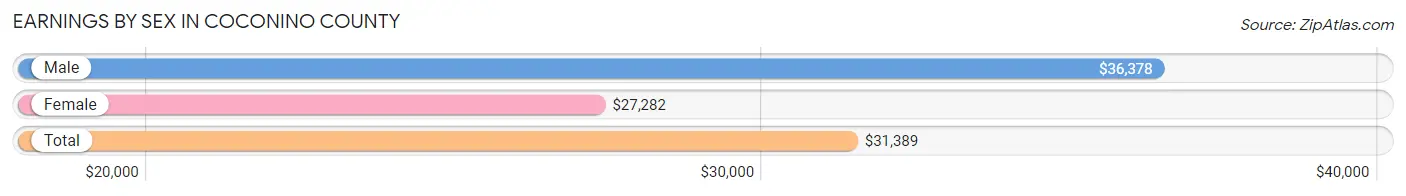
| Sex | Number | Average Earnings |
| Male | 41,013 (51.1%) | $36,378 |
| Female | 39,252 (48.9%) | $27,282 |
| Total | 80,265 (100.0%) | $31,389 |
Earnings by Sex by Income Bracket in Coconino County
The most common earnings brackets in Coconino County are $100,000+ for men (4,685 | 11.4%) and $2,499 or less for women (3,725 | 9.5%).
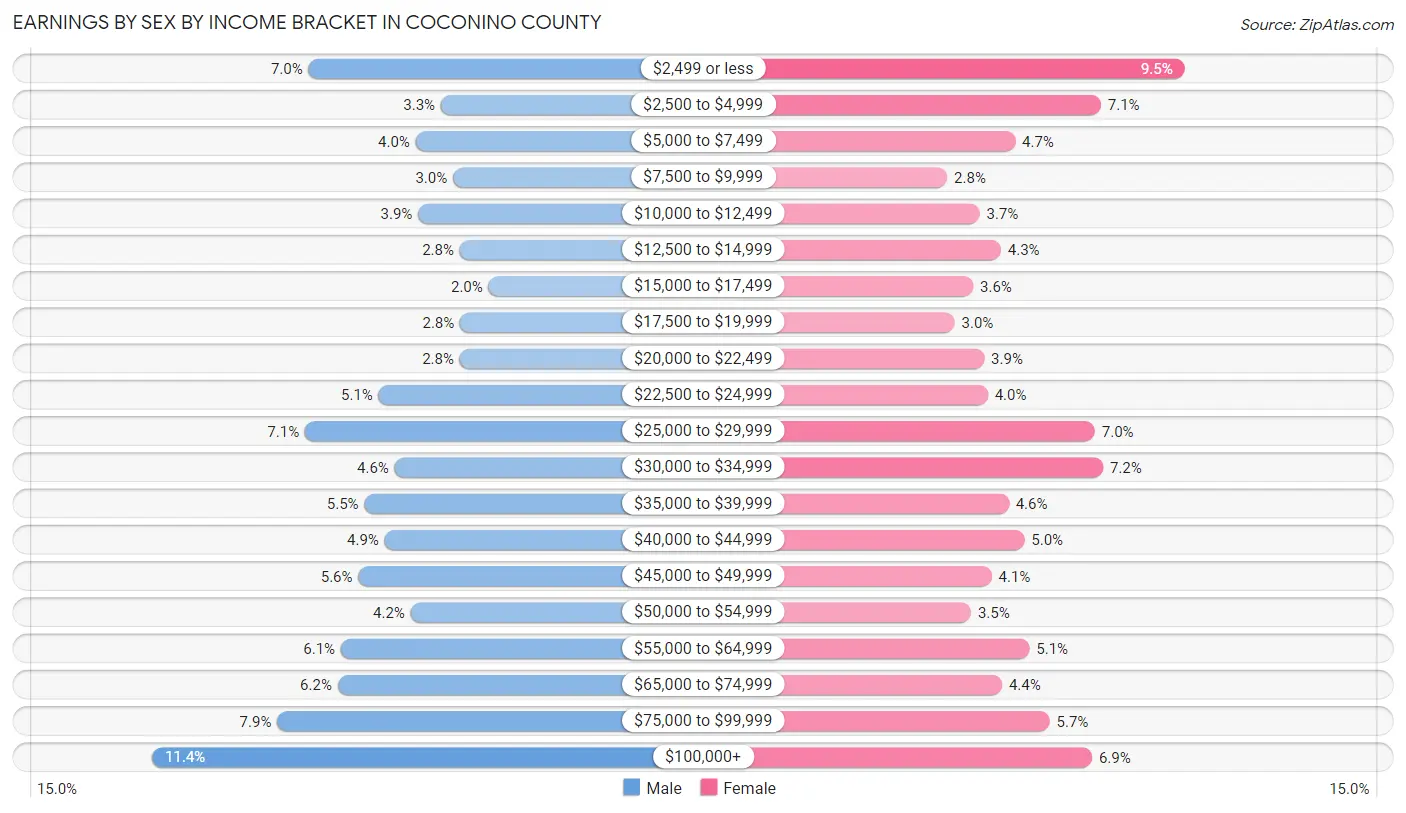
| Income | Male | Female |
| $2,499 or less | 2,880 (7.0%) | 3,725 (9.5%) |
| $2,500 to $4,999 | 1,353 (3.3%) | 2,803 (7.1%) |
| $5,000 to $7,499 | 1,645 (4.0%) | 1,857 (4.7%) |
| $7,500 to $9,999 | 1,214 (3.0%) | 1,107 (2.8%) |
| $10,000 to $12,499 | 1,615 (3.9%) | 1,463 (3.7%) |
| $12,500 to $14,999 | 1,138 (2.8%) | 1,698 (4.3%) |
| $15,000 to $17,499 | 805 (2.0%) | 1,395 (3.5%) |
| $17,500 to $19,999 | 1,132 (2.8%) | 1,191 (3.0%) |
| $20,000 to $22,499 | 1,136 (2.8%) | 1,517 (3.9%) |
| $22,500 to $24,999 | 2,073 (5.1%) | 1,554 (4.0%) |
| $25,000 to $29,999 | 2,920 (7.1%) | 2,734 (7.0%) |
| $30,000 to $34,999 | 1,887 (4.6%) | 2,825 (7.2%) |
| $35,000 to $39,999 | 2,234 (5.4%) | 1,787 (4.5%) |
| $40,000 to $44,999 | 2,002 (4.9%) | 1,958 (5.0%) |
| $45,000 to $49,999 | 2,303 (5.6%) | 1,599 (4.1%) |
| $50,000 to $54,999 | 1,704 (4.2%) | 1,369 (3.5%) |
| $55,000 to $64,999 | 2,507 (6.1%) | 2,013 (5.1%) |
| $65,000 to $74,999 | 2,541 (6.2%) | 1,713 (4.4%) |
| $75,000 to $99,999 | 3,239 (7.9%) | 2,238 (5.7%) |
| $100,000+ | 4,685 (11.4%) | 2,706 (6.9%) |
| Total | 41,013 (100.0%) | 39,252 (100.0%) |
Earnings by Sex by Educational Attainment in Coconino County
Average earnings in Coconino County are $47,259 for men and $38,414 for women, a difference of 18.7%. Men with an educational attainment of graduate degree enjoy the highest average annual earnings of $75,385, while those with less than high school education earn the least with $28,587. Women with an educational attainment of graduate degree earn the most with the average annual earnings of $63,935, while those with less than high school education have the smallest earnings of $24,623.
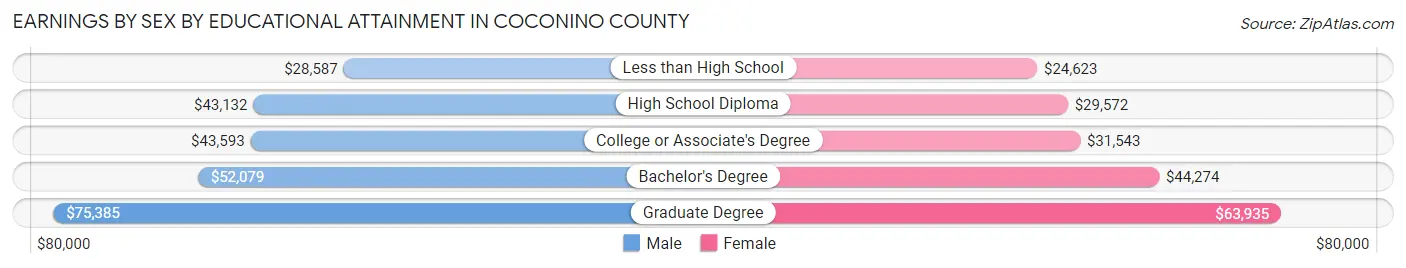
| Educational Attainment | Male Income | Female Income |
| Less than High School | $28,587 | $24,623 |
| High School Diploma | $43,132 | $29,572 |
| College or Associate's Degree | $43,593 | $31,543 |
| Bachelor's Degree | $52,079 | $44,274 |
| Graduate Degree | $75,385 | $63,935 |
| Total | $47,259 | $38,414 |
Family Income in Coconino County
Family Income Brackets in Coconino County
According to the Coconino County family income data, there are 6,832 families falling into the $100,000 to $149,999 income range, which is the most common income bracket and makes up 22.4% of all families. Conversely, the $10,000 to $14,999 income bracket is the least frequent group with only 427 families (1.4%) belonging to this category.
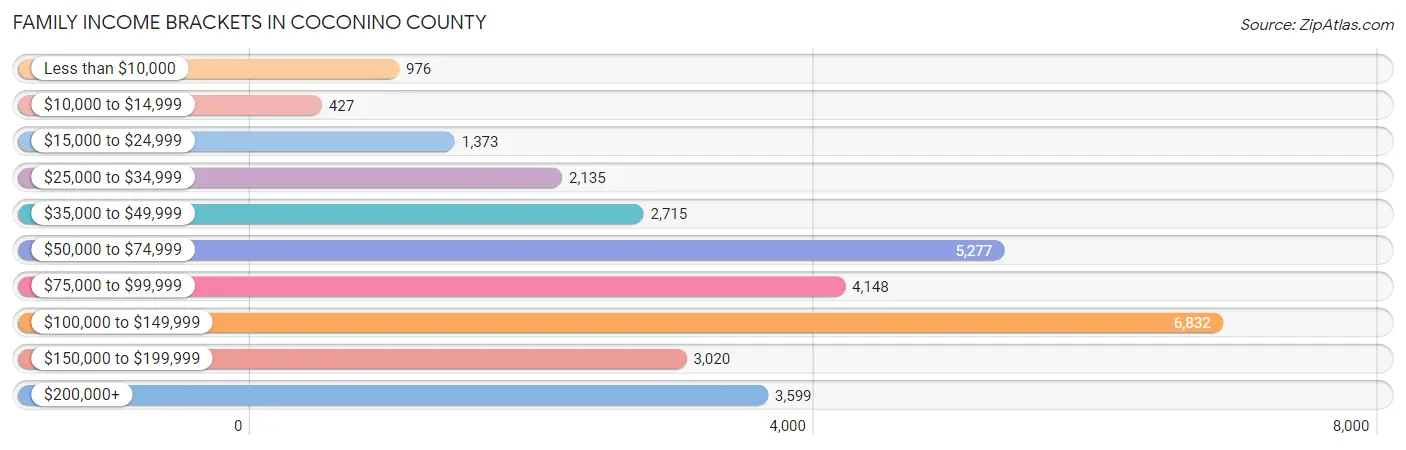
| Income Bracket | # Families | % Families |
| Less than $10,000 | 976 | 3.2% |
| $10,000 to $14,999 | 427 | 1.4% |
| $15,000 to $24,999 | 1,373 | 4.5% |
| $25,000 to $34,999 | 2,135 | 7.0% |
| $35,000 to $49,999 | 2,715 | 8.9% |
| $50,000 to $74,999 | 5,277 | 17.3% |
| $75,000 to $99,999 | 4,148 | 13.6% |
| $100,000 to $149,999 | 6,832 | 22.4% |
| $150,000 to $199,999 | 3,020 | 9.9% |
| $200,000+ | 3,599 | 11.8% |
Family Income by Famaliy Size in Coconino County
7+ person families (1,106 | 3.6%) account for the highest median family income in Coconino County with $110,625 per family, while 2-person families (15,012 | 49.2%) have the highest median income of $39,968 per family member.
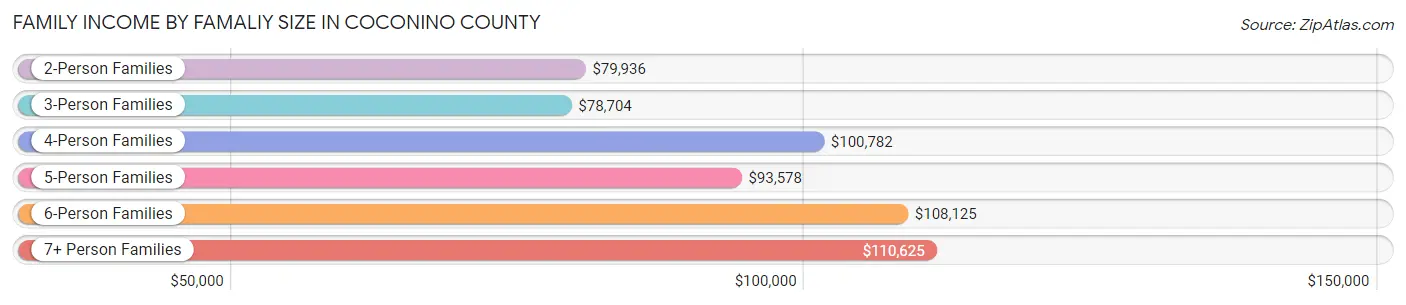
| Income Bracket | # Families | Median Income |
| 2-Person Families | 15,012 (49.2%) | $79,936 |
| 3-Person Families | 5,688 (18.6%) | $78,704 |
| 4-Person Families | 4,962 (16.3%) | $100,782 |
| 5-Person Families | 2,333 (7.6%) | $93,578 |
| 6-Person Families | 1,400 (4.6%) | $108,125 |
| 7+ Person Families | 1,106 (3.6%) | $110,625 |
| Total | 30,501 (100.0%) | $86,862 |
Family Income by Number of Earners in Coconino County
The median family income in Coconino County is $86,862, with families comprising 3+ earners (3,576) having the highest median family income of $142,564, while families with no earners (5,139) have the lowest median family income of $53,523, accounting for 11.7% and 16.9% of families, respectively.
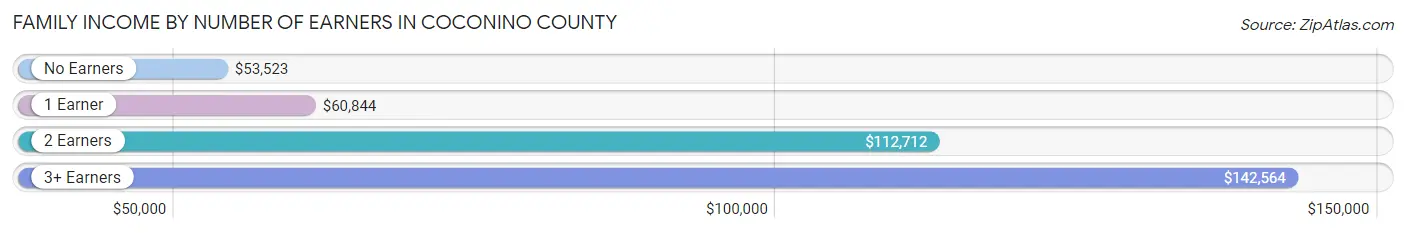
| Number of Earners | # Families | Median Income |
| No Earners | 5,139 (16.9%) | $53,523 |
| 1 Earner | 9,183 (30.1%) | $60,844 |
| 2 Earners | 12,603 (41.3%) | $112,712 |
| 3+ Earners | 3,576 (11.7%) | $142,564 |
| Total | 30,501 (100.0%) | $86,862 |
Household Income in Coconino County
Household Income Brackets in Coconino County
With 9,567 households falling in the category, the $50,000 to $74,999 income range is the most frequent in Coconino County, accounting for 18.4% of all households. In contrast, only 2,496 households (4.8%) fall into the $10,000 to $14,999 income bracket, making it the least populous group.
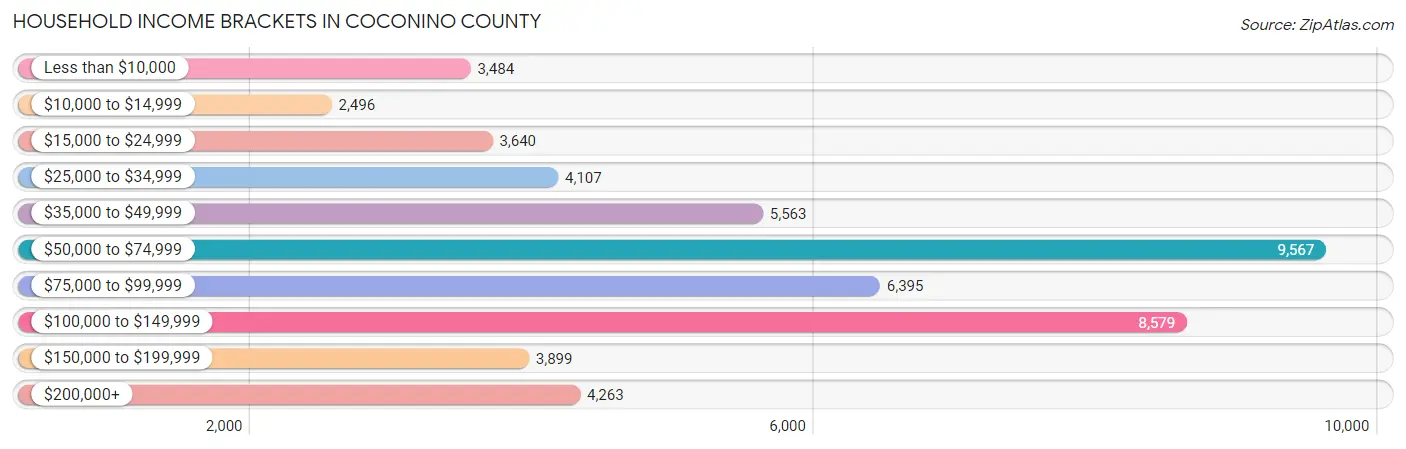
| Income Bracket | # Households | % Households |
| Less than $10,000 | 3,484 | 6.7% |
| $10,000 to $14,999 | 2,496 | 4.8% |
| $15,000 to $24,999 | 3,640 | 7.0% |
| $25,000 to $34,999 | 4,107 | 7.9% |
| $35,000 to $49,999 | 5,563 | 10.7% |
| $50,000 to $74,999 | 9,567 | 18.4% |
| $75,000 to $99,999 | 6,395 | 12.3% |
| $100,000 to $149,999 | 8,579 | 16.5% |
| $150,000 to $199,999 | 3,899 | 7.5% |
| $200,000+ | 4,263 | 8.2% |
Household Income by Householder Age in Coconino County
The median household income in Coconino County is $67,266, with the highest median household income of $78,753 found in the 45 to 64 years age bracket for the primary householder. A total of 17,670 households (34.0%) fall into this category. Meanwhile, the 15 to 24 years age bracket for the primary householder has the lowest median household income of $30,395, with 5,310 households (10.2%) in this group.
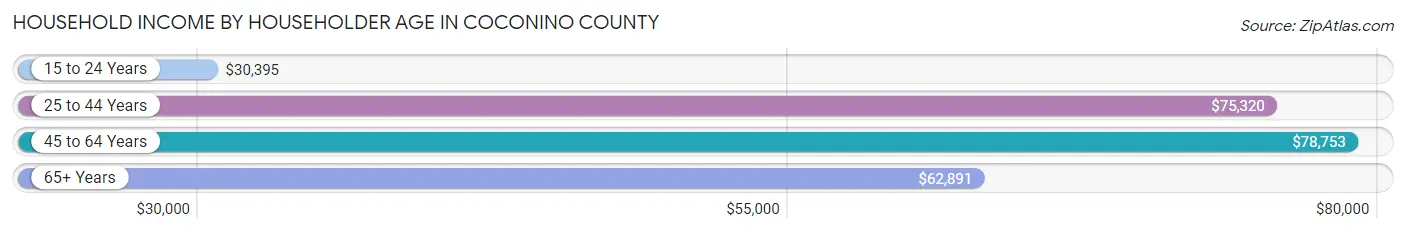
| Income Bracket | # Households | Median Income |
| 15 to 24 Years | 5,310 (10.2%) | $30,395 |
| 25 to 44 Years | 16,628 (32.0%) | $75,320 |
| 45 to 64 Years | 17,670 (34.0%) | $78,753 |
| 65+ Years | 12,385 (23.8%) | $62,891 |
| Total | 51,993 (100.0%) | $67,266 |
Poverty in Coconino County
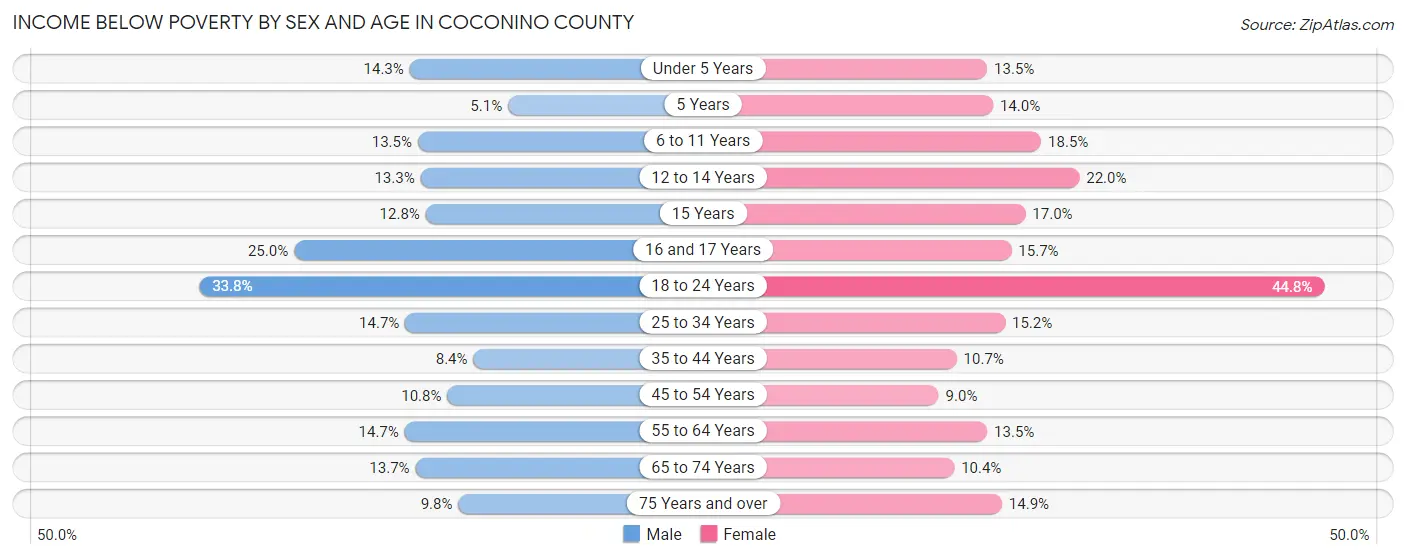
Income Below Poverty by Sex and Age in Coconino County
With 15.9% poverty level for males and 17.9% for females among the residents of Coconino County, 18 to 24 year old males and 18 to 24 year old females are the most vulnerable to poverty, with 3,373 males (33.8%) and 4,142 females (44.8%) in their respective age groups living below the poverty level.
| Age Bracket | Male | Female |
| Under 5 Years | 505 (14.3%) | 451 (13.5%) |
| 5 Years | 53 (5.1%) | 95 (14.0%) |
| 6 to 11 Years | 696 (13.5%) | 913 (18.5%) |
| 12 to 14 Years | 282 (13.3%) | 554 (22.0%) |
| 15 Years | 138 (12.8%) | 122 (17.0%) |
| 16 and 17 Years | 371 (25.0%) | 267 (15.7%) |
| 18 to 24 Years | 3,373 (33.8%) | 4,142 (44.8%) |
| 25 to 34 Years | 1,524 (14.7%) | 1,435 (15.1%) |
| 35 to 44 Years | 688 (8.4%) | 834 (10.7%) |
| 45 to 54 Years | 803 (10.8%) | 639 (9.0%) |
| 55 to 64 Years | 1,154 (14.7%) | 1,124 (13.5%) |
| 65 to 74 Years | 870 (13.7%) | 656 (10.4%) |
| 75 Years and over | 285 (9.8%) | 557 (14.9%) |
| Total | 10,742 (15.9%) | 11,789 (17.9%) |
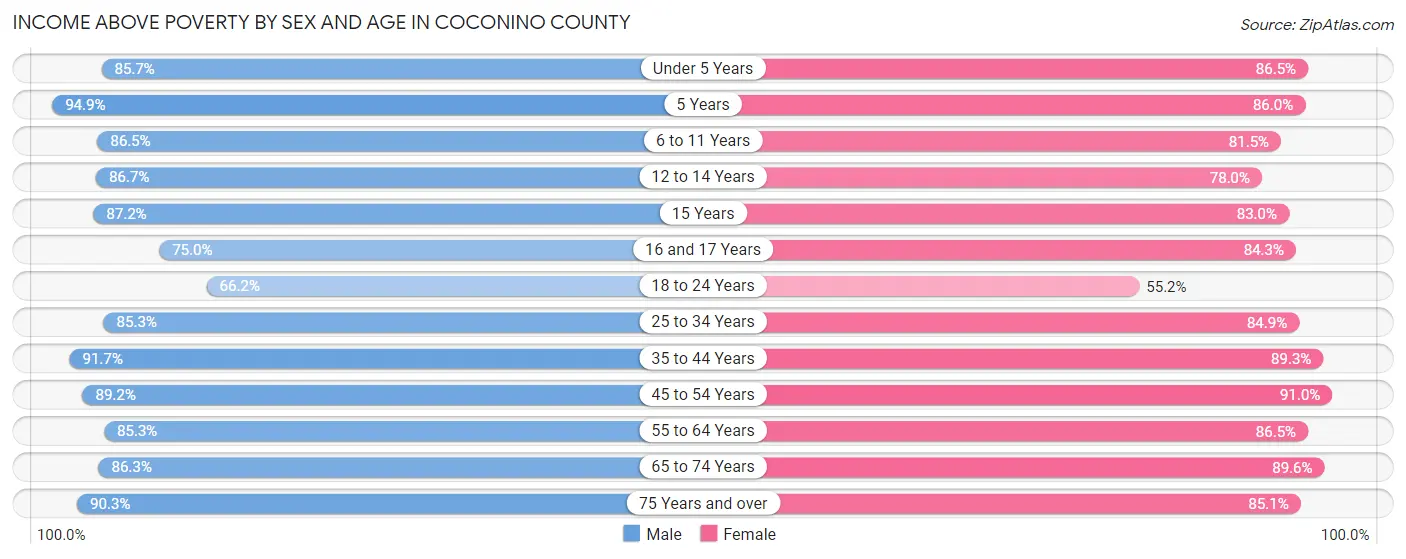
Income Above Poverty by Sex and Age in Coconino County
According to the poverty statistics in Coconino County, males aged 5 years and females aged 45 to 54 years are the age groups that are most secure financially, with 94.9% of males and 91.0% of females in these age groups living above the poverty line.
| Age Bracket | Male | Female |
| Under 5 Years | 3,033 (85.7%) | 2,891 (86.5%) |
| 5 Years | 979 (94.9%) | 582 (86.0%) |
| 6 to 11 Years | 4,455 (86.5%) | 4,023 (81.5%) |
| 12 to 14 Years | 1,845 (86.7%) | 1,960 (78.0%) |
| 15 Years | 942 (87.2%) | 594 (83.0%) |
| 16 and 17 Years | 1,113 (75.0%) | 1,429 (84.3%) |
| 18 to 24 Years | 6,608 (66.2%) | 5,110 (55.2%) |
| 25 to 34 Years | 8,859 (85.3%) | 8,037 (84.9%) |
| 35 to 44 Years | 7,553 (91.6%) | 6,988 (89.3%) |
| 45 to 54 Years | 6,652 (89.2%) | 6,470 (91.0%) |
| 55 to 64 Years | 6,679 (85.3%) | 7,207 (86.5%) |
| 65 to 74 Years | 5,465 (86.3%) | 5,634 (89.6%) |
| 75 Years and over | 2,637 (90.2%) | 3,192 (85.1%) |
| Total | 56,820 (84.1%) | 54,117 (82.1%) |
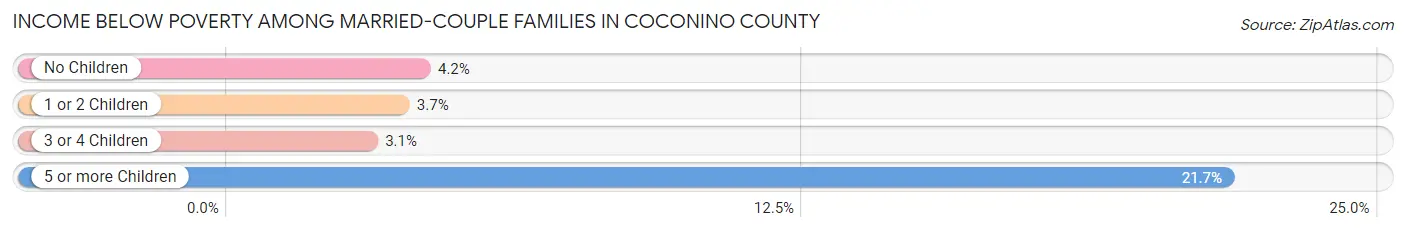
Income Below Poverty Among Married-Couple Families in Coconino County
The poverty statistics for married-couple families in Coconino County show that 4.2% or 935 of the total 22,375 families live below the poverty line. Families with 5 or more children have the highest poverty rate of 21.7%, comprising of 57 families. On the other hand, families with 3 or 4 children have the lowest poverty rate of 3.0%, which includes 58 families.
| Children | Above Poverty | Below Poverty |
| No Children | 13,287 (95.8%) | 583 (4.2%) |
| 1 or 2 Children | 6,102 (96.3%) | 237 (3.7%) |
| 3 or 4 Children | 1,845 (97.0%) | 58 (3.0%) |
| 5 or more Children | 206 (78.3%) | 57 (21.7%) |
| Total | 21,440 (95.8%) | 935 (4.2%) |
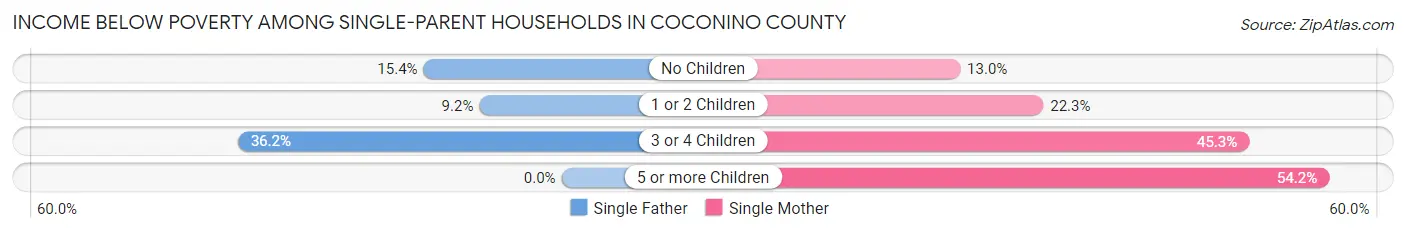
Income Below Poverty Among Single-Parent Households in Coconino County
According to the poverty data in Coconino County, 13.9% or 354 single-father households and 24.2% or 1,352 single-mother households are living below the poverty line. Among single-father households, those with 3 or 4 children have the highest poverty rate, with 55 households (36.2%) experiencing poverty. Likewise, among single-mother households, those with 5 or more children have the highest poverty rate, with 96 households (54.2%) falling below the poverty line.
| Children | Single Father | Single Mother |
| No Children | 194 (15.4%) | 257 (13.0%) |
| 1 or 2 Children | 105 (9.2%) | 536 (22.3%) |
| 3 or 4 Children | 55 (36.2%) | 463 (45.3%) |
| 5 or more Children | 0 (0.0%) | 96 (54.2%) |
| Total | 354 (13.9%) | 1,352 (24.2%) |
Income Below Poverty Among Married-Couple vs Single-Parent Households in Coconino County
The poverty data for Coconino County shows that 935 of the married-couple family households (4.2%) and 1,706 of the single-parent households (21.0%) are living below the poverty level. Within the married-couple family households, those with 5 or more children have the highest poverty rate, with 57 households (21.7%) falling below the poverty line. Among the single-parent households, those with 5 or more children have the highest poverty rate, with 96 household (54.2%) living below poverty.
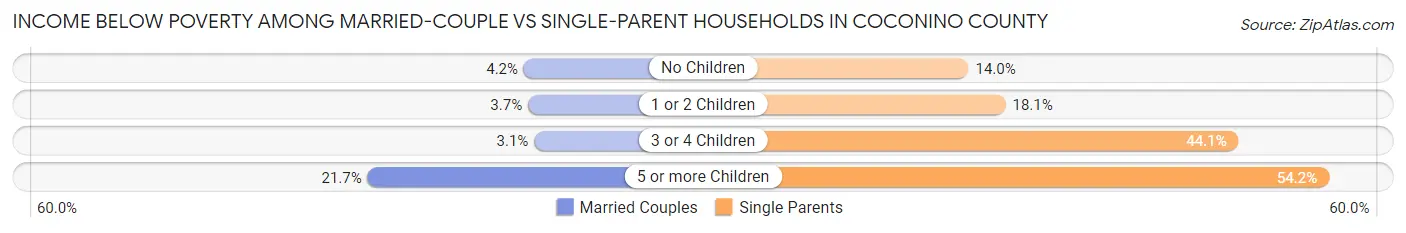
| Children | Married-Couple Families | Single-Parent Households |
| No Children | 583 (4.2%) | 451 (14.0%) |
| 1 or 2 Children | 237 (3.7%) | 641 (18.1%) |
| 3 or 4 Children | 58 (3.0%) | 518 (44.1%) |
| 5 or more Children | 57 (21.7%) | 96 (54.2%) |
| Total | 935 (4.2%) | 1,706 (21.0%) |
Employment Characteristics in Coconino County
Employment by Class of Employer in Coconino County
Among the 66,342 employed individuals in Coconino County, private company employees (38,966 | 58.7%), not-for-profit organizations (6,369 | 9.6%), and state government employees (6,296 | 9.5%) make up the most common classes of employment.
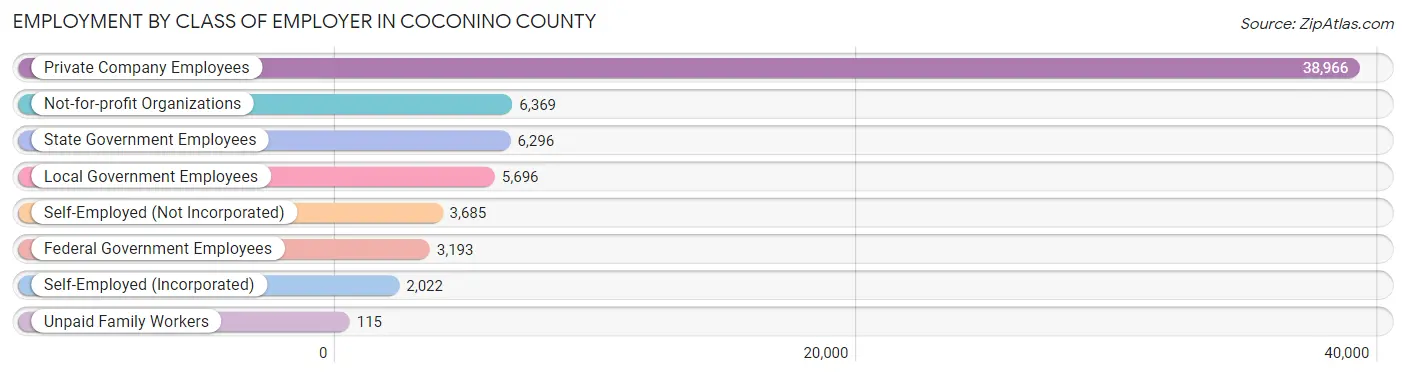
| Employer Class | # Employees | % Employees |
| Private Company Employees | 38,966 | 58.7% |
| Self-Employed (Incorporated) | 2,022 | 3.0% |
| Self-Employed (Not Incorporated) | 3,685 | 5.6% |
| Not-for-profit Organizations | 6,369 | 9.6% |
| Local Government Employees | 5,696 | 8.6% |
| State Government Employees | 6,296 | 9.5% |
| Federal Government Employees | 3,193 | 4.8% |
| Unpaid Family Workers | 115 | 0.2% |
| Total | 66,342 | 100.0% |
Employment Status by Age in Coconino County
According to the labor force statistics for Coconino County, out of the total population over 16 years of age (119,178), 61.3% or 73,056 individuals are in the labor force, with 7.0% or 5,114 of them unemployed. The age group with the highest labor force participation rate is 35 to 44 years, with 82.6% or 13,381 individuals in the labor force. Within the labor force, the 16 to 19 years age range has the highest percentage of unemployed individuals, with 25.6% or 1,371 of them being unemployed.
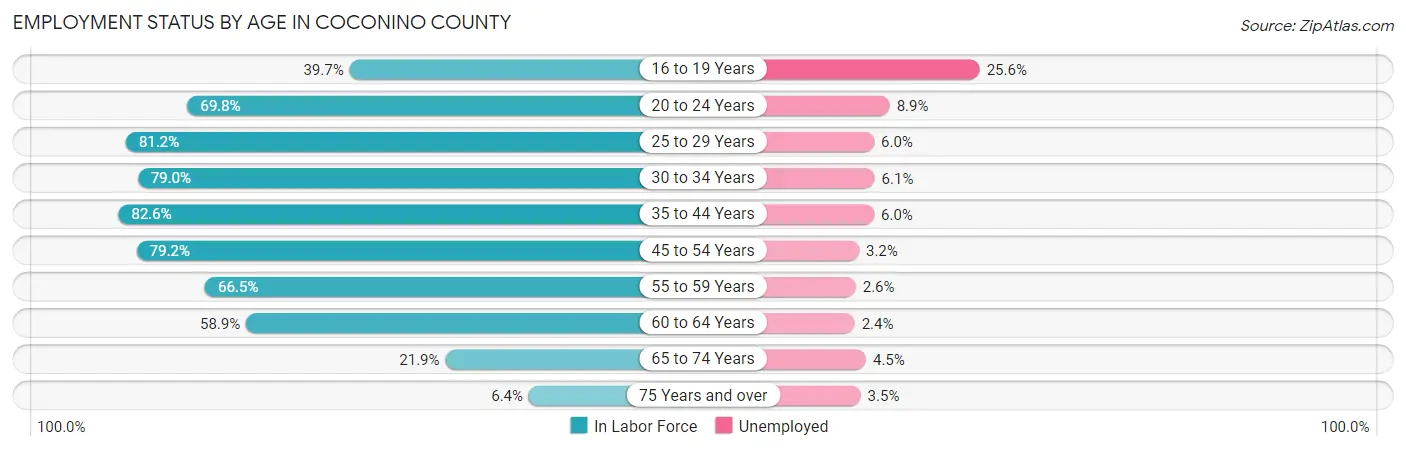
| Age Bracket | In Labor Force | Unemployed |
| 16 to 19 Years | 5,356 (39.7%) | 1,371 (25.6%) |
| 20 to 24 Years | 13,301 (69.8%) | 1,184 (8.9%) |
| 25 to 29 Years | 8,874 (81.2%) | 532 (6.0%) |
| 30 to 34 Years | 7,278 (79.0%) | 444 (6.1%) |
| 35 to 44 Years | 13,381 (82.6%) | 803 (6.0%) |
| 45 to 54 Years | 11,567 (79.2%) | 370 (3.2%) |
| 55 to 59 Years | 5,104 (66.5%) | 133 (2.6%) |
| 60 to 64 Years | 5,040 (58.9%) | 121 (2.4%) |
| 65 to 74 Years | 2,773 (21.9%) | 125 (4.5%) |
| 75 Years and over | 435 (6.4%) | 15 (3.5%) |
| Total | 73,056 (61.3%) | 5,114 (7.0%) |
Employment Status by Educational Attainment in Coconino County
According to labor force statistics for Coconino County, 76.3% of individuals (51,257) out of the total population between 25 and 64 years of age (67,178) are in the labor force, with 4.7% or 2,409 of them being unemployed. The group with the highest labor force participation rate are those with the educational attainment of bachelor's degree or higher, with 83.4% or 22,028 individuals in the labor force. Within the labor force, individuals with less than high school education have the highest percentage of unemployment, with 10.4% or 253 of them being unemployed.
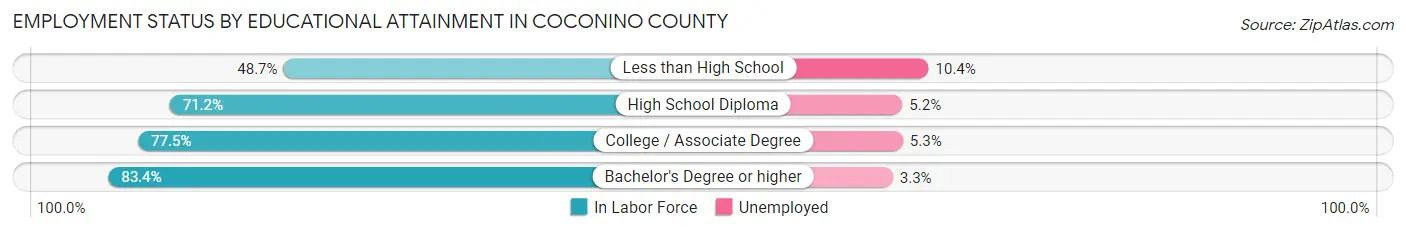
| Educational Attainment | In Labor Force | Unemployed |
| Less than High School | 2,430 (48.7%) | 519 (10.4%) |
| High School Diploma | 10,585 (71.2%) | 773 (5.2%) |
| College / Associate Degree | 16,206 (77.5%) | 1,108 (5.3%) |
| Bachelor's Degree or higher | 22,028 (83.4%) | 872 (3.3%) |
| Total | 51,257 (76.3%) | 3,157 (4.7%) |
Employment Occupations by Sex in Coconino County
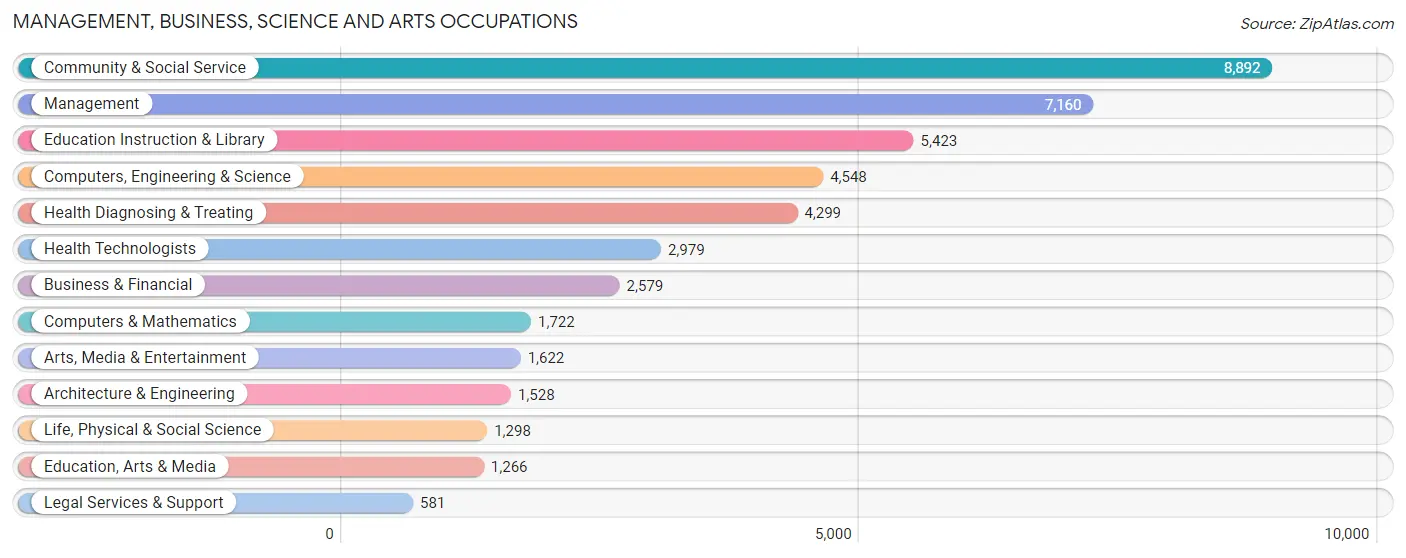
Management, Business, Science and Arts Occupations
The most common Management, Business, Science and Arts occupations in Coconino County are Community & Social Service (8,892 | 13.1%), Management (7,160 | 10.5%), Education Instruction & Library (5,423 | 8.0%), Computers, Engineering & Science (4,548 | 6.7%), and Health Diagnosing & Treating (4,299 | 6.3%).
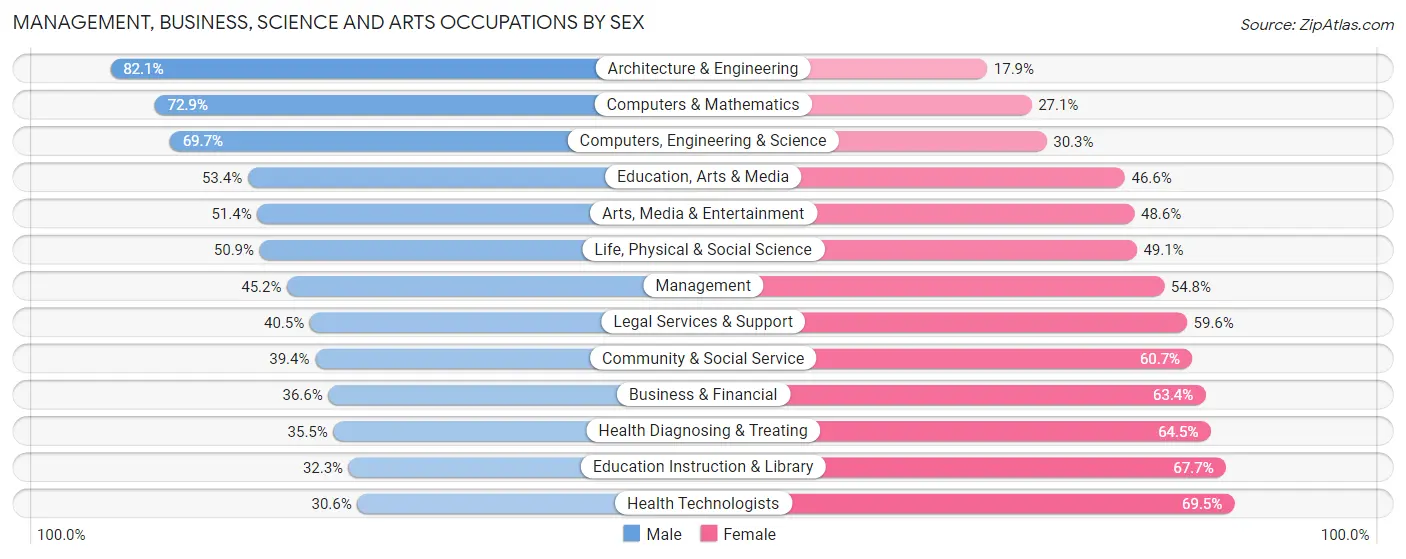
Management, Business, Science and Arts Occupations by Sex
Within the Management, Business, Science and Arts occupations in Coconino County, the most male-oriented occupations are Architecture & Engineering (82.1%), Computers & Mathematics (72.9%), and Computers, Engineering & Science (69.7%), while the most female-oriented occupations are Health Technologists (69.5%), Education Instruction & Library (67.7%), and Health Diagnosing & Treating (64.5%).
| Occupation | Male | Female |
| Management | 3,236 (45.2%) | 3,924 (54.8%) |
| Business & Financial | 944 (36.6%) | 1,635 (63.4%) |
| Computers, Engineering & Science | 3,171 (69.7%) | 1,377 (30.3%) |
| Computers & Mathematics | 1,255 (72.9%) | 467 (27.1%) |
| Architecture & Engineering | 1,255 (82.1%) | 273 (17.9%) |
| Life, Physical & Social Science | 661 (50.9%) | 637 (49.1%) |
| Community & Social Service | 3,499 (39.4%) | 5,393 (60.7%) |
| Education, Arts & Media | 676 (53.4%) | 590 (46.6%) |
| Legal Services & Support | 235 (40.5%) | 346 (59.6%) |
| Education Instruction & Library | 1,754 (32.3%) | 3,669 (67.7%) |
| Arts, Media & Entertainment | 834 (51.4%) | 788 (48.6%) |
| Health Diagnosing & Treating | 1,528 (35.5%) | 2,771 (64.5%) |
| Health Technologists | 910 (30.5%) | 2,069 (69.5%) |
| Total (Category) | 12,378 (45.1%) | 15,100 (54.9%) |
| Total (Overall) | 34,891 (51.3%) | 33,064 (48.7%) |
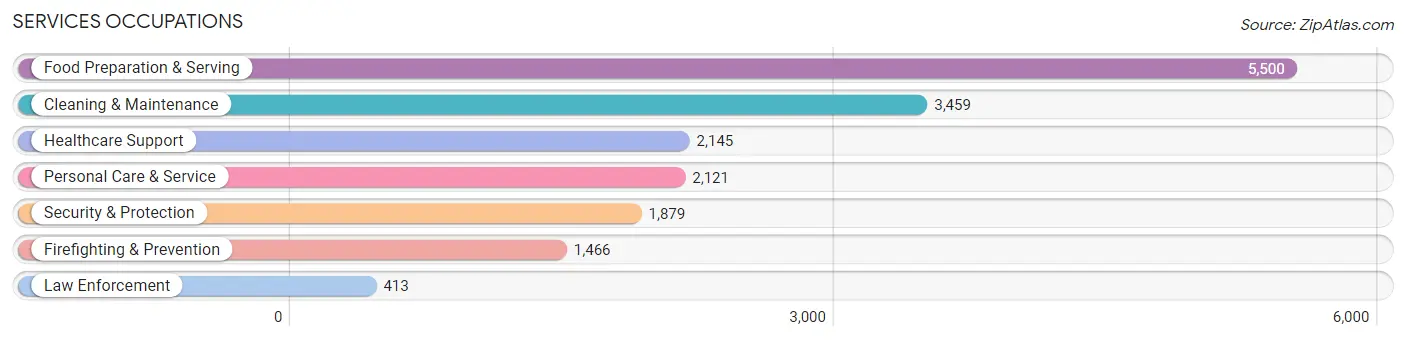
Services Occupations
The most common Services occupations in Coconino County are Food Preparation & Serving (5,500 | 8.1%), Cleaning & Maintenance (3,459 | 5.1%), Healthcare Support (2,145 | 3.2%), Personal Care & Service (2,121 | 3.1%), and Security & Protection (1,879 | 2.8%).
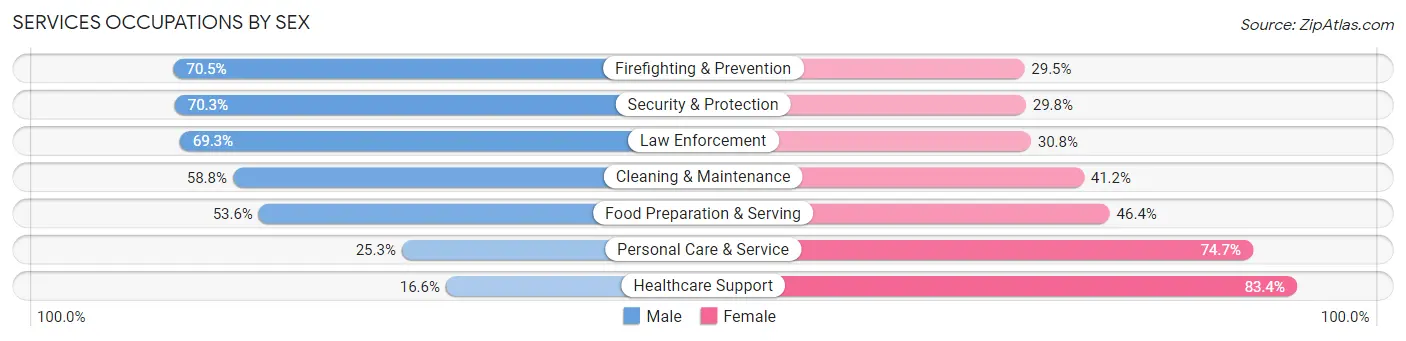
Services Occupations by Sex
Within the Services occupations in Coconino County, the most male-oriented occupations are Firefighting & Prevention (70.5%), Security & Protection (70.3%), and Law Enforcement (69.3%), while the most female-oriented occupations are Healthcare Support (83.4%), Personal Care & Service (74.7%), and Food Preparation & Serving (46.4%).
| Occupation | Male | Female |
| Healthcare Support | 356 (16.6%) | 1,789 (83.4%) |
| Security & Protection | 1,320 (70.3%) | 559 (29.7%) |
| Firefighting & Prevention | 1,034 (70.5%) | 432 (29.5%) |
| Law Enforcement | 286 (69.3%) | 127 (30.7%) |
| Food Preparation & Serving | 2,950 (53.6%) | 2,550 (46.4%) |
| Cleaning & Maintenance | 2,033 (58.8%) | 1,426 (41.2%) |
| Personal Care & Service | 537 (25.3%) | 1,584 (74.7%) |
| Total (Category) | 7,196 (47.6%) | 7,908 (52.4%) |
| Total (Overall) | 34,891 (51.3%) | 33,064 (48.7%) |
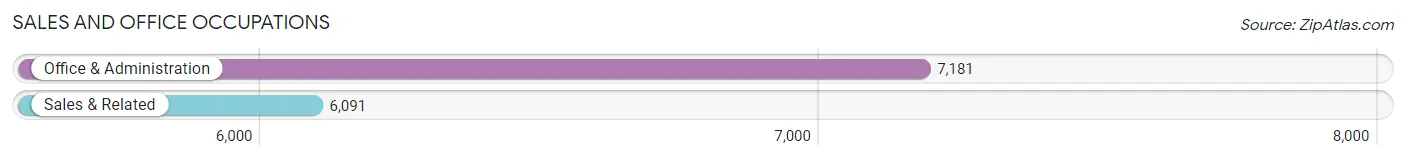
Sales and Office Occupations
The most common Sales and Office occupations in Coconino County are Office & Administration (7,181 | 10.6%), and Sales & Related (6,091 | 9.0%).
Sales and Office Occupations by Sex
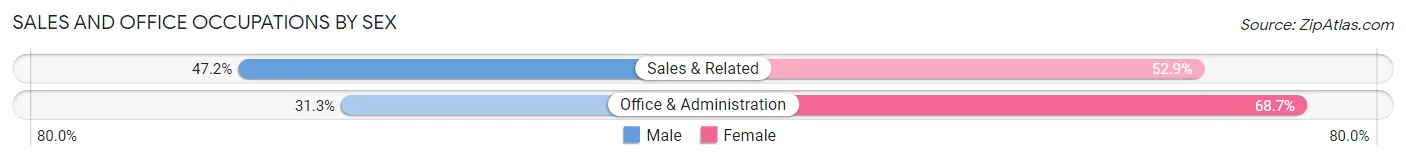
| Occupation | Male | Female |
| Sales & Related | 2,872 (47.1%) | 3,219 (52.8%) |
| Office & Administration | 2,250 (31.3%) | 4,931 (68.7%) |
| Total (Category) | 5,122 (38.6%) | 8,150 (61.4%) |
| Total (Overall) | 34,891 (51.3%) | 33,064 (48.7%) |
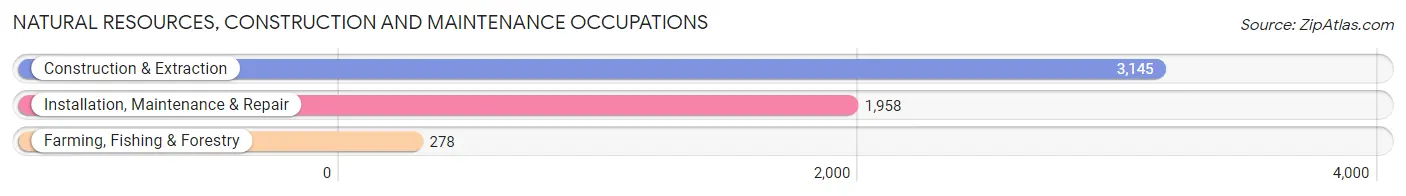
Natural Resources, Construction and Maintenance Occupations
The most common Natural Resources, Construction and Maintenance occupations in Coconino County are Construction & Extraction (3,145 | 4.6%), Installation, Maintenance & Repair (1,958 | 2.9%), and Farming, Fishing & Forestry (278 | 0.4%).
Natural Resources, Construction and Maintenance Occupations by Sex
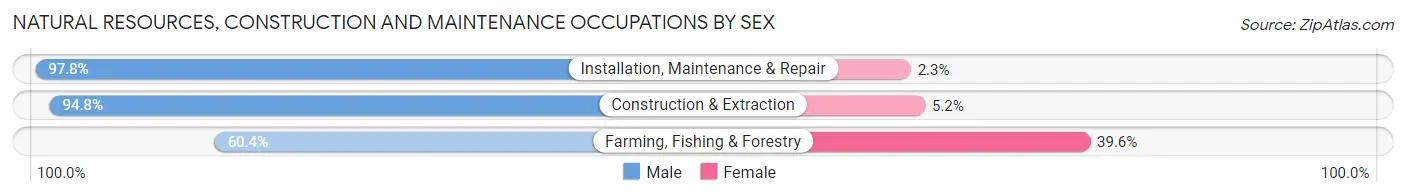
| Occupation | Male | Female |
| Farming, Fishing & Forestry | 168 (60.4%) | 110 (39.6%) |
| Construction & Extraction | 2,981 (94.8%) | 164 (5.2%) |
| Installation, Maintenance & Repair | 1,914 (97.8%) | 44 (2.2%) |
| Total (Category) | 5,063 (94.1%) | 318 (5.9%) |
| Total (Overall) | 34,891 (51.3%) | 33,064 (48.7%) |
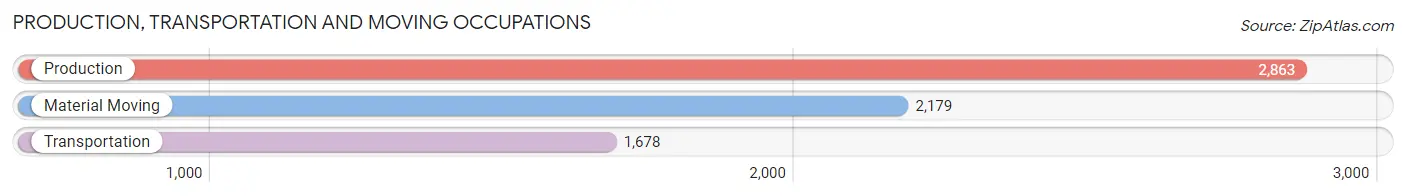
Production, Transportation and Moving Occupations
The most common Production, Transportation and Moving occupations in Coconino County are Production (2,863 | 4.2%), Material Moving (2,179 | 3.2%), and Transportation (1,678 | 2.5%).
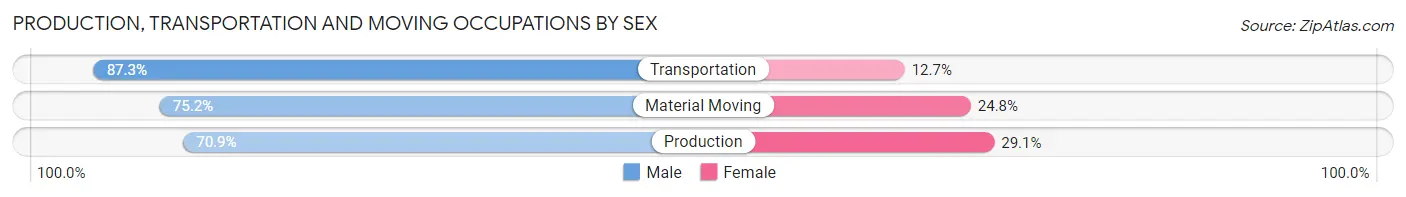
Production, Transportation and Moving Occupations by Sex
| Occupation | Male | Female |
| Production | 2,029 (70.9%) | 834 (29.1%) |
| Transportation | 1,465 (87.3%) | 213 (12.7%) |
| Material Moving | 1,638 (75.2%) | 541 (24.8%) |
| Total (Category) | 5,132 (76.4%) | 1,588 (23.6%) |
| Total (Overall) | 34,891 (51.3%) | 33,064 (48.7%) |
Employment Industries by Sex in Coconino County
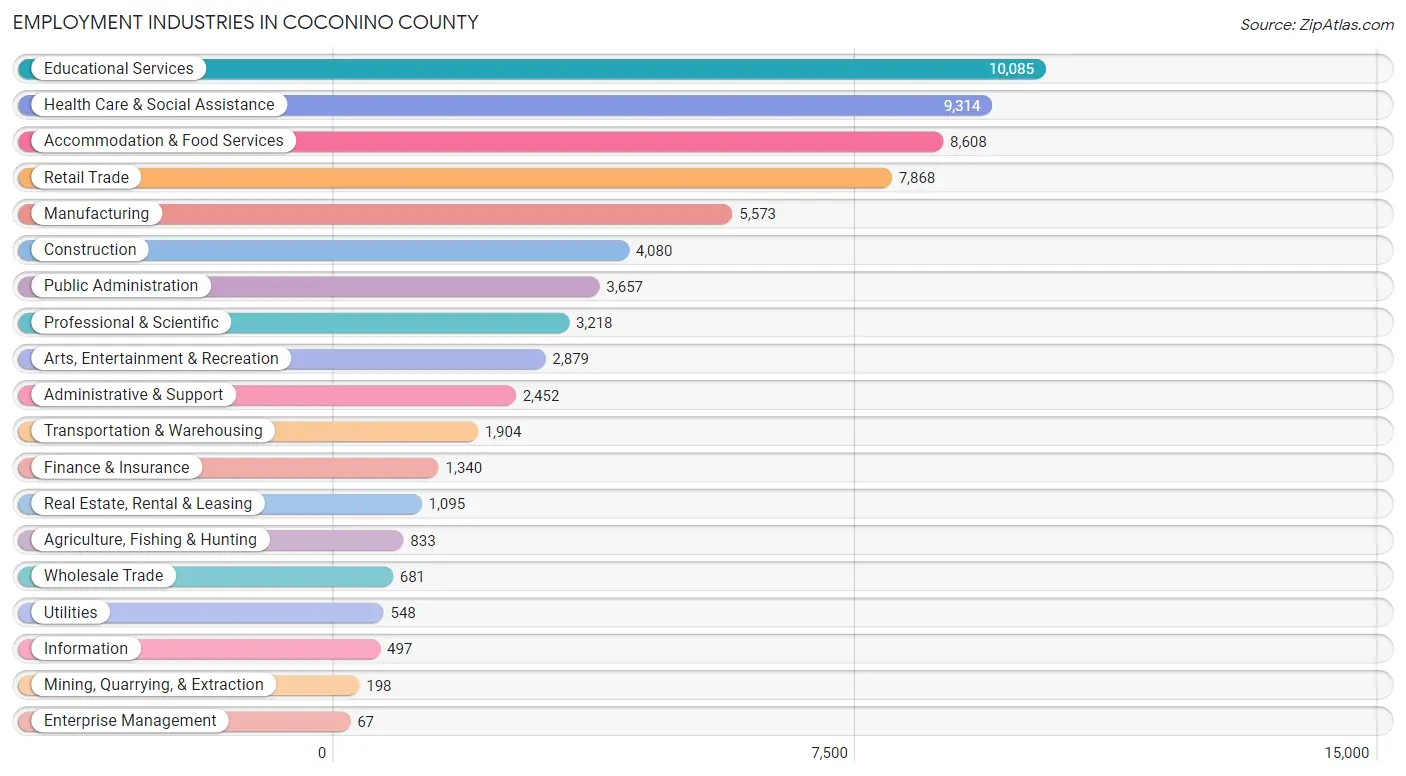
Employment Industries in Coconino County
The major employment industries in Coconino County include Educational Services (10,085 | 14.8%), Health Care & Social Assistance (9,314 | 13.7%), Accommodation & Food Services (8,608 | 12.7%), Retail Trade (7,868 | 11.6%), and Manufacturing (5,573 | 8.2%).
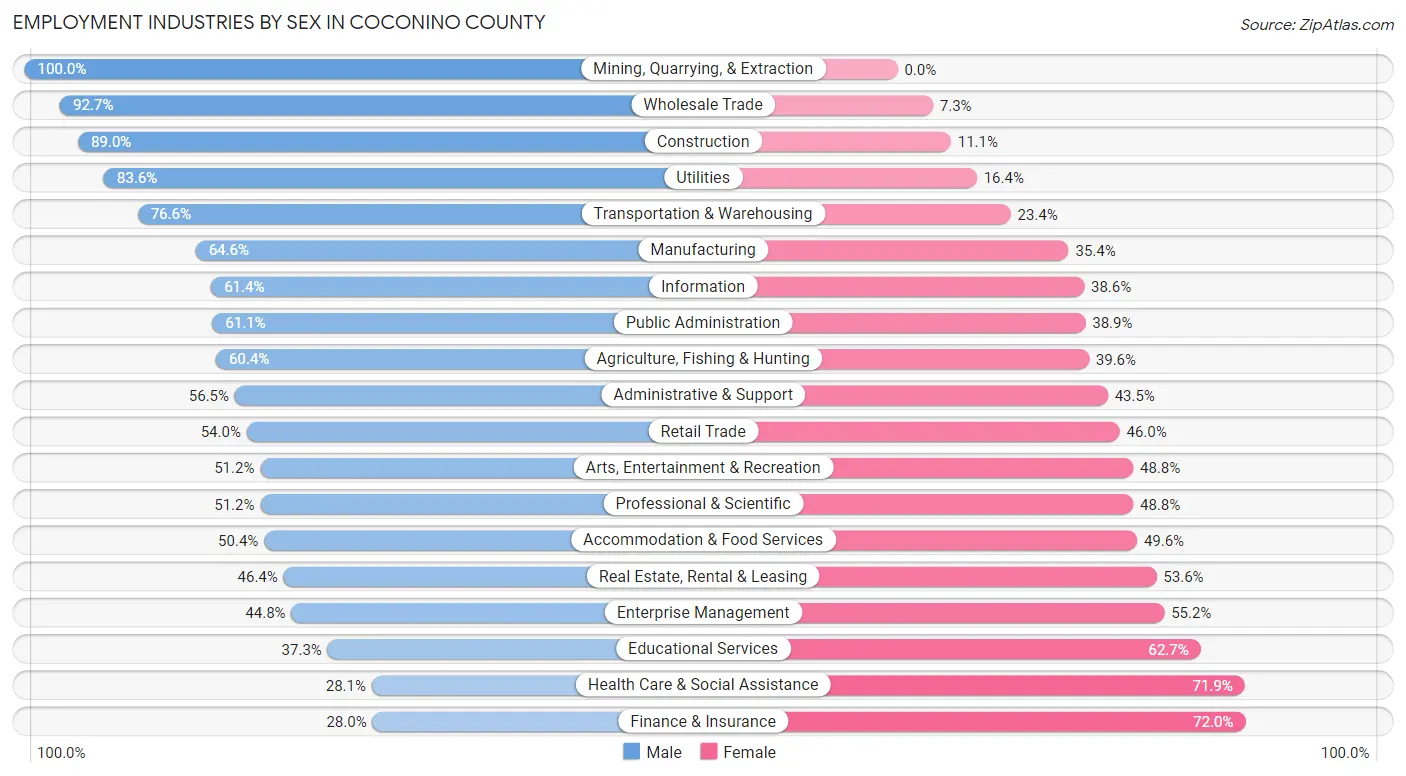
Employment Industries by Sex in Coconino County
The Coconino County industries that see more men than women are Mining, Quarrying, & Extraction (100.0%), Wholesale Trade (92.7%), and Construction (88.9%), whereas the industries that tend to have a higher number of women are Finance & Insurance (72.0%), Health Care & Social Assistance (71.9%), and Educational Services (62.7%).
| Industry | Male | Female |
| Agriculture, Fishing & Hunting | 503 (60.4%) | 330 (39.6%) |
| Mining, Quarrying, & Extraction | 198 (100.0%) | 0 (0.0%) |
| Construction | 3,629 (88.9%) | 451 (11.1%) |
| Manufacturing | 3,599 (64.6%) | 1,974 (35.4%) |
| Wholesale Trade | 631 (92.7%) | 50 (7.3%) |
| Retail Trade | 4,250 (54.0%) | 3,618 (46.0%) |
| Transportation & Warehousing | 1,458 (76.6%) | 446 (23.4%) |
| Utilities | 458 (83.6%) | 90 (16.4%) |
| Information | 305 (61.4%) | 192 (38.6%) |
| Finance & Insurance | 375 (28.0%) | 965 (72.0%) |
| Real Estate, Rental & Leasing | 508 (46.4%) | 587 (53.6%) |
| Professional & Scientific | 1,648 (51.2%) | 1,570 (48.8%) |
| Enterprise Management | 30 (44.8%) | 37 (55.2%) |
| Administrative & Support | 1,385 (56.5%) | 1,067 (43.5%) |
| Educational Services | 3,759 (37.3%) | 6,326 (62.7%) |
| Health Care & Social Assistance | 2,620 (28.1%) | 6,694 (71.9%) |
| Arts, Entertainment & Recreation | 1,475 (51.2%) | 1,404 (48.8%) |
| Accommodation & Food Services | 4,340 (50.4%) | 4,268 (49.6%) |
| Public Administration | 2,235 (61.1%) | 1,422 (38.9%) |
| Total | 34,891 (51.3%) | 33,064 (48.7%) |
Education in Coconino County
School Enrollment in Coconino County
The most common levels of schooling among the 47,748 students in Coconino County are college / undergraduate (21,433 | 44.9%), middle school (7,195 | 15.1%), and elementary school (6,182 | 13.0%).
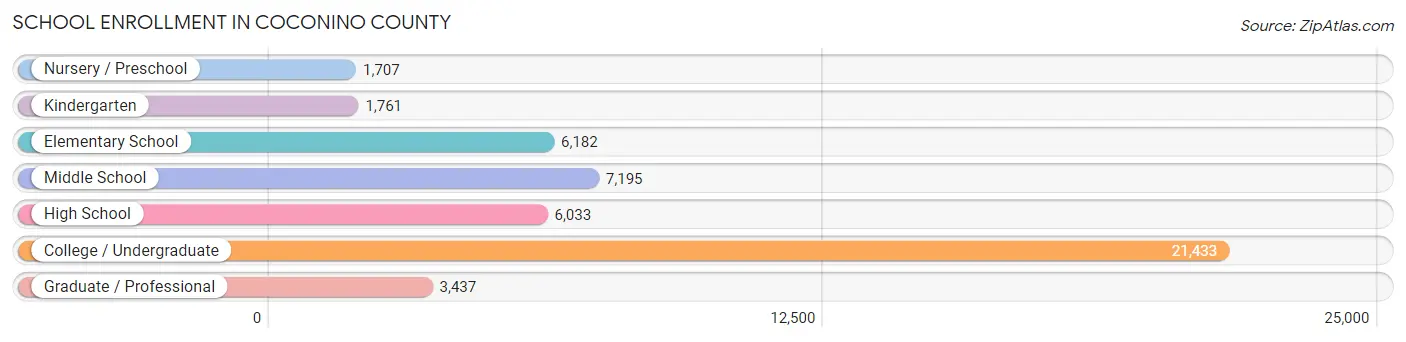
| School Level | # Students | % Students |
| Nursery / Preschool | 1,707 | 3.6% |
| Kindergarten | 1,761 | 3.7% |
| Elementary School | 6,182 | 13.0% |
| Middle School | 7,195 | 15.1% |
| High School | 6,033 | 12.6% |
| College / Undergraduate | 21,433 | 44.9% |
| Graduate / Professional | 3,437 | 7.2% |
| Total | 47,748 | 100.0% |
School Enrollment by Age by Funding Source in Coconino County
Out of a total of 47,748 students who are enrolled in schools in Coconino County, 4,727 (9.9%) attend a private institution, while the remaining 43,021 (90.1%) are enrolled in public schools. The age group of 35 years and over has the highest likelihood of being enrolled in private schools, with 682 (33.1% in the age bracket) enrolled. Conversely, the age group of 18 to 19 year olds has the lowest likelihood of being enrolled in a private school, with 8,876 (98.4% in the age bracket) attending a public institution.
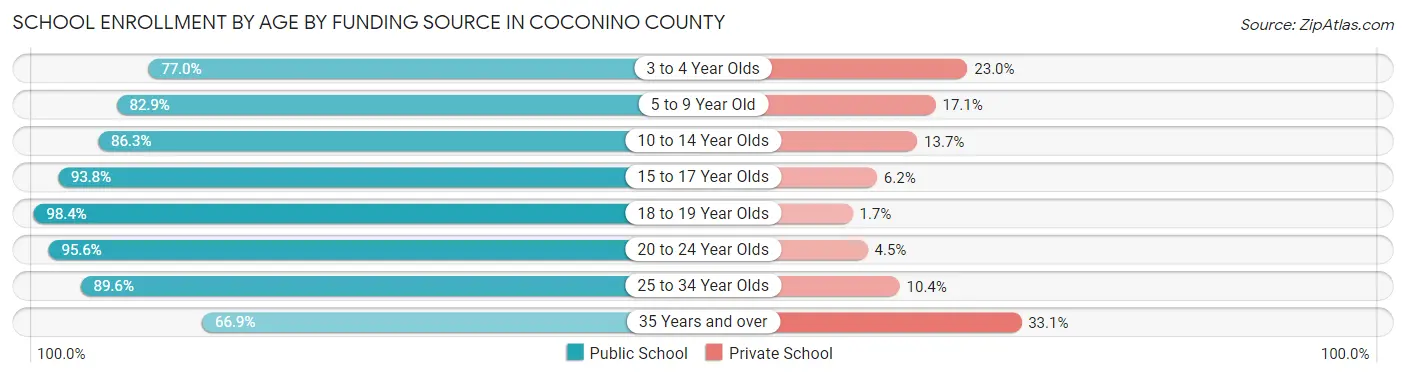
| Age Bracket | Public School | Private School |
| 3 to 4 Year Olds | 902 (77.0%) | 270 (23.0%) |
| 5 to 9 Year Old | 6,485 (82.9%) | 1,339 (17.1%) |
| 10 to 14 Year Olds | 7,143 (86.3%) | 1,133 (13.7%) |
| 15 to 17 Year Olds | 4,483 (93.8%) | 296 (6.2%) |
| 18 to 19 Year Olds | 8,876 (98.4%) | 149 (1.7%) |
| 20 to 24 Year Olds | 10,695 (95.6%) | 498 (4.4%) |
| 25 to 34 Year Olds | 3,061 (89.6%) | 356 (10.4%) |
| 35 Years and over | 1,380 (66.9%) | 682 (33.1%) |
| Total | 43,021 (90.1%) | 4,727 (9.9%) |
Educational Attainment by Field of Study in Coconino County
Education (4,920 | 13.0%), business (4,416 | 11.7%), science & technology (4,190 | 11.1%), social sciences (3,731 | 9.9%), and bio, nature & agricultural (3,502 | 9.3%) are the most common fields of study among 37,787 individuals in Coconino County who have obtained a bachelor's degree or higher.
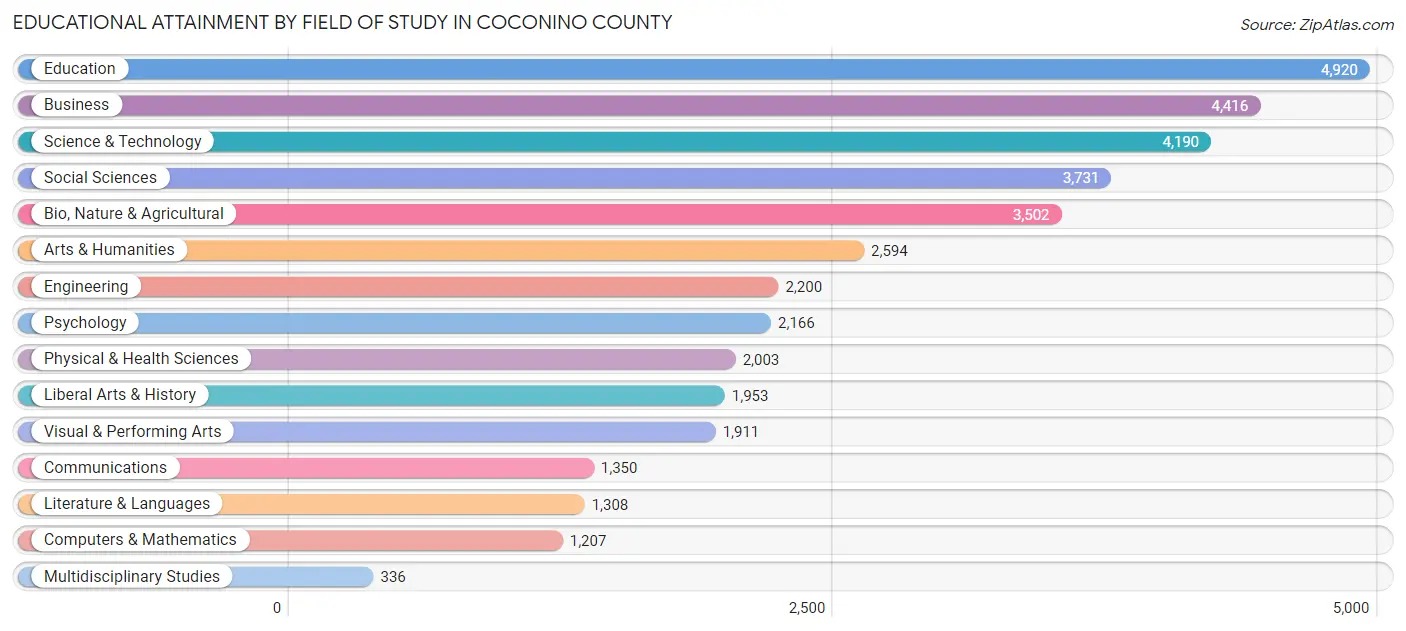
| Field of Study | # Graduates | % Graduates |
| Computers & Mathematics | 1,207 | 3.2% |
| Bio, Nature & Agricultural | 3,502 | 9.3% |
| Physical & Health Sciences | 2,003 | 5.3% |
| Psychology | 2,166 | 5.7% |
| Social Sciences | 3,731 | 9.9% |
| Engineering | 2,200 | 5.8% |
| Multidisciplinary Studies | 336 | 0.9% |
| Science & Technology | 4,190 | 11.1% |
| Business | 4,416 | 11.7% |
| Education | 4,920 | 13.0% |
| Literature & Languages | 1,308 | 3.5% |
| Liberal Arts & History | 1,953 | 5.2% |
| Visual & Performing Arts | 1,911 | 5.1% |
| Communications | 1,350 | 3.6% |
| Arts & Humanities | 2,594 | 6.9% |
| Total | 37,787 | 100.0% |
Transportation & Commute in Coconino County
Vehicle Availability by Sex in Coconino County
The most prevalent vehicle ownership categories in Coconino County are males with 2 vehicles (11,866, accounting for 36.8%) and females with 2 vehicles (11,610, making up 40.0%).
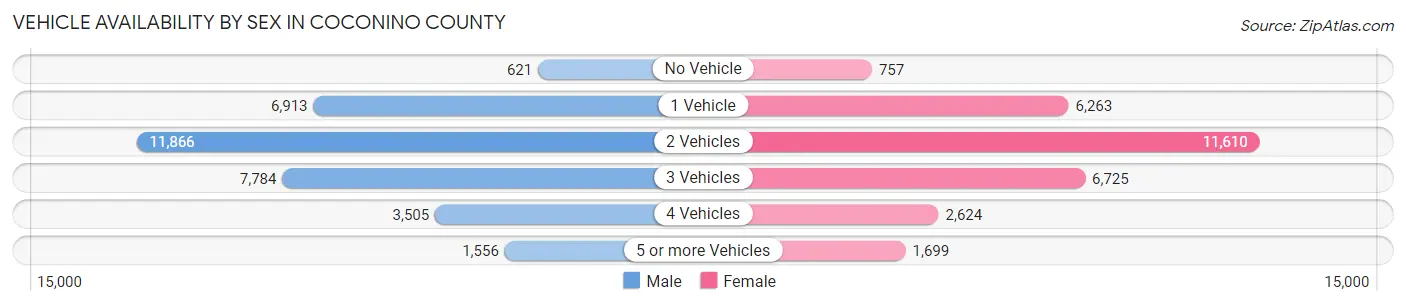
| Vehicles Available | Male | Female |
| No Vehicle | 621 (1.9%) | 757 (2.5%) |
| 1 Vehicle | 6,913 (21.4%) | 6,263 (21.1%) |
| 2 Vehicles | 11,866 (36.8%) | 11,610 (39.1%) |
| 3 Vehicles | 7,784 (24.1%) | 6,725 (22.7%) |
| 4 Vehicles | 3,505 (10.9%) | 2,624 (8.8%) |
| 5 or more Vehicles | 1,556 (4.8%) | 1,699 (5.7%) |
| Total | 32,245 (100.0%) | 29,678 (100.0%) |
Commute Time in Coconino County
The most frequently occuring commute durations in Coconino County are 10 to 14 minutes (13,597 commuters, 22.6%), 15 to 19 minutes (11,665 commuters, 19.4%), and 5 to 9 minutes (11,023 commuters, 18.3%).
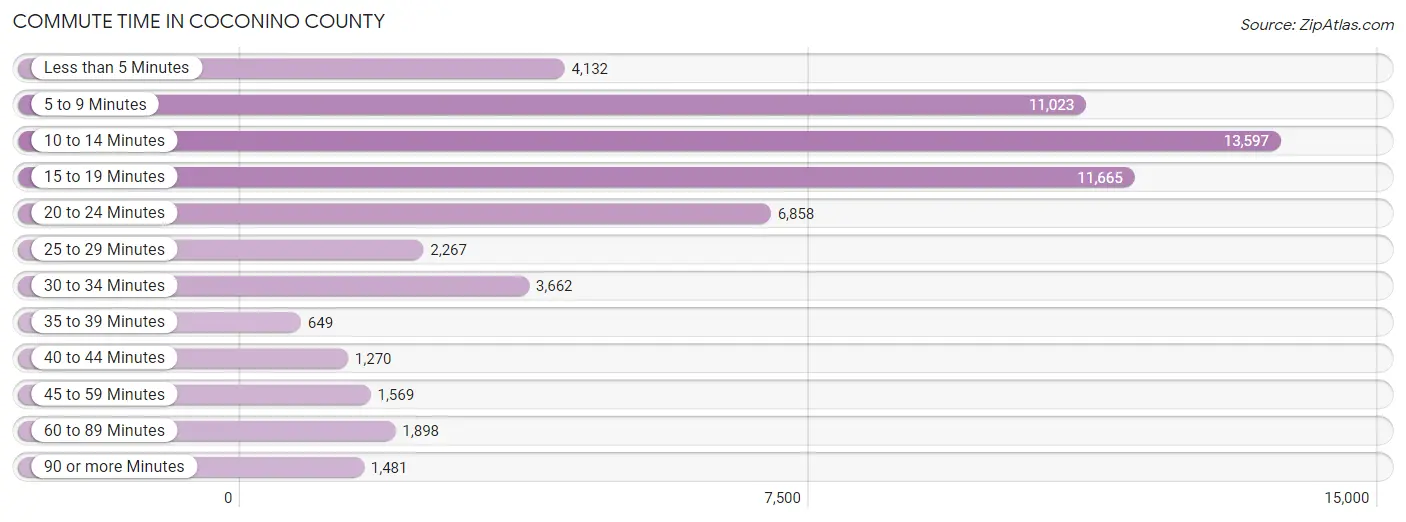
| Commute Time | # Commuters | % Commuters |
| Less than 5 Minutes | 4,132 | 6.9% |
| 5 to 9 Minutes | 11,023 | 18.3% |
| 10 to 14 Minutes | 13,597 | 22.6% |
| 15 to 19 Minutes | 11,665 | 19.4% |
| 20 to 24 Minutes | 6,858 | 11.4% |
| 25 to 29 Minutes | 2,267 | 3.8% |
| 30 to 34 Minutes | 3,662 | 6.1% |
| 35 to 39 Minutes | 649 | 1.1% |
| 40 to 44 Minutes | 1,270 | 2.1% |
| 45 to 59 Minutes | 1,569 | 2.6% |
| 60 to 89 Minutes | 1,898 | 3.2% |
| 90 or more Minutes | 1,481 | 2.5% |
Commute Time by Sex in Coconino County
The most common commute times in Coconino County are 10 to 14 minutes (7,291 commuters, 23.2%) for males and 10 to 14 minutes (6,306 commuters, 22.0%) for females.
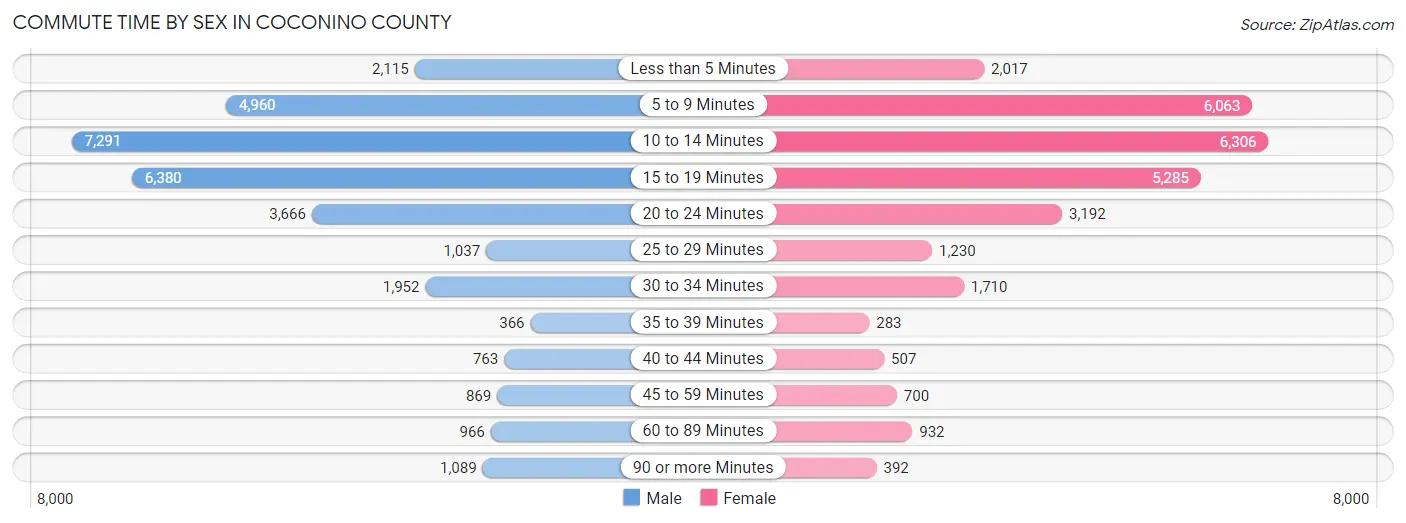
| Commute Time | Male | Female |
| Less than 5 Minutes | 2,115 (6.7%) | 2,017 (7.0%) |
| 5 to 9 Minutes | 4,960 (15.8%) | 6,063 (21.2%) |
| 10 to 14 Minutes | 7,291 (23.2%) | 6,306 (22.0%) |
| 15 to 19 Minutes | 6,380 (20.3%) | 5,285 (18.5%) |
| 20 to 24 Minutes | 3,666 (11.7%) | 3,192 (11.2%) |
| 25 to 29 Minutes | 1,037 (3.3%) | 1,230 (4.3%) |
| 30 to 34 Minutes | 1,952 (6.2%) | 1,710 (6.0%) |
| 35 to 39 Minutes | 366 (1.2%) | 283 (1.0%) |
| 40 to 44 Minutes | 763 (2.4%) | 507 (1.8%) |
| 45 to 59 Minutes | 869 (2.8%) | 700 (2.5%) |
| 60 to 89 Minutes | 966 (3.1%) | 932 (3.3%) |
| 90 or more Minutes | 1,089 (3.5%) | 392 (1.4%) |
Time of Departure to Work by Sex in Coconino County
The most frequent times of departure to work in Coconino County are 7:30 AM to 7:59 AM (4,216, 13.4%) for males and 7:30 AM to 7:59 AM (5,601, 19.6%) for females.
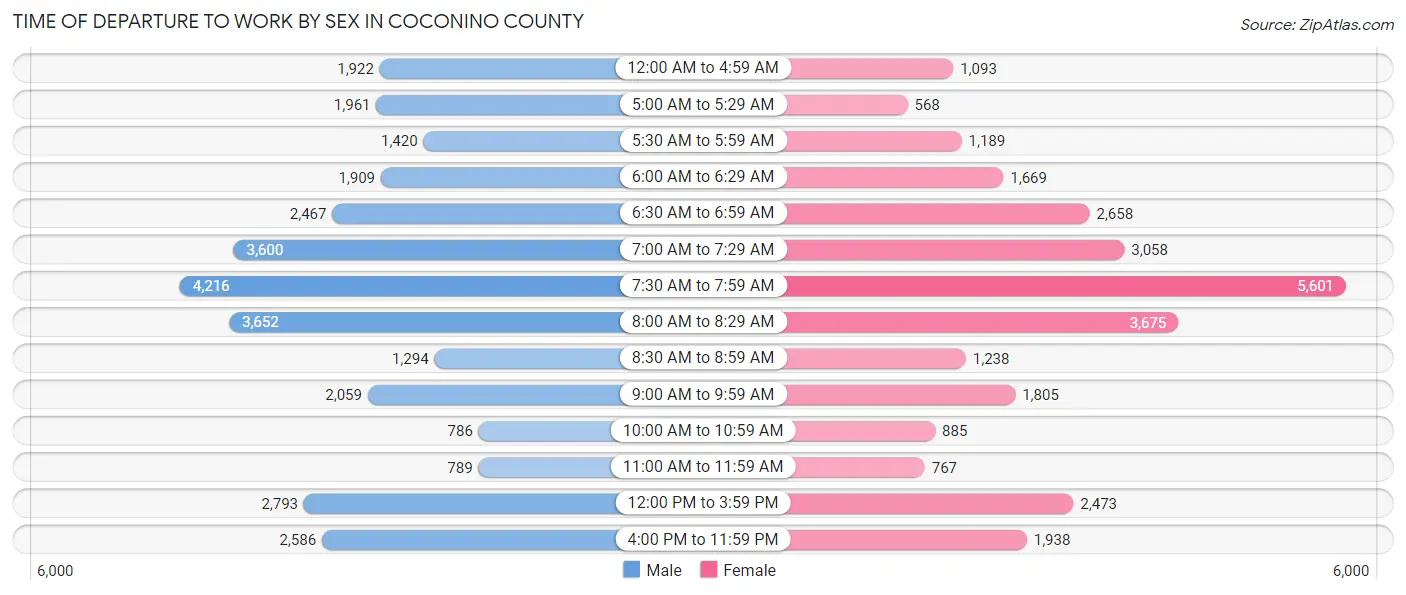
| Time of Departure | Male | Female |
| 12:00 AM to 4:59 AM | 1,922 (6.1%) | 1,093 (3.8%) |
| 5:00 AM to 5:29 AM | 1,961 (6.2%) | 568 (2.0%) |
| 5:30 AM to 5:59 AM | 1,420 (4.5%) | 1,189 (4.2%) |
| 6:00 AM to 6:29 AM | 1,909 (6.1%) | 1,669 (5.8%) |
| 6:30 AM to 6:59 AM | 2,467 (7.8%) | 2,658 (9.3%) |
| 7:00 AM to 7:29 AM | 3,600 (11.5%) | 3,058 (10.7%) |
| 7:30 AM to 7:59 AM | 4,216 (13.4%) | 5,601 (19.6%) |
| 8:00 AM to 8:29 AM | 3,652 (11.6%) | 3,675 (12.8%) |
| 8:30 AM to 8:59 AM | 1,294 (4.1%) | 1,238 (4.3%) |
| 9:00 AM to 9:59 AM | 2,059 (6.6%) | 1,805 (6.3%) |
| 10:00 AM to 10:59 AM | 786 (2.5%) | 885 (3.1%) |
| 11:00 AM to 11:59 AM | 789 (2.5%) | 767 (2.7%) |
| 12:00 PM to 3:59 PM | 2,793 (8.9%) | 2,473 (8.6%) |
| 4:00 PM to 11:59 PM | 2,586 (8.2%) | 1,938 (6.8%) |
| Total | 31,454 (100.0%) | 28,617 (100.0%) |
Housing Occupancy in Coconino County
Occupancy by Ownership in Coconino County
Of the total 51,993 dwellings in Coconino County, owner-occupied units account for 30,705 (59.1%), while renter-occupied units make up 21,288 (40.9%).
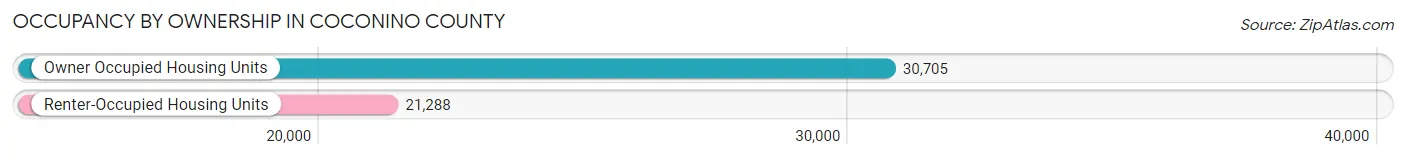
| Occupancy | # Housing Units | % Housing Units |
| Owner Occupied Housing Units | 30,705 | 59.1% |
| Renter-Occupied Housing Units | 21,288 | 40.9% |
| Total Occupied Housing Units | 51,993 | 100.0% |
Occupancy by Household Size in Coconino County
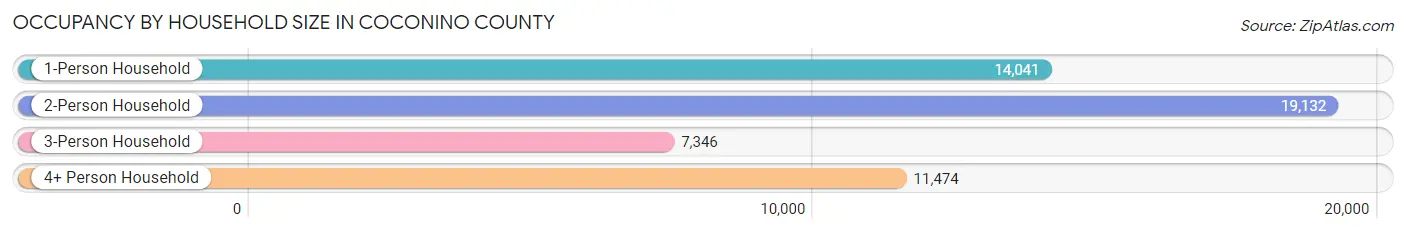
| Household Size | # Housing Units | % Housing Units |
| 1-Person Household | 14,041 | 27.0% |
| 2-Person Household | 19,132 | 36.8% |
| 3-Person Household | 7,346 | 14.1% |
| 4+ Person Household | 11,474 | 22.1% |
| Total Housing Units | 51,993 | 100.0% |
Occupancy by Ownership by Household Size in Coconino County
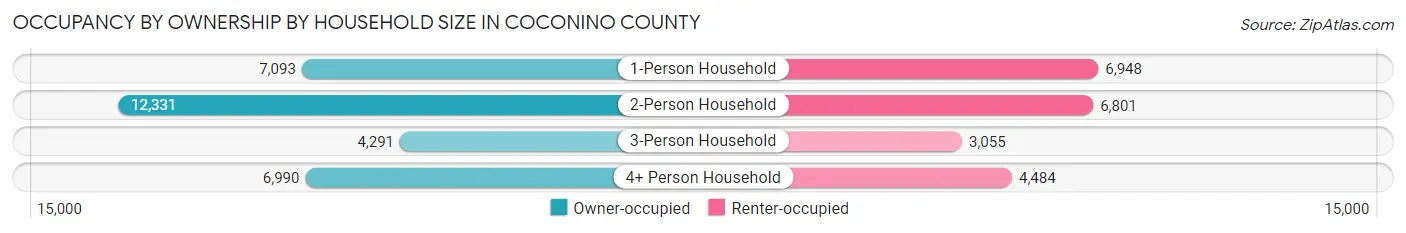
| Household Size | Owner-occupied | Renter-occupied |
| 1-Person Household | 7,093 (50.5%) | 6,948 (49.5%) |
| 2-Person Household | 12,331 (64.4%) | 6,801 (35.5%) |
| 3-Person Household | 4,291 (58.4%) | 3,055 (41.6%) |
| 4+ Person Household | 6,990 (60.9%) | 4,484 (39.1%) |
| Total Housing Units | 30,705 (59.1%) | 21,288 (40.9%) |
Occupancy by Educational Attainment in Coconino County
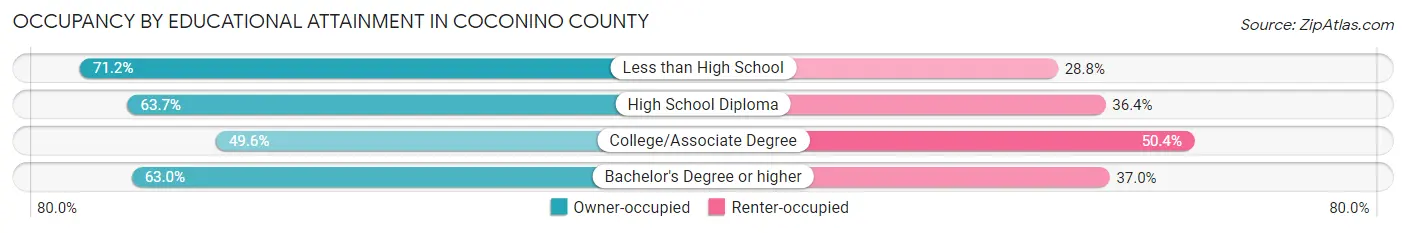
| Household Size | Owner-occupied | Renter-occupied |
| Less than High School | 2,633 (71.2%) | 1,065 (28.8%) |
| High School Diploma | 5,334 (63.6%) | 3,046 (36.3%) |
| College/Associate Degree | 8,952 (49.6%) | 9,081 (50.4%) |
| Bachelor's Degree or higher | 13,786 (63.0%) | 8,096 (37.0%) |
Occupancy by Age of Householder in Coconino County
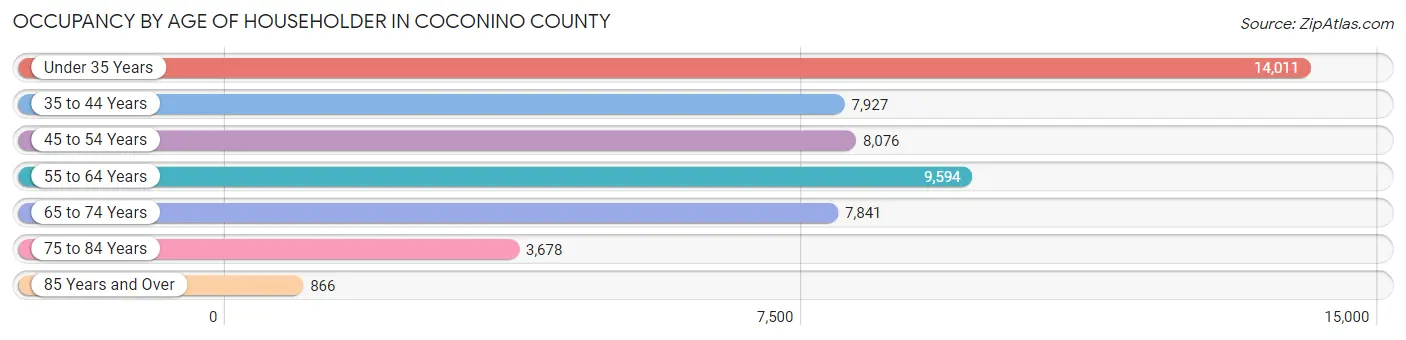
| Age Bracket | # Households | % Households |
| Under 35 Years | 14,011 | 27.0% |
| 35 to 44 Years | 7,927 | 15.2% |
| 45 to 54 Years | 8,076 | 15.5% |
| 55 to 64 Years | 9,594 | 18.4% |
| 65 to 74 Years | 7,841 | 15.1% |
| 75 to 84 Years | 3,678 | 7.1% |
| 85 Years and Over | 866 | 1.7% |
| Total | 51,993 | 100.0% |
Housing Finances in Coconino County
Median Income by Occupancy in Coconino County
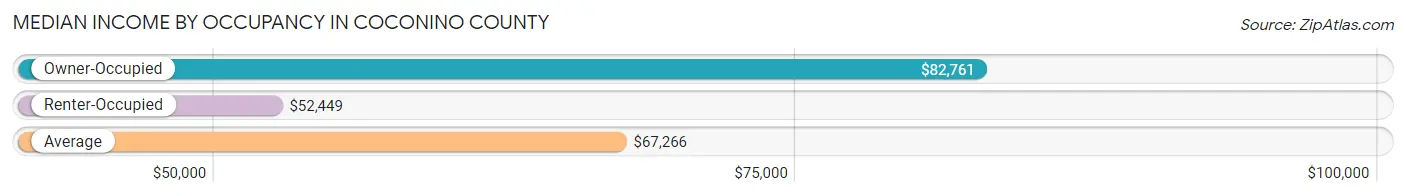
| Occupancy Type | # Households | Median Income |
| Owner-Occupied | 30,705 (59.1%) | $82,761 |
| Renter-Occupied | 21,288 (40.9%) | $52,449 |
| Average | 51,993 (100.0%) | $67,266 |
Occupancy by Householder Income Bracket in Coconino County
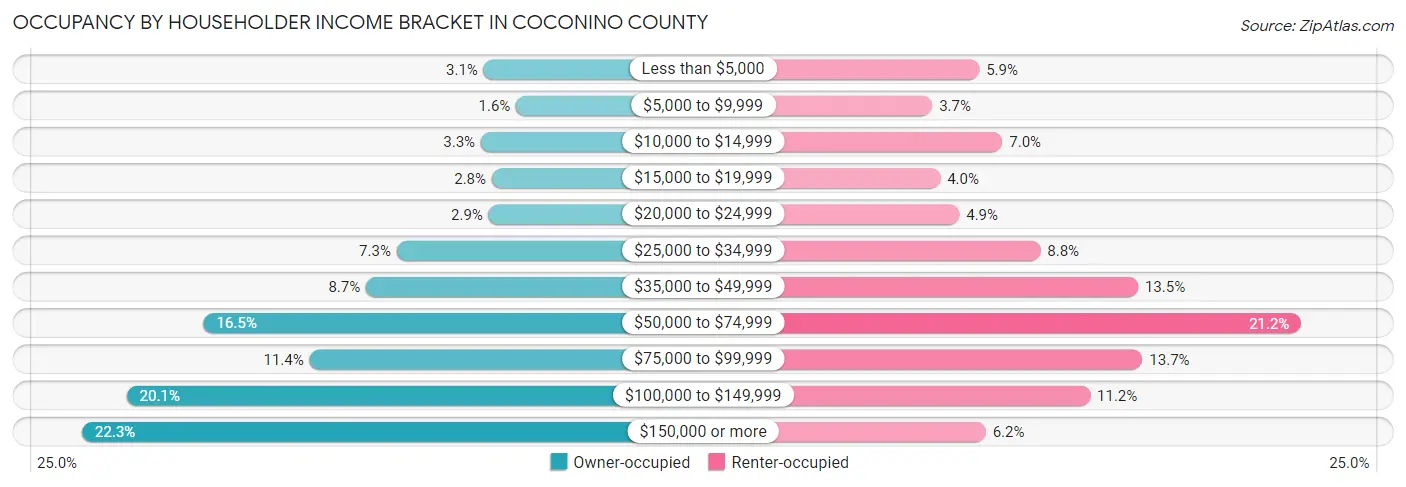
| Income Bracket | Owner-occupied | Renter-occupied |
| Less than $5,000 | 965 (3.1%) | 1,253 (5.9%) |
| $5,000 to $9,999 | 488 (1.6%) | 778 (3.6%) |
| $10,000 to $14,999 | 1,004 (3.3%) | 1,487 (7.0%) |
| $15,000 to $19,999 | 843 (2.8%) | 858 (4.0%) |
| $20,000 to $24,999 | 891 (2.9%) | 1,051 (4.9%) |
| $25,000 to $34,999 | 2,234 (7.3%) | 1,874 (8.8%) |
| $35,000 to $49,999 | 2,685 (8.7%) | 2,863 (13.5%) |
| $50,000 to $74,999 | 5,061 (16.5%) | 4,518 (21.2%) |
| $75,000 to $99,999 | 3,510 (11.4%) | 2,909 (13.7%) |
| $100,000 to $149,999 | 6,185 (20.1%) | 2,378 (11.2%) |
| $150,000 or more | 6,839 (22.3%) | 1,319 (6.2%) |
| Total | 30,705 (100.0%) | 21,288 (100.0%) |
Monthly Housing Cost Tiers in Coconino County
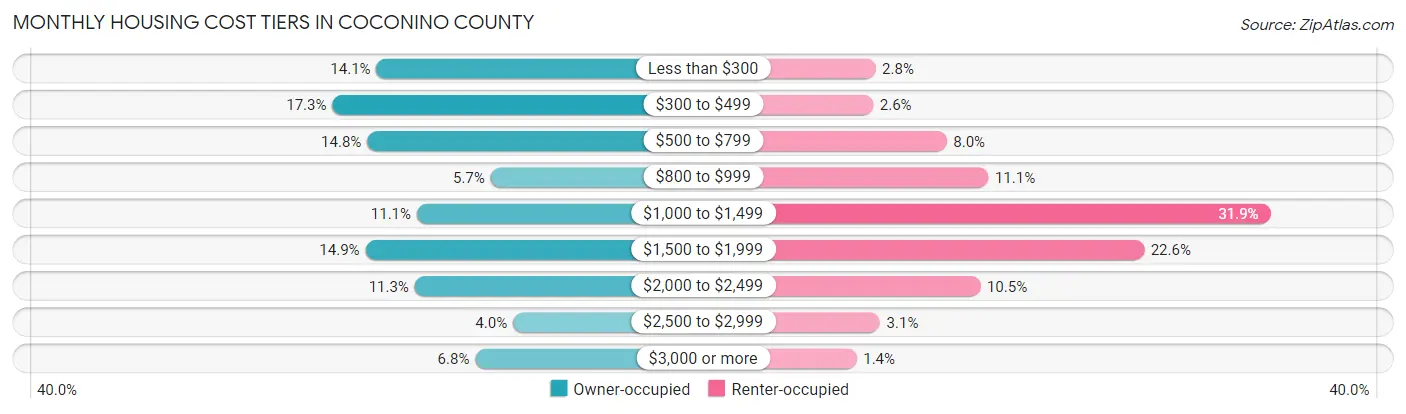
| Monthly Cost | Owner-occupied | Renter-occupied |
| Less than $300 | 4,327 (14.1%) | 592 (2.8%) |
| $300 to $499 | 5,324 (17.3%) | 556 (2.6%) |
| $500 to $799 | 4,536 (14.8%) | 1,708 (8.0%) |
| $800 to $999 | 1,745 (5.7%) | 2,360 (11.1%) |
| $1,000 to $1,499 | 3,411 (11.1%) | 6,789 (31.9%) |
| $1,500 to $1,999 | 4,574 (14.9%) | 4,803 (22.6%) |
| $2,000 to $2,499 | 3,461 (11.3%) | 2,235 (10.5%) |
| $2,500 to $2,999 | 1,237 (4.0%) | 662 (3.1%) |
| $3,000 or more | 2,090 (6.8%) | 296 (1.4%) |
| Total | 30,705 (100.0%) | 21,288 (100.0%) |
Physical Housing Characteristics in Coconino County
Housing Structures in Coconino County
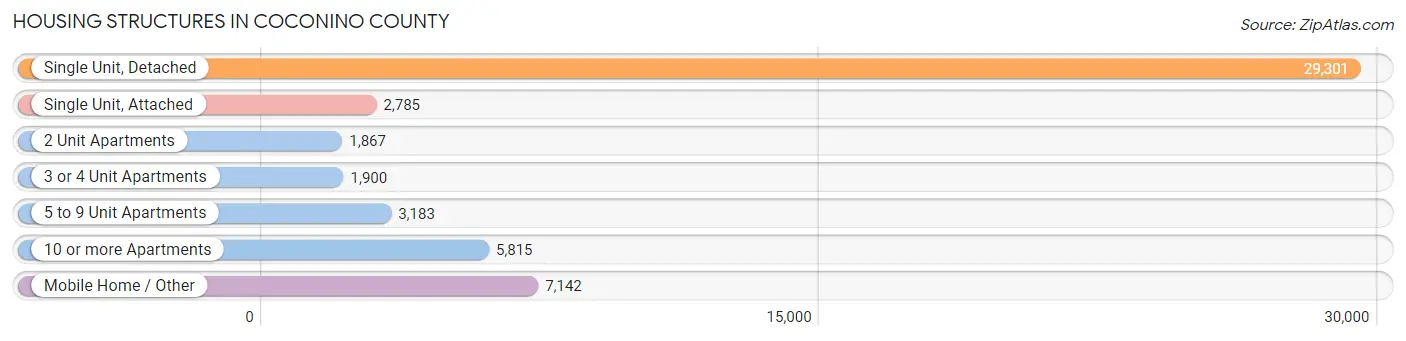
| Structure Type | # Housing Units | % Housing Units |
| Single Unit, Detached | 29,301 | 56.4% |
| Single Unit, Attached | 2,785 | 5.4% |
| 2 Unit Apartments | 1,867 | 3.6% |
| 3 or 4 Unit Apartments | 1,900 | 3.6% |
| 5 to 9 Unit Apartments | 3,183 | 6.1% |
| 10 or more Apartments | 5,815 | 11.2% |
| Mobile Home / Other | 7,142 | 13.7% |
| Total | 51,993 | 100.0% |
Housing Structures by Occupancy in Coconino County
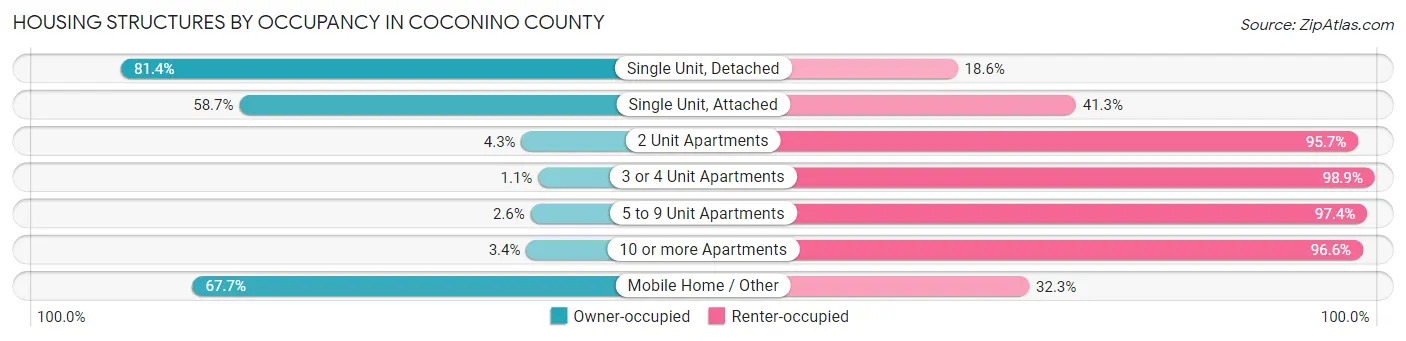
| Structure Type | Owner-occupied | Renter-occupied |
| Single Unit, Detached | 23,857 (81.4%) | 5,444 (18.6%) |
| Single Unit, Attached | 1,634 (58.7%) | 1,151 (41.3%) |
| 2 Unit Apartments | 81 (4.3%) | 1,786 (95.7%) |
| 3 or 4 Unit Apartments | 21 (1.1%) | 1,879 (98.9%) |
| 5 to 9 Unit Apartments | 82 (2.6%) | 3,101 (97.4%) |
| 10 or more Apartments | 198 (3.4%) | 5,617 (96.6%) |
| Mobile Home / Other | 4,832 (67.7%) | 2,310 (32.3%) |
| Total | 30,705 (59.1%) | 21,288 (40.9%) |
Housing Structures by Number of Rooms in Coconino County
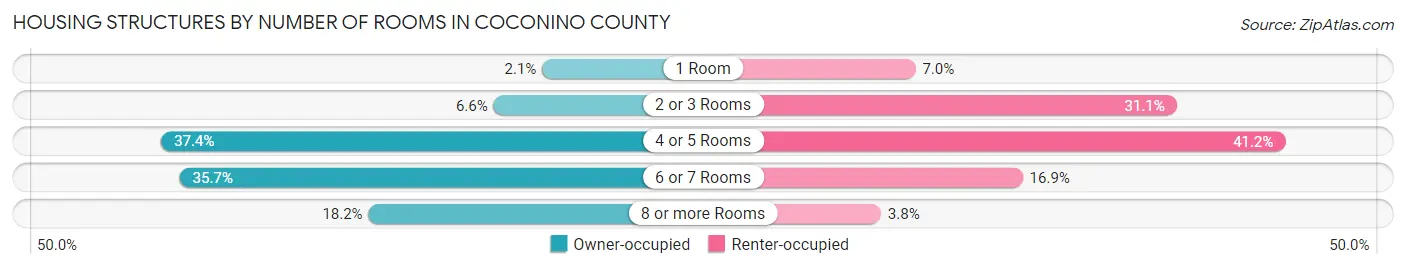
| Number of Rooms | Owner-occupied | Renter-occupied |
| 1 Room | 655 (2.1%) | 1,489 (7.0%) |
| 2 or 3 Rooms | 2,036 (6.6%) | 6,629 (31.1%) |
| 4 or 5 Rooms | 11,476 (37.4%) | 8,766 (41.2%) |
| 6 or 7 Rooms | 10,950 (35.7%) | 3,597 (16.9%) |
| 8 or more Rooms | 5,588 (18.2%) | 807 (3.8%) |
| Total | 30,705 (100.0%) | 21,288 (100.0%) |
Housing Structure by Heating Type in Coconino County
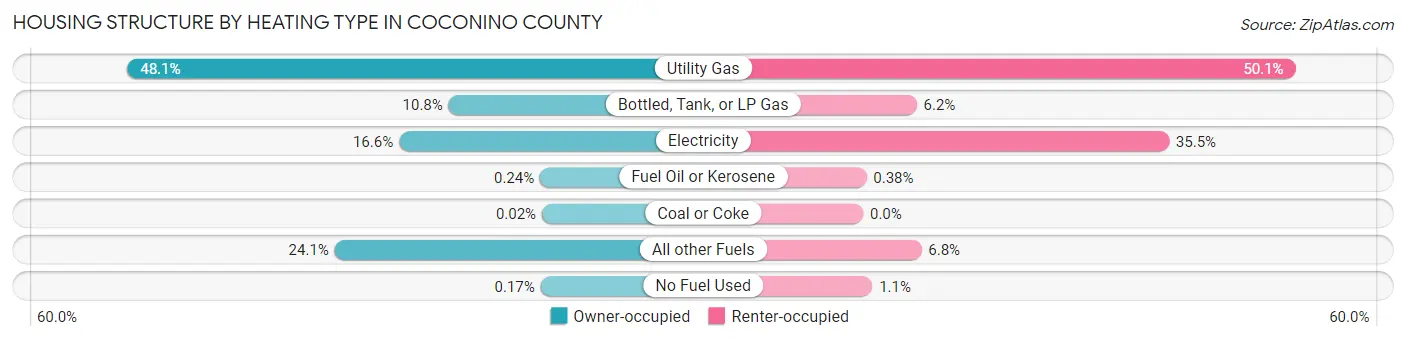
| Heating Type | Owner-occupied | Renter-occupied |
| Utility Gas | 14,766 (48.1%) | 10,671 (50.1%) |
| Bottled, Tank, or LP Gas | 3,328 (10.8%) | 1,323 (6.2%) |
| Electricity | 5,095 (16.6%) | 7,549 (35.5%) |
| Fuel Oil or Kerosene | 74 (0.2%) | 80 (0.4%) |
| Coal or Coke | 5 (0.0%) | 0 (0.0%) |
| All other Fuels | 7,384 (24.0%) | 1,440 (6.8%) |
| No Fuel Used | 53 (0.2%) | 225 (1.1%) |
| Total | 30,705 (100.0%) | 21,288 (100.0%) |
Household Vehicle Usage in Coconino County
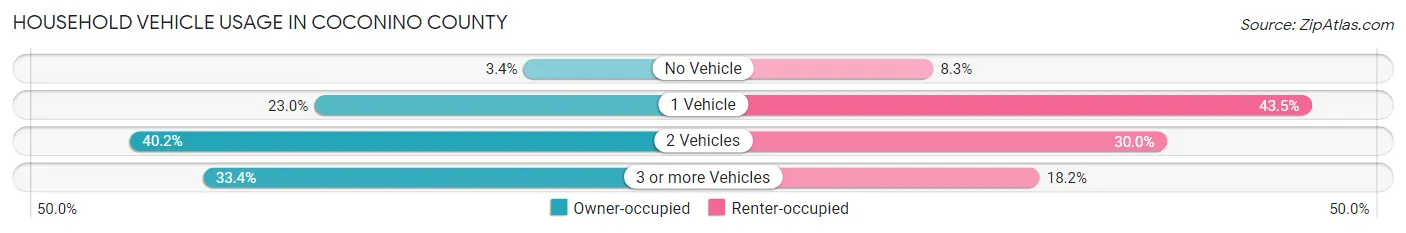
| Vehicles per Household | Owner-occupied | Renter-occupied |
| No Vehicle | 1,056 (3.4%) | 1,761 (8.3%) |
| 1 Vehicle | 7,056 (23.0%) | 9,267 (43.5%) |
| 2 Vehicles | 12,350 (40.2%) | 6,387 (30.0%) |
| 3 or more Vehicles | 10,243 (33.4%) | 3,873 (18.2%) |
| Total | 30,705 (100.0%) | 21,288 (100.0%) |
Real Estate & Mortgages in Coconino County
Real Estate and Mortgage Overview in Coconino County
| Characteristic | Without Mortgage | With Mortgage |
| Housing Units | 15,097 | 15,608 |
| Median Property Value | $255,200 | $448,800 |
| Median Household Income | $61,488 | $4,835 |
| Monthly Housing Costs | $421 | $2,072 |
| Real Estate Taxes | $1,778 | $625 |
Property Value by Mortgage Status in Coconino County
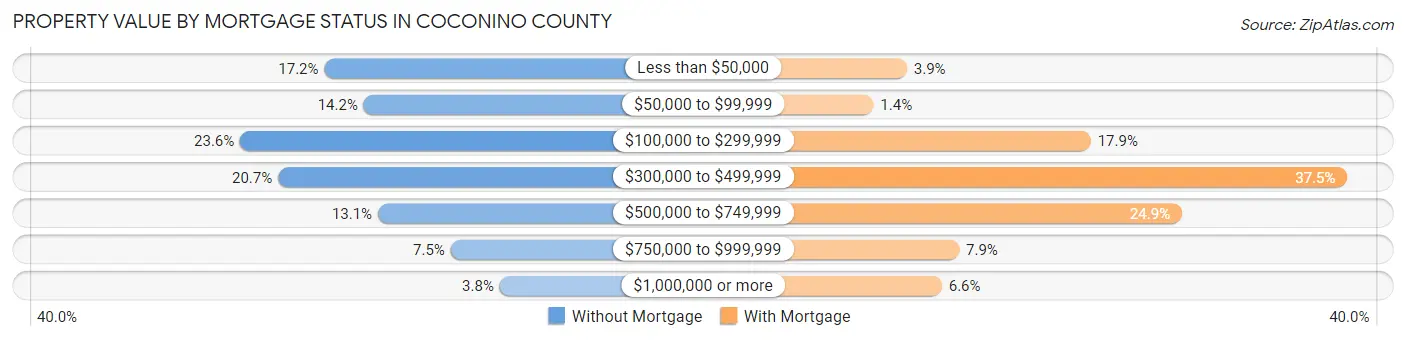
| Property Value | Without Mortgage | With Mortgage |
| Less than $50,000 | 2,590 (17.2%) | 611 (3.9%) |
| $50,000 to $99,999 | 2,137 (14.2%) | 212 (1.4%) |
| $100,000 to $299,999 | 3,560 (23.6%) | 2,797 (17.9%) |
| $300,000 to $499,999 | 3,123 (20.7%) | 5,849 (37.5%) |
| $500,000 to $749,999 | 1,975 (13.1%) | 3,881 (24.9%) |
| $750,000 to $999,999 | 1,139 (7.5%) | 1,232 (7.9%) |
| $1,000,000 or more | 573 (3.8%) | 1,026 (6.6%) |
| Total | 15,097 (100.0%) | 15,608 (100.0%) |
Household Income by Mortgage Status in Coconino County
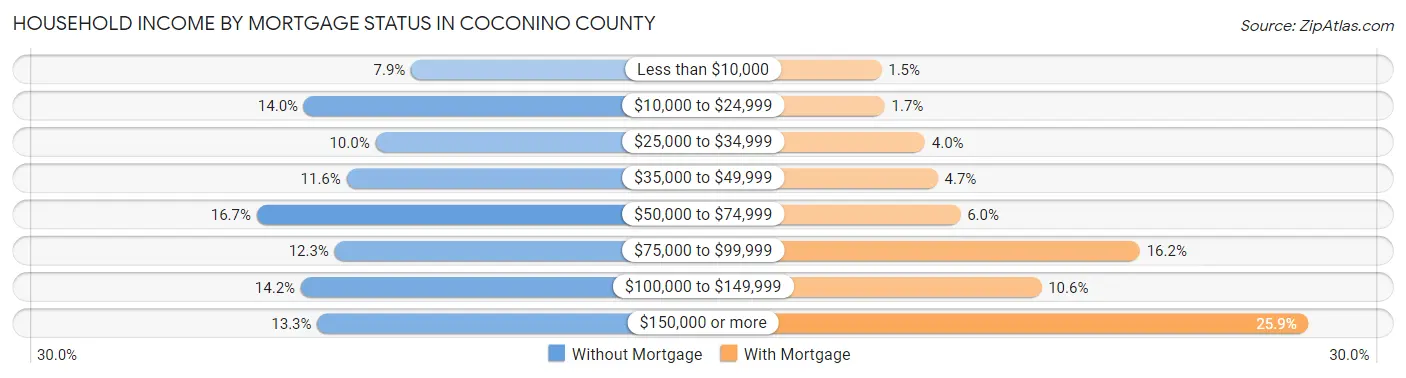
| Household Income | Without Mortgage | With Mortgage |
| Less than $10,000 | 1,194 (7.9%) | 230 (1.5%) |
| $10,000 to $24,999 | 2,120 (14.0%) | 259 (1.7%) |
| $25,000 to $34,999 | 1,502 (10.0%) | 618 (4.0%) |
| $35,000 to $49,999 | 1,751 (11.6%) | 732 (4.7%) |
| $50,000 to $74,999 | 2,526 (16.7%) | 934 (6.0%) |
| $75,000 to $99,999 | 1,854 (12.3%) | 2,535 (16.2%) |
| $100,000 to $149,999 | 2,146 (14.2%) | 1,656 (10.6%) |
| $150,000 or more | 2,004 (13.3%) | 4,039 (25.9%) |
| Total | 15,097 (100.0%) | 15,608 (100.0%) |
Property Value to Household Income Ratio in Coconino County
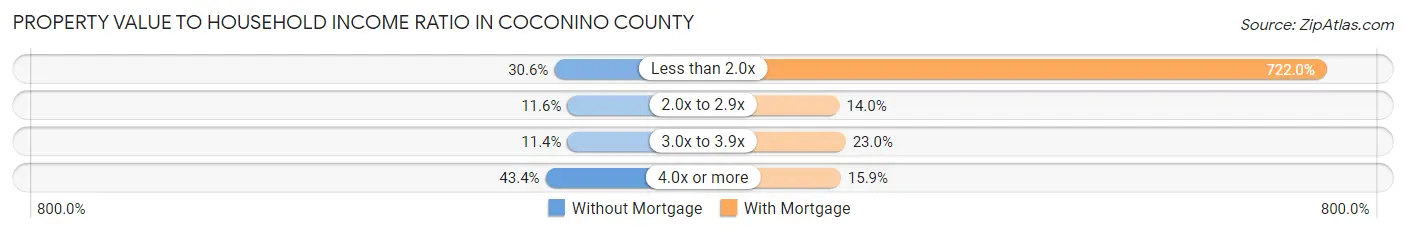
| Value-to-Income Ratio | Without Mortgage | With Mortgage |
| Less than 2.0x | 4,613 (30.6%) | 112,688 (722.0%) |
| 2.0x to 2.9x | 1,749 (11.6%) | 2,180 (14.0%) |
| 3.0x to 3.9x | 1,727 (11.4%) | 3,584 (23.0%) |
| 4.0x or more | 6,544 (43.3%) | 2,480 (15.9%) |
| Total | 15,097 (100.0%) | 15,608 (100.0%) |
Real Estate Taxes by Mortgage Status in Coconino County
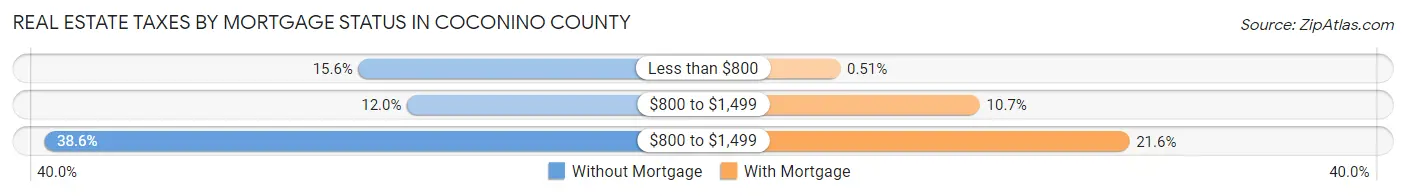
| Property Taxes | Without Mortgage | With Mortgage |
| Less than $800 | 2,354 (15.6%) | 79 (0.5%) |
| $800 to $1,499 | 1,818 (12.0%) | 1,672 (10.7%) |
| $800 to $1,499 | 5,823 (38.6%) | 3,377 (21.6%) |
| Total | 15,097 (100.0%) | 15,608 (100.0%) |
Health & Disability in Coconino County
Health Insurance Coverage by Age in Coconino County
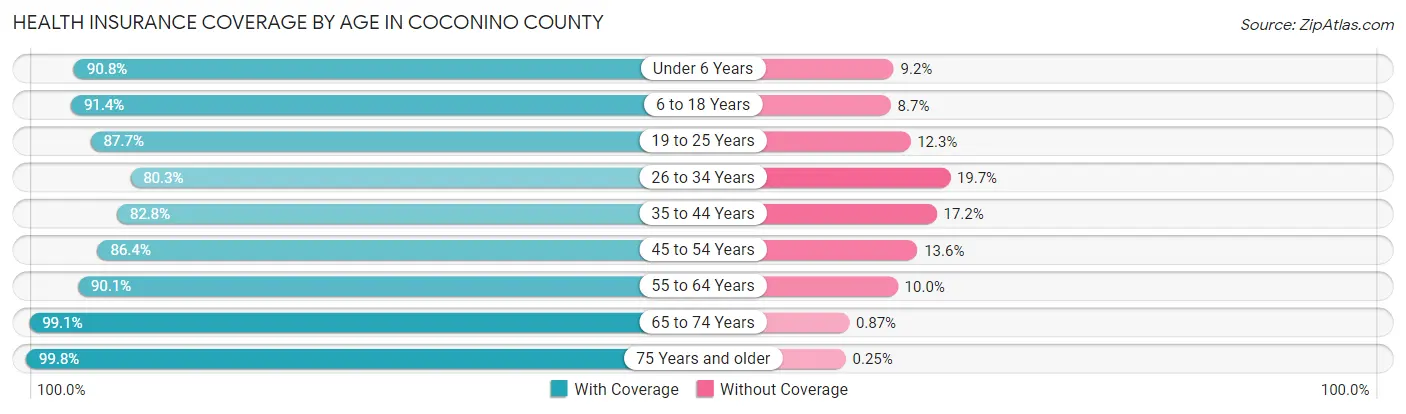
| Age Bracket | With Coverage | Without Coverage |
| Under 6 Years | 7,996 (90.8%) | 810 (9.2%) |
| 6 to 18 Years | 22,741 (91.3%) | 2,154 (8.6%) |
| 19 to 25 Years | 23,364 (87.7%) | 3,273 (12.3%) |
| 26 to 34 Years | 14,111 (80.3%) | 3,461 (19.7%) |
| 35 to 44 Years | 13,317 (82.8%) | 2,766 (17.2%) |
| 45 to 54 Years | 12,584 (86.4%) | 1,980 (13.6%) |
| 55 to 64 Years | 14,555 (90.0%) | 1,609 (10.0%) |
| 65 to 74 Years | 12,515 (99.1%) | 110 (0.9%) |
| 75 Years and older | 6,654 (99.8%) | 17 (0.3%) |
| Total | 127,837 (88.8%) | 16,180 (11.2%) |
Health Insurance Coverage by Citizenship Status in Coconino County
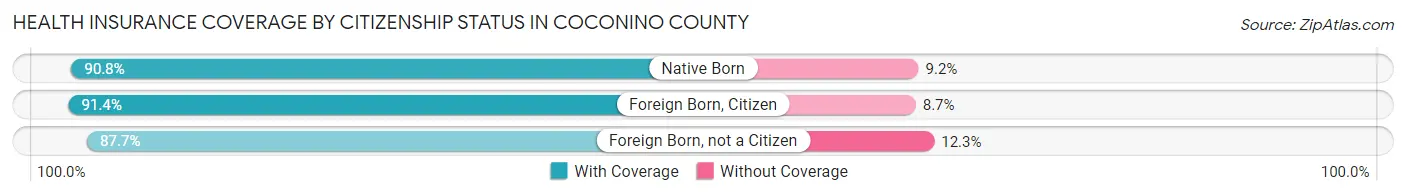
| Citizenship Status | With Coverage | Without Coverage |
| Native Born | 7,996 (90.8%) | 810 (9.2%) |
| Foreign Born, Citizen | 22,741 (91.3%) | 2,154 (8.6%) |
| Foreign Born, not a Citizen | 23,364 (87.7%) | 3,273 (12.3%) |
Health Insurance Coverage by Household Income in Coconino County
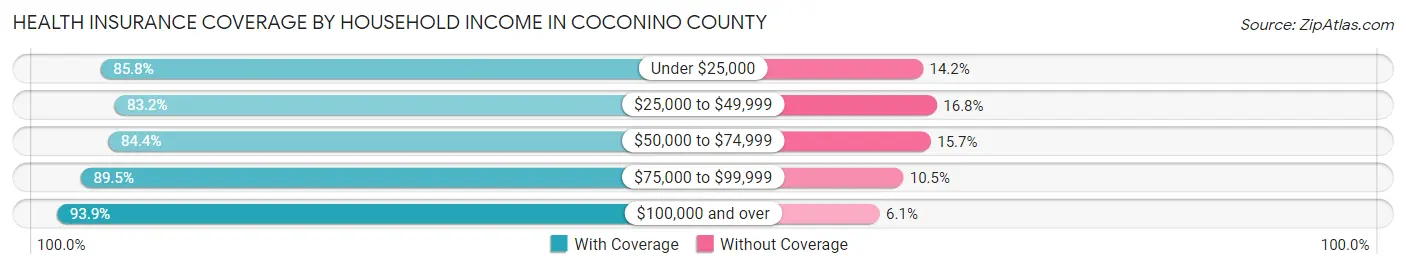
| Household Income | With Coverage | Without Coverage |
| Under $25,000 | 14,143 (85.8%) | 2,339 (14.2%) |
| $25,000 to $49,999 | 18,026 (83.2%) | 3,634 (16.8%) |
| $50,000 to $74,999 | 19,779 (84.4%) | 3,669 (15.7%) |
| $75,000 to $99,999 | 15,979 (89.5%) | 1,872 (10.5%) |
| $100,000 and over | 49,279 (93.9%) | 3,177 (6.1%) |
Public vs Private Health Insurance Coverage by Age in Coconino County
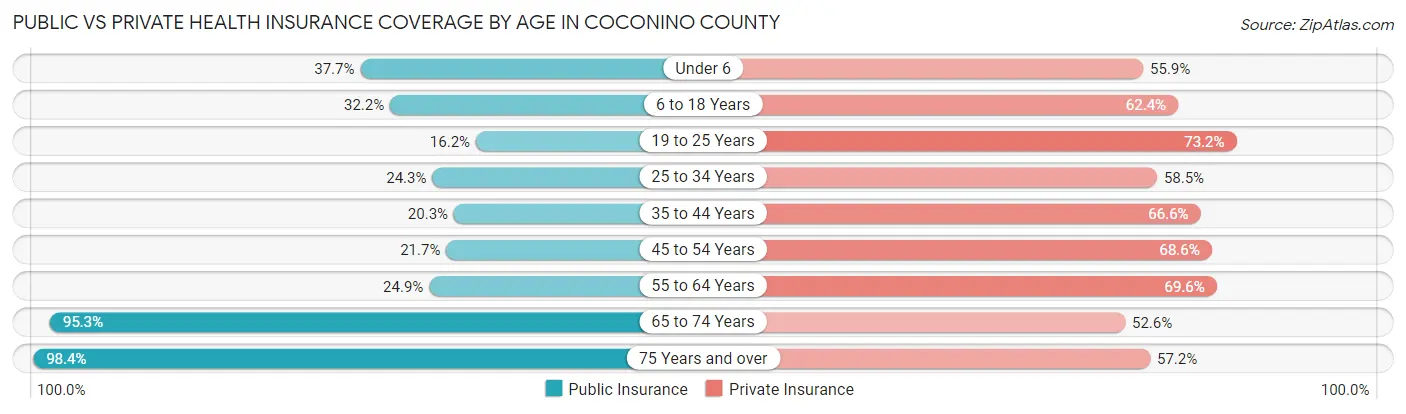
| Age Bracket | Public Insurance | Private Insurance |
| Under 6 | 3,319 (37.7%) | 4,925 (55.9%) |
| 6 to 18 Years | 8,009 (32.2%) | 15,530 (62.4%) |
| 19 to 25 Years | 4,322 (16.2%) | 19,506 (73.2%) |
| 25 to 34 Years | 4,273 (24.3%) | 10,280 (58.5%) |
| 35 to 44 Years | 3,267 (20.3%) | 10,705 (66.6%) |
| 45 to 54 Years | 3,166 (21.7%) | 9,994 (68.6%) |
| 55 to 64 Years | 4,026 (24.9%) | 11,243 (69.6%) |
| 65 to 74 Years | 12,034 (95.3%) | 6,637 (52.6%) |
| 75 Years and over | 6,564 (98.4%) | 3,817 (57.2%) |
| Total | 48,980 (34.0%) | 92,637 (64.3%) |
Disability Status by Sex by Age in Coconino County
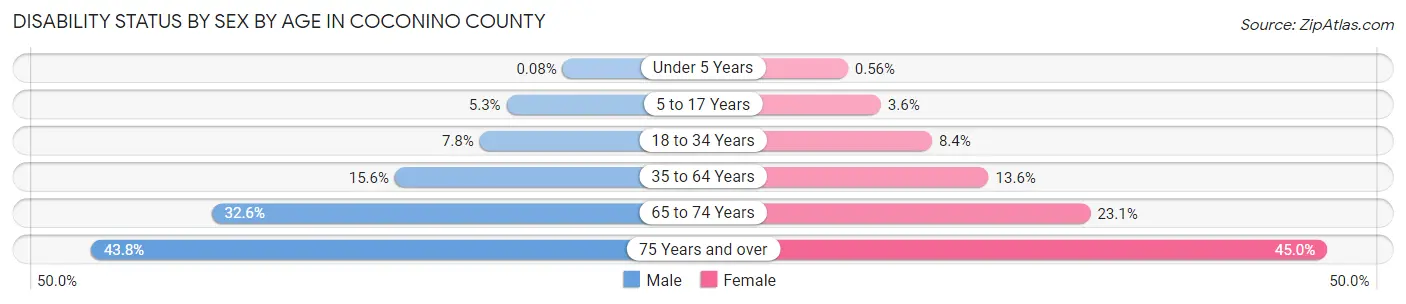
| Age Bracket | Male | Female |
| Under 5 Years | 3 (0.1%) | 19 (0.6%) |
| 5 to 17 Years | 579 (5.3%) | 390 (3.6%) |
| 18 to 34 Years | 1,852 (7.8%) | 2,120 (8.4%) |
| 35 to 64 Years | 3,679 (15.6%) | 3,173 (13.6%) |
| 65 to 74 Years | 2,068 (32.6%) | 1,452 (23.1%) |
| 75 Years and over | 1,281 (43.8%) | 1,688 (45.0%) |
Disability Class by Sex by Age in Coconino County
Disability Class: Hearing Difficulty
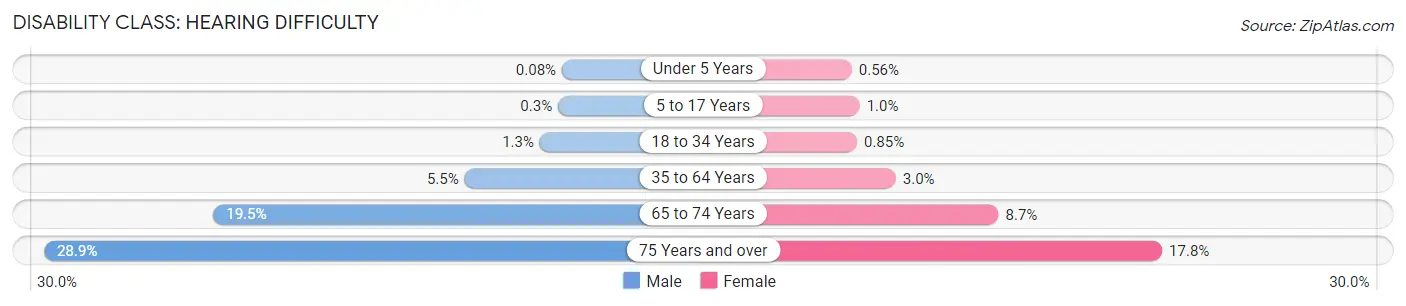
| Age Bracket | Male | Female |
| Under 5 Years | 3 (0.1%) | 19 (0.6%) |
| 5 to 17 Years | 33 (0.3%) | 108 (1.0%) |
| 18 to 34 Years | 313 (1.3%) | 216 (0.9%) |
| 35 to 64 Years | 1,294 (5.5%) | 702 (3.0%) |
| 65 to 74 Years | 1,235 (19.5%) | 549 (8.7%) |
| 75 Years and over | 845 (28.9%) | 669 (17.8%) |
Disability Class: Vision Difficulty
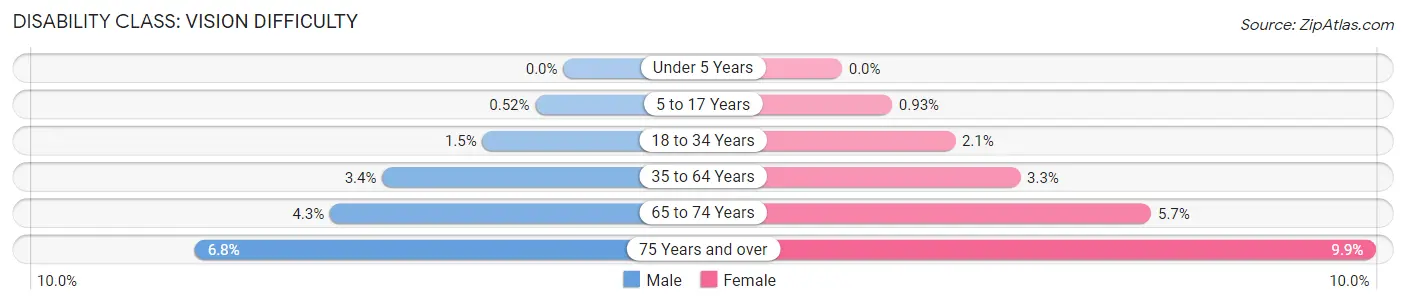
| Age Bracket | Male | Female |
| Under 5 Years | 0 (0.0%) | 0 (0.0%) |
| 5 to 17 Years | 57 (0.5%) | 100 (0.9%) |
| 18 to 34 Years | 358 (1.5%) | 531 (2.1%) |
| 35 to 64 Years | 790 (3.4%) | 771 (3.3%) |
| 65 to 74 Years | 274 (4.3%) | 361 (5.7%) |
| 75 Years and over | 200 (6.8%) | 371 (9.9%) |
Disability Class: Cognitive Difficulty
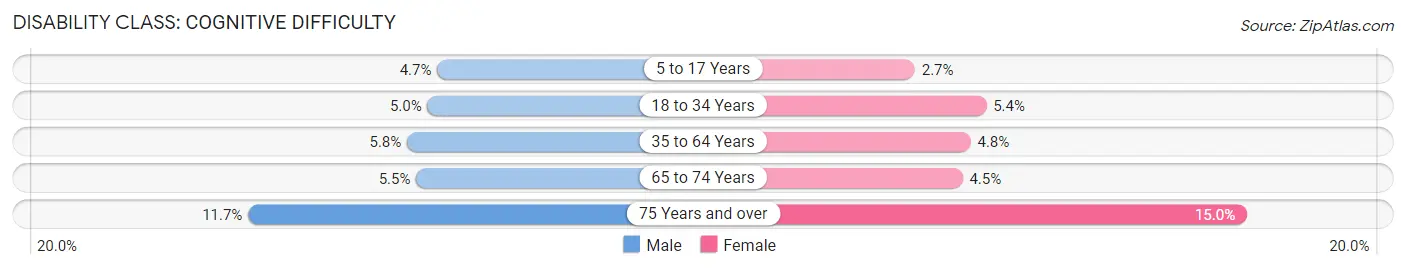
| Age Bracket | Male | Female |
| 5 to 17 Years | 513 (4.7%) | 291 (2.7%) |
| 18 to 34 Years | 1,199 (5.0%) | 1,359 (5.4%) |
| 35 to 64 Years | 1,365 (5.8%) | 1,113 (4.8%) |
| 65 to 74 Years | 346 (5.5%) | 282 (4.5%) |
| 75 Years and over | 342 (11.7%) | 564 (15.0%) |
Disability Class: Ambulatory Difficulty
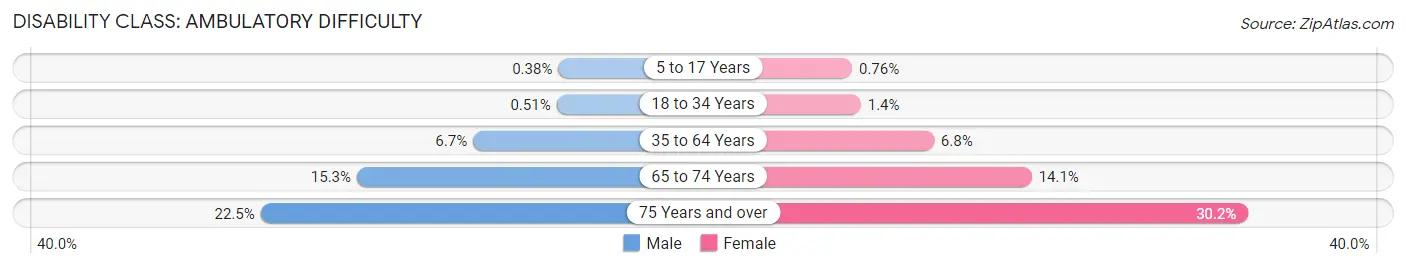
| Age Bracket | Male | Female |
| 5 to 17 Years | 42 (0.4%) | 82 (0.8%) |
| 18 to 34 Years | 122 (0.5%) | 356 (1.4%) |
| 35 to 64 Years | 1,579 (6.7%) | 1,593 (6.8%) |
| 65 to 74 Years | 971 (15.3%) | 887 (14.1%) |
| 75 Years and over | 657 (22.5%) | 1,131 (30.2%) |
Disability Class: Self-Care Difficulty
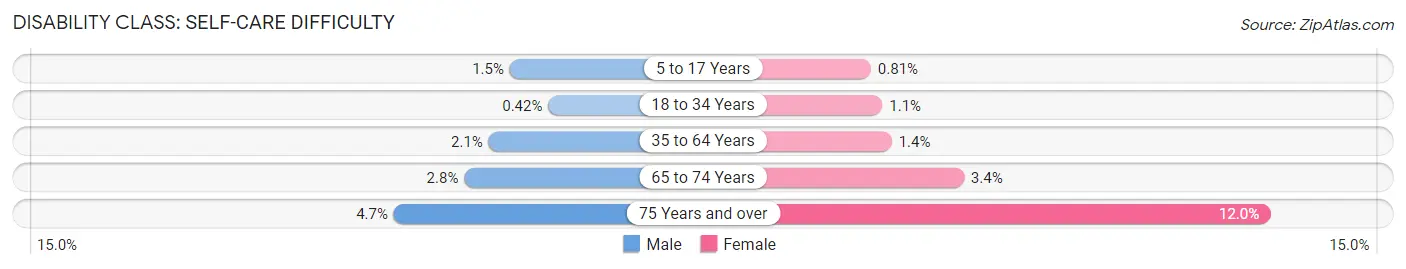
| Age Bracket | Male | Female |
| 5 to 17 Years | 163 (1.5%) | 87 (0.8%) |
| 18 to 34 Years | 101 (0.4%) | 286 (1.1%) |
| 35 to 64 Years | 490 (2.1%) | 324 (1.4%) |
| 65 to 74 Years | 175 (2.8%) | 214 (3.4%) |
| 75 Years and over | 138 (4.7%) | 448 (11.9%) |
Technology Access in Coconino County
Computing Device Access in Coconino County
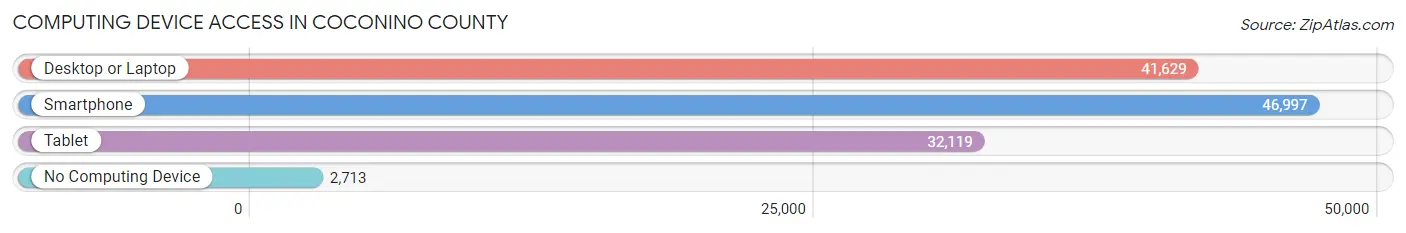
| Device Type | # Households | % Households |
| Desktop or Laptop | 41,629 | 80.1% |
| Smartphone | 46,997 | 90.4% |
| Tablet | 32,119 | 61.8% |
| No Computing Device | 2,713 | 5.2% |
| Total | 51,993 | 100.0% |
Internet Access in Coconino County
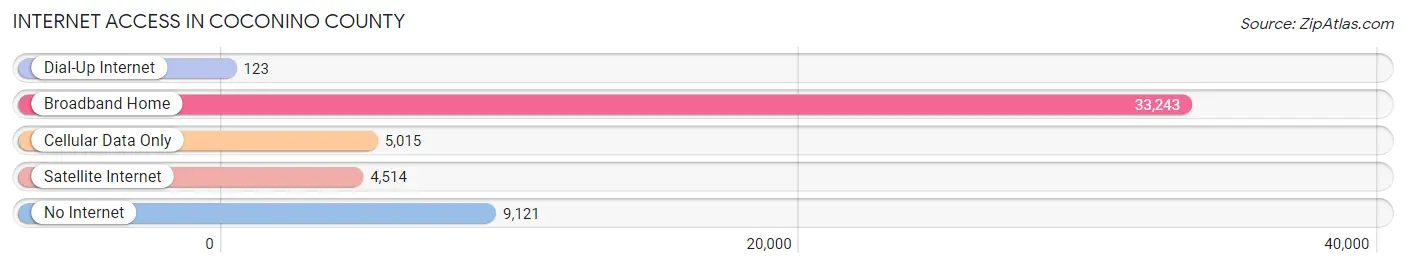
| Internet Type | # Households | % Households |
| Dial-Up Internet | 123 | 0.2% |
| Broadband Home | 33,243 | 63.9% |
| Cellular Data Only | 5,015 | 9.7% |
| Satellite Internet | 4,514 | 8.7% |
| No Internet | 9,121 | 17.5% |
| Total | 51,993 | 100.0% |
Coconino County Summary
Coconino County is located in the northern part of Arizona and is the second largest county in the United States. It is bordered by the Navajo Nation to the east, the Grand Canyon to the west, and the Kaibab National Forest to the south. The county seat is Flagstaff, which is the largest city in the county. The county is home to a diverse population of over 140,000 people, with a majority of the population being Native American, Hispanic, and White.
Geography
Coconino County is located in the northern part of Arizona and covers an area of 18,661 square miles. It is the second largest county in the United States. The county is bordered by the Navajo Nation to the east, the Grand Canyon to the west, and the Kaibab National Forest to the south. The county is home to a variety of landscapes, including the Colorado Plateau, the Mogollon Rim, and the San Francisco Peaks. The county is also home to a variety of wildlife, including elk, deer, bighorn sheep, and mountain lions.
History
Coconino County was established in 1891 and was named after the Coconino Native American tribe. The county was originally part of Yavapai County, but was split off in 1891. The county seat is Flagstaff, which was founded in 1876. Flagstaff was originally a railroad town and was the site of the first transcontinental railroad in the United States.
The county has a long history of mining, logging, and ranching. The county was also home to a number of military installations, including Camp Navajo, which was established in 1942. The county is also home to a number of national monuments, including the Grand Canyon National Park, the Sunset Crater Volcano National Monument, and the Wupatki National Monument.
Economy
Coconino County has a diverse economy, with a variety of industries including tourism, manufacturing, healthcare, and education. The county is home to a number of major employers, including Northern Arizona University, Flagstaff Medical Center, and W.L. Gore & Associates. The county is also home to a number of national parks and monuments, which attract millions of visitors each year.
The county is also home to a number of Native American tribes, including the Navajo, Hopi, and Havasupai. These tribes are major employers in the county and are involved in a variety of industries, including tourism, gaming, and agriculture.
Demographics
As of the 2010 census, the population of Coconino County was 134,421. The population is made up of a variety of ethnic and racial groups, including Native American, Hispanic, and White. The median household income in the county is $45,845 and the median age is 35. The county is home to a number of Native American tribes, including the Navajo, Hopi, and Havasupai.
Conclusion
Coconino County is located in the northern part of Arizona and is the second largest county in the United States. It is bordered by the Navajo Nation to the east, the Grand Canyon to the west, and the Kaibab National Forest to the south. The county is home to a diverse population of over 140,000 people, with a majority of the population being Native American, Hispanic, and White. The county has a diverse economy, with a variety of industries including tourism, manufacturing, healthcare, and education. The county is also home to a number of national parks and monuments, which attract millions of visitors each year.
Common Questions
What is the Total Population of Coconino County?
Total Population of Coconino County is 144,705.
What is the Total Male Population of Coconino County?
Total Male Population of Coconino County is 71,707.
What is the Total Female Population of Coconino County?
Total Female Population of Coconino County is 72,998.
What is the Ratio of Males per 100 Females in Coconino County?
There are 98.23 Males per 100 Females in Coconino County.
What is the Ratio of Females per 100 Males in Coconino County?
There are 101.80 Females per 100 Males in Coconino County.
What is the Median Population Age in Coconino County?
Median Population Age in Coconino County is 31.7 Years.
What is the Average Family Size in Coconino County
Average Family Size in Coconino County is 3.2 People.
What is the Average Household Size in Coconino County
Average Household Size in Coconino County is 2.5 People.
What is Per Capita Income in Coconino County?
Per Capita income in Coconino County is $32,592.
What is the Median Family Income in Coconino County?
Median Family Income in Coconino County is $86,862.
What is the Median Household income in Coconino County?
Median Household Income in Coconino County is $67,266.
What is Income or Wage Gap in Coconino County?
Income or Wage Gap in Coconino County is 25.0%.
Women in Coconino County earn 75.0 cents for every dollar earned by a man.
What is Family Income Deficit in Coconino County?
Family Income Deficit in Coconino County is $11,200.
Families that are below poverty line in Coconino County earn $11,200 less on average than the poverty threshold level.
What is Inequality or Gini Index in Coconino County?
Inequality or Gini Index in Coconino County is 0.46.
How Large is the Labor Force in Coconino County?
There are 73,056 People in the Labor Forcein in Coconino County.
What is the Percentage of People in the Labor Force in Coconino County?
61.3% of People are in the Labor Force in Coconino County.
What is the Unemployment Rate in Coconino County?
Unemployment Rate in Coconino County is 7.0%.