Rhodell, WV
Rhodell Map
Rhodell Overview
127
TOTAL POPULATION
67
MALE POPULATION
60
FEMALE POPULATION
111.67
MALES / 100 FEMALES
89.55
FEMALES / 100 MALES
49.9
MEDIAN AGE
3.1
AVG FAMILY SIZE
2.2
AVG HOUSEHOLD SIZE
$22,840
PER CAPITA INCOME
$46,042
AVG FAMILY INCOME
$36,250
AVG HOUSEHOLD INCOME
0.37
INEQUALITY / GINI INDEX
67
LABOR FORCE [ PEOPLE ]
52.8%
PERCENT IN LABOR FORCE
14.9%
UNEMPLOYMENT RATE
Rhodell Zip Codes
Rhodell Area Codes
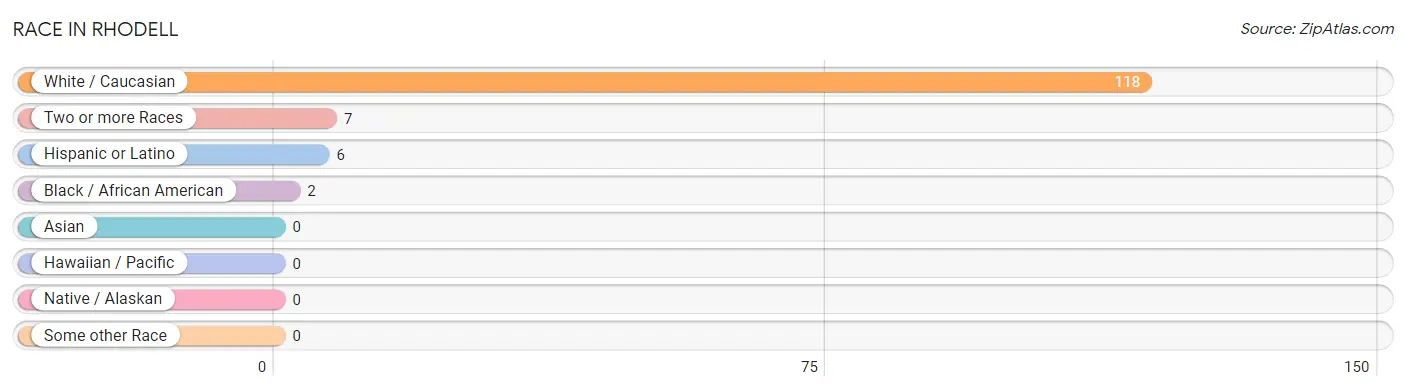
Race in Rhodell
The most populous races in Rhodell are White / Caucasian (118 | 92.9%), Two or more Races (7 | 5.5%), and Hispanic or Latino (6 | 4.7%).
| Race | # Population | % Population |
| Asian | 0 | 0.0% |
| Black / African American | 2 | 1.6% |
| Hawaiian / Pacific | 0 | 0.0% |
| Hispanic or Latino | 6 | 4.7% |
| Native / Alaskan | 0 | 0.0% |
| White / Caucasian | 118 | 92.9% |
| Two or more Races | 7 | 5.5% |
| Some other Race | 0 | 0.0% |
| Total | 127 | 100.0% |
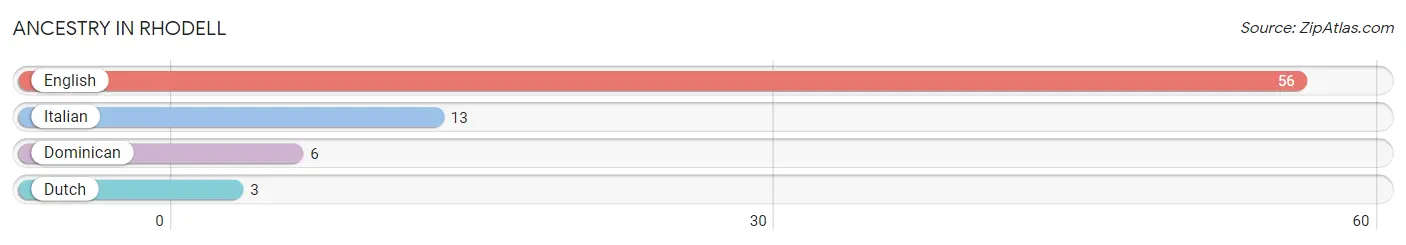
Ancestry in Rhodell
The most populous ancestries reported in Rhodell are English (56 | 44.1%), Italian (13 | 10.2%), Dominican (6 | 4.7%), and Dutch (3 | 2.4%), together accounting for 61.4% of all Rhodell residents.
| Ancestry | # Population | % Population |
| Dominican | 6 | 4.7% |
| Dutch | 3 | 2.4% |
| English | 56 | 44.1% |
| Italian | 13 | 10.2% | View All 4 Rows |
Immigrants in Rhodell

| Immigration Origin | # Population | % Population | View All 0 Rows |
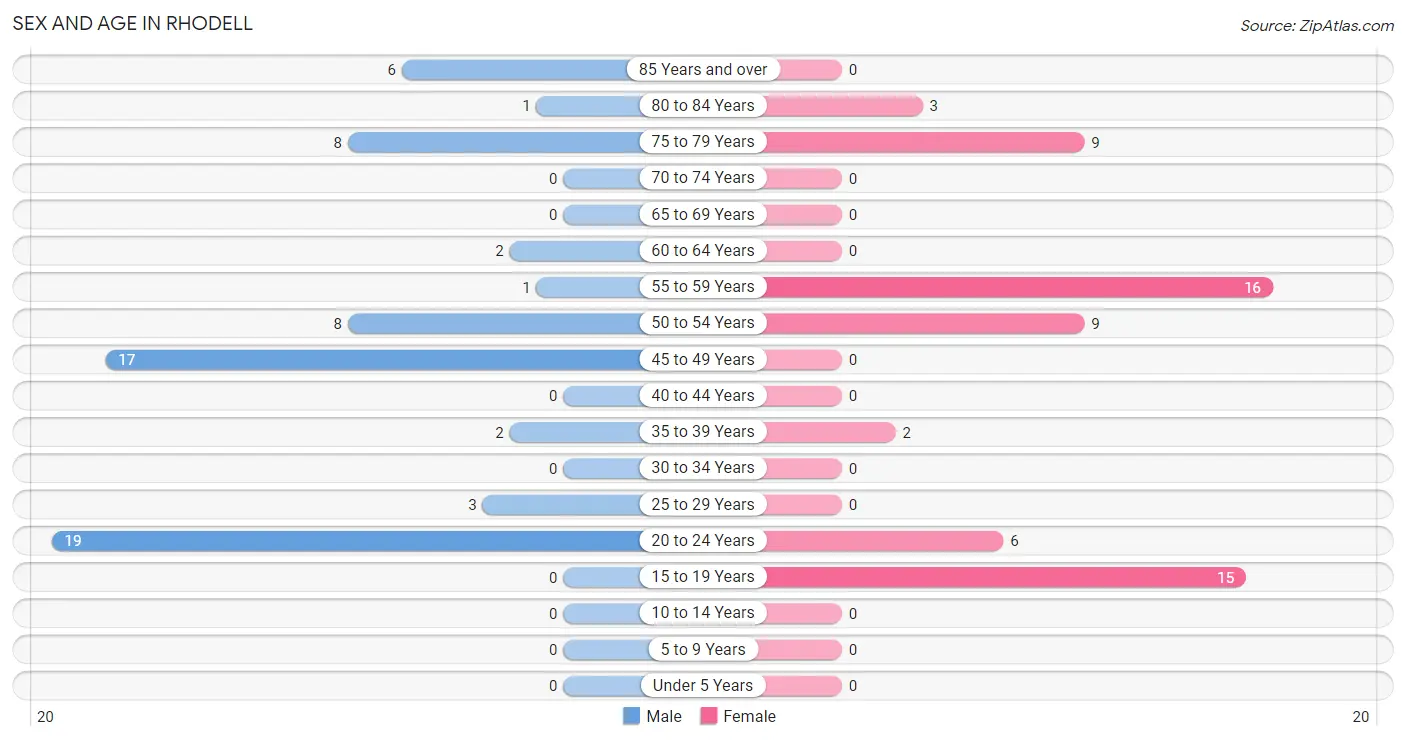
Sex and Age in Rhodell
Sex and Age in Rhodell
The most populous age groups in Rhodell are 20 to 24 Years (19 | 28.4%) for men and 55 to 59 Years (16 | 26.7%) for women.
| Age Bracket | Male | Female |
| Under 5 Years | 0 (0.0%) | 0 (0.0%) |
| 5 to 9 Years | 0 (0.0%) | 0 (0.0%) |
| 10 to 14 Years | 0 (0.0%) | 0 (0.0%) |
| 15 to 19 Years | 0 (0.0%) | 15 (25.0%) |
| 20 to 24 Years | 19 (28.4%) | 6 (10.0%) |
| 25 to 29 Years | 3 (4.5%) | 0 (0.0%) |
| 30 to 34 Years | 0 (0.0%) | 0 (0.0%) |
| 35 to 39 Years | 2 (3.0%) | 2 (3.3%) |
| 40 to 44 Years | 0 (0.0%) | 0 (0.0%) |
| 45 to 49 Years | 17 (25.4%) | 0 (0.0%) |
| 50 to 54 Years | 8 (11.9%) | 9 (15.0%) |
| 55 to 59 Years | 1 (1.5%) | 16 (26.7%) |
| 60 to 64 Years | 2 (3.0%) | 0 (0.0%) |
| 65 to 69 Years | 0 (0.0%) | 0 (0.0%) |
| 70 to 74 Years | 0 (0.0%) | 0 (0.0%) |
| 75 to 79 Years | 8 (11.9%) | 9 (15.0%) |
| 80 to 84 Years | 1 (1.5%) | 3 (5.0%) |
| 85 Years and over | 6 (9.0%) | 0 (0.0%) |
| Total | 67 (100.0%) | 60 (100.0%) |
Families and Households in Rhodell
Median Family Size in Rhodell
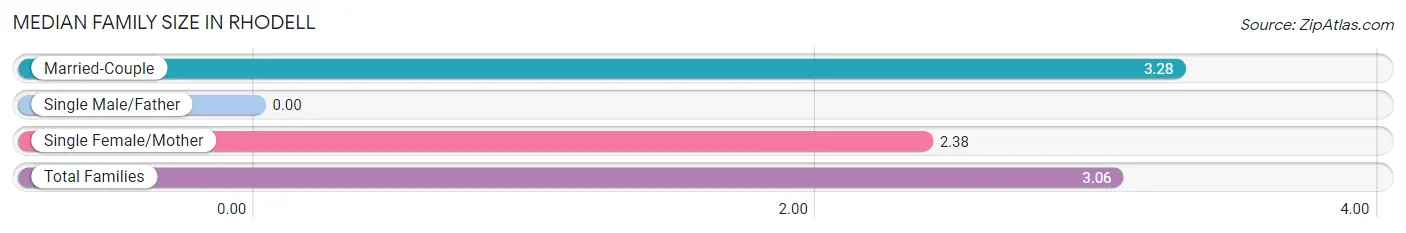
| Family Type | # Families | Family Size |
| Married-Couple | 25 (75.8%) | 3.28 |
| Single Male/Father | 0 (0.0%) | - |
| Single Female/Mother | 8 (24.2%) | 2.38 |
| Total Families | 33 (100.0%) | 3.06 |
Median Household Size in Rhodell
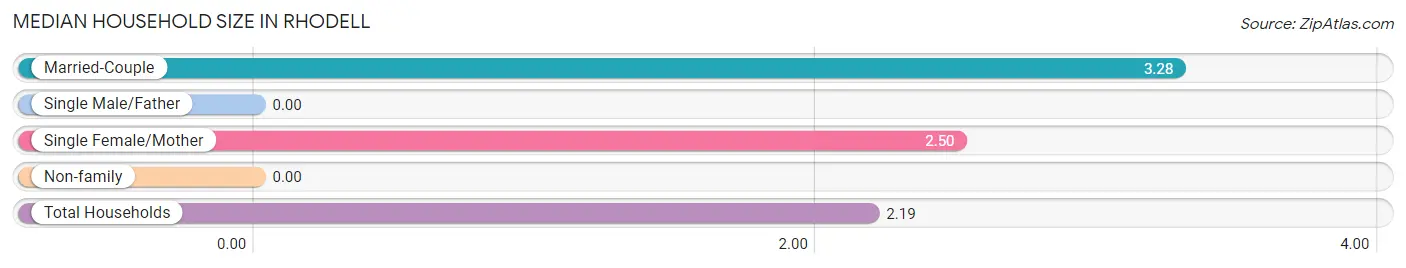
| Household Type | # Households | Household Size |
| Married-Couple | 25 (43.1%) | 3.28 |
| Single Male/Father | 0 (0.0%) | - |
| Single Female/Mother | 8 (13.8%) | 2.50 |
| Non-family | 25 (43.1%) | - |
| Total Households | 58 (100.0%) | 2.19 |
Household Size by Marriage Status in Rhodell
Out of a total of 58 households in Rhodell, 33 (56.9%) are family households, while 25 (43.1%) are nonfamily households. The most numerous type of family households are 2-person households, comprising 20, and the most common type of nonfamily households are 1-person households, comprising 25.
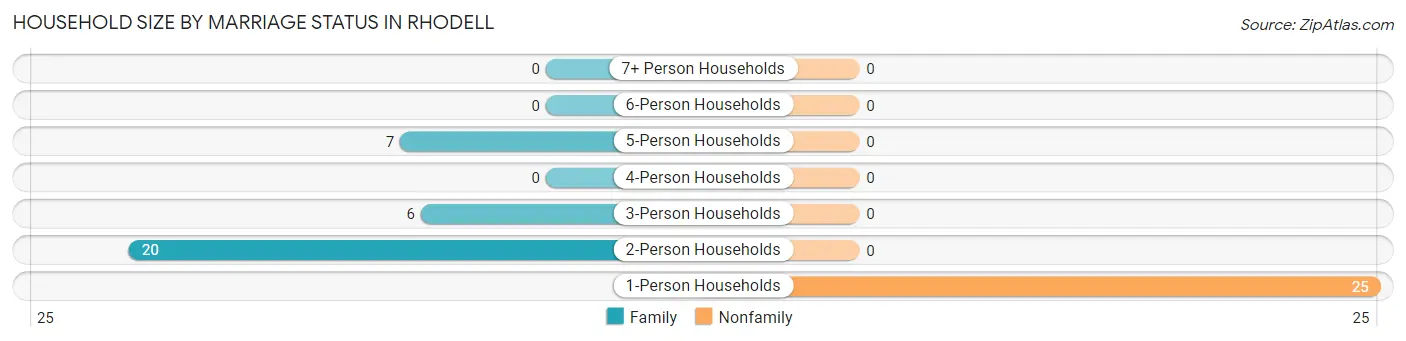
| Household Size | Family Households | Nonfamily Households |
| 1-Person Households | - | 25 (43.1%) |
| 2-Person Households | 20 (34.5%) | 0 (0.0%) |
| 3-Person Households | 6 (10.3%) | 0 (0.0%) |
| 4-Person Households | 0 (0.0%) | 0 (0.0%) |
| 5-Person Households | 7 (12.1%) | 0 (0.0%) |
| 6-Person Households | 0 (0.0%) | 0 (0.0%) |
| 7+ Person Households | 0 (0.0%) | 0 (0.0%) |
| Total | 33 (56.9%) | 25 (43.1%) |
Female Fertility in Rhodell
Fertility by Age in Rhodell
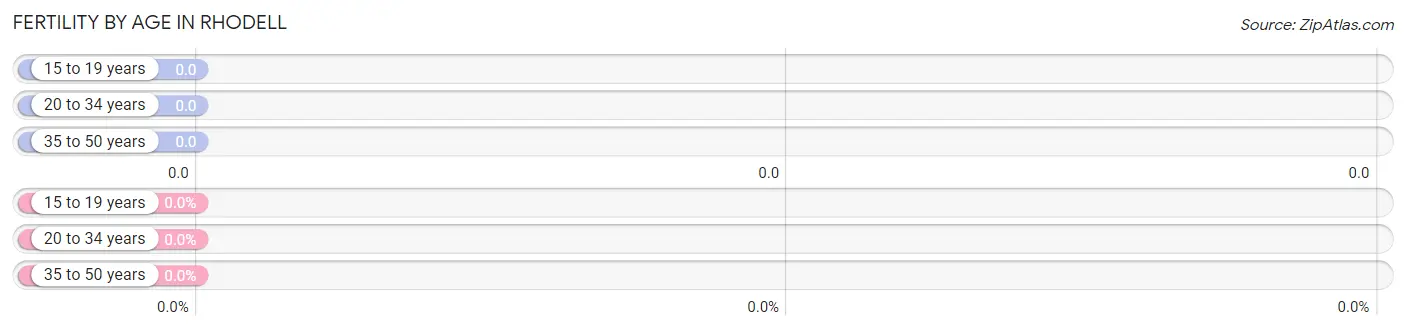
| Age Bracket | Women with Births | Births / 1,000 Women |
| 15 to 19 years | 0 (0.0%) | 0.0 |
| 20 to 34 years | 0 (0.0%) | 0.0 |
| 35 to 50 years | 0 (0.0%) | 0.0 |
| Total | 0 (0.0%) | 0.0 |
Fertility by Age by Marriage Status in Rhodell
| Age Bracket | Married | Unmarried |
| 15 to 19 years | 0 (0.0%) | 0 (0.0%) |
| 20 to 34 years | 0 (0.0%) | 0 (0.0%) |
| 35 to 50 years | 0 (0.0%) | 0 (0.0%) |
| Total | 0 (0.0%) | 0 (0.0%) |
Fertility by Education in Rhodell
| Educational Attainment | Women with Births | Births / 1,000 Women |
| Less than High School | 0 (0.0%) | 0.0 |
| High School Diploma | 0 (0.0%) | 0.0 |
| College or Associate's Degree | 0 (0.0%) | 0.0 |
| Bachelor's Degree | 0 (0.0%) | 0.0 |
| Graduate Degree | 0 (0.0%) | 0.0 |
| Total | 0 (0.0%) | 0.0 |
Fertility by Education by Marriage Status in Rhodell
| Educational Attainment | Married | Unmarried |
| Less than High School | 0 (0.0%) | 0 (0.0%) |
| High School Diploma | 0 (0.0%) | 0 (0.0%) |
| College or Associate's Degree | 0 (0.0%) | 0 (0.0%) |
| Bachelor's Degree | 0 (0.0%) | 0 (0.0%) |
| Graduate Degree | 0 (0.0%) | 0 (0.0%) |
| Total | 0 (0.0%) | 0 (0.0%) |
Income in Rhodell
Income Overview in Rhodell
Per Capita Income in Rhodell is $22,840, while median incomes of families and households are $46,042 and $36,250 respectively.
| Characteristic | Number | Measure |
| Per Capita Income | 127 | $22,840 |
| Median Family Income | 33 | $46,042 |
| Mean Family Income | 33 | $56,397 |
| Median Household Income | 58 | $36,250 |
| Mean Household Income | 58 | $47,079 |
| Income Deficit | 33 | $0 |
| Wage / Income Gap (%) | 127 | 0.00% |
| Wage / Income Gap ($) | 127 | 100.00¢ per $1 |
| Gini / Inequality Index | 127 | 0.37 |
Earnings by Sex in Rhodell
| Sex | Number | Average Earnings |
| Male | 36 (53.7%) | $0 |
| Female | 31 (46.3%) | $0 |
| Total | 67 (100.0%) | $0 |
Earnings by Sex by Income Bracket in Rhodell
The most common earnings brackets in Rhodell are $2,500 to $4,999 for men (10 | 27.8%) and $2,500 to $4,999 for women (15 | 48.4%).
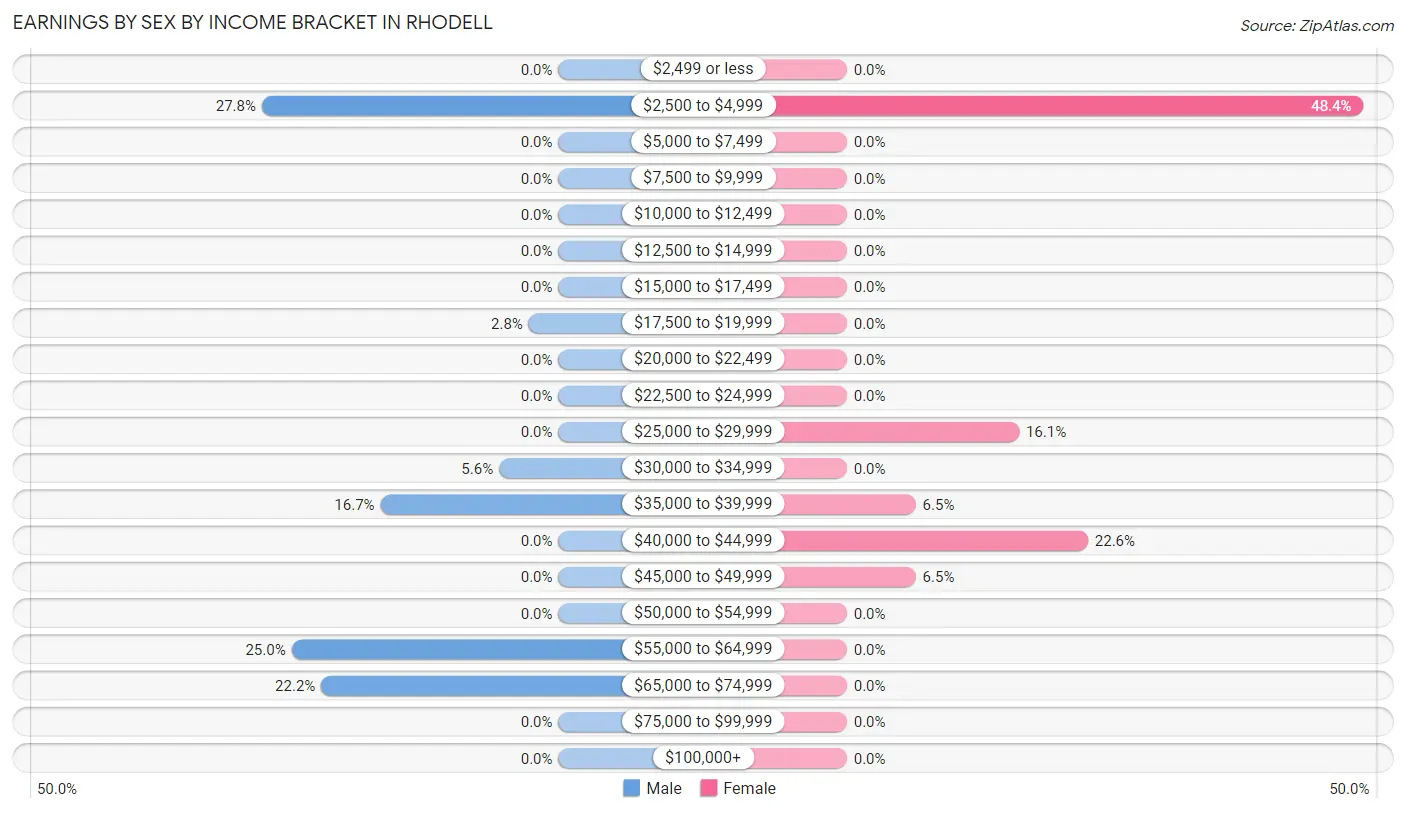
| Income | Male | Female |
| $2,499 or less | 0 (0.0%) | 0 (0.0%) |
| $2,500 to $4,999 | 10 (27.8%) | 15 (48.4%) |
| $5,000 to $7,499 | 0 (0.0%) | 0 (0.0%) |
| $7,500 to $9,999 | 0 (0.0%) | 0 (0.0%) |
| $10,000 to $12,499 | 0 (0.0%) | 0 (0.0%) |
| $12,500 to $14,999 | 0 (0.0%) | 0 (0.0%) |
| $15,000 to $17,499 | 0 (0.0%) | 0 (0.0%) |
| $17,500 to $19,999 | 1 (2.8%) | 0 (0.0%) |
| $20,000 to $22,499 | 0 (0.0%) | 0 (0.0%) |
| $22,500 to $24,999 | 0 (0.0%) | 0 (0.0%) |
| $25,000 to $29,999 | 0 (0.0%) | 5 (16.1%) |
| $30,000 to $34,999 | 2 (5.6%) | 0 (0.0%) |
| $35,000 to $39,999 | 6 (16.7%) | 2 (6.5%) |
| $40,000 to $44,999 | 0 (0.0%) | 7 (22.6%) |
| $45,000 to $49,999 | 0 (0.0%) | 2 (6.5%) |
| $50,000 to $54,999 | 0 (0.0%) | 0 (0.0%) |
| $55,000 to $64,999 | 9 (25.0%) | 0 (0.0%) |
| $65,000 to $74,999 | 8 (22.2%) | 0 (0.0%) |
| $75,000 to $99,999 | 0 (0.0%) | 0 (0.0%) |
| $100,000+ | 0 (0.0%) | 0 (0.0%) |
| Total | 36 (100.0%) | 31 (100.0%) |
Earnings by Sex by Educational Attainment in Rhodell
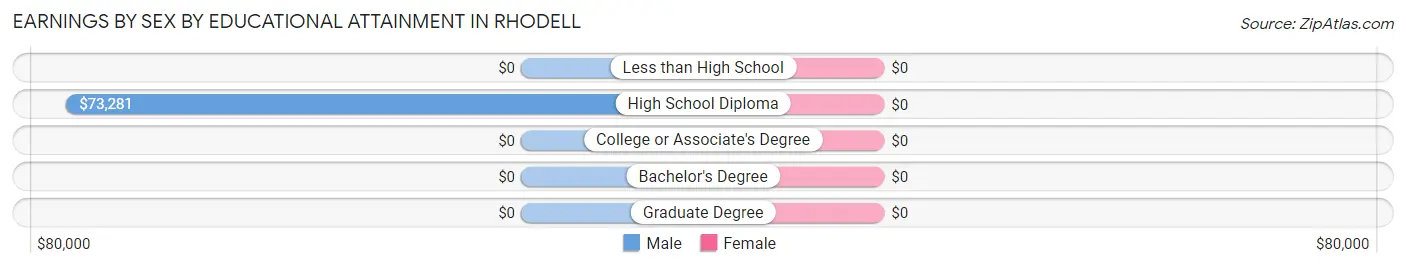
| Educational Attainment | Male Income | Female Income |
| Less than High School | - | - |
| High School Diploma | $73,281 | $0 |
| College or Associate's Degree | - | - |
| Bachelor's Degree | - | - |
| Graduate Degree | - | - |
| Total | - | - |
Family Income in Rhodell
Family Income Brackets in Rhodell
According to the Rhodell family income data, there are 8 families falling into the $35,000 to $49,999 income range, which is the most common income bracket and makes up 24.2% of all families.
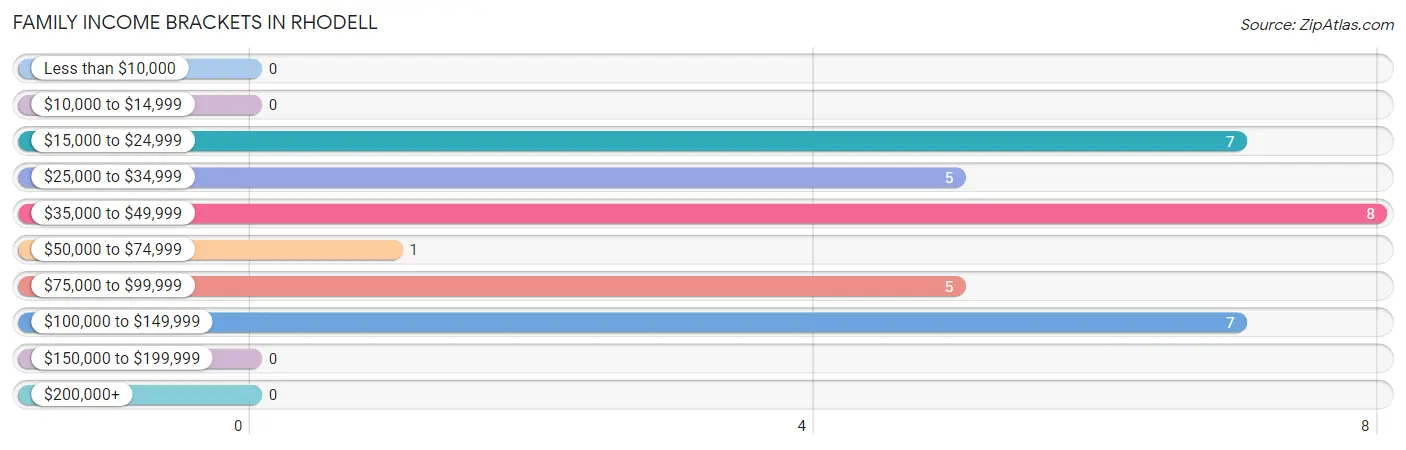
| Income Bracket | # Families | % Families |
| Less than $10,000 | 0 | 0.0% |
| $10,000 to $14,999 | 0 | 0.0% |
| $15,000 to $24,999 | 7 | 21.2% |
| $25,000 to $34,999 | 5 | 15.2% |
| $35,000 to $49,999 | 8 | 24.2% |
| $50,000 to $74,999 | 1 | 3.0% |
| $75,000 to $99,999 | 5 | 15.2% |
| $100,000 to $149,999 | 7 | 21.2% |
| $150,000 to $199,999 | 0 | 0.0% |
| $200,000+ | 0 | 0.0% |
Family Income by Famaliy Size in Rhodell
| Income Bracket | # Families | Median Income |
| 2-Person Families | 21 (63.6%) | $0 |
| 3-Person Families | 5 (15.1%) | $0 |
| 4-Person Families | 0 (0.0%) | $0 |
| 5-Person Families | 7 (21.2%) | $0 |
| 6-Person Families | 0 (0.0%) | $0 |
| 7+ Person Families | 0 (0.0%) | $0 |
| Total | 33 (100.0%) | $46,042 |
Family Income by Number of Earners in Rhodell
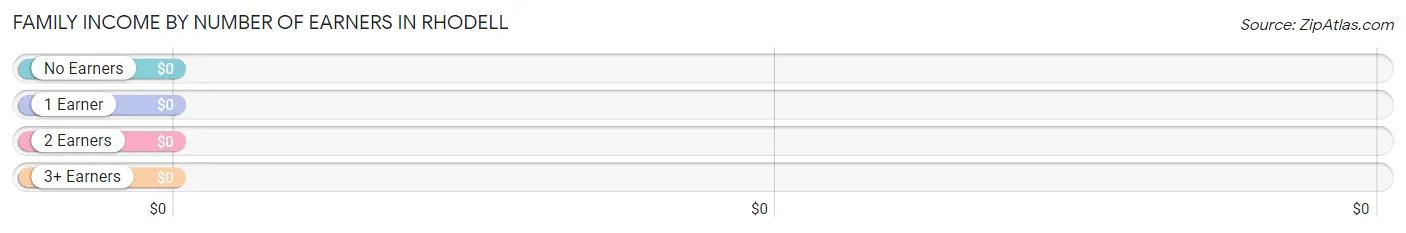
| Number of Earners | # Families | Median Income |
| No Earners | 6 (18.2%) | $0 |
| 1 Earner | 11 (33.3%) | $0 |
| 2 Earners | 9 (27.3%) | $0 |
| 3+ Earners | 7 (21.2%) | $0 |
| Total | 33 (100.0%) | $46,042 |
Household Income in Rhodell
Household Income Brackets in Rhodell
With 16 households falling in the category, the $15,000 to $24,999 income range is the most frequent in Rhodell, accounting for 27.6% of all households.
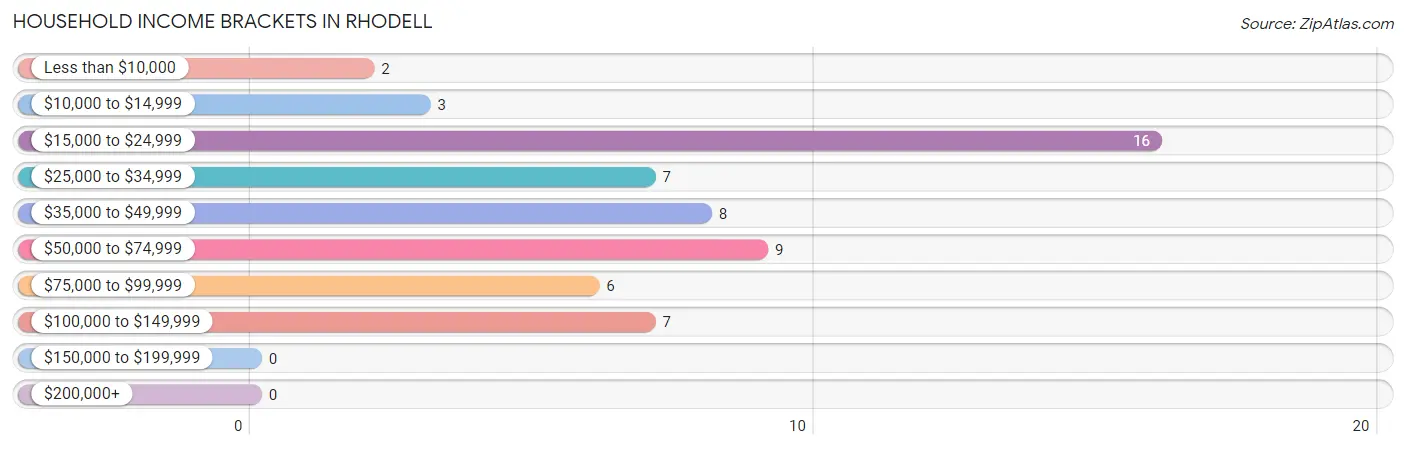
| Income Bracket | # Households | % Households |
| Less than $10,000 | 2 | 3.4% |
| $10,000 to $14,999 | 3 | 5.2% |
| $15,000 to $24,999 | 16 | 27.6% |
| $25,000 to $34,999 | 7 | 12.1% |
| $35,000 to $49,999 | 8 | 13.8% |
| $50,000 to $74,999 | 9 | 15.5% |
| $75,000 to $99,999 | 6 | 10.3% |
| $100,000 to $149,999 | 7 | 12.1% |
| $150,000 to $199,999 | 0 | 0.0% |
| $200,000+ | 0 | 0.0% |
Household Income by Householder Age in Rhodell
The median household income in Rhodell is $36,250, with the highest median household income of $37,500 found in the 65+ years age bracket for the primary householder. A total of 18 households (31.0%) fall into this category. Meanwhile, the 15 to 24 years age bracket for the primary householder has the lowest median household income of $0, with 9 households (15.5%) in this group.
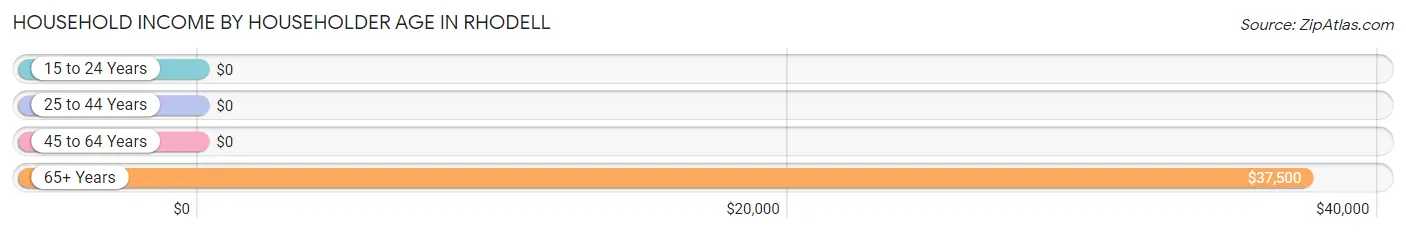
| Income Bracket | # Households | Median Income |
| 15 to 24 Years | 9 (15.5%) | $0 |
| 25 to 44 Years | 0 (0.0%) | $0 |
| 45 to 64 Years | 31 (53.4%) | $0 |
| 65+ Years | 18 (31.0%) | $37,500 |
| Total | 58 (100.0%) | $36,250 |
Poverty in Rhodell
Income Below Poverty by Sex and Age in Rhodell
With 28.4% poverty level for males and 40.0% for females among the residents of Rhodell, 18 to 24 year old males and 18 to 24 year old females are the most vulnerable to poverty, with 10 males (52.6%) and 15 females (71.4%) in their respective age groups living below the poverty level.
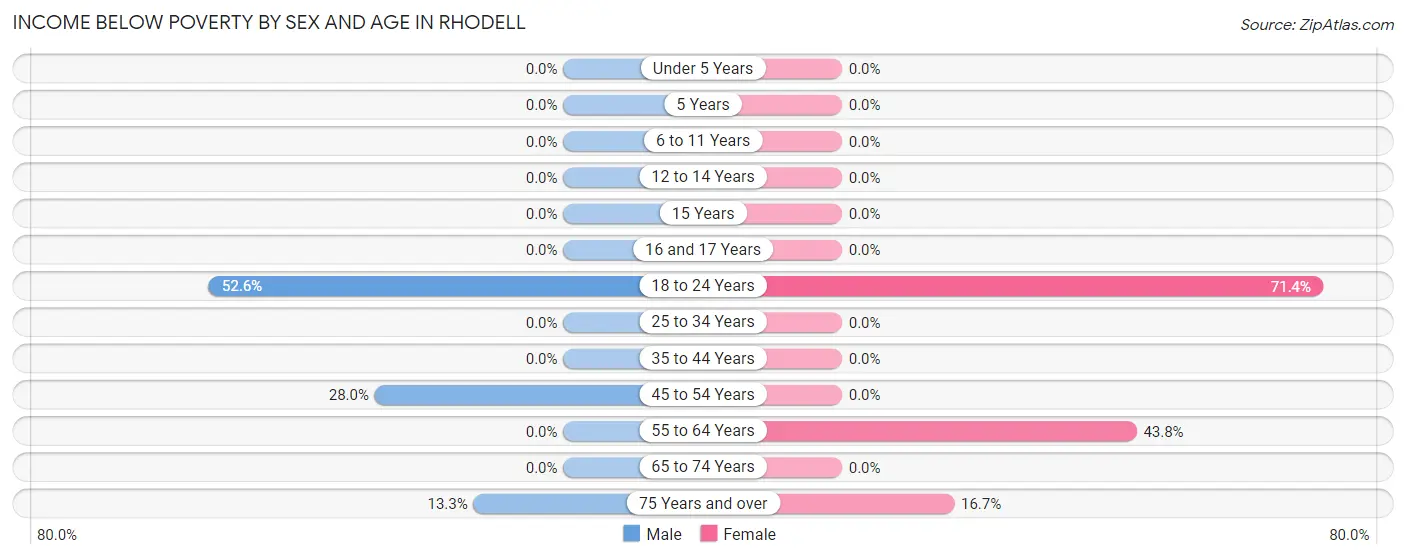
| Age Bracket | Male | Female |
| Under 5 Years | 0 (0.0%) | 0 (0.0%) |
| 5 Years | 0 (0.0%) | 0 (0.0%) |
| 6 to 11 Years | 0 (0.0%) | 0 (0.0%) |
| 12 to 14 Years | 0 (0.0%) | 0 (0.0%) |
| 15 Years | 0 (0.0%) | 0 (0.0%) |
| 16 and 17 Years | 0 (0.0%) | 0 (0.0%) |
| 18 to 24 Years | 10 (52.6%) | 15 (71.4%) |
| 25 to 34 Years | 0 (0.0%) | 0 (0.0%) |
| 35 to 44 Years | 0 (0.0%) | 0 (0.0%) |
| 45 to 54 Years | 7 (28.0%) | 0 (0.0%) |
| 55 to 64 Years | 0 (0.0%) | 7 (43.8%) |
| 65 to 74 Years | 0 (0.0%) | 0 (0.0%) |
| 75 Years and over | 2 (13.3%) | 2 (16.7%) |
| Total | 19 (28.4%) | 24 (40.0%) |
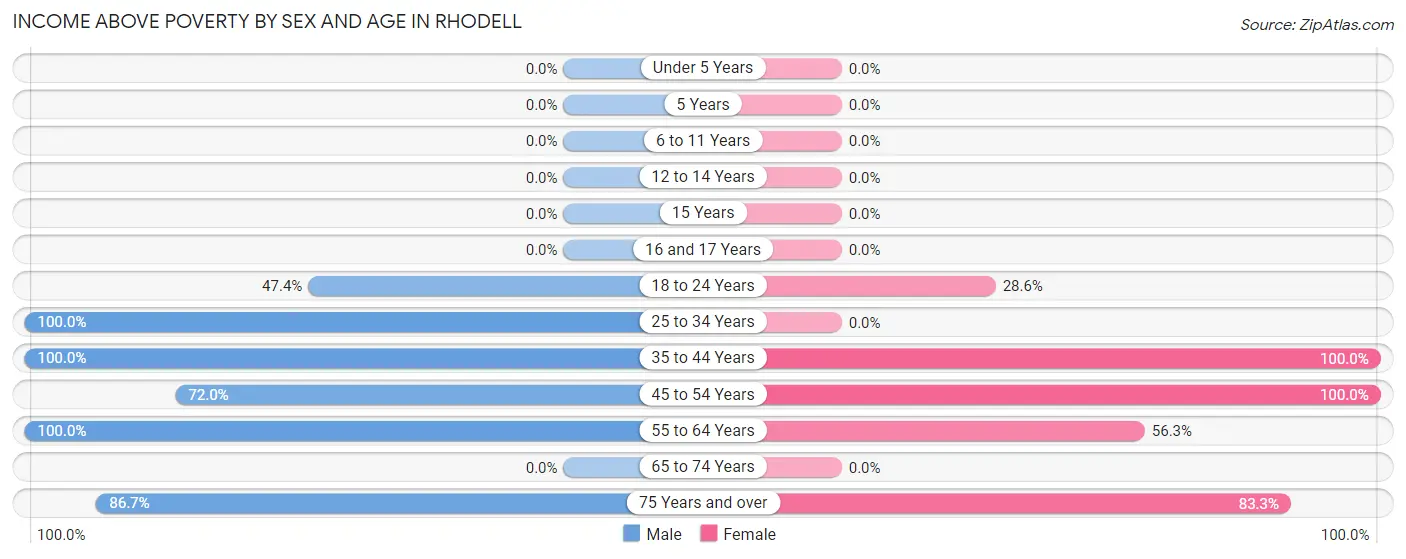
Income Above Poverty by Sex and Age in Rhodell
According to the poverty statistics in Rhodell, males aged 25 to 34 years and females aged 35 to 44 years are the age groups that are most secure financially, with 100.0% of males and 100.0% of females in these age groups living above the poverty line.
| Age Bracket | Male | Female |
| Under 5 Years | 0 (0.0%) | 0 (0.0%) |
| 5 Years | 0 (0.0%) | 0 (0.0%) |
| 6 to 11 Years | 0 (0.0%) | 0 (0.0%) |
| 12 to 14 Years | 0 (0.0%) | 0 (0.0%) |
| 15 Years | 0 (0.0%) | 0 (0.0%) |
| 16 and 17 Years | 0 (0.0%) | 0 (0.0%) |
| 18 to 24 Years | 9 (47.4%) | 6 (28.6%) |
| 25 to 34 Years | 3 (100.0%) | 0 (0.0%) |
| 35 to 44 Years | 2 (100.0%) | 2 (100.0%) |
| 45 to 54 Years | 18 (72.0%) | 9 (100.0%) |
| 55 to 64 Years | 3 (100.0%) | 9 (56.2%) |
| 65 to 74 Years | 0 (0.0%) | 0 (0.0%) |
| 75 Years and over | 13 (86.7%) | 10 (83.3%) |
| Total | 48 (71.6%) | 36 (60.0%) |
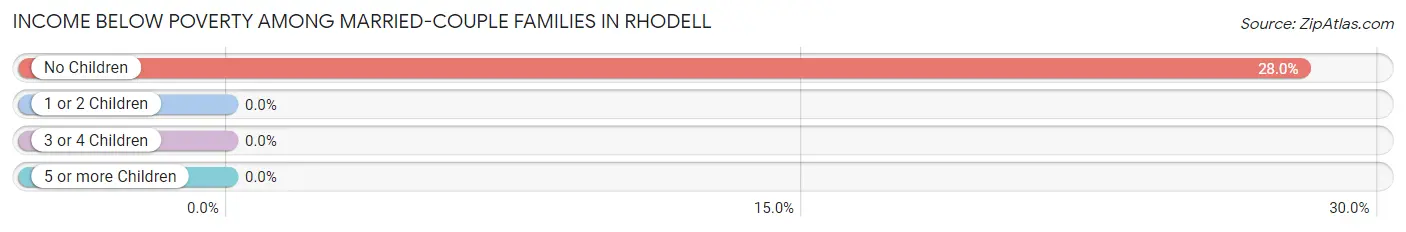
Income Below Poverty Among Married-Couple Families in Rhodell
The poverty statistics for married-couple families in Rhodell show that 28.0% or 7 of the total 25 families live below the poverty line. Families with no children have the highest poverty rate of 28.0%, comprising of 7 families. On the other hand, families with no children have the lowest poverty rate of 28.0%, which includes 7 families.
| Children | Above Poverty | Below Poverty |
| No Children | 18 (72.0%) | 7 (28.0%) |
| 1 or 2 Children | 0 (0.0%) | 0 (0.0%) |
| 3 or 4 Children | 0 (0.0%) | 0 (0.0%) |
| 5 or more Children | 0 (0.0%) | 0 (0.0%) |
| Total | 18 (72.0%) | 7 (28.0%) |
Income Below Poverty Among Single-Parent Households in Rhodell
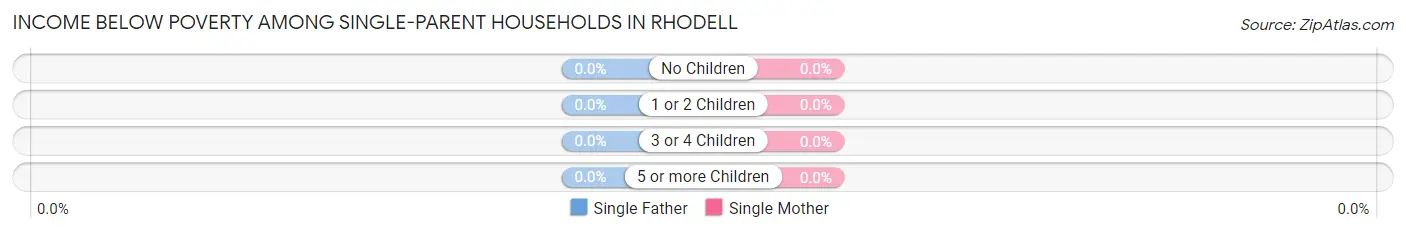
| Children | Single Father | Single Mother |
| No Children | 0 (0.0%) | 0 (0.0%) |
| 1 or 2 Children | 0 (0.0%) | 0 (0.0%) |
| 3 or 4 Children | 0 (0.0%) | 0 (0.0%) |
| 5 or more Children | 0 (0.0%) | 0 (0.0%) |
| Total | 0 (0.0%) | 0 (0.0%) |
Income Below Poverty Among Married-Couple vs Single-Parent Households in Rhodell
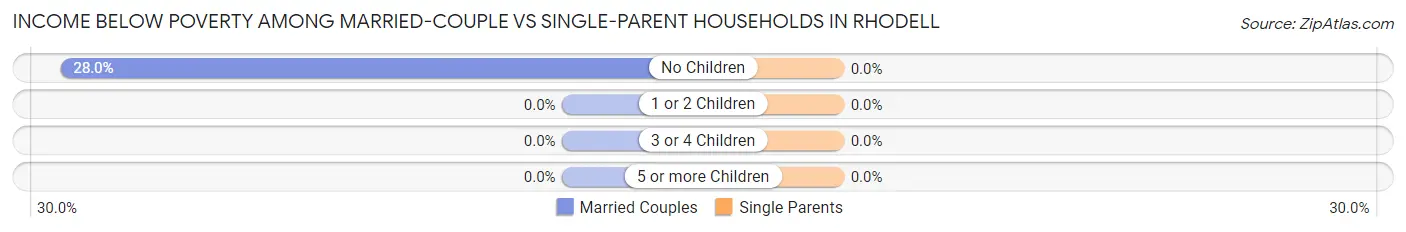
| Children | Married-Couple Families | Single-Parent Households |
| No Children | 7 (28.0%) | 0 (0.0%) |
| 1 or 2 Children | 0 (0.0%) | 0 (0.0%) |
| 3 or 4 Children | 0 (0.0%) | 0 (0.0%) |
| 5 or more Children | 0 (0.0%) | 0 (0.0%) |
| Total | 7 (28.0%) | 0 (0.0%) |
Employment Characteristics in Rhodell
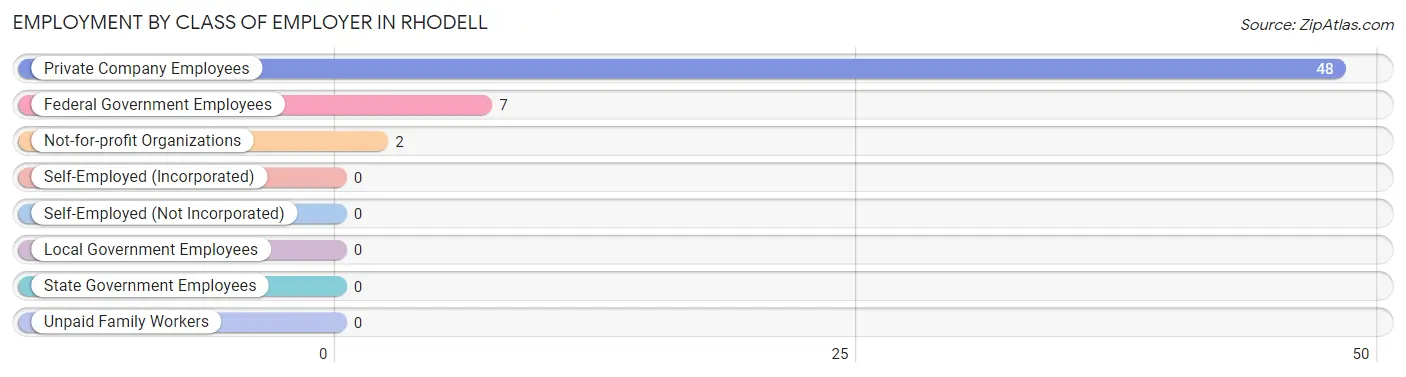
Employment by Class of Employer in Rhodell
Among the 57 employed individuals in Rhodell, private company employees (48 | 84.2%), federal government employees (7 | 12.3%), and not-for-profit organizations (2 | 3.5%) make up the most common classes of employment.
| Employer Class | # Employees | % Employees |
| Private Company Employees | 48 | 84.2% |
| Self-Employed (Incorporated) | 0 | 0.0% |
| Self-Employed (Not Incorporated) | 0 | 0.0% |
| Not-for-profit Organizations | 2 | 3.5% |
| Local Government Employees | 0 | 0.0% |
| State Government Employees | 0 | 0.0% |
| Federal Government Employees | 7 | 12.3% |
| Unpaid Family Workers | 0 | 0.0% |
| Total | 57 | 100.0% |
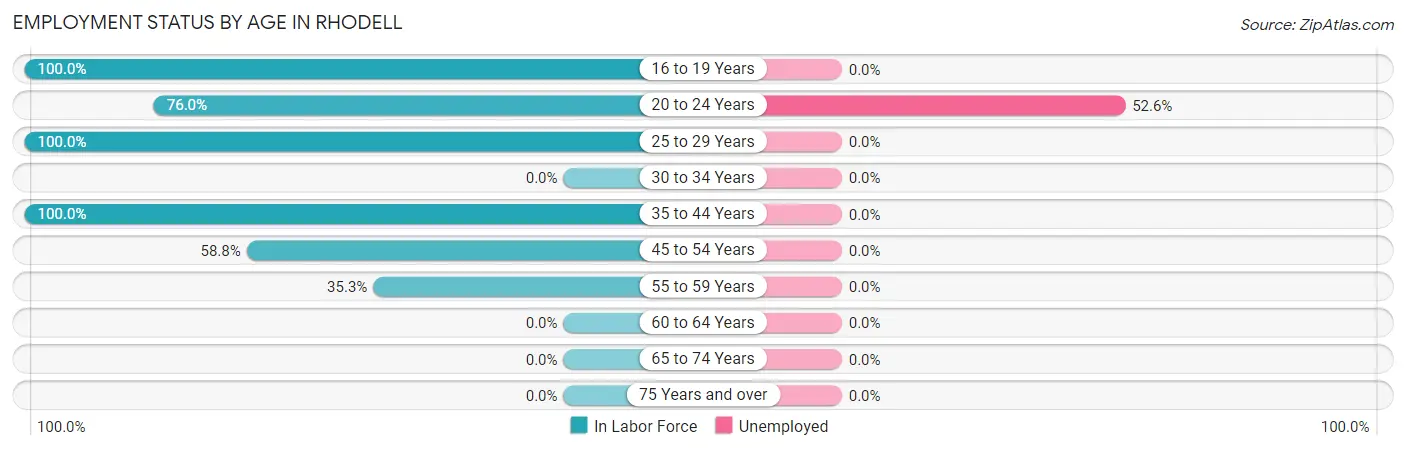
Employment Status by Age in Rhodell
According to the labor force statistics for Rhodell, out of the total population over 16 years of age (127), 52.8% or 67 individuals are in the labor force, with 14.9% or 10 of them unemployed. The age group with the highest labor force participation rate is 16 to 19 years, with 100.0% or 15 individuals in the labor force. Within the labor force, the 20 to 24 years age range has the highest percentage of unemployed individuals, with 52.6% or 10 of them being unemployed.
| Age Bracket | In Labor Force | Unemployed |
| 16 to 19 Years | 15 (100.0%) | 0 (0.0%) |
| 20 to 24 Years | 19 (76.0%) | 10 (52.6%) |
| 25 to 29 Years | 3 (100.0%) | 0 (0.0%) |
| 30 to 34 Years | 0 (0.0%) | 0 (0.0%) |
| 35 to 44 Years | 4 (100.0%) | 0 (0.0%) |
| 45 to 54 Years | 20 (58.8%) | 0 (0.0%) |
| 55 to 59 Years | 6 (35.3%) | 0 (0.0%) |
| 60 to 64 Years | 0 (0.0%) | 0 (0.0%) |
| 65 to 74 Years | 0 (0.0%) | 0 (0.0%) |
| 75 Years and over | 0 (0.0%) | 0 (0.0%) |
| Total | 67 (52.8%) | 10 (14.9%) |
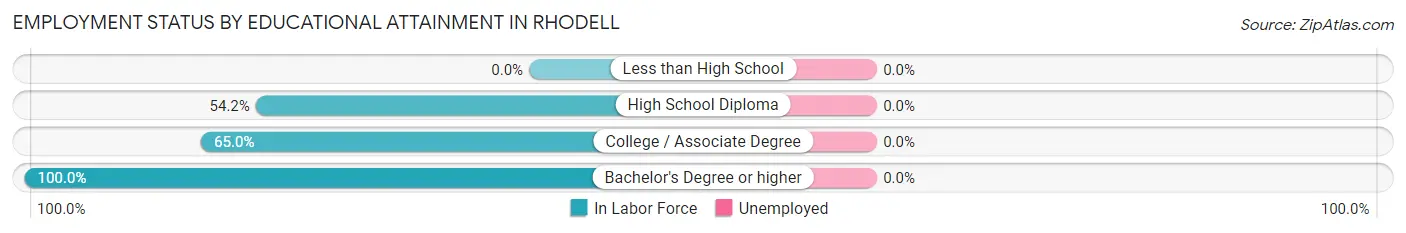
Employment Status by Educational Attainment in Rhodell
| Educational Attainment | In Labor Force | Unemployed |
| Less than High School | 0 (0.0%) | 0 (0.0%) |
| High School Diploma | 13 (54.2%) | 0 (0.0%) |
| College / Associate Degree | 13 (65.0%) | 0 (0.0%) |
| Bachelor's Degree or higher | 7 (100.0%) | 0 (0.0%) |
| Total | 33 (55.0%) | 0 (0.0%) |
Employment Occupations by Sex in Rhodell
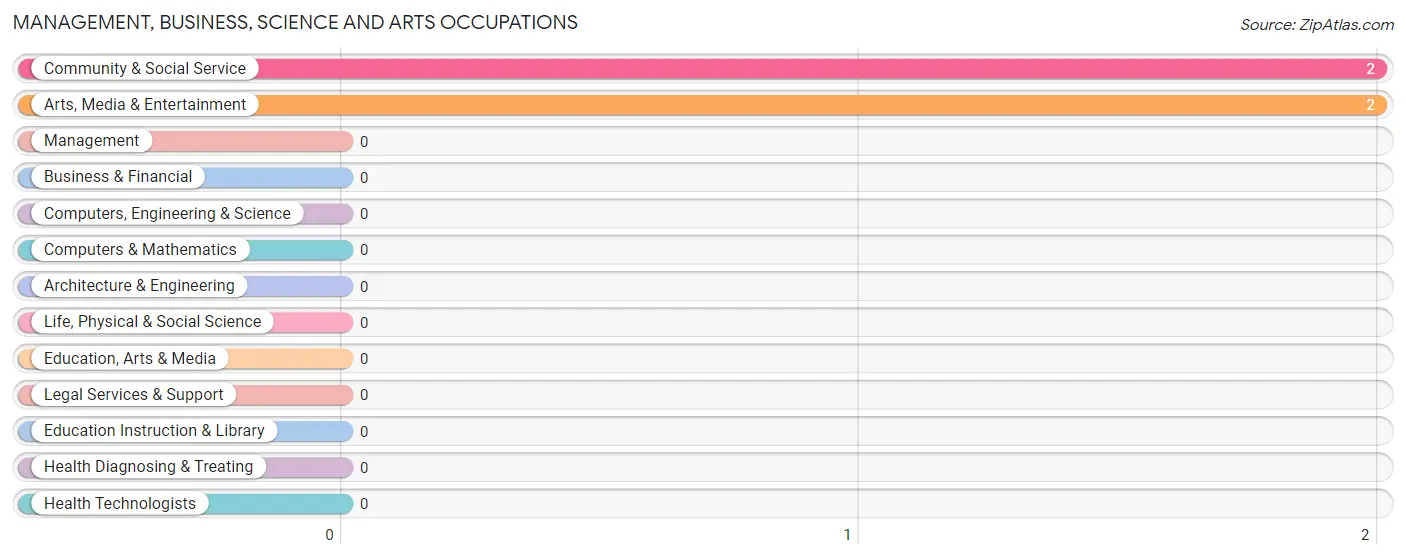
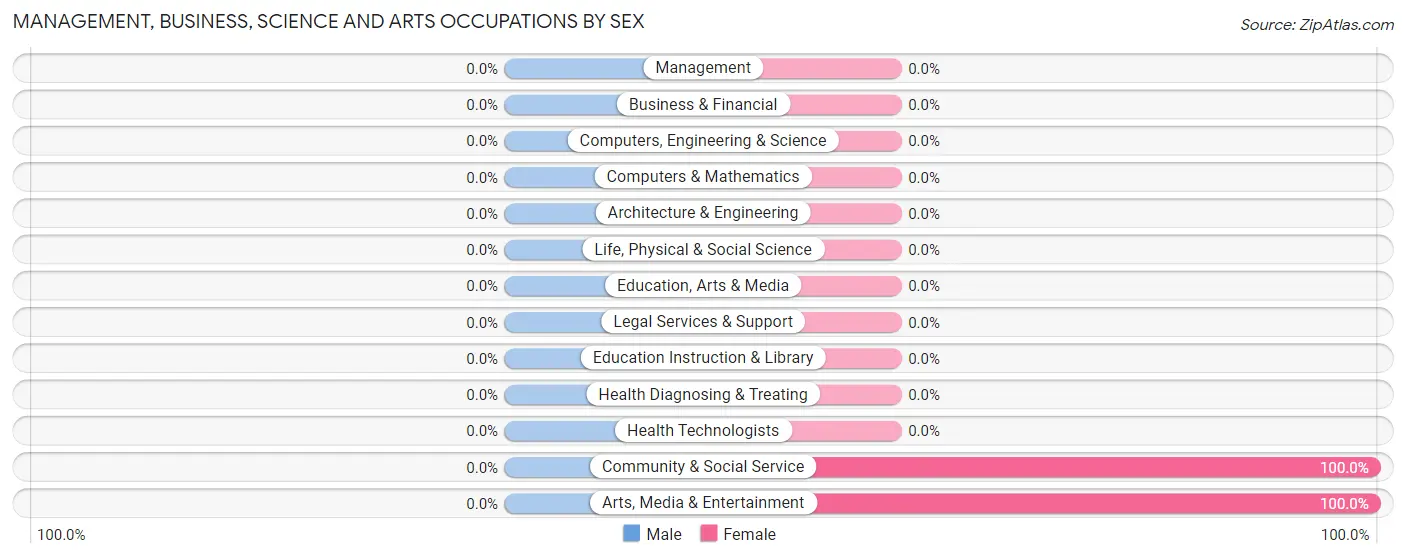
Management, Business, Science and Arts Occupations
The most common Management, Business, Science and Arts occupations in Rhodell are Community & Social Service (2 | 3.5%), and Arts, Media & Entertainment (2 | 3.5%).
Management, Business, Science and Arts Occupations by Sex
| Occupation | Male | Female |
| Management | 0 (0.0%) | 0 (0.0%) |
| Business & Financial | 0 (0.0%) | 0 (0.0%) |
| Computers, Engineering & Science | 0 (0.0%) | 0 (0.0%) |
| Computers & Mathematics | 0 (0.0%) | 0 (0.0%) |
| Architecture & Engineering | 0 (0.0%) | 0 (0.0%) |
| Life, Physical & Social Science | 0 (0.0%) | 0 (0.0%) |
| Community & Social Service | 0 (0.0%) | 2 (100.0%) |
| Education, Arts & Media | 0 (0.0%) | 0 (0.0%) |
| Legal Services & Support | 0 (0.0%) | 0 (0.0%) |
| Education Instruction & Library | 0 (0.0%) | 0 (0.0%) |
| Arts, Media & Entertainment | 0 (0.0%) | 2 (100.0%) |
| Health Diagnosing & Treating | 0 (0.0%) | 0 (0.0%) |
| Health Technologists | 0 (0.0%) | 0 (0.0%) |
| Total (Category) | 0 (0.0%) | 2 (100.0%) |
| Total (Overall) | 26 (45.6%) | 31 (54.4%) |
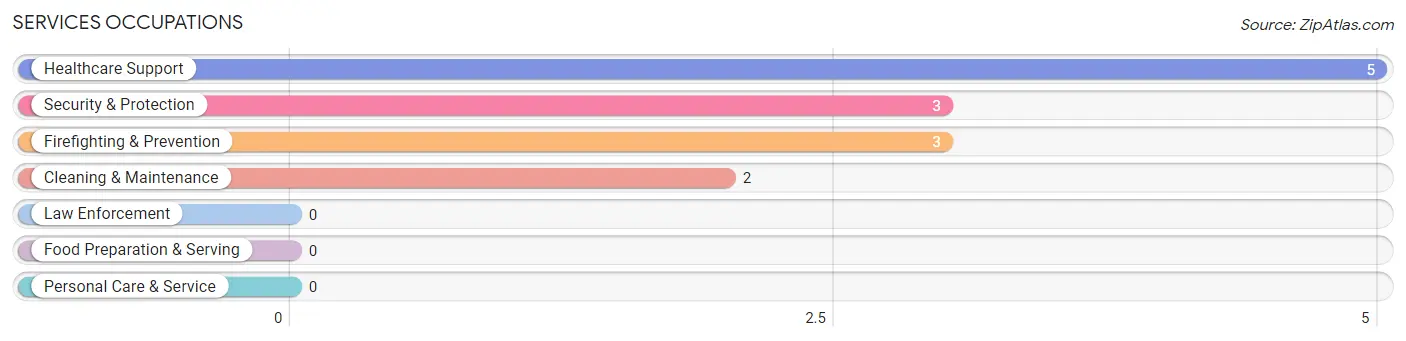
Services Occupations
The most common Services occupations in Rhodell are Healthcare Support (5 | 8.8%), Security & Protection (3 | 5.3%), Firefighting & Prevention (3 | 5.3%), and Cleaning & Maintenance (2 | 3.5%).
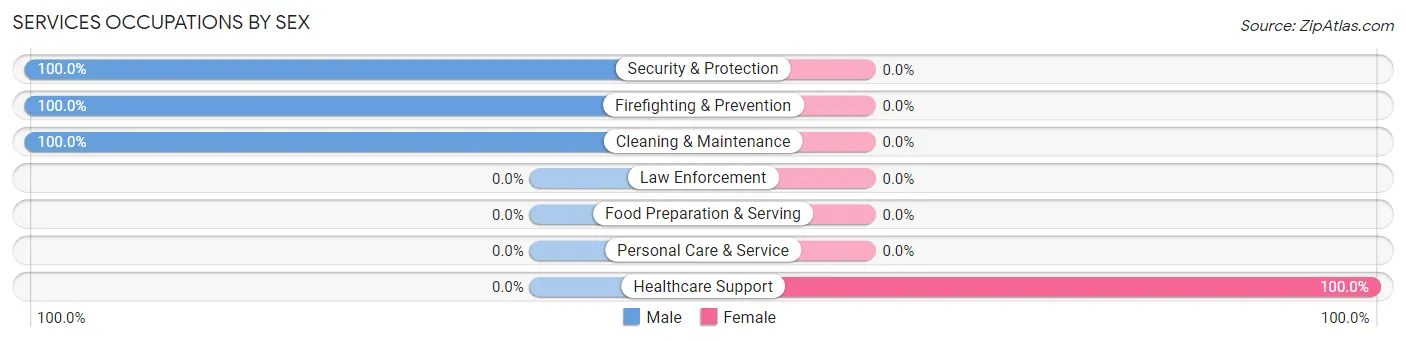
Services Occupations by Sex
| Occupation | Male | Female |
| Healthcare Support | 0 (0.0%) | 5 (100.0%) |
| Security & Protection | 3 (100.0%) | 0 (0.0%) |
| Firefighting & Prevention | 3 (100.0%) | 0 (0.0%) |
| Law Enforcement | 0 (0.0%) | 0 (0.0%) |
| Food Preparation & Serving | 0 (0.0%) | 0 (0.0%) |
| Cleaning & Maintenance | 2 (100.0%) | 0 (0.0%) |
| Personal Care & Service | 0 (0.0%) | 0 (0.0%) |
| Total (Category) | 5 (50.0%) | 5 (50.0%) |
| Total (Overall) | 26 (45.6%) | 31 (54.4%) |
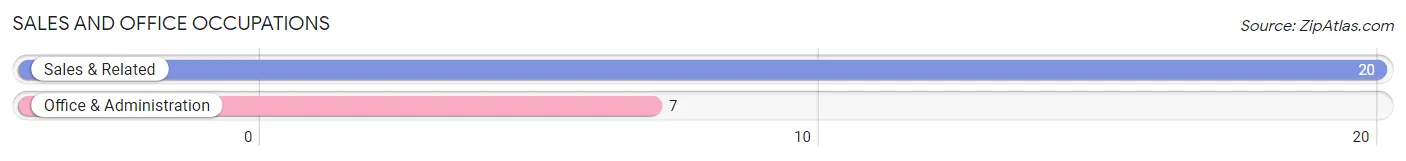
Sales and Office Occupations
The most common Sales and Office occupations in Rhodell are Sales & Related (20 | 35.1%), and Office & Administration (7 | 12.3%).
Sales and Office Occupations by Sex
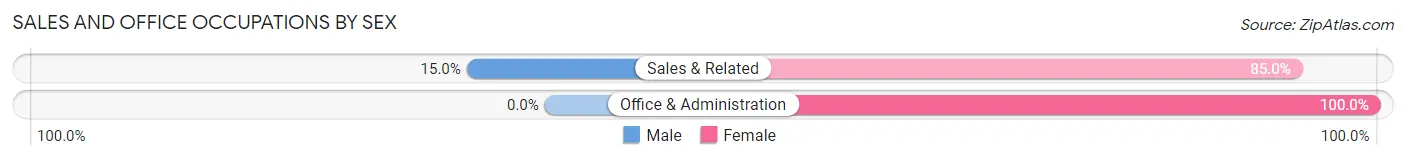
| Occupation | Male | Female |
| Sales & Related | 3 (15.0%) | 17 (85.0%) |
| Office & Administration | 0 (0.0%) | 7 (100.0%) |
| Total (Category) | 3 (11.1%) | 24 (88.9%) |
| Total (Overall) | 26 (45.6%) | 31 (54.4%) |
Natural Resources, Construction and Maintenance Occupations
The most common Natural Resources, Construction and Maintenance occupations in Rhodell are Construction & Extraction (10 | 17.5%), and Installation, Maintenance & Repair (8 | 14.0%).
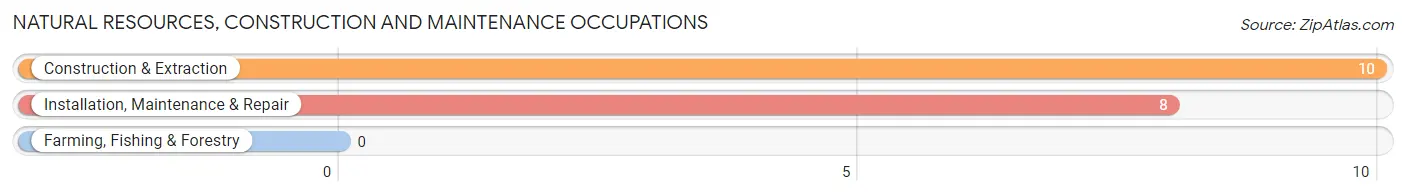
Natural Resources, Construction and Maintenance Occupations by Sex
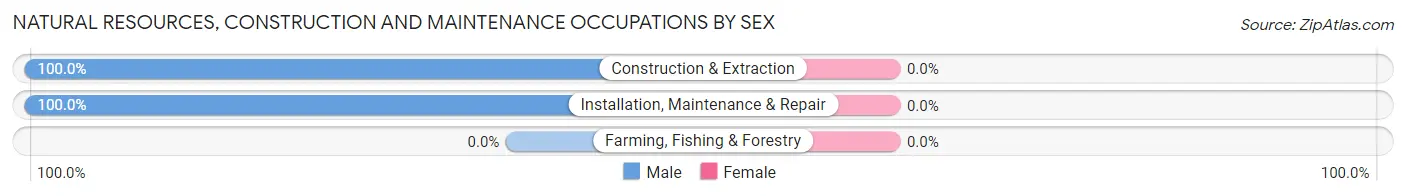
| Occupation | Male | Female |
| Farming, Fishing & Forestry | 0 (0.0%) | 0 (0.0%) |
| Construction & Extraction | 10 (100.0%) | 0 (0.0%) |
| Installation, Maintenance & Repair | 8 (100.0%) | 0 (0.0%) |
| Total (Category) | 18 (100.0%) | 0 (0.0%) |
| Total (Overall) | 26 (45.6%) | 31 (54.4%) |
Production, Transportation and Moving Occupations
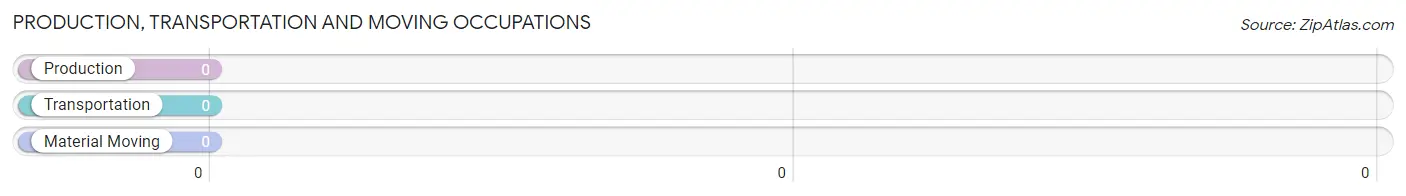
Production, Transportation and Moving Occupations by Sex
| Occupation | Male | Female |
| Production | 0 (0.0%) | 0 (0.0%) |
| Transportation | 0 (0.0%) | 0 (0.0%) |
| Material Moving | 0 (0.0%) | 0 (0.0%) |
| Total (Category) | 0 (0.0%) | 0 (0.0%) |
| Total (Overall) | 26 (45.6%) | 31 (54.4%) |
Employment Industries by Sex in Rhodell
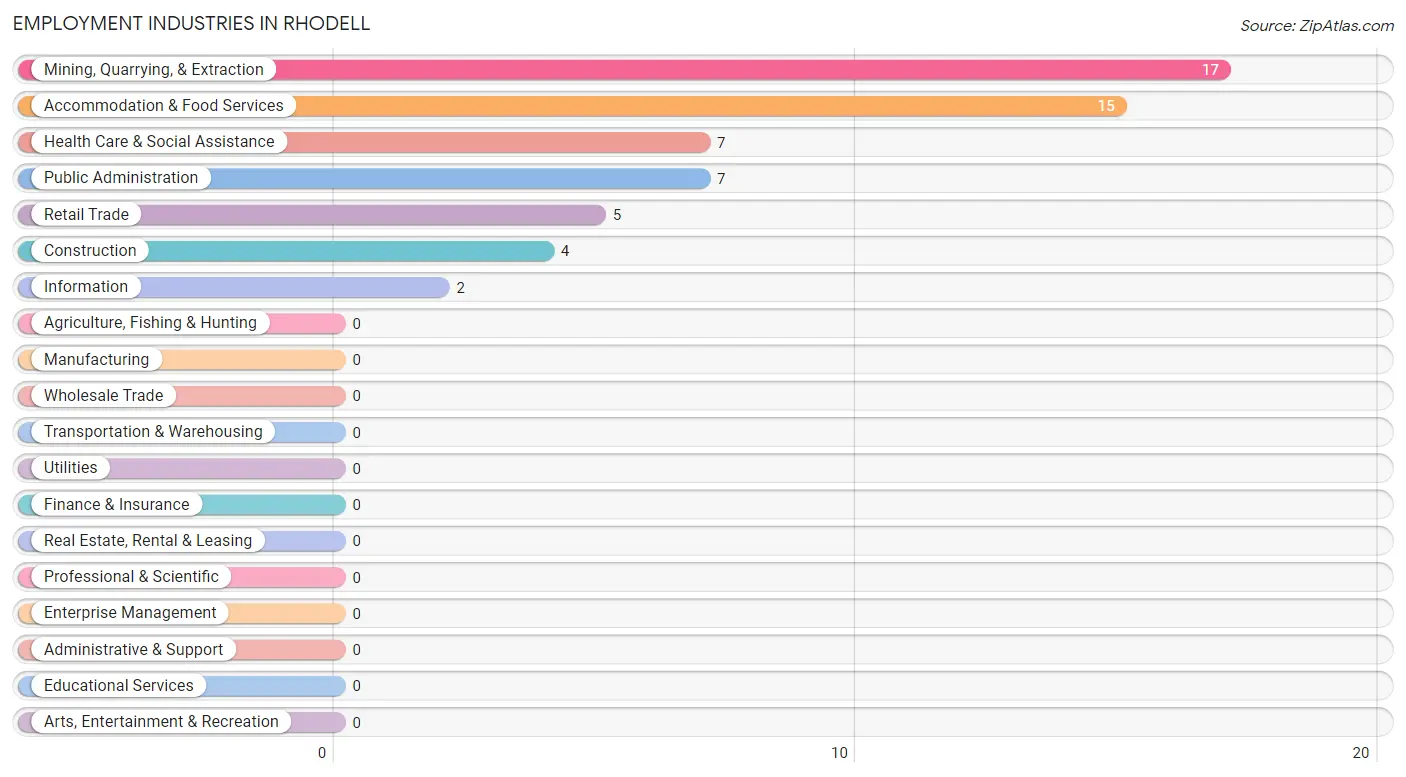
Employment Industries in Rhodell
The major employment industries in Rhodell include Mining, Quarrying, & Extraction (17 | 29.8%), Accommodation & Food Services (15 | 26.3%), Health Care & Social Assistance (7 | 12.3%), Public Administration (7 | 12.3%), and Retail Trade (5 | 8.8%).
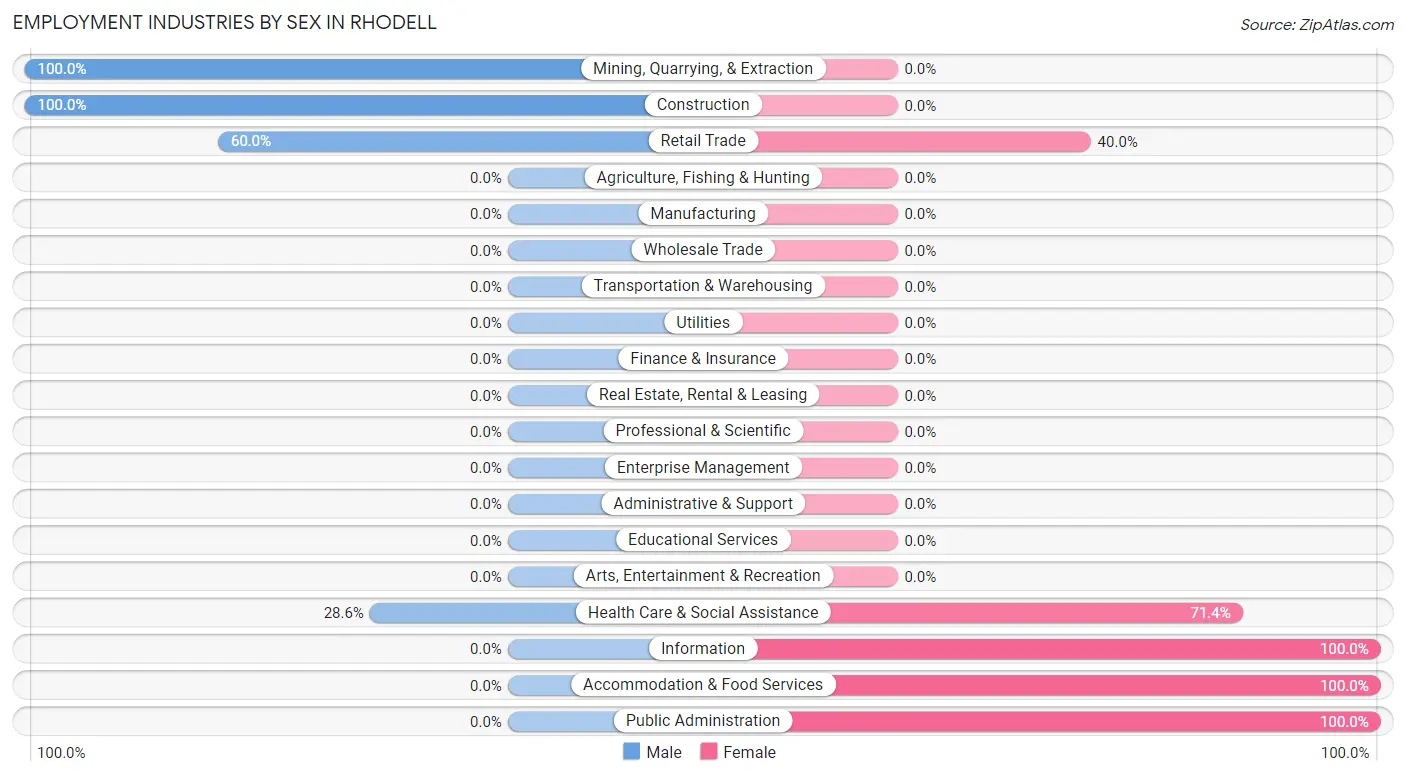
Employment Industries by Sex in Rhodell
The Rhodell industries that see more men than women are Mining, Quarrying, & Extraction (100.0%), Construction (100.0%), and Retail Trade (60.0%), whereas the industries that tend to have a higher number of women are Information (100.0%), Accommodation & Food Services (100.0%), and Public Administration (100.0%).
| Industry | Male | Female |
| Agriculture, Fishing & Hunting | 0 (0.0%) | 0 (0.0%) |
| Mining, Quarrying, & Extraction | 17 (100.0%) | 0 (0.0%) |
| Construction | 4 (100.0%) | 0 (0.0%) |
| Manufacturing | 0 (0.0%) | 0 (0.0%) |
| Wholesale Trade | 0 (0.0%) | 0 (0.0%) |
| Retail Trade | 3 (60.0%) | 2 (40.0%) |
| Transportation & Warehousing | 0 (0.0%) | 0 (0.0%) |
| Utilities | 0 (0.0%) | 0 (0.0%) |
| Information | 0 (0.0%) | 2 (100.0%) |
| Finance & Insurance | 0 (0.0%) | 0 (0.0%) |
| Real Estate, Rental & Leasing | 0 (0.0%) | 0 (0.0%) |
| Professional & Scientific | 0 (0.0%) | 0 (0.0%) |
| Enterprise Management | 0 (0.0%) | 0 (0.0%) |
| Administrative & Support | 0 (0.0%) | 0 (0.0%) |
| Educational Services | 0 (0.0%) | 0 (0.0%) |
| Health Care & Social Assistance | 2 (28.6%) | 5 (71.4%) |
| Arts, Entertainment & Recreation | 0 (0.0%) | 0 (0.0%) |
| Accommodation & Food Services | 0 (0.0%) | 15 (100.0%) |
| Public Administration | 0 (0.0%) | 7 (100.0%) |
| Total | 26 (45.6%) | 31 (54.4%) |
Education in Rhodell
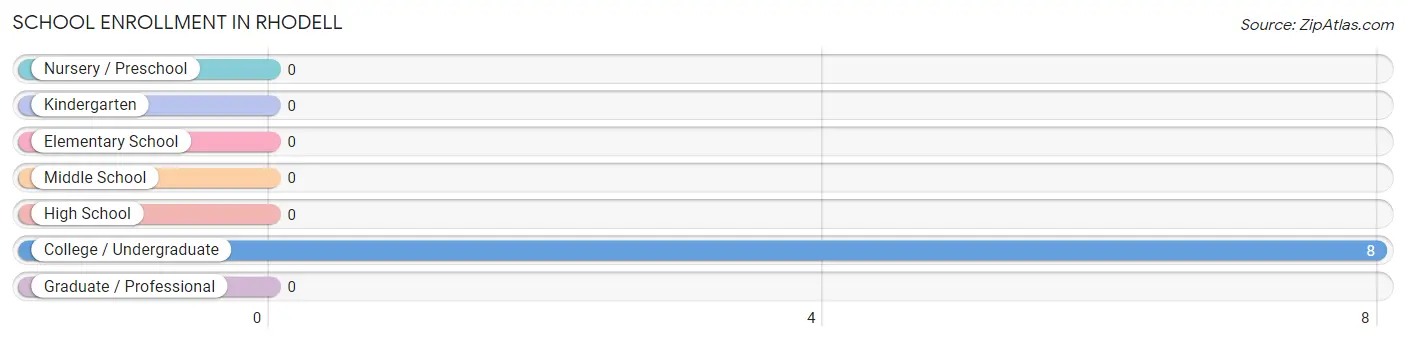
School Enrollment in Rhodell
| School Level | # Students | % Students |
| Nursery / Preschool | 0 | 0.0% |
| Kindergarten | 0 | 0.0% |
| Elementary School | 0 | 0.0% |
| Middle School | 0 | 0.0% |
| High School | 0 | 0.0% |
| College / Undergraduate | 8 | 100.0% |
| Graduate / Professional | 0 | 0.0% |
| Total | 8 | 100.0% |
School Enrollment by Age by Funding Source in Rhodell
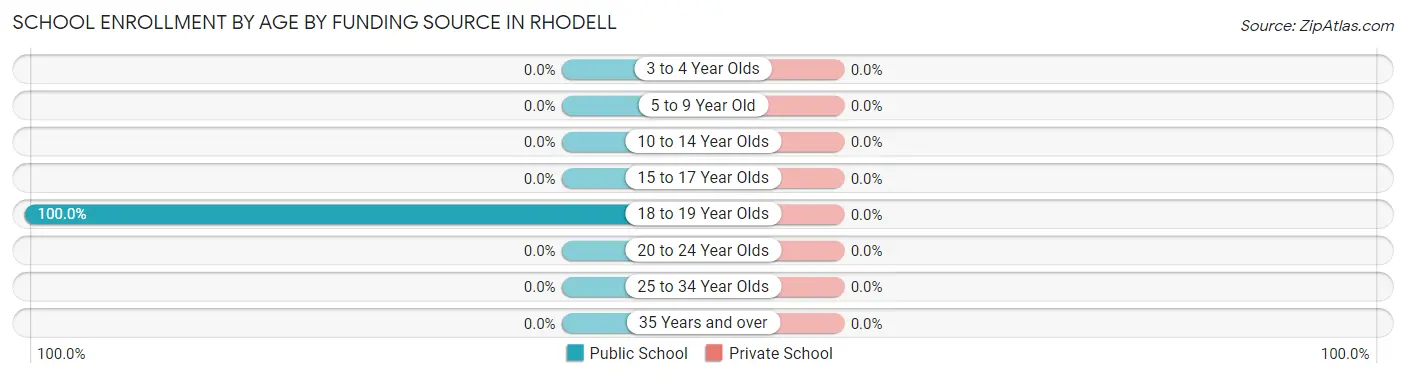
| Age Bracket | Public School | Private School |
| 3 to 4 Year Olds | 0 (0.0%) | 0 (0.0%) |
| 5 to 9 Year Old | 0 (0.0%) | 0 (0.0%) |
| 10 to 14 Year Olds | 0 (0.0%) | 0 (0.0%) |
| 15 to 17 Year Olds | 0 (0.0%) | 0 (0.0%) |
| 18 to 19 Year Olds | 8 (100.0%) | 0 (0.0%) |
| 20 to 24 Year Olds | 0 (0.0%) | 0 (0.0%) |
| 25 to 34 Year Olds | 0 (0.0%) | 0 (0.0%) |
| 35 Years and over | 0 (0.0%) | 0 (0.0%) |
| Total | 8 (100.0%) | 0 (0.0%) |
Educational Attainment by Field of Study in Rhodell
, and communications (7 | 100.0%) are the most common fields of study among 7 individuals in Rhodell who have obtained a bachelor's degree or higher.
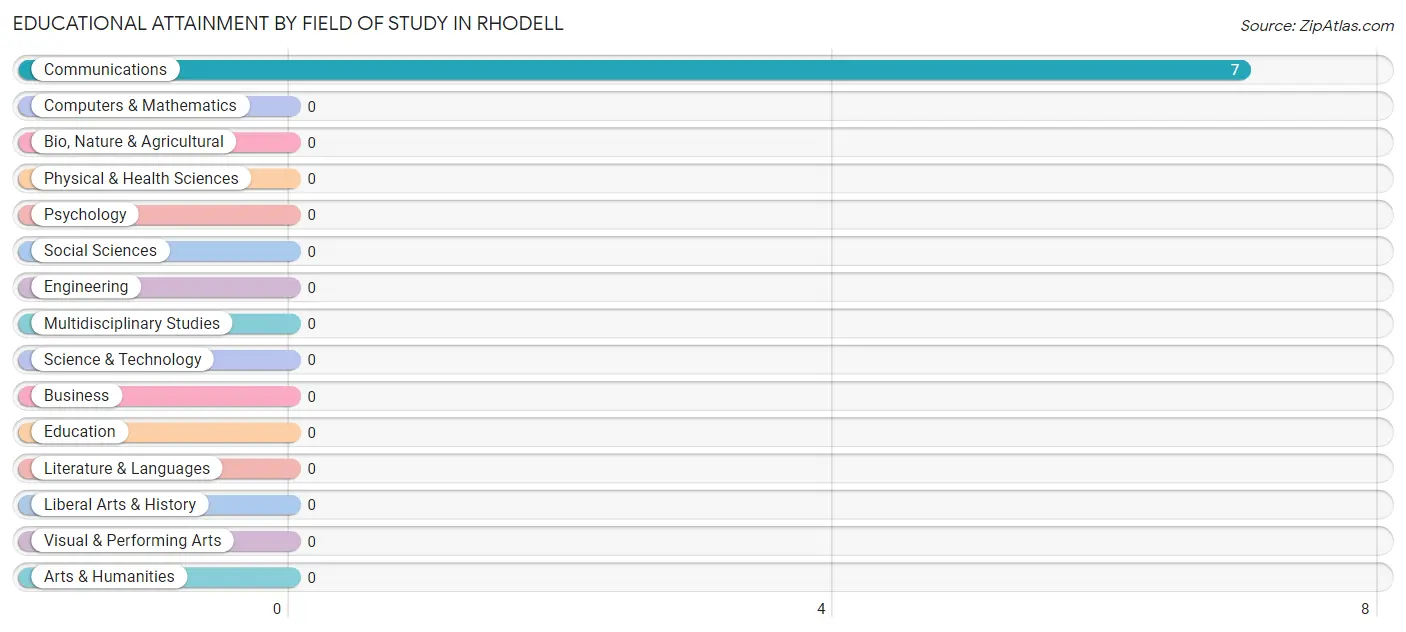
| Field of Study | # Graduates | % Graduates |
| Computers & Mathematics | 0 | 0.0% |
| Bio, Nature & Agricultural | 0 | 0.0% |
| Physical & Health Sciences | 0 | 0.0% |
| Psychology | 0 | 0.0% |
| Social Sciences | 0 | 0.0% |
| Engineering | 0 | 0.0% |
| Multidisciplinary Studies | 0 | 0.0% |
| Science & Technology | 0 | 0.0% |
| Business | 0 | 0.0% |
| Education | 0 | 0.0% |
| Literature & Languages | 0 | 0.0% |
| Liberal Arts & History | 0 | 0.0% |
| Visual & Performing Arts | 0 | 0.0% |
| Communications | 7 | 100.0% |
| Arts & Humanities | 0 | 0.0% |
| Total | 7 | 100.0% |
Transportation & Commute in Rhodell
Vehicle Availability by Sex in Rhodell
The most prevalent vehicle ownership categories in Rhodell are males with 1 vehicle (11, accounting for 42.3%) and females with 1 vehicle (20, making up 35.5%).
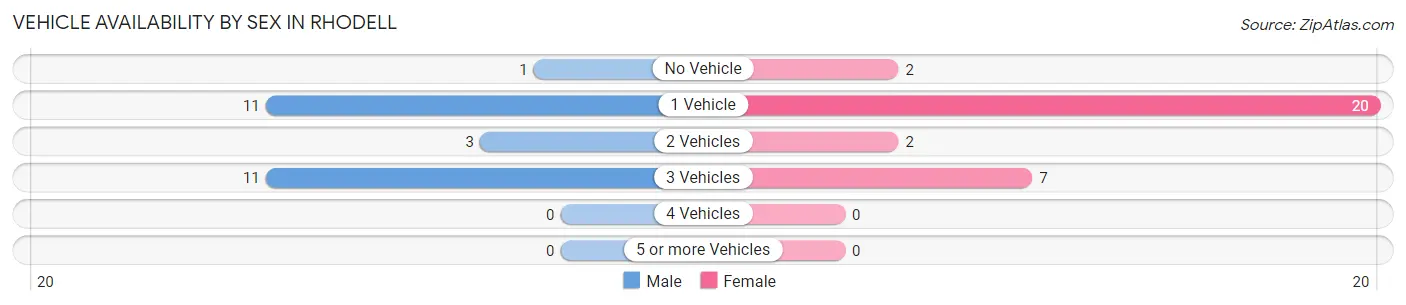
| Vehicles Available | Male | Female |
| No Vehicle | 1 (3.8%) | 2 (6.5%) |
| 1 Vehicle | 11 (42.3%) | 20 (64.5%) |
| 2 Vehicles | 3 (11.5%) | 2 (6.5%) |
| 3 Vehicles | 11 (42.3%) | 7 (22.6%) |
| 4 Vehicles | 0 (0.0%) | 0 (0.0%) |
| 5 or more Vehicles | 0 (0.0%) | 0 (0.0%) |
| Total | 26 (100.0%) | 31 (100.0%) |
Commute Time in Rhodell
The most frequently occuring commute durations in Rhodell are 15 to 19 minutes (18 commuters, 31.6%), 30 to 34 minutes (14 commuters, 24.6%), and 40 to 44 minutes (8 commuters, 14.0%).
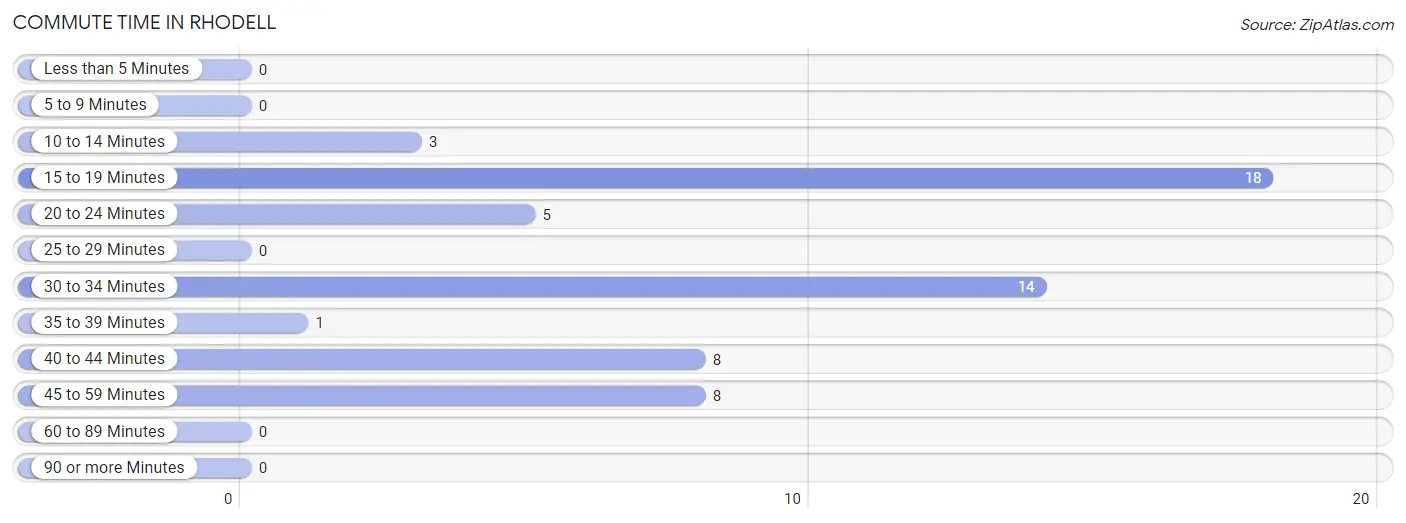
| Commute Time | # Commuters | % Commuters |
| Less than 5 Minutes | 0 | 0.0% |
| 5 to 9 Minutes | 0 | 0.0% |
| 10 to 14 Minutes | 3 | 5.3% |
| 15 to 19 Minutes | 18 | 31.6% |
| 20 to 24 Minutes | 5 | 8.8% |
| 25 to 29 Minutes | 0 | 0.0% |
| 30 to 34 Minutes | 14 | 24.6% |
| 35 to 39 Minutes | 1 | 1.8% |
| 40 to 44 Minutes | 8 | 14.0% |
| 45 to 59 Minutes | 8 | 14.0% |
| 60 to 89 Minutes | 0 | 0.0% |
| 90 or more Minutes | 0 | 0.0% |
Commute Time by Sex in Rhodell
The most common commute times in Rhodell are 15 to 19 minutes (9 commuters, 34.6%) for males and 30 to 34 minutes (12 commuters, 38.7%) for females.
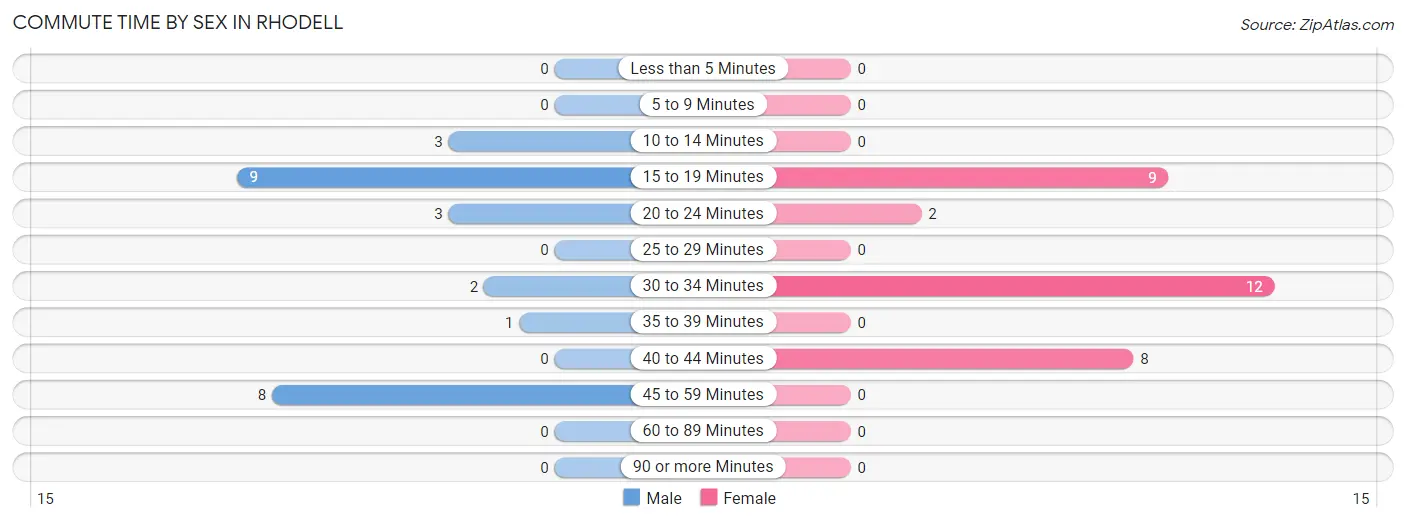
| Commute Time | Male | Female |
| Less than 5 Minutes | 0 (0.0%) | 0 (0.0%) |
| 5 to 9 Minutes | 0 (0.0%) | 0 (0.0%) |
| 10 to 14 Minutes | 3 (11.5%) | 0 (0.0%) |
| 15 to 19 Minutes | 9 (34.6%) | 9 (29.0%) |
| 20 to 24 Minutes | 3 (11.5%) | 2 (6.5%) |
| 25 to 29 Minutes | 0 (0.0%) | 0 (0.0%) |
| 30 to 34 Minutes | 2 (7.7%) | 12 (38.7%) |
| 35 to 39 Minutes | 1 (3.8%) | 0 (0.0%) |
| 40 to 44 Minutes | 0 (0.0%) | 8 (25.8%) |
| 45 to 59 Minutes | 8 (30.8%) | 0 (0.0%) |
| 60 to 89 Minutes | 0 (0.0%) | 0 (0.0%) |
| 90 or more Minutes | 0 (0.0%) | 0 (0.0%) |
Time of Departure to Work by Sex in Rhodell
The most frequent times of departure to work in Rhodell are 6:00 AM to 6:29 AM (9, 34.6%) for males and 9:00 AM to 9:59 AM (8, 25.8%) for females.
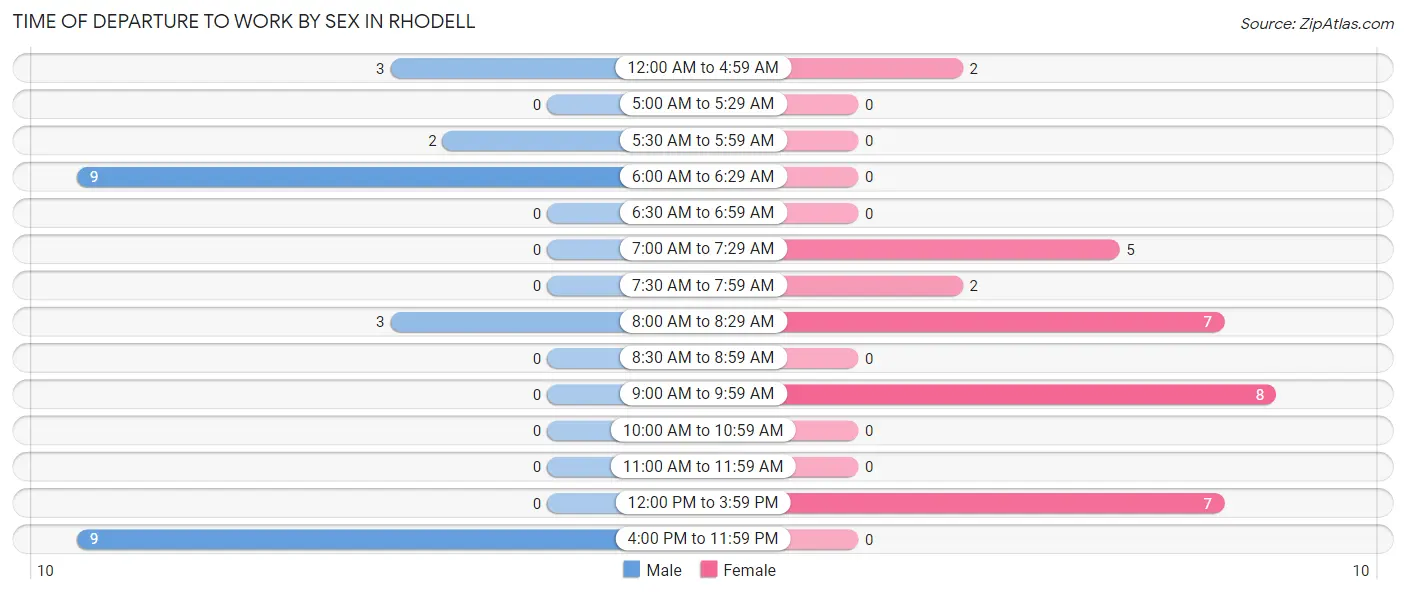
| Time of Departure | Male | Female |
| 12:00 AM to 4:59 AM | 3 (11.5%) | 2 (6.5%) |
| 5:00 AM to 5:29 AM | 0 (0.0%) | 0 (0.0%) |
| 5:30 AM to 5:59 AM | 2 (7.7%) | 0 (0.0%) |
| 6:00 AM to 6:29 AM | 9 (34.6%) | 0 (0.0%) |
| 6:30 AM to 6:59 AM | 0 (0.0%) | 0 (0.0%) |
| 7:00 AM to 7:29 AM | 0 (0.0%) | 5 (16.1%) |
| 7:30 AM to 7:59 AM | 0 (0.0%) | 2 (6.5%) |
| 8:00 AM to 8:29 AM | 3 (11.5%) | 7 (22.6%) |
| 8:30 AM to 8:59 AM | 0 (0.0%) | 0 (0.0%) |
| 9:00 AM to 9:59 AM | 0 (0.0%) | 8 (25.8%) |
| 10:00 AM to 10:59 AM | 0 (0.0%) | 0 (0.0%) |
| 11:00 AM to 11:59 AM | 0 (0.0%) | 0 (0.0%) |
| 12:00 PM to 3:59 PM | 0 (0.0%) | 7 (22.6%) |
| 4:00 PM to 11:59 PM | 9 (34.6%) | 0 (0.0%) |
| Total | 26 (100.0%) | 31 (100.0%) |
Housing Occupancy in Rhodell
Occupancy by Ownership in Rhodell
Of the total 58 dwellings in Rhodell, owner-occupied units account for 39 (67.2%), while renter-occupied units make up 19 (32.8%).
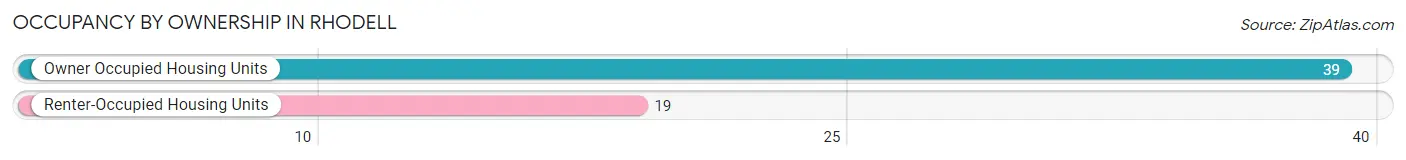
| Occupancy | # Housing Units | % Housing Units |
| Owner Occupied Housing Units | 39 | 67.2% |
| Renter-Occupied Housing Units | 19 | 32.8% |
| Total Occupied Housing Units | 58 | 100.0% |
Occupancy by Household Size in Rhodell
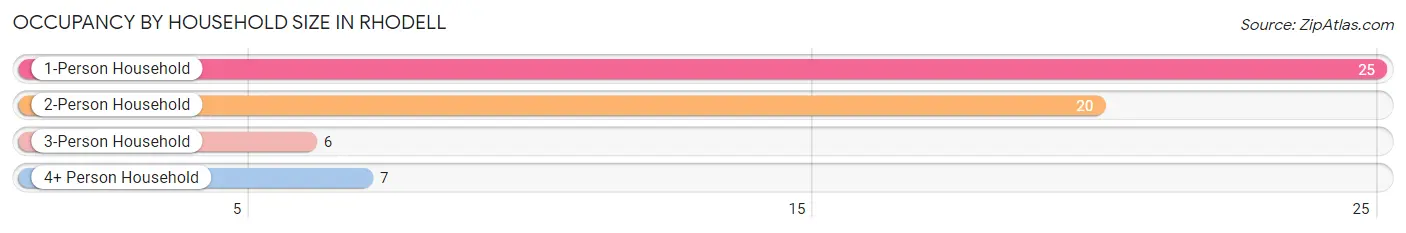
| Household Size | # Housing Units | % Housing Units |
| 1-Person Household | 25 | 43.1% |
| 2-Person Household | 20 | 34.5% |
| 3-Person Household | 6 | 10.3% |
| 4+ Person Household | 7 | 12.1% |
| Total Housing Units | 58 | 100.0% |
Occupancy by Ownership by Household Size in Rhodell
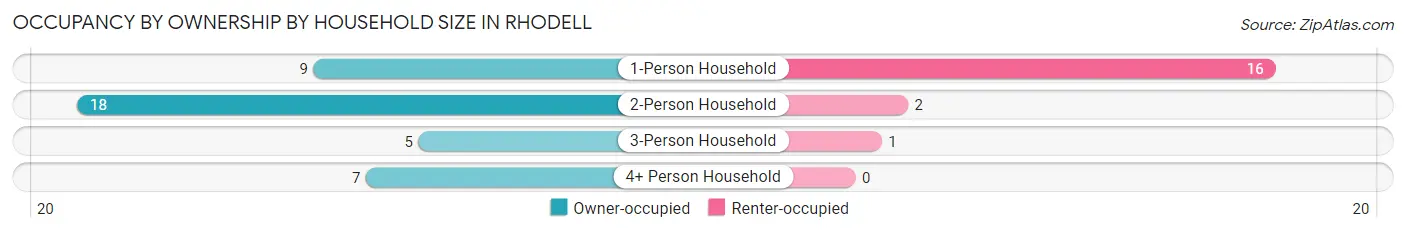
| Household Size | Owner-occupied | Renter-occupied |
| 1-Person Household | 9 (36.0%) | 16 (64.0%) |
| 2-Person Household | 18 (90.0%) | 2 (10.0%) |
| 3-Person Household | 5 (83.3%) | 1 (16.7%) |
| 4+ Person Household | 7 (100.0%) | 0 (0.0%) |
| Total Housing Units | 39 (67.2%) | 19 (32.8%) |
Occupancy by Educational Attainment in Rhodell
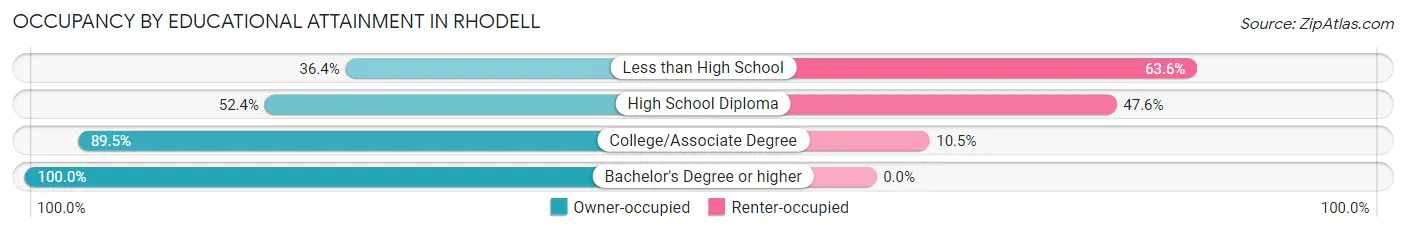
| Household Size | Owner-occupied | Renter-occupied |
| Less than High School | 4 (36.4%) | 7 (63.6%) |
| High School Diploma | 11 (52.4%) | 10 (47.6%) |
| College/Associate Degree | 17 (89.5%) | 2 (10.5%) |
| Bachelor's Degree or higher | 7 (100.0%) | 0 (0.0%) |
Occupancy by Age of Householder in Rhodell
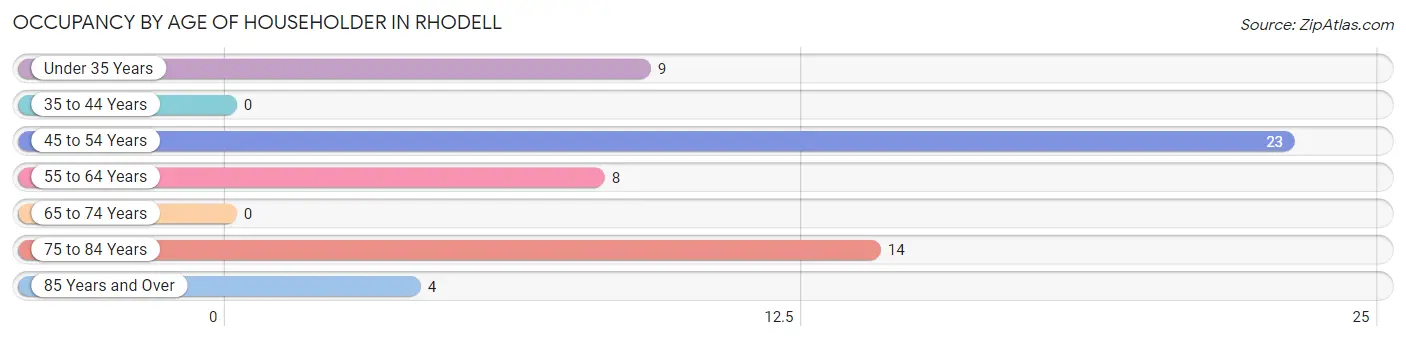
| Age Bracket | # Households | % Households |
| Under 35 Years | 9 | 15.5% |
| 35 to 44 Years | 0 | 0.0% |
| 45 to 54 Years | 23 | 39.7% |
| 55 to 64 Years | 8 | 13.8% |
| 65 to 74 Years | 0 | 0.0% |
| 75 to 84 Years | 14 | 24.1% |
| 85 Years and Over | 4 | 6.9% |
| Total | 58 | 100.0% |
Housing Finances in Rhodell
Median Income by Occupancy in Rhodell
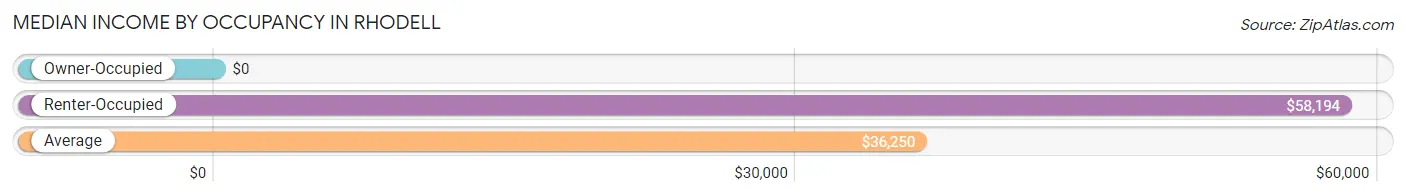
| Occupancy Type | # Households | Median Income |
| Owner-Occupied | 39 (67.2%) | $0 |
| Renter-Occupied | 19 (32.8%) | $58,194 |
| Average | 58 (100.0%) | $36,250 |
Occupancy by Householder Income Bracket in Rhodell
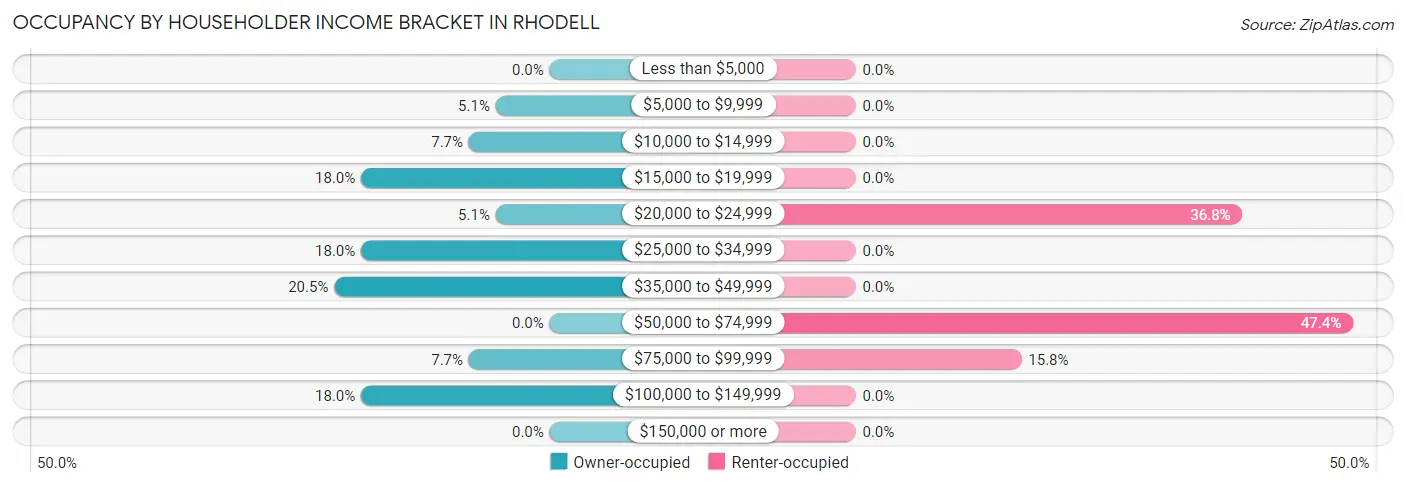
| Income Bracket | Owner-occupied | Renter-occupied |
| Less than $5,000 | 0 (0.0%) | 0 (0.0%) |
| $5,000 to $9,999 | 2 (5.1%) | 0 (0.0%) |
| $10,000 to $14,999 | 3 (7.7%) | 0 (0.0%) |
| $15,000 to $19,999 | 7 (17.9%) | 0 (0.0%) |
| $20,000 to $24,999 | 2 (5.1%) | 7 (36.8%) |
| $25,000 to $34,999 | 7 (17.9%) | 0 (0.0%) |
| $35,000 to $49,999 | 8 (20.5%) | 0 (0.0%) |
| $50,000 to $74,999 | 0 (0.0%) | 9 (47.4%) |
| $75,000 to $99,999 | 3 (7.7%) | 3 (15.8%) |
| $100,000 to $149,999 | 7 (17.9%) | 0 (0.0%) |
| $150,000 or more | 0 (0.0%) | 0 (0.0%) |
| Total | 39 (100.0%) | 19 (100.0%) |
Monthly Housing Cost Tiers in Rhodell
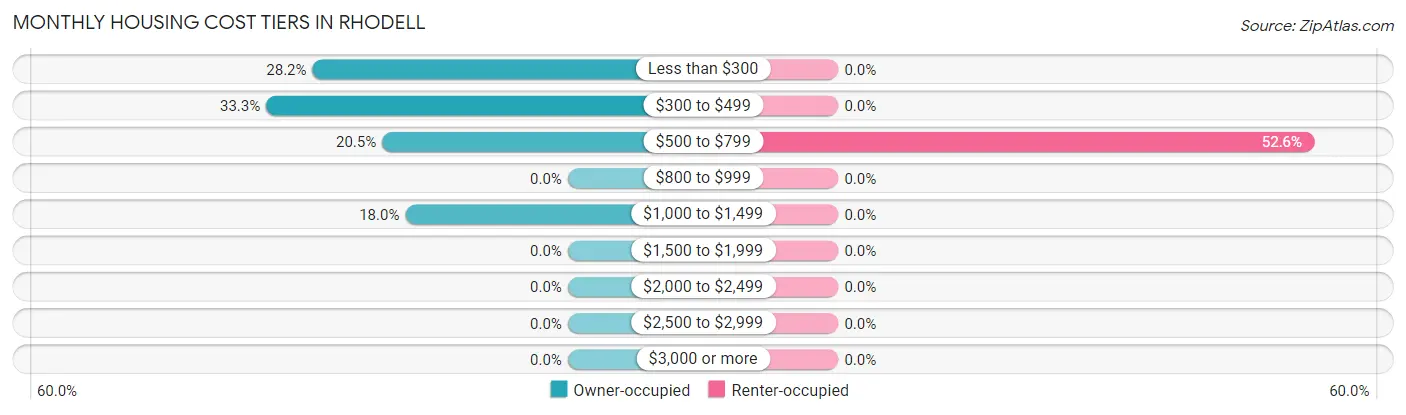
| Monthly Cost | Owner-occupied | Renter-occupied |
| Less than $300 | 11 (28.2%) | 0 (0.0%) |
| $300 to $499 | 13 (33.3%) | 0 (0.0%) |
| $500 to $799 | 8 (20.5%) | 10 (52.6%) |
| $800 to $999 | 0 (0.0%) | 0 (0.0%) |
| $1,000 to $1,499 | 7 (17.9%) | 0 (0.0%) |
| $1,500 to $1,999 | 0 (0.0%) | 0 (0.0%) |
| $2,000 to $2,499 | 0 (0.0%) | 0 (0.0%) |
| $2,500 to $2,999 | 0 (0.0%) | 0 (0.0%) |
| $3,000 or more | 0 (0.0%) | 0 (0.0%) |
| Total | 39 (100.0%) | 19 (100.0%) |
Physical Housing Characteristics in Rhodell
Housing Structures in Rhodell
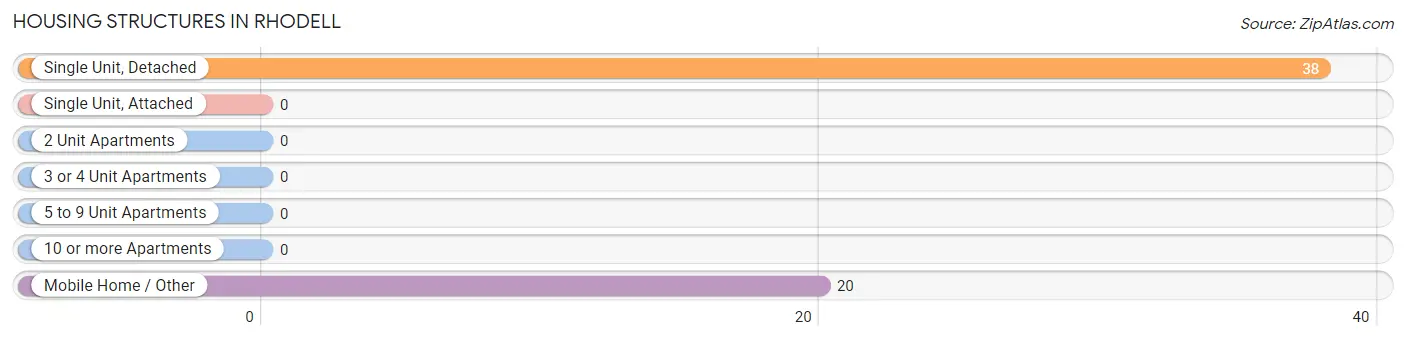
| Structure Type | # Housing Units | % Housing Units |
| Single Unit, Detached | 38 | 65.5% |
| Single Unit, Attached | 0 | 0.0% |
| 2 Unit Apartments | 0 | 0.0% |
| 3 or 4 Unit Apartments | 0 | 0.0% |
| 5 to 9 Unit Apartments | 0 | 0.0% |
| 10 or more Apartments | 0 | 0.0% |
| Mobile Home / Other | 20 | 34.5% |
| Total | 58 | 100.0% |
Housing Structures by Occupancy in Rhodell
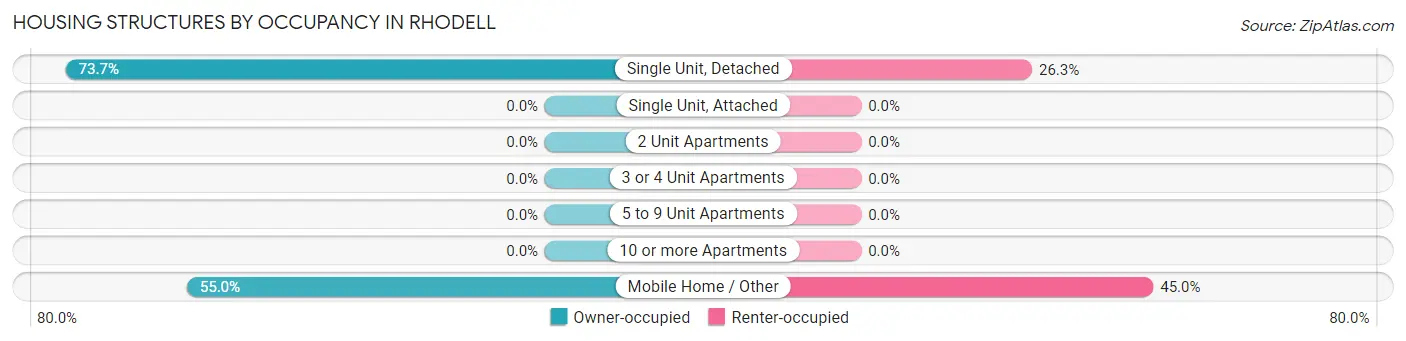
| Structure Type | Owner-occupied | Renter-occupied |
| Single Unit, Detached | 28 (73.7%) | 10 (26.3%) |
| Single Unit, Attached | 0 (0.0%) | 0 (0.0%) |
| 2 Unit Apartments | 0 (0.0%) | 0 (0.0%) |
| 3 or 4 Unit Apartments | 0 (0.0%) | 0 (0.0%) |
| 5 to 9 Unit Apartments | 0 (0.0%) | 0 (0.0%) |
| 10 or more Apartments | 0 (0.0%) | 0 (0.0%) |
| Mobile Home / Other | 11 (55.0%) | 9 (45.0%) |
| Total | 39 (67.2%) | 19 (32.8%) |
Housing Structures by Number of Rooms in Rhodell
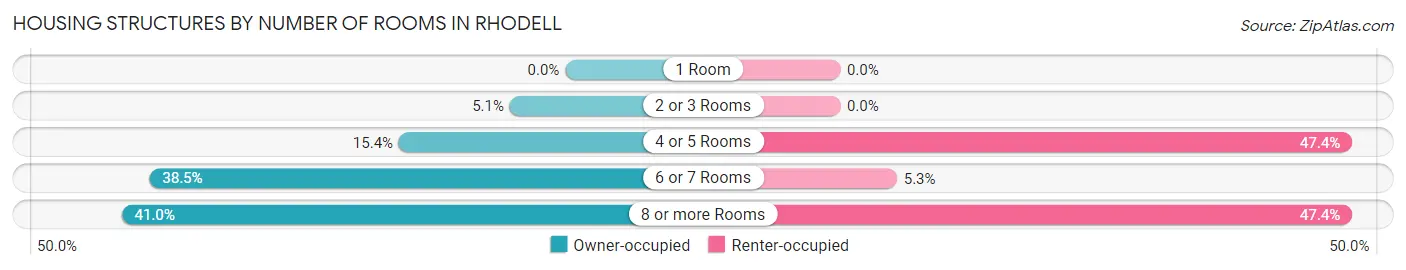
| Number of Rooms | Owner-occupied | Renter-occupied |
| 1 Room | 0 (0.0%) | 0 (0.0%) |
| 2 or 3 Rooms | 2 (5.1%) | 0 (0.0%) |
| 4 or 5 Rooms | 6 (15.4%) | 9 (47.4%) |
| 6 or 7 Rooms | 15 (38.5%) | 1 (5.3%) |
| 8 or more Rooms | 16 (41.0%) | 9 (47.4%) |
| Total | 39 (100.0%) | 19 (100.0%) |
Housing Structure by Heating Type in Rhodell
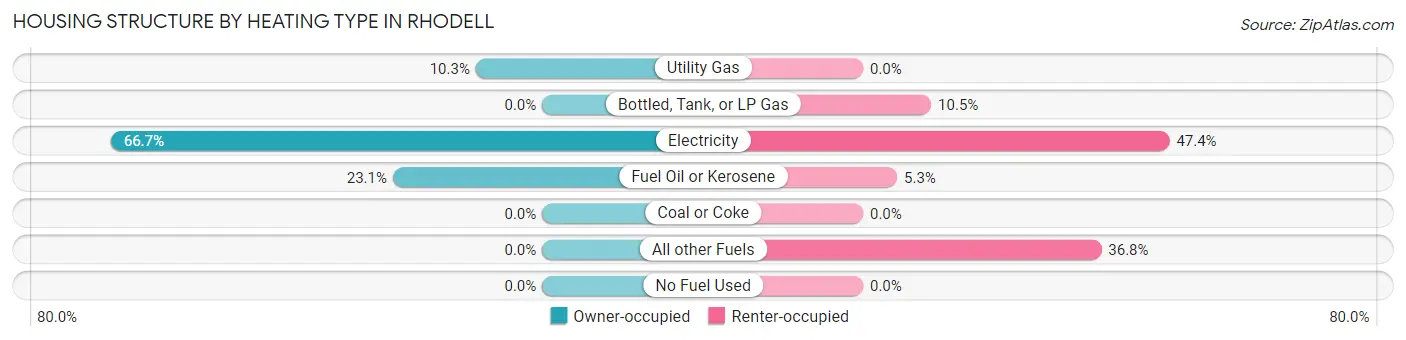
| Heating Type | Owner-occupied | Renter-occupied |
| Utility Gas | 4 (10.3%) | 0 (0.0%) |
| Bottled, Tank, or LP Gas | 0 (0.0%) | 2 (10.5%) |
| Electricity | 26 (66.7%) | 9 (47.4%) |
| Fuel Oil or Kerosene | 9 (23.1%) | 1 (5.3%) |
| Coal or Coke | 0 (0.0%) | 0 (0.0%) |
| All other Fuels | 0 (0.0%) | 7 (36.8%) |
| No Fuel Used | 0 (0.0%) | 0 (0.0%) |
| Total | 39 (100.0%) | 19 (100.0%) |
Household Vehicle Usage in Rhodell
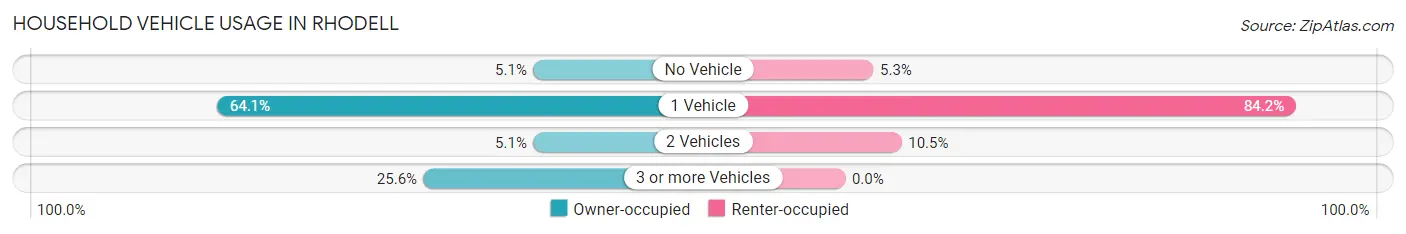
| Vehicles per Household | Owner-occupied | Renter-occupied |
| No Vehicle | 2 (5.1%) | 1 (5.3%) |
| 1 Vehicle | 25 (64.1%) | 16 (84.2%) |
| 2 Vehicles | 2 (5.1%) | 2 (10.5%) |
| 3 or more Vehicles | 10 (25.6%) | 0 (0.0%) |
| Total | 39 (100.0%) | 19 (100.0%) |
Real Estate & Mortgages in Rhodell
Real Estate and Mortgage Overview in Rhodell
| Characteristic | Without Mortgage | With Mortgage |
| Housing Units | 32 | 7 |
| Median Property Value | - | - |
| Median Household Income | - | - |
| Monthly Housing Costs | $427 | $0 |
| Real Estate Taxes | - | - |
Property Value by Mortgage Status in Rhodell
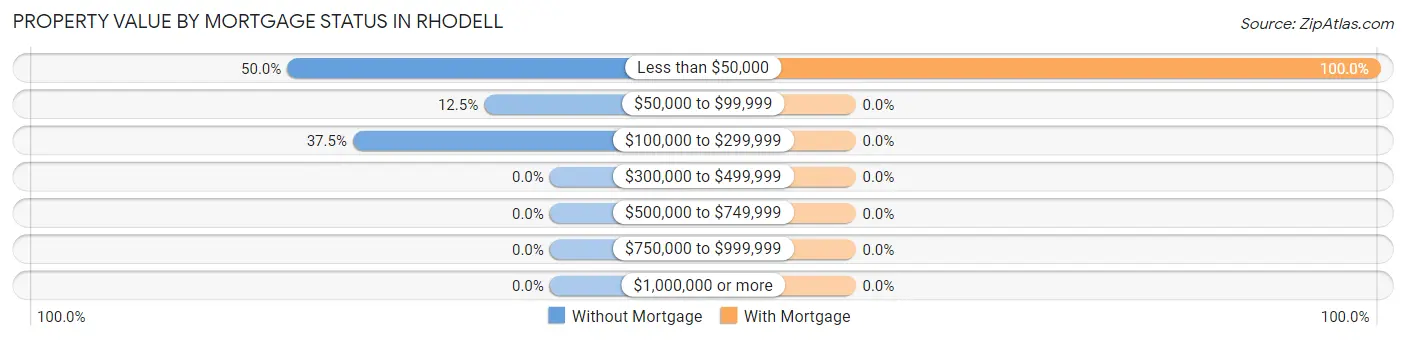
| Property Value | Without Mortgage | With Mortgage |
| Less than $50,000 | 16 (50.0%) | 7 (100.0%) |
| $50,000 to $99,999 | 4 (12.5%) | 0 (0.0%) |
| $100,000 to $299,999 | 12 (37.5%) | 0 (0.0%) |
| $300,000 to $499,999 | 0 (0.0%) | 0 (0.0%) |
| $500,000 to $749,999 | 0 (0.0%) | 0 (0.0%) |
| $750,000 to $999,999 | 0 (0.0%) | 0 (0.0%) |
| $1,000,000 or more | 0 (0.0%) | 0 (0.0%) |
| Total | 32 (100.0%) | 7 (100.0%) |
Household Income by Mortgage Status in Rhodell
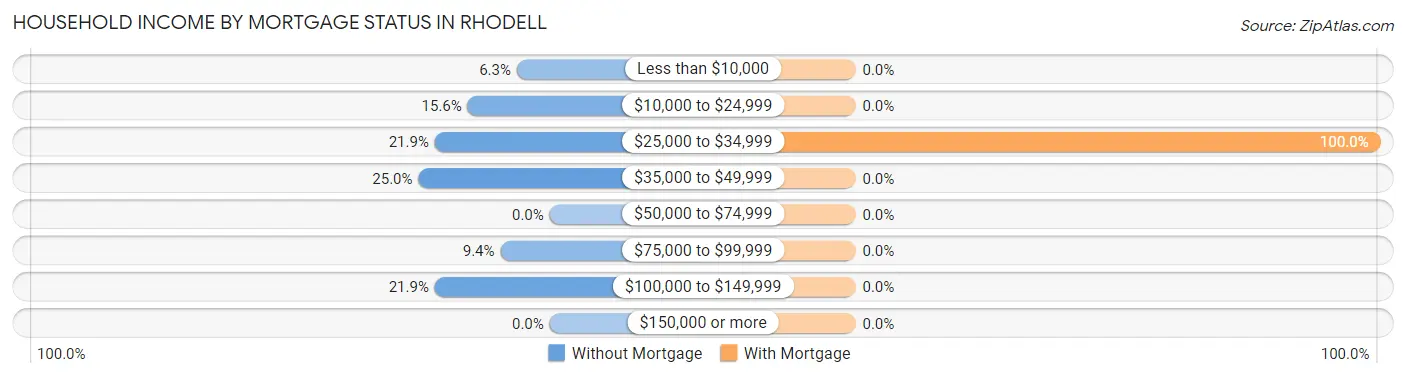
| Household Income | Without Mortgage | With Mortgage |
| Less than $10,000 | 2 (6.2%) | 0 (0.0%) |
| $10,000 to $24,999 | 5 (15.6%) | 0 (0.0%) |
| $25,000 to $34,999 | 7 (21.9%) | 7 (100.0%) |
| $35,000 to $49,999 | 8 (25.0%) | 0 (0.0%) |
| $50,000 to $74,999 | 0 (0.0%) | 0 (0.0%) |
| $75,000 to $99,999 | 3 (9.4%) | 0 (0.0%) |
| $100,000 to $149,999 | 7 (21.9%) | 0 (0.0%) |
| $150,000 or more | 0 (0.0%) | 0 (0.0%) |
| Total | 32 (100.0%) | 7 (100.0%) |
Property Value to Household Income Ratio in Rhodell
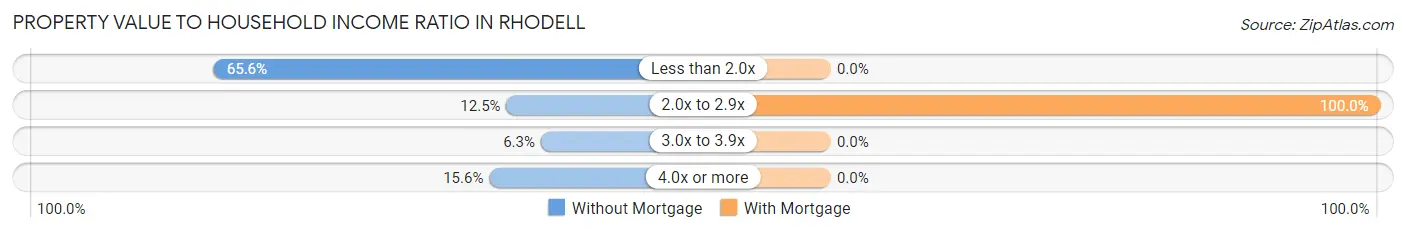
| Value-to-Income Ratio | Without Mortgage | With Mortgage |
| Less than 2.0x | 21 (65.6%) | 0 (0.0%) |
| 2.0x to 2.9x | 4 (12.5%) | 7 (100.0%) |
| 3.0x to 3.9x | 2 (6.2%) | 0 (0.0%) |
| 4.0x or more | 5 (15.6%) | 0 (0.0%) |
| Total | 32 (100.0%) | 7 (100.0%) |
Real Estate Taxes by Mortgage Status in Rhodell
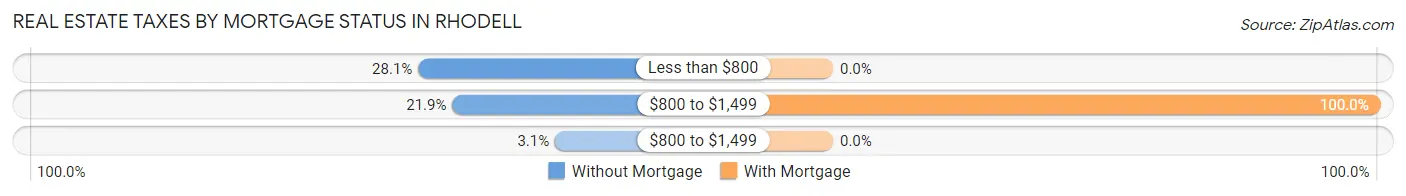
| Property Taxes | Without Mortgage | With Mortgage |
| Less than $800 | 9 (28.1%) | 0 (0.0%) |
| $800 to $1,499 | 7 (21.9%) | 7 (100.0%) |
| $800 to $1,499 | 1 (3.1%) | 0 (0.0%) |
| Total | 32 (100.0%) | 7 (100.0%) |
Health & Disability in Rhodell
Health Insurance Coverage by Age in Rhodell
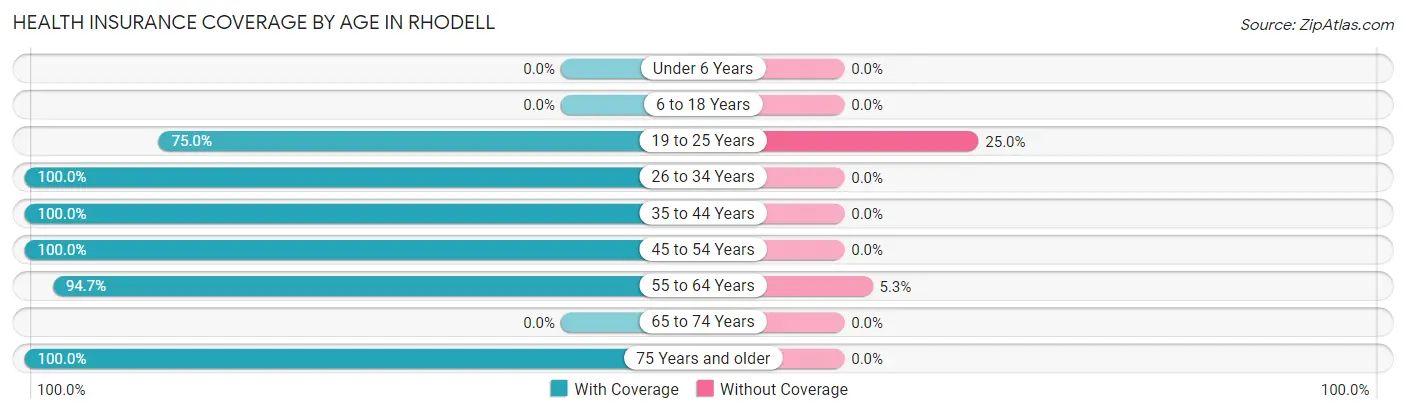
| Age Bracket | With Coverage | Without Coverage |
| Under 6 Years | 0 (0.0%) | 0 (0.0%) |
| 6 to 18 Years | 0 (0.0%) | 0 (0.0%) |
| 19 to 25 Years | 30 (75.0%) | 10 (25.0%) |
| 26 to 34 Years | 3 (100.0%) | 0 (0.0%) |
| 35 to 44 Years | 4 (100.0%) | 0 (0.0%) |
| 45 to 54 Years | 34 (100.0%) | 0 (0.0%) |
| 55 to 64 Years | 18 (94.7%) | 1 (5.3%) |
| 65 to 74 Years | 0 (0.0%) | 0 (0.0%) |
| 75 Years and older | 27 (100.0%) | 0 (0.0%) |
| Total | 116 (91.3%) | 11 (8.7%) |
Health Insurance Coverage by Citizenship Status in Rhodell
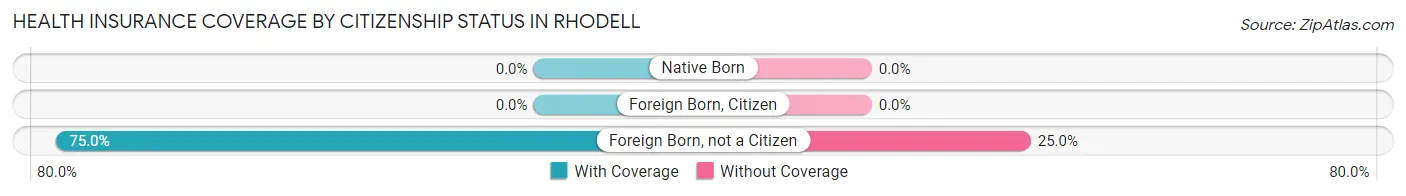
| Citizenship Status | With Coverage | Without Coverage |
| Native Born | 0 (0.0%) | 0 (0.0%) |
| Foreign Born, Citizen | 0 (0.0%) | 0 (0.0%) |
| Foreign Born, not a Citizen | 30 (75.0%) | 10 (25.0%) |
Health Insurance Coverage by Household Income in Rhodell
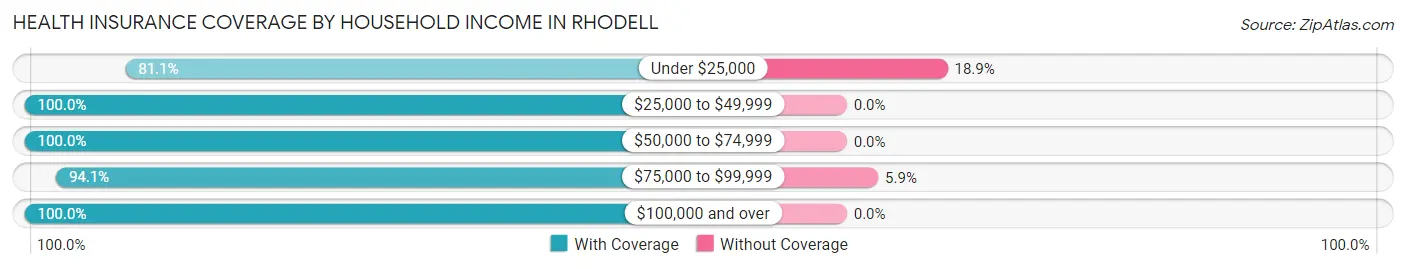
| Household Income | With Coverage | Without Coverage |
| Under $25,000 | 43 (81.1%) | 10 (18.9%) |
| $25,000 to $49,999 | 33 (100.0%) | 0 (0.0%) |
| $50,000 to $74,999 | 9 (100.0%) | 0 (0.0%) |
| $75,000 to $99,999 | 16 (94.1%) | 1 (5.9%) |
| $100,000 and over | 15 (100.0%) | 0 (0.0%) |
Public vs Private Health Insurance Coverage by Age in Rhodell
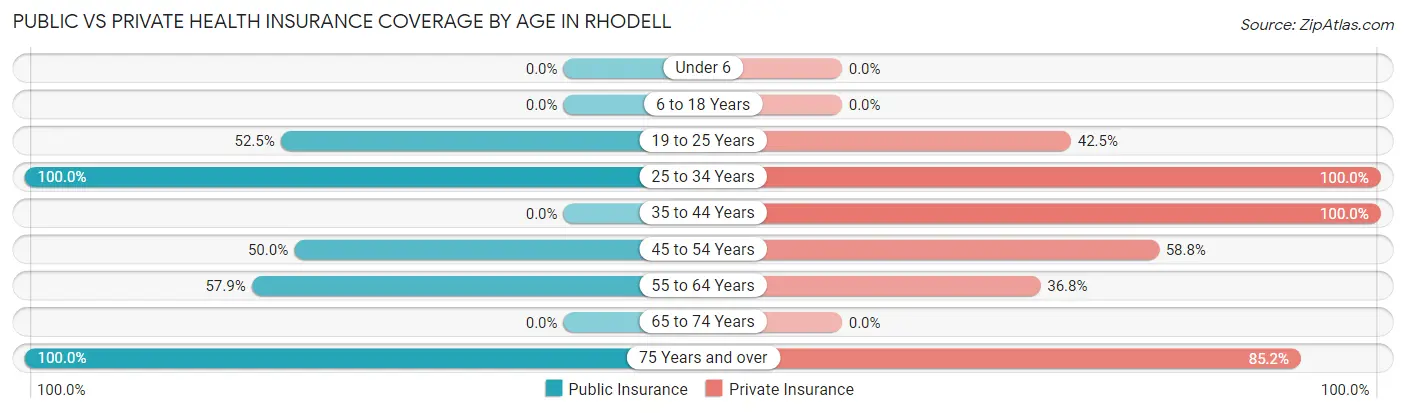
| Age Bracket | Public Insurance | Private Insurance |
| Under 6 | 0 (0.0%) | 0 (0.0%) |
| 6 to 18 Years | 0 (0.0%) | 0 (0.0%) |
| 19 to 25 Years | 21 (52.5%) | 17 (42.5%) |
| 25 to 34 Years | 3 (100.0%) | 3 (100.0%) |
| 35 to 44 Years | 0 (0.0%) | 4 (100.0%) |
| 45 to 54 Years | 17 (50.0%) | 20 (58.8%) |
| 55 to 64 Years | 11 (57.9%) | 7 (36.8%) |
| 65 to 74 Years | 0 (0.0%) | 0 (0.0%) |
| 75 Years and over | 27 (100.0%) | 23 (85.2%) |
| Total | 79 (62.2%) | 74 (58.3%) |
Disability Status by Sex by Age in Rhodell
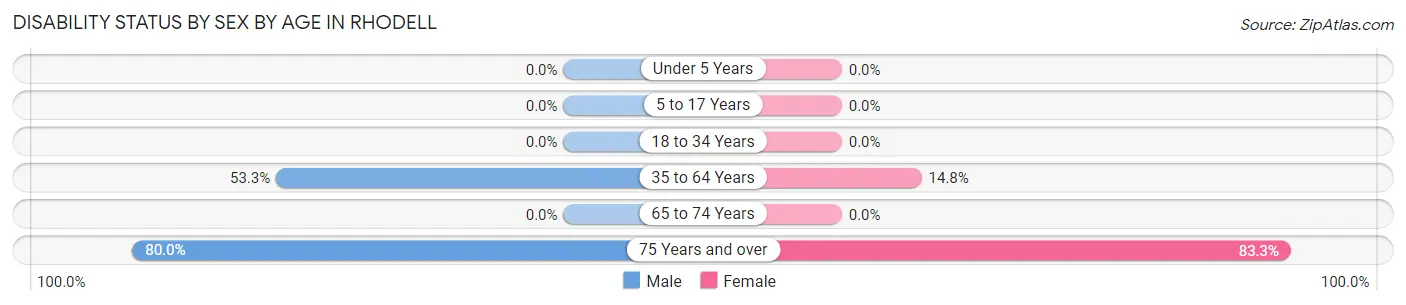
| Age Bracket | Male | Female |
| Under 5 Years | 0 (0.0%) | 0 (0.0%) |
| 5 to 17 Years | 0 (0.0%) | 0 (0.0%) |
| 18 to 34 Years | 0 (0.0%) | 0 (0.0%) |
| 35 to 64 Years | 16 (53.3%) | 4 (14.8%) |
| 65 to 74 Years | 0 (0.0%) | 0 (0.0%) |
| 75 Years and over | 12 (80.0%) | 10 (83.3%) |
Disability Class by Sex by Age in Rhodell
Disability Class: Hearing Difficulty
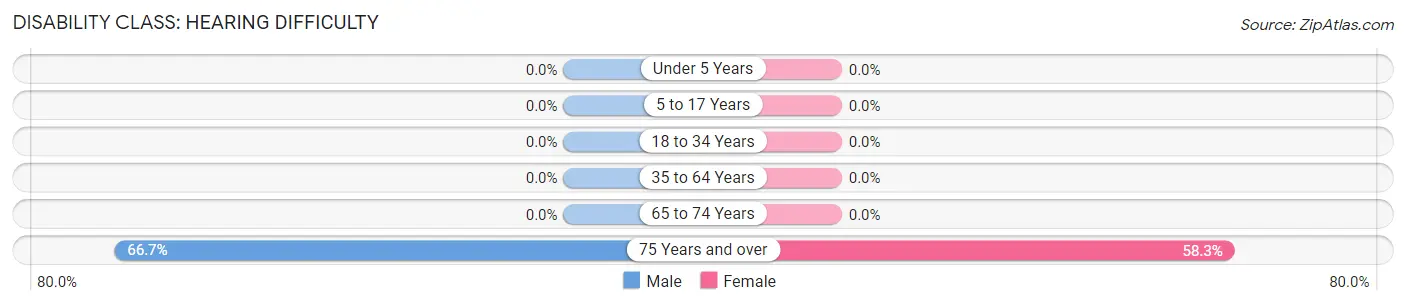
| Age Bracket | Male | Female |
| Under 5 Years | 0 (0.0%) | 0 (0.0%) |
| 5 to 17 Years | 0 (0.0%) | 0 (0.0%) |
| 18 to 34 Years | 0 (0.0%) | 0 (0.0%) |
| 35 to 64 Years | 0 (0.0%) | 0 (0.0%) |
| 65 to 74 Years | 0 (0.0%) | 0 (0.0%) |
| 75 Years and over | 10 (66.7%) | 7 (58.3%) |
Disability Class: Vision Difficulty
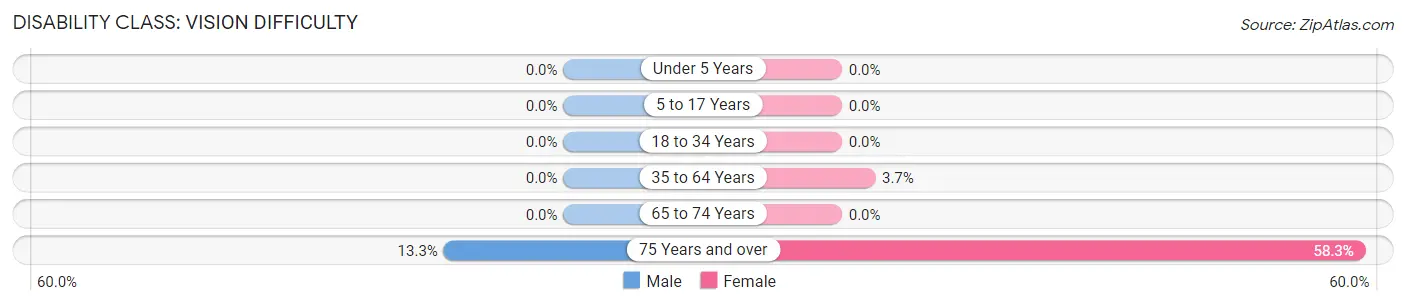
| Age Bracket | Male | Female |
| Under 5 Years | 0 (0.0%) | 0 (0.0%) |
| 5 to 17 Years | 0 (0.0%) | 0 (0.0%) |
| 18 to 34 Years | 0 (0.0%) | 0 (0.0%) |
| 35 to 64 Years | 0 (0.0%) | 1 (3.7%) |
| 65 to 74 Years | 0 (0.0%) | 0 (0.0%) |
| 75 Years and over | 2 (13.3%) | 7 (58.3%) |
Disability Class: Cognitive Difficulty
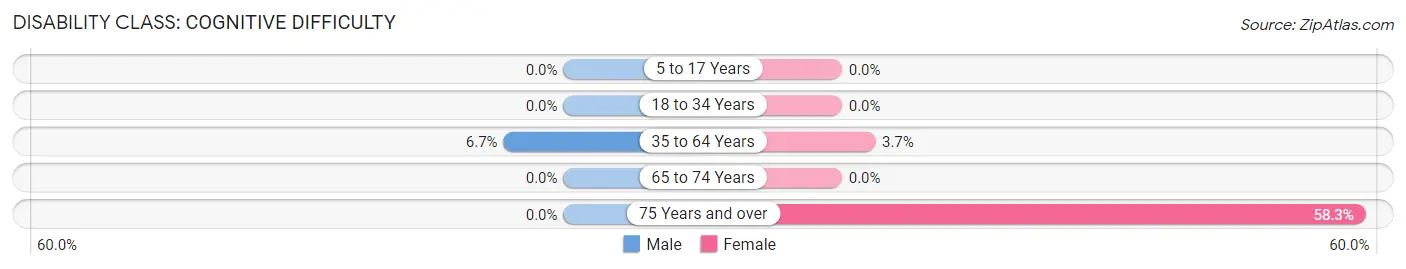
| Age Bracket | Male | Female |
| 5 to 17 Years | 0 (0.0%) | 0 (0.0%) |
| 18 to 34 Years | 0 (0.0%) | 0 (0.0%) |
| 35 to 64 Years | 2 (6.7%) | 1 (3.7%) |
| 65 to 74 Years | 0 (0.0%) | 0 (0.0%) |
| 75 Years and over | 0 (0.0%) | 7 (58.3%) |
Disability Class: Ambulatory Difficulty
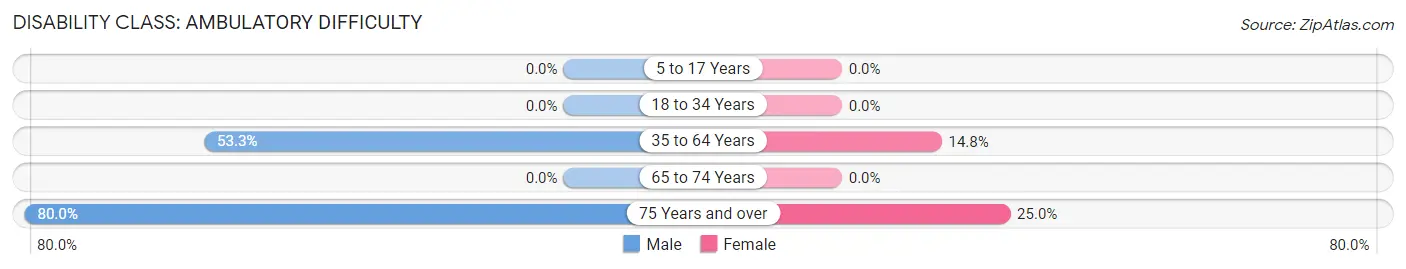
| Age Bracket | Male | Female |
| 5 to 17 Years | 0 (0.0%) | 0 (0.0%) |
| 18 to 34 Years | 0 (0.0%) | 0 (0.0%) |
| 35 to 64 Years | 16 (53.3%) | 4 (14.8%) |
| 65 to 74 Years | 0 (0.0%) | 0 (0.0%) |
| 75 Years and over | 12 (80.0%) | 3 (25.0%) |
Disability Class: Self-Care Difficulty
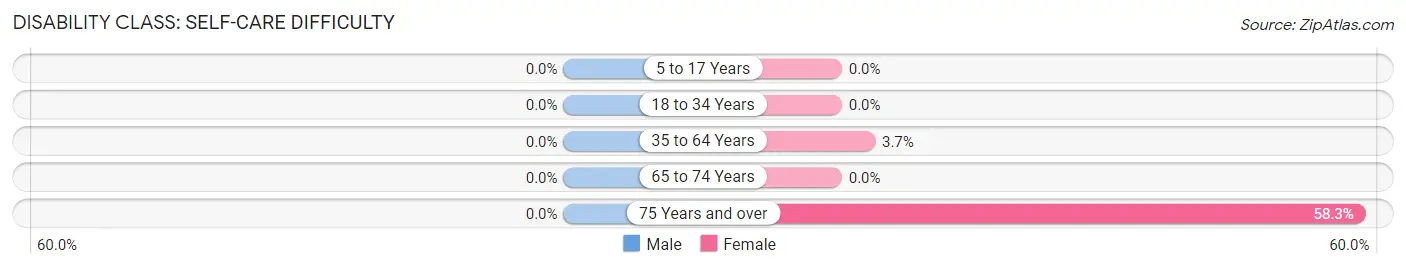
| Age Bracket | Male | Female |
| 5 to 17 Years | 0 (0.0%) | 0 (0.0%) |
| 18 to 34 Years | 0 (0.0%) | 0 (0.0%) |
| 35 to 64 Years | 0 (0.0%) | 1 (3.7%) |
| 65 to 74 Years | 0 (0.0%) | 0 (0.0%) |
| 75 Years and over | 0 (0.0%) | 7 (58.3%) |
Technology Access in Rhodell
Computing Device Access in Rhodell
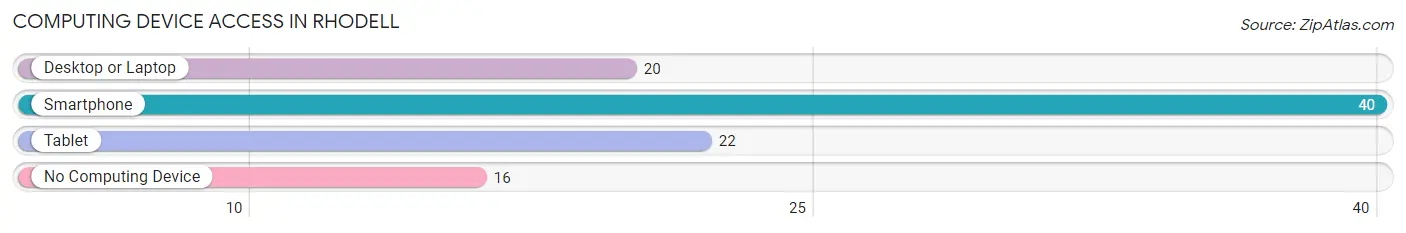
| Device Type | # Households | % Households |
| Desktop or Laptop | 20 | 34.5% |
| Smartphone | 40 | 69.0% |
| Tablet | 22 | 37.9% |
| No Computing Device | 16 | 27.6% |
| Total | 58 | 100.0% |
Internet Access in Rhodell
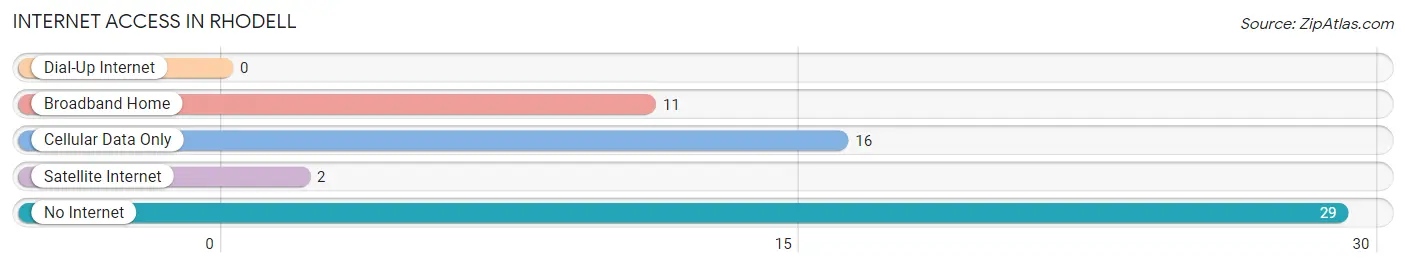
| Internet Type | # Households | % Households |
| Dial-Up Internet | 0 | 0.0% |
| Broadband Home | 11 | 19.0% |
| Cellular Data Only | 16 | 27.6% |
| Satellite Internet | 2 | 3.5% |
| No Internet | 29 | 50.0% |
| Total | 58 | 100.0% |
Rhodell Summary
Rhodell is an unincorporated community located in the southern part of Raleigh County, West Virginia. It is situated in the Appalachian Mountains, and is part of the Beckley-Raleigh County Metropolitan Statistical Area. The population of Rhodell was estimated to be around 200 in 2020.
History
Rhodell was founded in the late 19th century by the Rhodell Coal Company. The company was established in 1891 and was the first coal mining operation in the area. The town was named after the company's founder, John Rhodell. The company operated until the early 20th century, when it was forced to close due to a lack of coal reserves.
The town was then taken over by the Raleigh County Coal Company, which operated until the 1950s. During this time, Rhodell was a thriving coal mining town, with a population of over 1,000 people. The town had a post office, a school, a church, and several stores.
In the 1960s, the coal industry began to decline in the area, and the population of Rhodell began to decline as well. By the 1970s, the population had dropped to around 200 people. The town has remained relatively unchanged since then, with the population remaining around 200 people.
Geography
Rhodell is located in the Appalachian Mountains of southern West Virginia. It is situated in the Beckley-Raleigh County Metropolitan Statistical Area. The town is located at an elevation of 2,400 feet above sea level.
The town is surrounded by the New River Gorge National Park and Preserve, which is a popular destination for outdoor recreation. The park offers a variety of activities, including hiking, camping, fishing, and whitewater rafting.
Economy
Rhodell is a small, rural community with a limited economy. The town is primarily supported by the coal mining industry, which is still active in the area. The town also has a few small businesses, including a convenience store, a gas station, and a few restaurants.
Demographics
Rhodell is a predominantly white community, with the majority of the population being of European descent. The population of Rhodell was estimated to be around 200 in 2020. The median household income in the town is $30,000, and the median age is 44 years old. The town has a high rate of poverty, with over 30% of the population living below the poverty line.
Common Questions
What is the Total Population of Rhodell?
Total Population of Rhodell is 127.
What is the Total Male Population of Rhodell?
Total Male Population of Rhodell is 67.
What is the Total Female Population of Rhodell?
Total Female Population of Rhodell is 60.
What is the Ratio of Males per 100 Females in Rhodell?
There are 111.67 Males per 100 Females in Rhodell.
What is the Ratio of Females per 100 Males in Rhodell?
There are 89.55 Females per 100 Males in Rhodell.
What is the Median Population Age in Rhodell?
Median Population Age in Rhodell is 49.9 Years.
What is the Average Family Size in Rhodell
Average Family Size in Rhodell is 3.1 People.
What is the Average Household Size in Rhodell
Average Household Size in Rhodell is 2.2 People.
What is Per Capita Income in Rhodell?
Per Capita income in Rhodell is $22,840.
What is the Median Family Income in Rhodell?
Median Family Income in Rhodell is $46,042.
What is the Median Household income in Rhodell?
Median Household Income in Rhodell is $36,250.
What is Inequality or Gini Index in Rhodell?
Inequality or Gini Index in Rhodell is 0.37.
How Large is the Labor Force in Rhodell?
There are 67 People in the Labor Forcein in Rhodell.
What is the Percentage of People in the Labor Force in Rhodell?
52.8% of People are in the Labor Force in Rhodell.
What is the Unemployment Rate in Rhodell?
Unemployment Rate in Rhodell is 14.9%.