Mill Creek, WV
Mill Creek Map
Mill Creek Overview
740
TOTAL POPULATION
403
MALE POPULATION
337
FEMALE POPULATION
119.58
MALES / 100 FEMALES
83.62
FEMALES / 100 MALES
32.1
MEDIAN AGE
3.9
AVG FAMILY SIZE
2.9
AVG HOUSEHOLD SIZE
$24,140
PER CAPITA INCOME
$66,875
AVG FAMILY INCOME
$45,417
AVG HOUSEHOLD INCOME
3.6%
WAGE / INCOME GAP [ % ]
96.4¢/ $1
WAGE / INCOME GAP [ $ ]
$11,436
FAMILY INCOME DEFICIT
0.38
INEQUALITY / GINI INDEX
313
LABOR FORCE [ PEOPLE ]
53.4%
PERCENT IN LABOR FORCE
11.2%
UNEMPLOYMENT RATE
Mill Creek Zip Codes
Mill Creek Area Codes
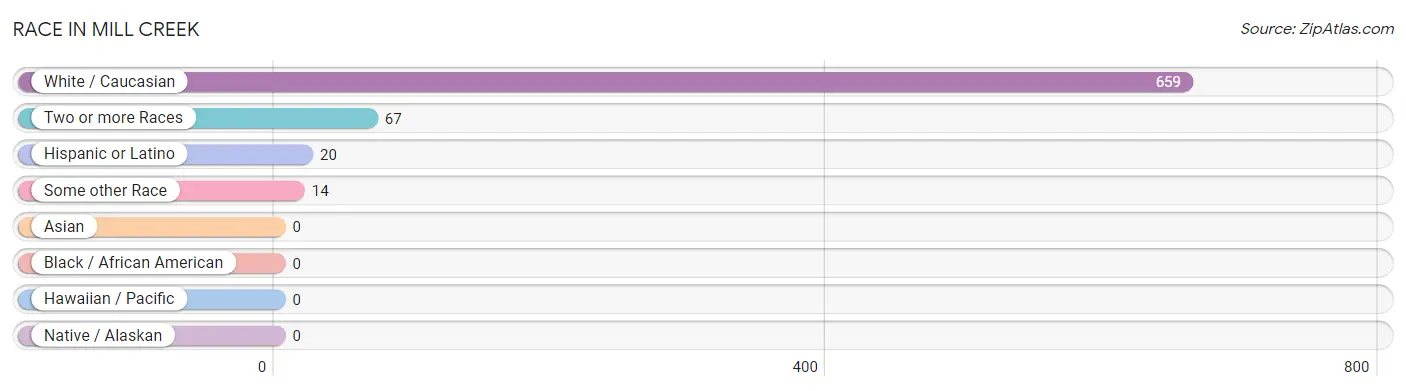
Race in Mill Creek
The most populous races in Mill Creek are White / Caucasian (659 | 89.0%), Two or more Races (67 | 9.0%), and Hispanic or Latino (20 | 2.7%).
| Race | # Population | % Population |
| Asian | 0 | 0.0% |
| Black / African American | 0 | 0.0% |
| Hawaiian / Pacific | 0 | 0.0% |
| Hispanic or Latino | 20 | 2.7% |
| Native / Alaskan | 0 | 0.0% |
| White / Caucasian | 659 | 89.0% |
| Two or more Races | 67 | 9.0% |
| Some other Race | 14 | 1.9% |
| Total | 740 | 100.0% |
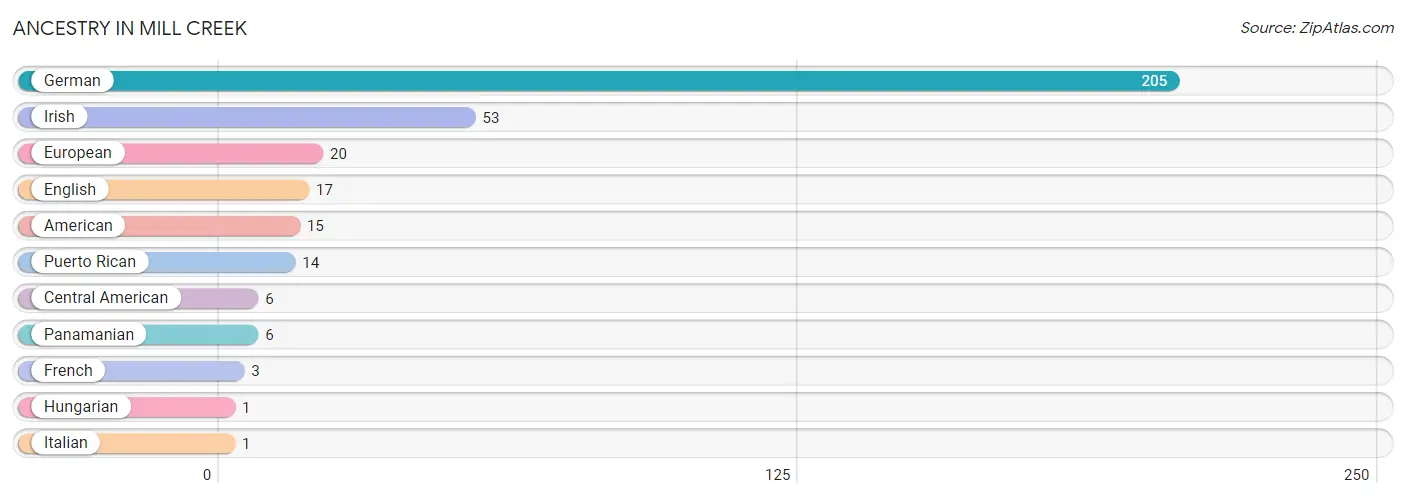
Ancestry in Mill Creek
The most populous ancestries reported in Mill Creek are German (205 | 27.7%), Irish (53 | 7.2%), European (20 | 2.7%), English (17 | 2.3%), and American (15 | 2.0%), together accounting for 41.9% of all Mill Creek residents.
| Ancestry | # Population | % Population |
| American | 15 | 2.0% |
| Central American | 6 | 0.8% |
| English | 17 | 2.3% |
| European | 20 | 2.7% |
| French | 3 | 0.4% |
| German | 205 | 27.7% |
| Hungarian | 1 | 0.1% |
| Irish | 53 | 7.2% |
| Italian | 1 | 0.1% |
| Panamanian | 6 | 0.8% |
| Puerto Rican | 14 | 1.9% | View All 11 Rows |
Immigrants in Mill Creek

| Immigration Origin | # Population | % Population | View All 0 Rows |
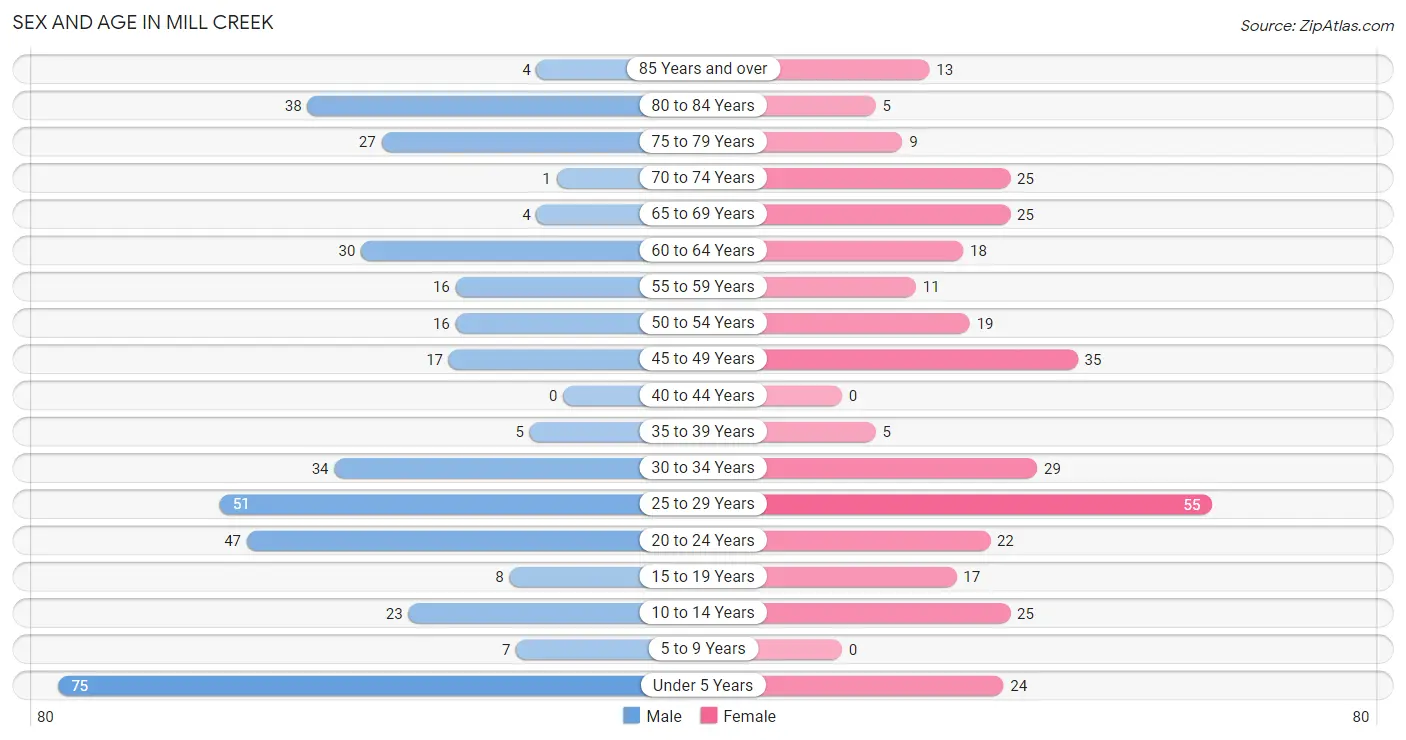
Sex and Age in Mill Creek
Sex and Age in Mill Creek
The most populous age groups in Mill Creek are Under 5 Years (75 | 18.6%) for men and 25 to 29 Years (55 | 16.3%) for women.
| Age Bracket | Male | Female |
| Under 5 Years | 75 (18.6%) | 24 (7.1%) |
| 5 to 9 Years | 7 (1.7%) | 0 (0.0%) |
| 10 to 14 Years | 23 (5.7%) | 25 (7.4%) |
| 15 to 19 Years | 8 (2.0%) | 17 (5.0%) |
| 20 to 24 Years | 47 (11.7%) | 22 (6.5%) |
| 25 to 29 Years | 51 (12.7%) | 55 (16.3%) |
| 30 to 34 Years | 34 (8.4%) | 29 (8.6%) |
| 35 to 39 Years | 5 (1.2%) | 5 (1.5%) |
| 40 to 44 Years | 0 (0.0%) | 0 (0.0%) |
| 45 to 49 Years | 17 (4.2%) | 35 (10.4%) |
| 50 to 54 Years | 16 (4.0%) | 19 (5.6%) |
| 55 to 59 Years | 16 (4.0%) | 11 (3.3%) |
| 60 to 64 Years | 30 (7.4%) | 18 (5.3%) |
| 65 to 69 Years | 4 (1.0%) | 25 (7.4%) |
| 70 to 74 Years | 1 (0.3%) | 25 (7.4%) |
| 75 to 79 Years | 27 (6.7%) | 9 (2.7%) |
| 80 to 84 Years | 38 (9.4%) | 5 (1.5%) |
| 85 Years and over | 4 (1.0%) | 13 (3.9%) |
| Total | 403 (100.0%) | 337 (100.0%) |
Families and Households in Mill Creek
Median Family Size in Mill Creek
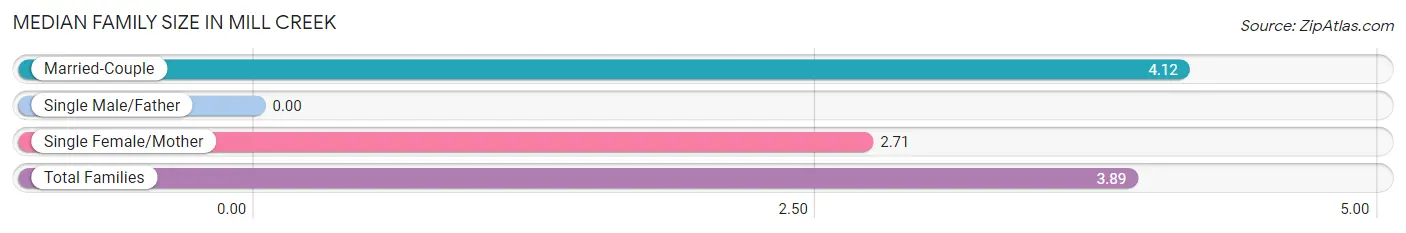
| Family Type | # Families | Family Size |
| Married-Couple | 128 (84.2%) | 4.12 |
| Single Male/Father | 0 (0.0%) | - |
| Single Female/Mother | 24 (15.8%) | 2.71 |
| Total Families | 152 (100.0%) | 3.89 |
Median Household Size in Mill Creek
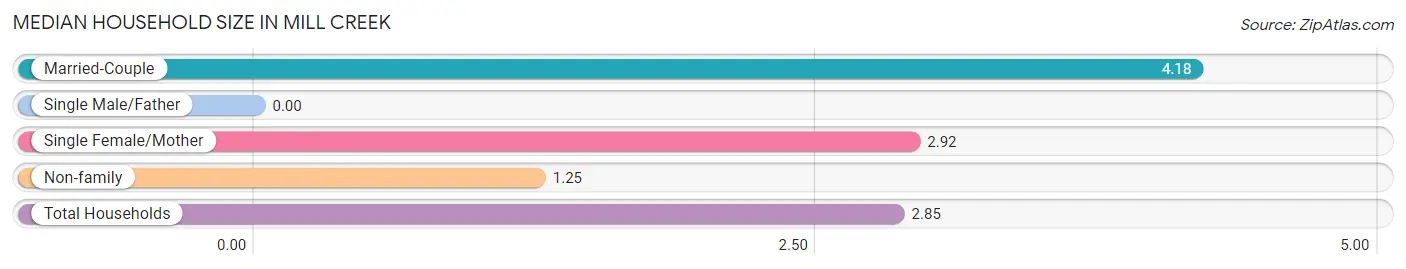
| Household Type | # Households | Household Size |
| Married-Couple | 128 (49.2%) | 4.18 |
| Single Male/Father | 0 (0.0%) | - |
| Single Female/Mother | 24 (9.2%) | 2.92 |
| Non-family | 108 (41.5%) | 1.25 |
| Total Households | 260 (100.0%) | 2.85 |
Household Size by Marriage Status in Mill Creek
Out of a total of 260 households in Mill Creek, 152 (58.5%) are family households, while 108 (41.5%) are nonfamily households. The most numerous type of family households are 2-person households, comprising 78, and the most common type of nonfamily households are 1-person households, comprising 92.
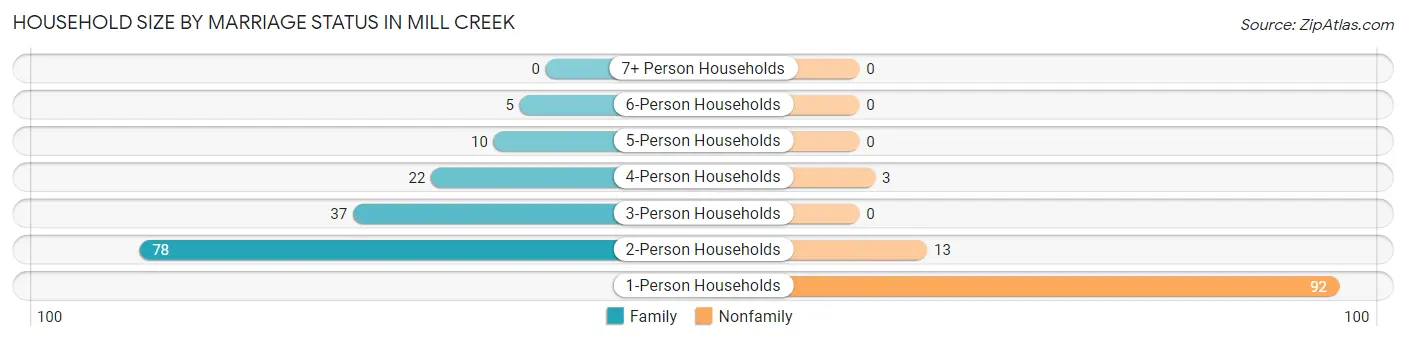
| Household Size | Family Households | Nonfamily Households |
| 1-Person Households | - | 92 (35.4%) |
| 2-Person Households | 78 (30.0%) | 13 (5.0%) |
| 3-Person Households | 37 (14.2%) | 0 (0.0%) |
| 4-Person Households | 22 (8.5%) | 3 (1.1%) |
| 5-Person Households | 10 (3.8%) | 0 (0.0%) |
| 6-Person Households | 5 (1.9%) | 0 (0.0%) |
| 7+ Person Households | 0 (0.0%) | 0 (0.0%) |
| Total | 152 (58.5%) | 108 (41.5%) |
Female Fertility in Mill Creek
Fertility by Age in Mill Creek
Average fertility rate in Mill Creek is 27.0 births per 1,000 women. Women in the age bracket of 20 to 34 years have the highest fertility rate with 47.0 births per 1,000 women. Women in the age bracket of 20 to 34 years acount for 100.0% of all women with births.
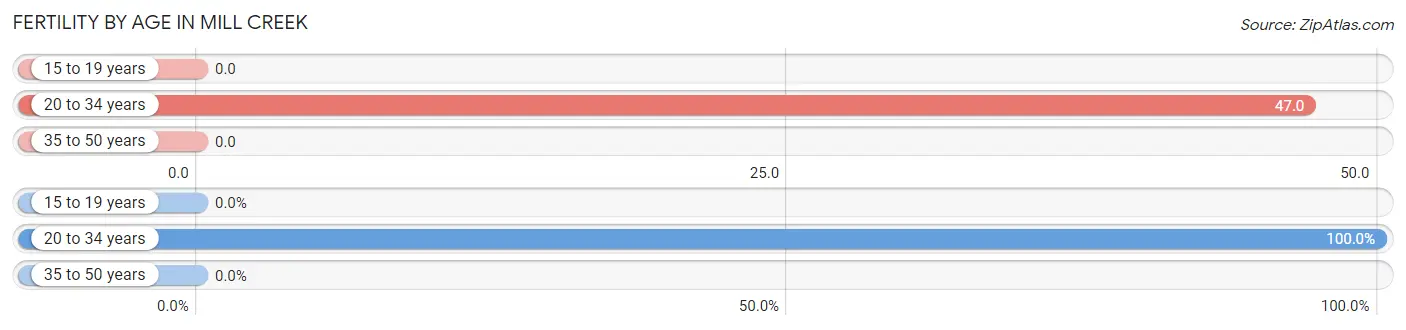
| Age Bracket | Women with Births | Births / 1,000 Women |
| 15 to 19 years | 0 (0.0%) | 0.0 |
| 20 to 34 years | 5 (100.0%) | 47.0 |
| 35 to 50 years | 0 (0.0%) | 0.0 |
| Total | 5 (100.0%) | 27.0 |
Fertility by Age by Marriage Status in Mill Creek
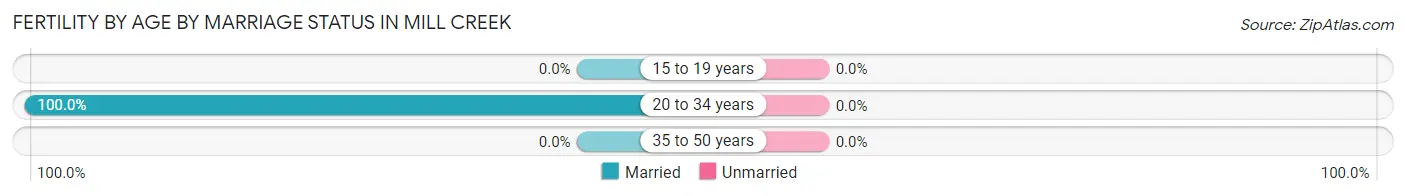
| Age Bracket | Married | Unmarried |
| 15 to 19 years | 0 (0.0%) | 0 (0.0%) |
| 20 to 34 years | 5 (100.0%) | 0 (0.0%) |
| 35 to 50 years | 0 (0.0%) | 0 (0.0%) |
| Total | 5 (100.0%) | 0 (0.0%) |
Fertility by Education in Mill Creek
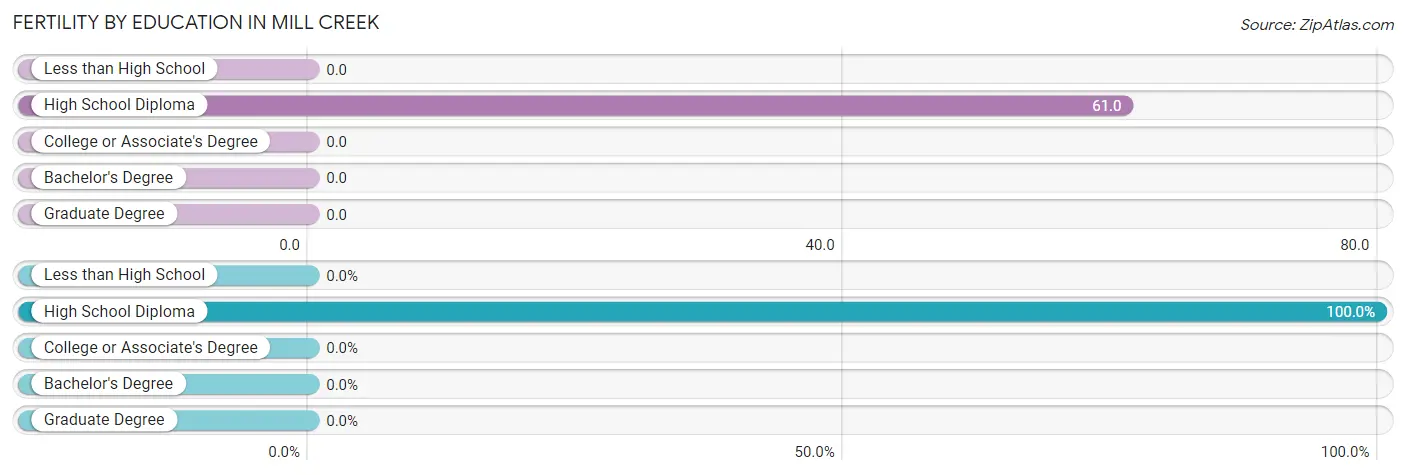
| Educational Attainment | Women with Births | Births / 1,000 Women |
| Less than High School | 0 (0.0%) | 0.0 |
| High School Diploma | 5 (100.0%) | 61.0 |
| College or Associate's Degree | 0 (0.0%) | 0.0 |
| Bachelor's Degree | 0 (0.0%) | 0.0 |
| Graduate Degree | 0 (0.0%) | 0.0 |
| Total | 5 (100.0%) | 27.0 |
Fertility by Education by Marriage Status in Mill Creek
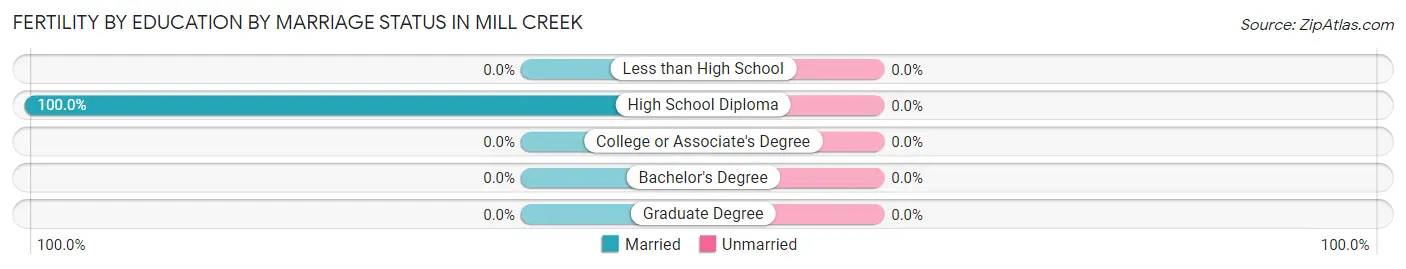
| Educational Attainment | Married | Unmarried |
| Less than High School | 0 (0.0%) | 0 (0.0%) |
| High School Diploma | 5 (100.0%) | 0 (0.0%) |
| College or Associate's Degree | 0 (0.0%) | 0 (0.0%) |
| Bachelor's Degree | 0 (0.0%) | 0 (0.0%) |
| Graduate Degree | 0 (0.0%) | 0 (0.0%) |
| Total | 5 (100.0%) | 0 (0.0%) |
Income in Mill Creek
Income Overview in Mill Creek
Per Capita Income in Mill Creek is $24,140, while median incomes of families and households are $66,875 and $45,417 respectively.
| Characteristic | Number | Measure |
| Per Capita Income | 740 | $24,140 |
| Median Family Income | 152 | $66,875 |
| Mean Family Income | 152 | $73,516 |
| Median Household Income | 260 | $45,417 |
| Mean Household Income | 260 | $57,913 |
| Income Deficit | 152 | $11,436 |
| Wage / Income Gap (%) | 740 | 3.59% |
| Wage / Income Gap ($) | 740 | 96.41¢ per $1 |
| Gini / Inequality Index | 740 | 0.38 |
Earnings by Sex in Mill Creek
Average Earnings in Mill Creek are $36,250, $35,625 for men and $36,953 for women, a difference of 3.6%.
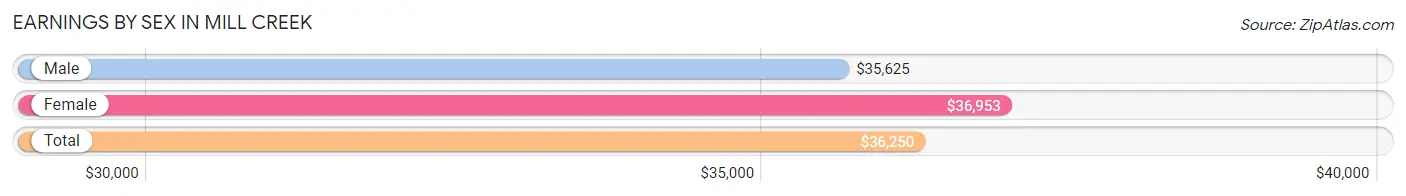
| Sex | Number | Average Earnings |
| Male | 195 (57.4%) | $35,625 |
| Female | 145 (42.6%) | $36,953 |
| Total | 340 (100.0%) | $36,250 |
Earnings by Sex by Income Bracket in Mill Creek
The most common earnings brackets in Mill Creek are $45,000 to $49,999 for men (58 | 29.7%) and $45,000 to $49,999 for women (52 | 35.9%).
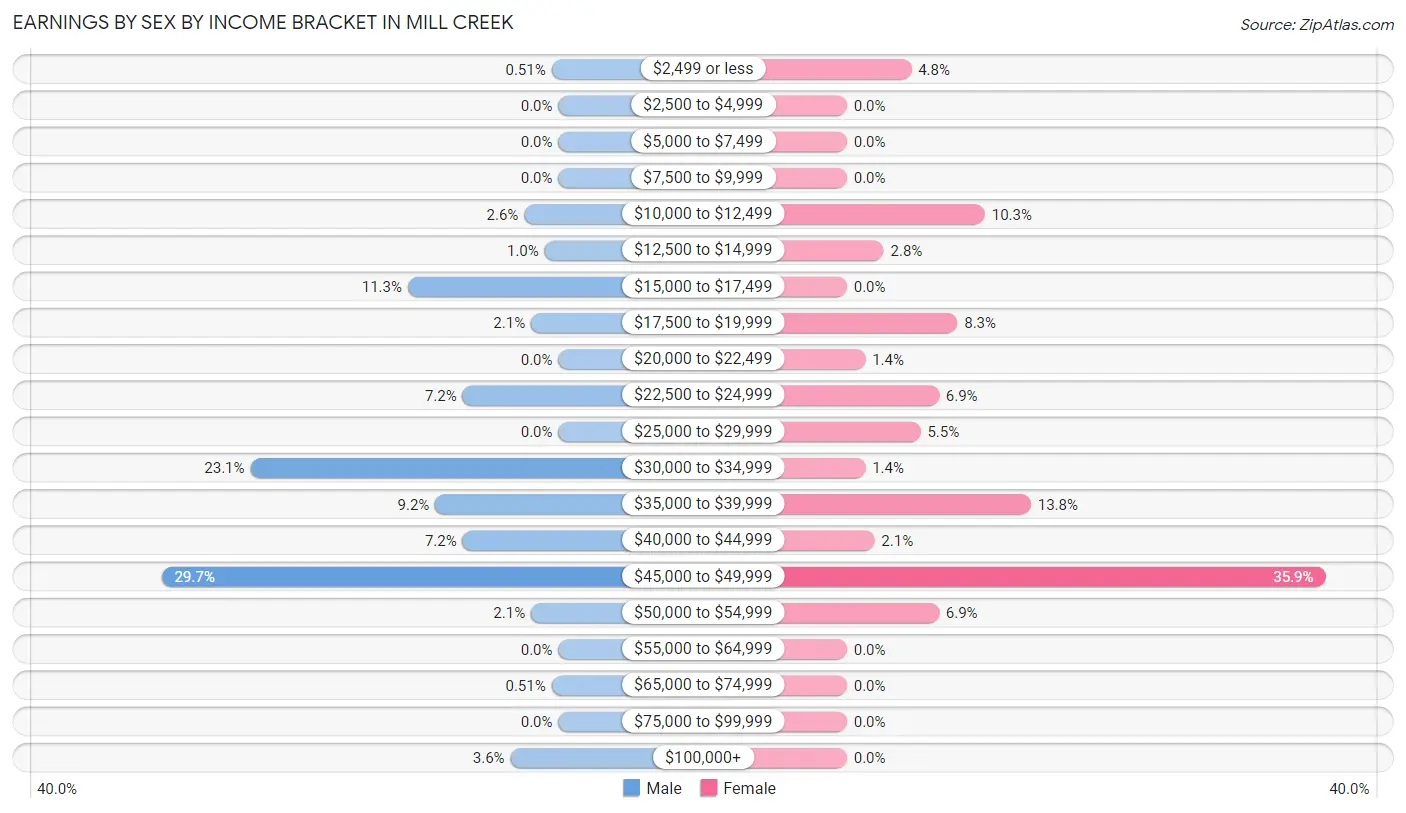
| Income | Male | Female |
| $2,499 or less | 1 (0.5%) | 7 (4.8%) |
| $2,500 to $4,999 | 0 (0.0%) | 0 (0.0%) |
| $5,000 to $7,499 | 0 (0.0%) | 0 (0.0%) |
| $7,500 to $9,999 | 0 (0.0%) | 0 (0.0%) |
| $10,000 to $12,499 | 5 (2.6%) | 15 (10.3%) |
| $12,500 to $14,999 | 2 (1.0%) | 4 (2.8%) |
| $15,000 to $17,499 | 22 (11.3%) | 0 (0.0%) |
| $17,500 to $19,999 | 4 (2.1%) | 12 (8.3%) |
| $20,000 to $22,499 | 0 (0.0%) | 2 (1.4%) |
| $22,500 to $24,999 | 14 (7.2%) | 10 (6.9%) |
| $25,000 to $29,999 | 0 (0.0%) | 8 (5.5%) |
| $30,000 to $34,999 | 45 (23.1%) | 2 (1.4%) |
| $35,000 to $39,999 | 18 (9.2%) | 20 (13.8%) |
| $40,000 to $44,999 | 14 (7.2%) | 3 (2.1%) |
| $45,000 to $49,999 | 58 (29.7%) | 52 (35.9%) |
| $50,000 to $54,999 | 4 (2.1%) | 10 (6.9%) |
| $55,000 to $64,999 | 0 (0.0%) | 0 (0.0%) |
| $65,000 to $74,999 | 1 (0.5%) | 0 (0.0%) |
| $75,000 to $99,999 | 0 (0.0%) | 0 (0.0%) |
| $100,000+ | 7 (3.6%) | 0 (0.0%) |
| Total | 195 (100.0%) | 145 (100.0%) |
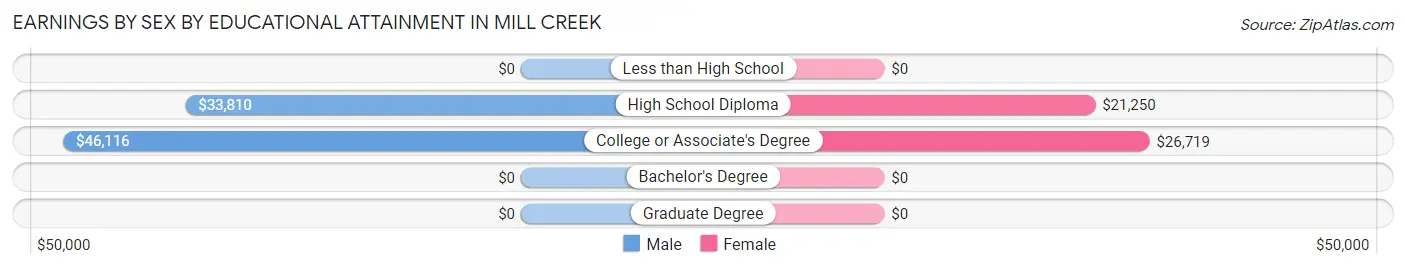
Earnings by Sex by Educational Attainment in Mill Creek
Average earnings in Mill Creek are $34,702 for men and $37,813 for women, a difference of 8.2%. Men with an educational attainment of college or associate's degree enjoy the highest average annual earnings of $46,116, while those with high school diploma education earn the least with $33,810. Women with an educational attainment of college or associate's degree earn the most with the average annual earnings of $26,719, while those with high school diploma education have the smallest earnings of $21,250.
| Educational Attainment | Male Income | Female Income |
| Less than High School | - | - |
| High School Diploma | $33,810 | $21,250 |
| College or Associate's Degree | $46,116 | $26,719 |
| Bachelor's Degree | - | - |
| Graduate Degree | - | - |
| Total | $34,702 | $37,813 |
Family Income in Mill Creek
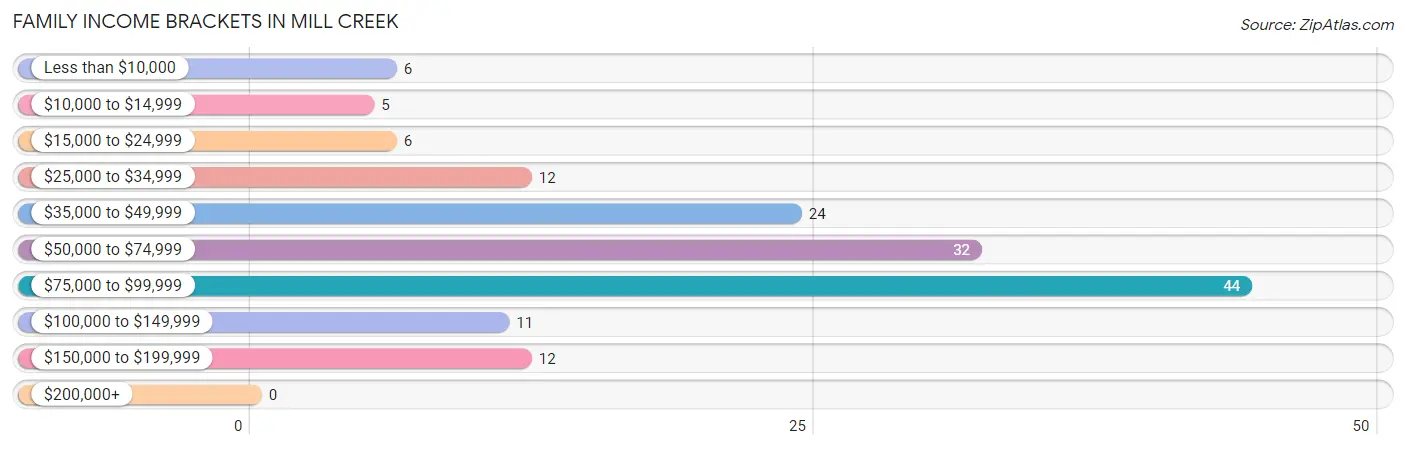
Family Income Brackets in Mill Creek
According to the Mill Creek family income data, there are 44 families falling into the $75,000 to $99,999 income range, which is the most common income bracket and makes up 28.9% of all families.
| Income Bracket | # Families | % Families |
| Less than $10,000 | 6 | 3.9% |
| $10,000 to $14,999 | 5 | 3.3% |
| $15,000 to $24,999 | 6 | 3.9% |
| $25,000 to $34,999 | 12 | 7.9% |
| $35,000 to $49,999 | 24 | 15.8% |
| $50,000 to $74,999 | 32 | 21.1% |
| $75,000 to $99,999 | 44 | 28.9% |
| $100,000 to $149,999 | 11 | 7.2% |
| $150,000 to $199,999 | 12 | 7.9% |
| $200,000+ | 0 | 0.0% |
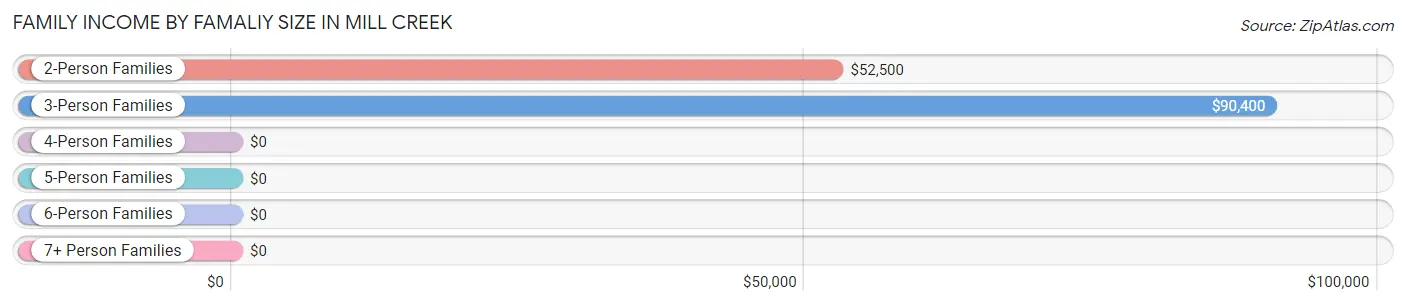
Family Income by Famaliy Size in Mill Creek
3-person families (42 | 27.6%) account for the highest median family income in Mill Creek with $90,400 per family, while 3-person families (42 | 27.6%) have the highest median income of $30,133 per family member.
| Income Bracket | # Families | Median Income |
| 2-Person Families | 78 (51.3%) | $52,500 |
| 3-Person Families | 42 (27.6%) | $90,400 |
| 4-Person Families | 17 (11.2%) | $0 |
| 5-Person Families | 15 (9.9%) | $0 |
| 6-Person Families | 0 (0.0%) | $0 |
| 7+ Person Families | 0 (0.0%) | $0 |
| Total | 152 (100.0%) | $66,875 |
Family Income by Number of Earners in Mill Creek
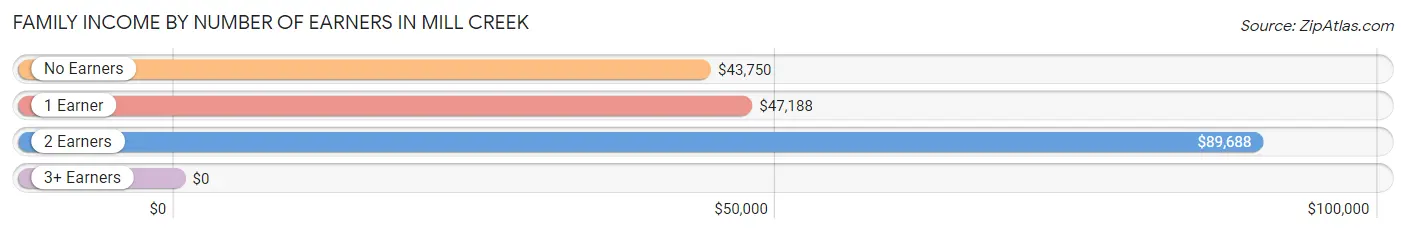
| Number of Earners | # Families | Median Income |
| No Earners | 30 (19.7%) | $43,750 |
| 1 Earner | 44 (28.9%) | $47,188 |
| 2 Earners | 63 (41.4%) | $89,688 |
| 3+ Earners | 15 (9.9%) | $0 |
| Total | 152 (100.0%) | $66,875 |
Household Income in Mill Creek
Household Income Brackets in Mill Creek
With 48 households falling in the category, the $25,000 to $34,999 income range is the most frequent in Mill Creek, accounting for 18.5% of all households. In contrast, only 5 households (1.9%) fall into the $200,000+ income bracket, making it the least populous group.
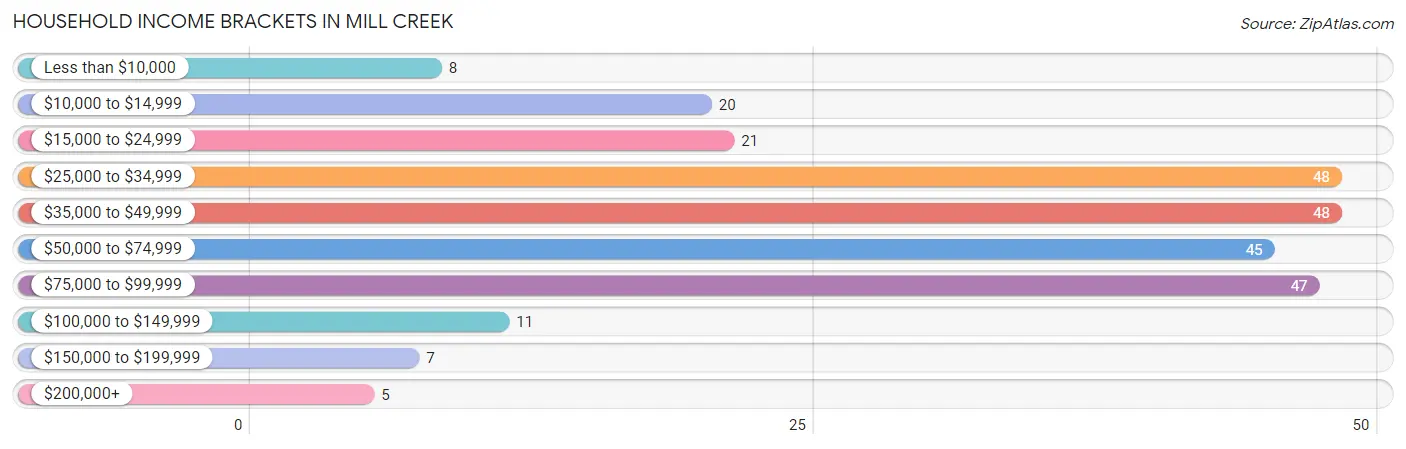
| Income Bracket | # Households | % Households |
| Less than $10,000 | 8 | 3.1% |
| $10,000 to $14,999 | 20 | 7.7% |
| $15,000 to $24,999 | 21 | 8.1% |
| $25,000 to $34,999 | 48 | 18.5% |
| $35,000 to $49,999 | 48 | 18.5% |
| $50,000 to $74,999 | 45 | 17.3% |
| $75,000 to $99,999 | 47 | 18.1% |
| $100,000 to $149,999 | 11 | 4.2% |
| $150,000 to $199,999 | 7 | 2.7% |
| $200,000+ | 5 | 1.9% |
Household Income by Householder Age in Mill Creek
The median household income in Mill Creek is $45,417, with the highest median household income of $90,300 found in the 25 to 44 years age bracket for the primary householder. A total of 58 households (22.3%) fall into this category. Meanwhile, the 15 to 24 years age bracket for the primary householder has the lowest median household income of $0, with 10 households (3.8%) in this group.
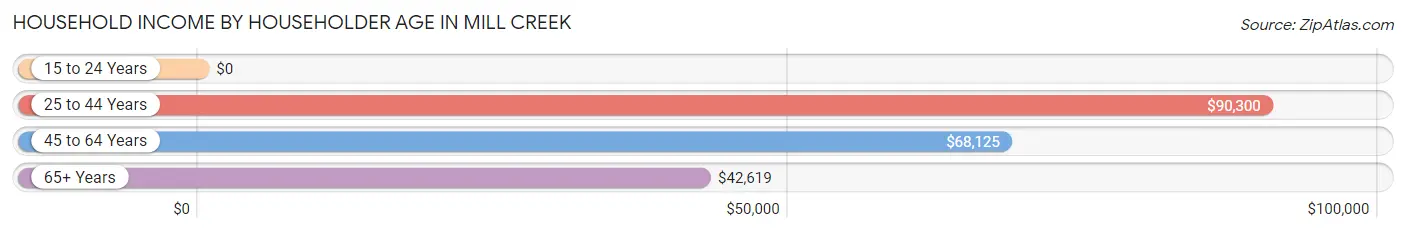
| Income Bracket | # Households | Median Income |
| 15 to 24 Years | 10 (3.8%) | $0 |
| 25 to 44 Years | 58 (22.3%) | $90,300 |
| 45 to 64 Years | 80 (30.8%) | $68,125 |
| 65+ Years | 112 (43.1%) | $42,619 |
| Total | 260 (100.0%) | $45,417 |
Poverty in Mill Creek
Income Below Poverty by Sex and Age in Mill Creek
With 8.3% poverty level for males and 9.2% for females among the residents of Mill Creek, 35 to 44 year old males and 35 to 44 year old females are the most vulnerable to poverty, with 5 males (100.0%) and 5 females (100.0%) in their respective age groups living below the poverty level.
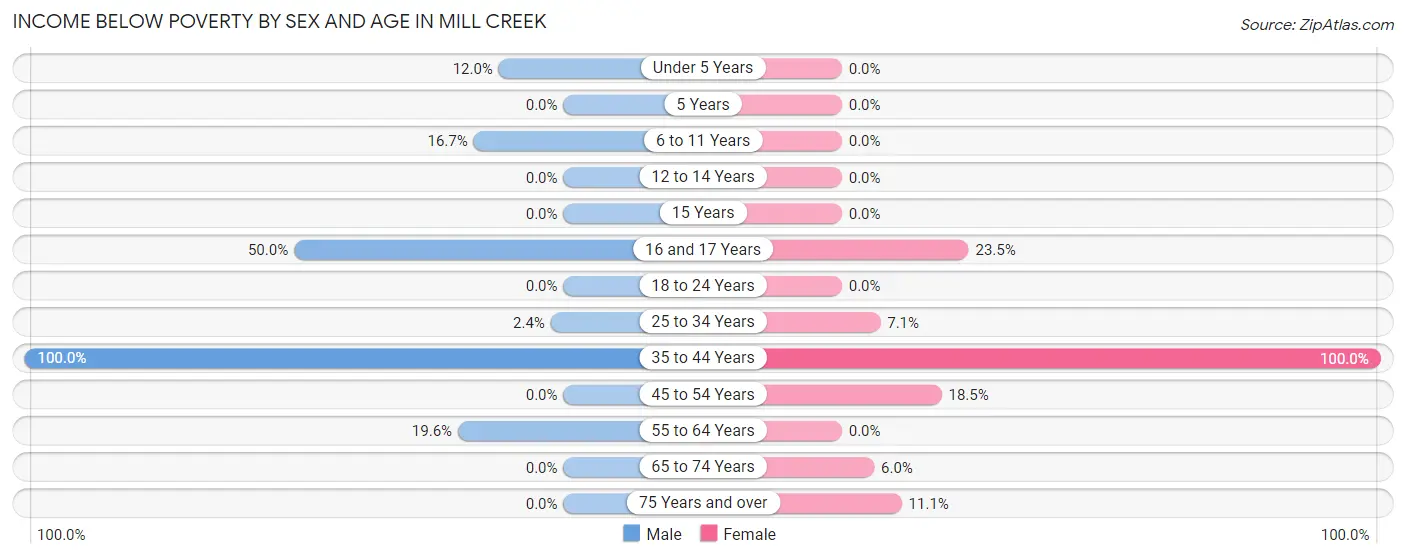
| Age Bracket | Male | Female |
| Under 5 Years | 9 (12.0%) | 0 (0.0%) |
| 5 Years | 0 (0.0%) | 0 (0.0%) |
| 6 to 11 Years | 4 (16.7%) | 0 (0.0%) |
| 12 to 14 Years | 0 (0.0%) | 0 (0.0%) |
| 15 Years | 0 (0.0%) | 0 (0.0%) |
| 16 and 17 Years | 4 (50.0%) | 4 (23.5%) |
| 18 to 24 Years | 0 (0.0%) | 0 (0.0%) |
| 25 to 34 Years | 2 (2.4%) | 6 (7.1%) |
| 35 to 44 Years | 5 (100.0%) | 5 (100.0%) |
| 45 to 54 Years | 0 (0.0%) | 10 (18.5%) |
| 55 to 64 Years | 9 (19.6%) | 0 (0.0%) |
| 65 to 74 Years | 0 (0.0%) | 3 (6.0%) |
| 75 Years and over | 0 (0.0%) | 3 (11.1%) |
| Total | 33 (8.3%) | 31 (9.2%) |
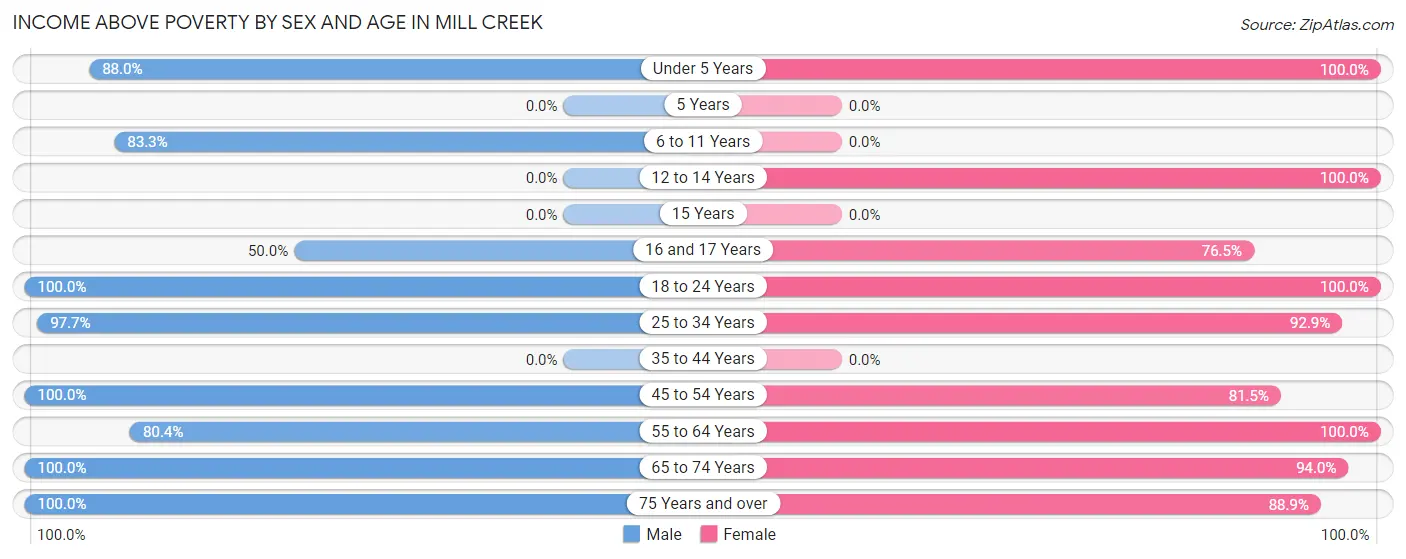
Income Above Poverty by Sex and Age in Mill Creek
According to the poverty statistics in Mill Creek, males aged 18 to 24 years and females aged under 5 years are the age groups that are most secure financially, with 100.0% of males and 100.0% of females in these age groups living above the poverty line.
| Age Bracket | Male | Female |
| Under 5 Years | 66 (88.0%) | 24 (100.0%) |
| 5 Years | 0 (0.0%) | 0 (0.0%) |
| 6 to 11 Years | 20 (83.3%) | 0 (0.0%) |
| 12 to 14 Years | 0 (0.0%) | 25 (100.0%) |
| 15 Years | 0 (0.0%) | 0 (0.0%) |
| 16 and 17 Years | 4 (50.0%) | 13 (76.5%) |
| 18 to 24 Years | 47 (100.0%) | 22 (100.0%) |
| 25 to 34 Years | 83 (97.7%) | 78 (92.9%) |
| 35 to 44 Years | 0 (0.0%) | 0 (0.0%) |
| 45 to 54 Years | 33 (100.0%) | 44 (81.5%) |
| 55 to 64 Years | 37 (80.4%) | 29 (100.0%) |
| 65 to 74 Years | 5 (100.0%) | 47 (94.0%) |
| 75 Years and over | 69 (100.0%) | 24 (88.9%) |
| Total | 364 (91.7%) | 306 (90.8%) |
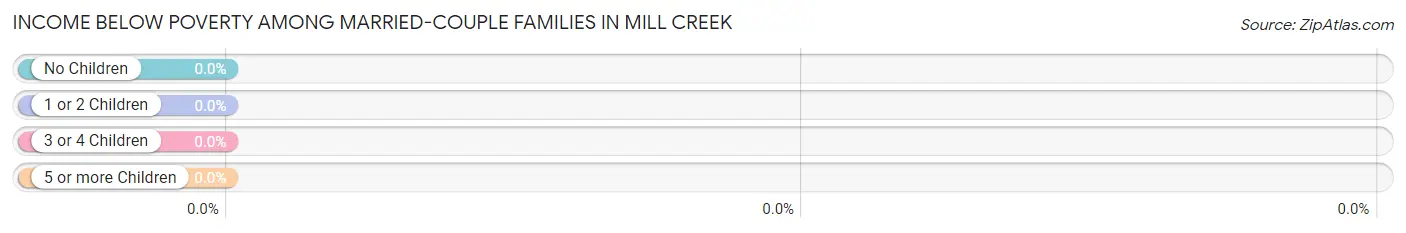
Income Below Poverty Among Married-Couple Families in Mill Creek
| Children | Above Poverty | Below Poverty |
| No Children | 69 (100.0%) | 0 (0.0%) |
| 1 or 2 Children | 59 (100.0%) | 0 (0.0%) |
| 3 or 4 Children | 0 (0.0%) | 0 (0.0%) |
| 5 or more Children | 0 (0.0%) | 0 (0.0%) |
| Total | 128 (100.0%) | 0 (0.0%) |
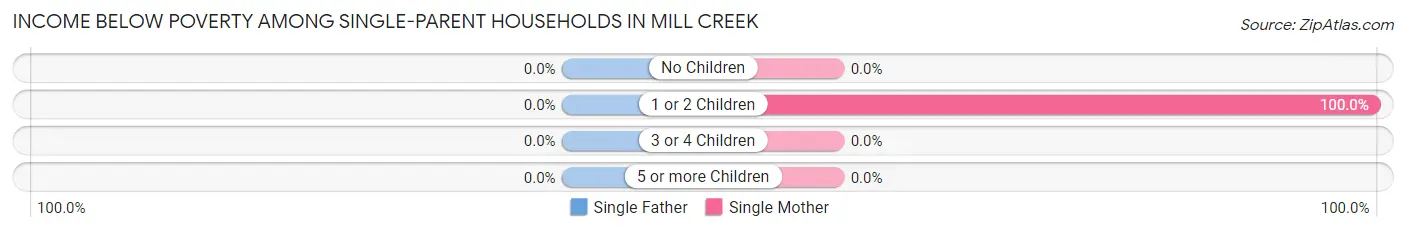
Income Below Poverty Among Single-Parent Households in Mill Creek
| Children | Single Father | Single Mother |
| No Children | 0 (0.0%) | 0 (0.0%) |
| 1 or 2 Children | 0 (0.0%) | 11 (100.0%) |
| 3 or 4 Children | 0 (0.0%) | 0 (0.0%) |
| 5 or more Children | 0 (0.0%) | 0 (0.0%) |
| Total | 0 (0.0%) | 11 (45.8%) |
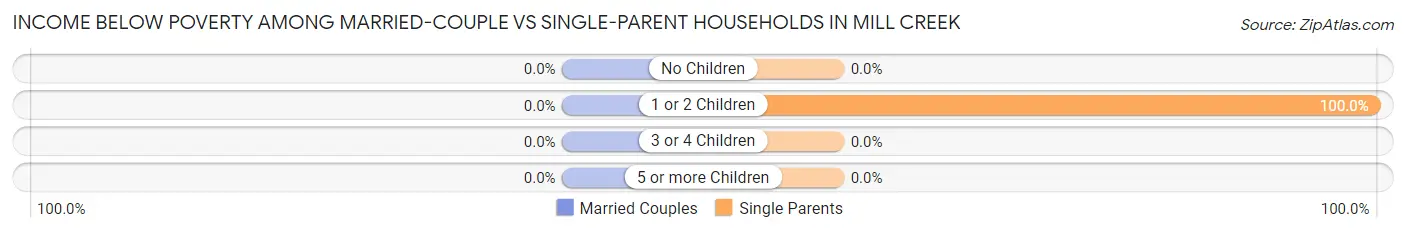
Income Below Poverty Among Married-Couple vs Single-Parent Households in Mill Creek
| Children | Married-Couple Families | Single-Parent Households |
| No Children | 0 (0.0%) | 0 (0.0%) |
| 1 or 2 Children | 0 (0.0%) | 11 (100.0%) |
| 3 or 4 Children | 0 (0.0%) | 0 (0.0%) |
| 5 or more Children | 0 (0.0%) | 0 (0.0%) |
| Total | 0 (0.0%) | 11 (45.8%) |
Employment Characteristics in Mill Creek
Employment by Class of Employer in Mill Creek
Among the 229 employed individuals in Mill Creek, private company employees (152 | 66.4%), state government employees (34 | 14.8%), and self-employed (incorporated) (32 | 14.0%) make up the most common classes of employment.
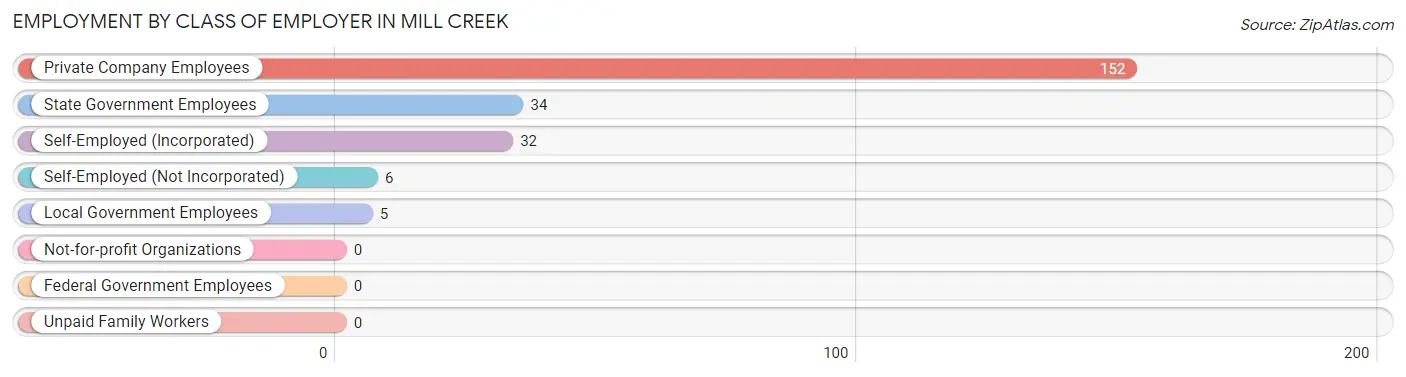
| Employer Class | # Employees | % Employees |
| Private Company Employees | 152 | 66.4% |
| Self-Employed (Incorporated) | 32 | 14.0% |
| Self-Employed (Not Incorporated) | 6 | 2.6% |
| Not-for-profit Organizations | 0 | 0.0% |
| Local Government Employees | 5 | 2.2% |
| State Government Employees | 34 | 14.8% |
| Federal Government Employees | 0 | 0.0% |
| Unpaid Family Workers | 0 | 0.0% |
| Total | 229 | 100.0% |
Employment Status by Age in Mill Creek
According to the labor force statistics for Mill Creek, out of the total population over 16 years of age (586), 53.4% or 313 individuals are in the labor force, with 11.2% or 35 of them unemployed. The age group with the highest labor force participation rate is 35 to 44 years, with 100.0% or 10 individuals in the labor force. Within the labor force, the 35 to 44 years age range has the highest percentage of unemployed individuals, with 50.0% or 5 of them being unemployed.
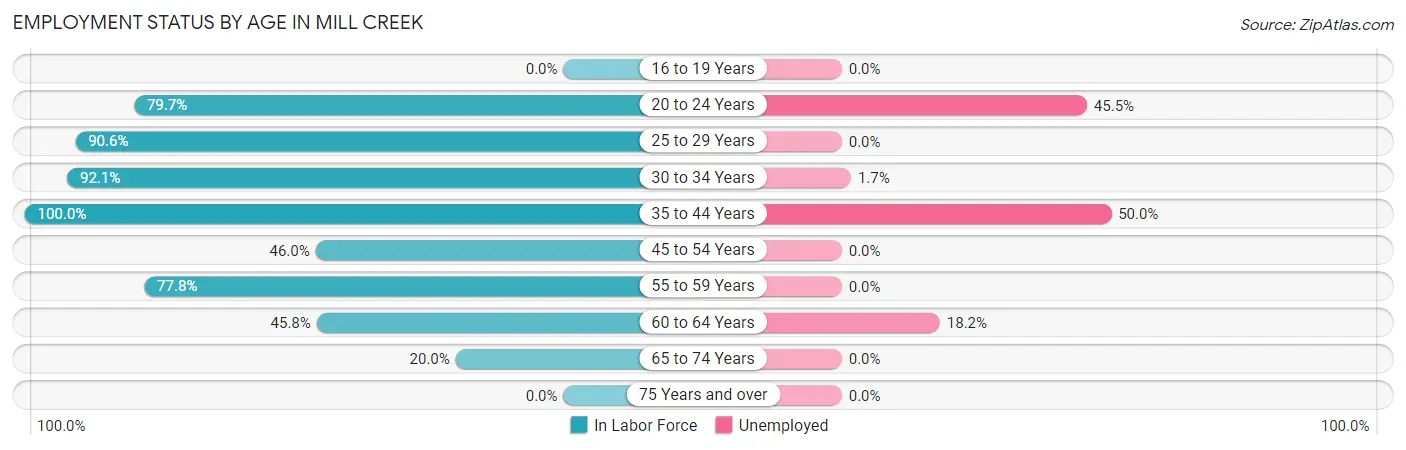
| Age Bracket | In Labor Force | Unemployed |
| 16 to 19 Years | 0 (0.0%) | 0 (0.0%) |
| 20 to 24 Years | 55 (79.7%) | 25 (45.5%) |
| 25 to 29 Years | 96 (90.6%) | 0 (0.0%) |
| 30 to 34 Years | 58 (92.1%) | 1 (1.7%) |
| 35 to 44 Years | 10 (100.0%) | 5 (50.0%) |
| 45 to 54 Years | 40 (46.0%) | 0 (0.0%) |
| 55 to 59 Years | 21 (77.8%) | 0 (0.0%) |
| 60 to 64 Years | 22 (45.8%) | 4 (18.2%) |
| 65 to 74 Years | 11 (20.0%) | 0 (0.0%) |
| 75 Years and over | 0 (0.0%) | 0 (0.0%) |
| Total | 313 (53.4%) | 35 (11.2%) |
Employment Status by Educational Attainment in Mill Creek
According to labor force statistics for Mill Creek, 72.4% of individuals (247) out of the total population between 25 and 64 years of age (341) are in the labor force, with 4.0% or 10 of them being unemployed. The group with the highest labor force participation rate are those with the educational attainment of college / associate degree, with 90.2% or 46 individuals in the labor force. Within the labor force, individuals with college / associate degree education have the highest percentage of unemployment, with 13.0% or 6 of them being unemployed.
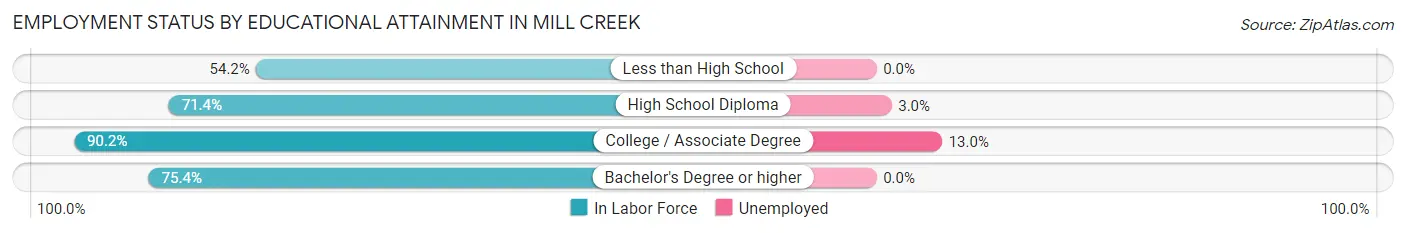
| Educational Attainment | In Labor Force | Unemployed |
| Less than High School | 26 (54.2%) | 0 (0.0%) |
| High School Diploma | 132 (71.4%) | 6 (3.0%) |
| College / Associate Degree | 46 (90.2%) | 7 (13.0%) |
| Bachelor's Degree or higher | 43 (75.4%) | 0 (0.0%) |
| Total | 247 (72.4%) | 14 (4.0%) |
Employment Occupations by Sex in Mill Creek
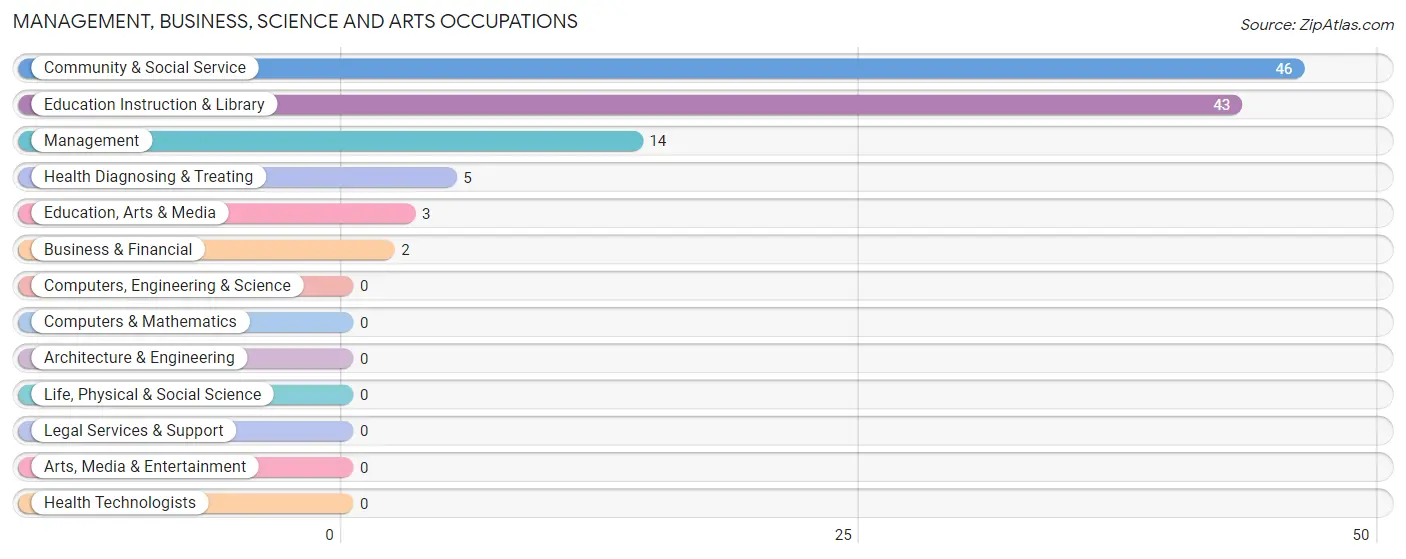
Management, Business, Science and Arts Occupations
The most common Management, Business, Science and Arts occupations in Mill Creek are Community & Social Service (46 | 16.6%), Education Instruction & Library (43 | 15.5%), Management (14 | 5.0%), Health Diagnosing & Treating (5 | 1.8%), and Education, Arts & Media (3 | 1.1%).
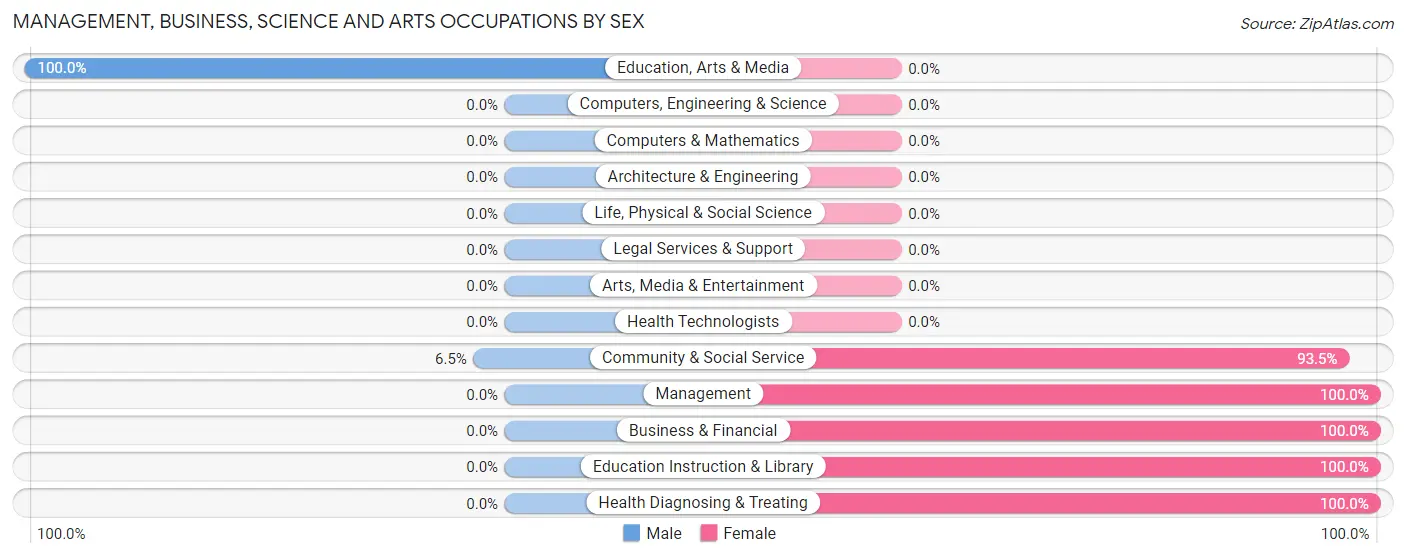
Management, Business, Science and Arts Occupations by Sex
Within the Management, Business, Science and Arts occupations in Mill Creek, the most male-oriented occupations are Education, Arts & Media (100.0%), and Community & Social Service (6.5%), while the most female-oriented occupations are Management (100.0%), Business & Financial (100.0%), and Education Instruction & Library (100.0%).
| Occupation | Male | Female |
| Management | 0 (0.0%) | 14 (100.0%) |
| Business & Financial | 0 (0.0%) | 2 (100.0%) |
| Computers, Engineering & Science | 0 (0.0%) | 0 (0.0%) |
| Computers & Mathematics | 0 (0.0%) | 0 (0.0%) |
| Architecture & Engineering | 0 (0.0%) | 0 (0.0%) |
| Life, Physical & Social Science | 0 (0.0%) | 0 (0.0%) |
| Community & Social Service | 3 (6.5%) | 43 (93.5%) |
| Education, Arts & Media | 3 (100.0%) | 0 (0.0%) |
| Legal Services & Support | 0 (0.0%) | 0 (0.0%) |
| Education Instruction & Library | 0 (0.0%) | 43 (100.0%) |
| Arts, Media & Entertainment | 0 (0.0%) | 0 (0.0%) |
| Health Diagnosing & Treating | 0 (0.0%) | 5 (100.0%) |
| Health Technologists | 0 (0.0%) | 0 (0.0%) |
| Total (Category) | 3 (4.5%) | 64 (95.5%) |
| Total (Overall) | 158 (56.8%) | 120 (43.2%) |
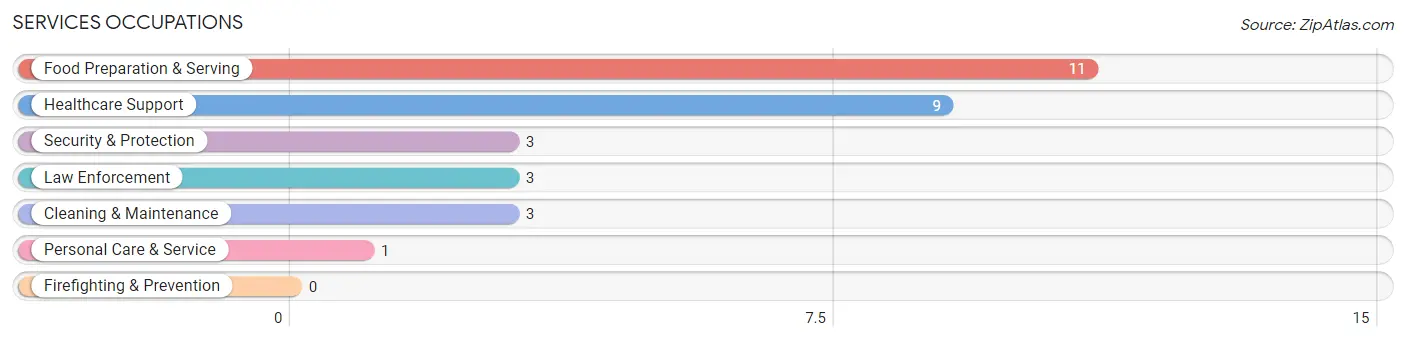
Services Occupations
The most common Services occupations in Mill Creek are Food Preparation & Serving (11 | 4.0%), Healthcare Support (9 | 3.2%), Security & Protection (3 | 1.1%), Law Enforcement (3 | 1.1%), and Cleaning & Maintenance (3 | 1.1%).
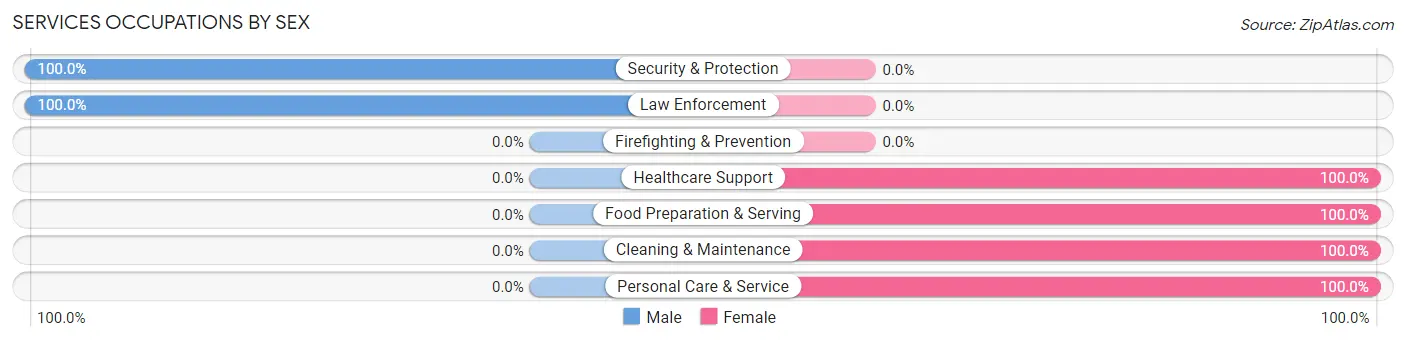
Services Occupations by Sex
Within the Services occupations in Mill Creek, the most male-oriented occupations are Security & Protection (100.0%), and Law Enforcement (100.0%), while the most female-oriented occupations are Healthcare Support (100.0%), Food Preparation & Serving (100.0%), and Cleaning & Maintenance (100.0%).
| Occupation | Male | Female |
| Healthcare Support | 0 (0.0%) | 9 (100.0%) |
| Security & Protection | 3 (100.0%) | 0 (0.0%) |
| Firefighting & Prevention | 0 (0.0%) | 0 (0.0%) |
| Law Enforcement | 3 (100.0%) | 0 (0.0%) |
| Food Preparation & Serving | 0 (0.0%) | 11 (100.0%) |
| Cleaning & Maintenance | 0 (0.0%) | 3 (100.0%) |
| Personal Care & Service | 0 (0.0%) | 1 (100.0%) |
| Total (Category) | 3 (11.1%) | 24 (88.9%) |
| Total (Overall) | 158 (56.8%) | 120 (43.2%) |
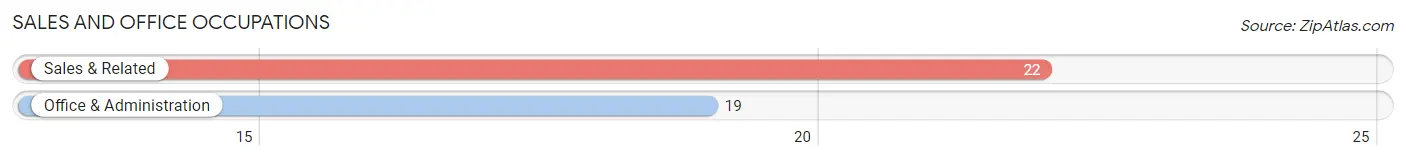
Sales and Office Occupations
The most common Sales and Office occupations in Mill Creek are Sales & Related (22 | 7.9%), and Office & Administration (19 | 6.8%).
Sales and Office Occupations by Sex
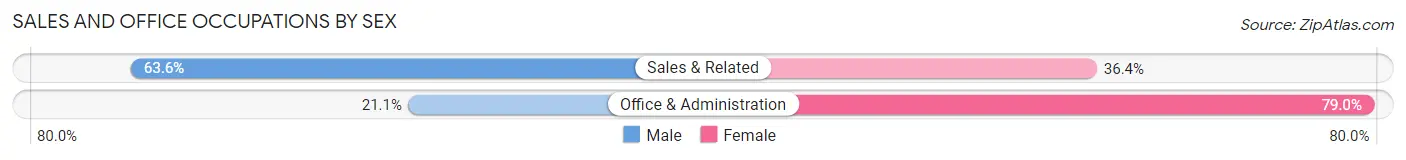
| Occupation | Male | Female |
| Sales & Related | 14 (63.6%) | 8 (36.4%) |
| Office & Administration | 4 (21.0%) | 15 (78.9%) |
| Total (Category) | 18 (43.9%) | 23 (56.1%) |
| Total (Overall) | 158 (56.8%) | 120 (43.2%) |
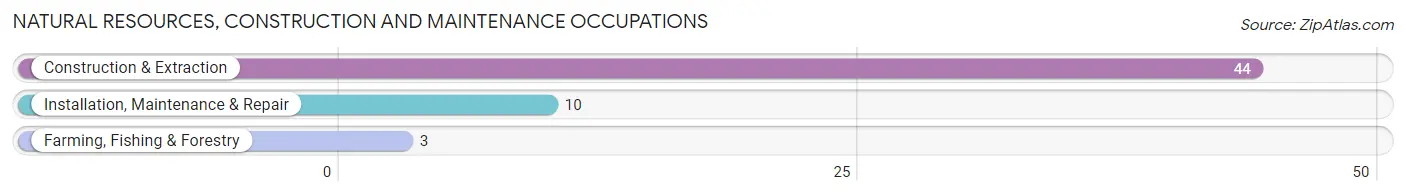
Natural Resources, Construction and Maintenance Occupations
The most common Natural Resources, Construction and Maintenance occupations in Mill Creek are Construction & Extraction (44 | 15.8%), Installation, Maintenance & Repair (10 | 3.6%), and Farming, Fishing & Forestry (3 | 1.1%).
Natural Resources, Construction and Maintenance Occupations by Sex
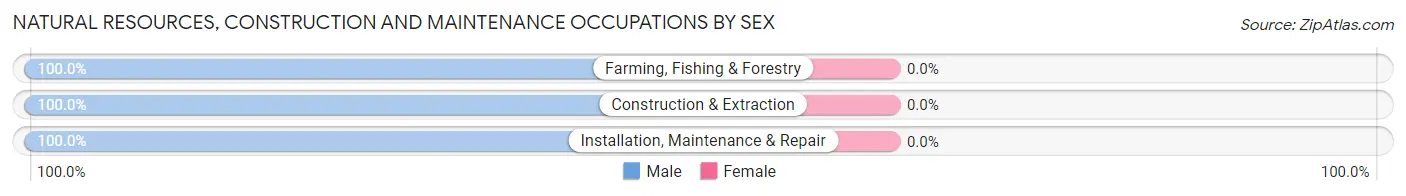
| Occupation | Male | Female |
| Farming, Fishing & Forestry | 3 (100.0%) | 0 (0.0%) |
| Construction & Extraction | 44 (100.0%) | 0 (0.0%) |
| Installation, Maintenance & Repair | 10 (100.0%) | 0 (0.0%) |
| Total (Category) | 57 (100.0%) | 0 (0.0%) |
| Total (Overall) | 158 (56.8%) | 120 (43.2%) |
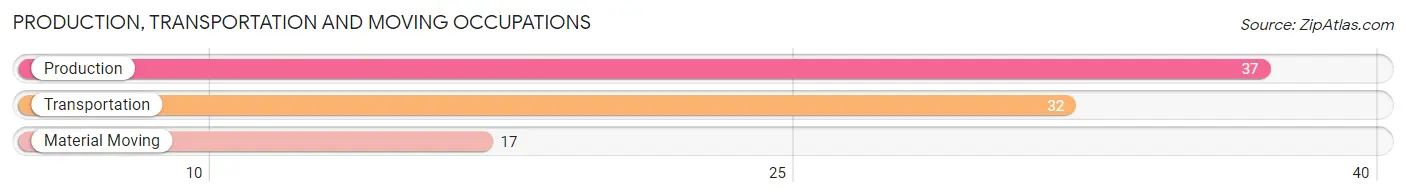
Production, Transportation and Moving Occupations
The most common Production, Transportation and Moving occupations in Mill Creek are Production (37 | 13.3%), Transportation (32 | 11.5%), and Material Moving (17 | 6.1%).
Production, Transportation and Moving Occupations by Sex
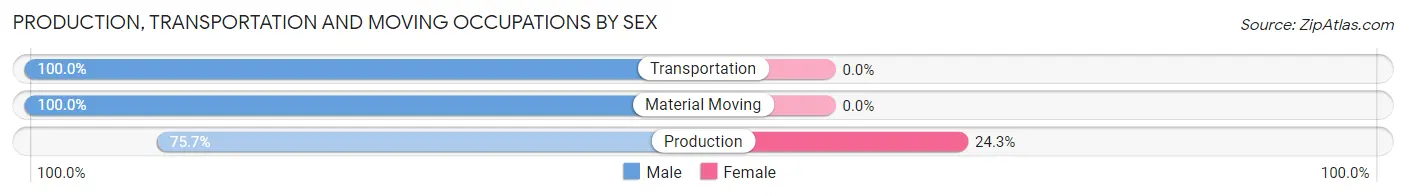
| Occupation | Male | Female |
| Production | 28 (75.7%) | 9 (24.3%) |
| Transportation | 32 (100.0%) | 0 (0.0%) |
| Material Moving | 17 (100.0%) | 0 (0.0%) |
| Total (Category) | 77 (89.5%) | 9 (10.5%) |
| Total (Overall) | 158 (56.8%) | 120 (43.2%) |
Employment Industries by Sex in Mill Creek
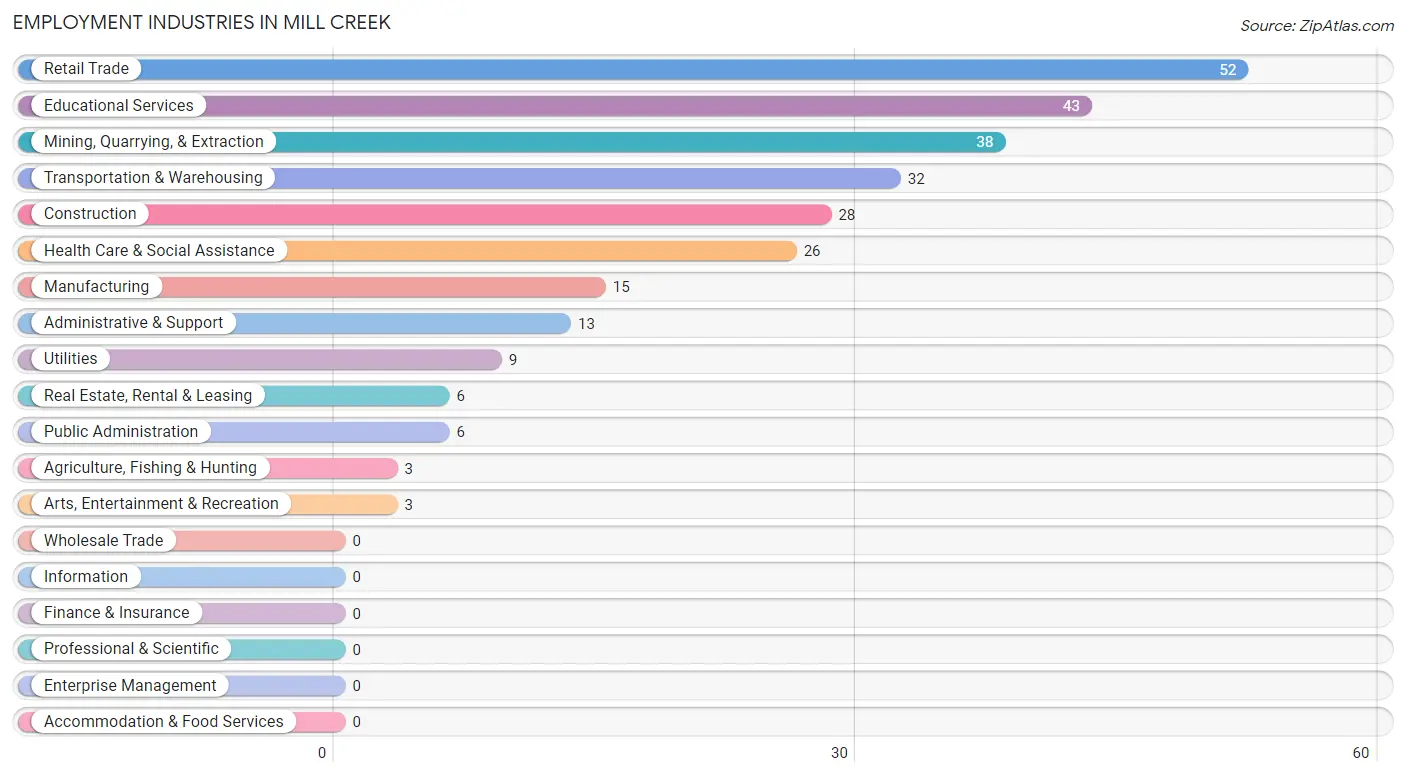
Employment Industries in Mill Creek
The major employment industries in Mill Creek include Retail Trade (52 | 18.7%), Educational Services (43 | 15.5%), Mining, Quarrying, & Extraction (38 | 13.7%), Transportation & Warehousing (32 | 11.5%), and Construction (28 | 10.1%).
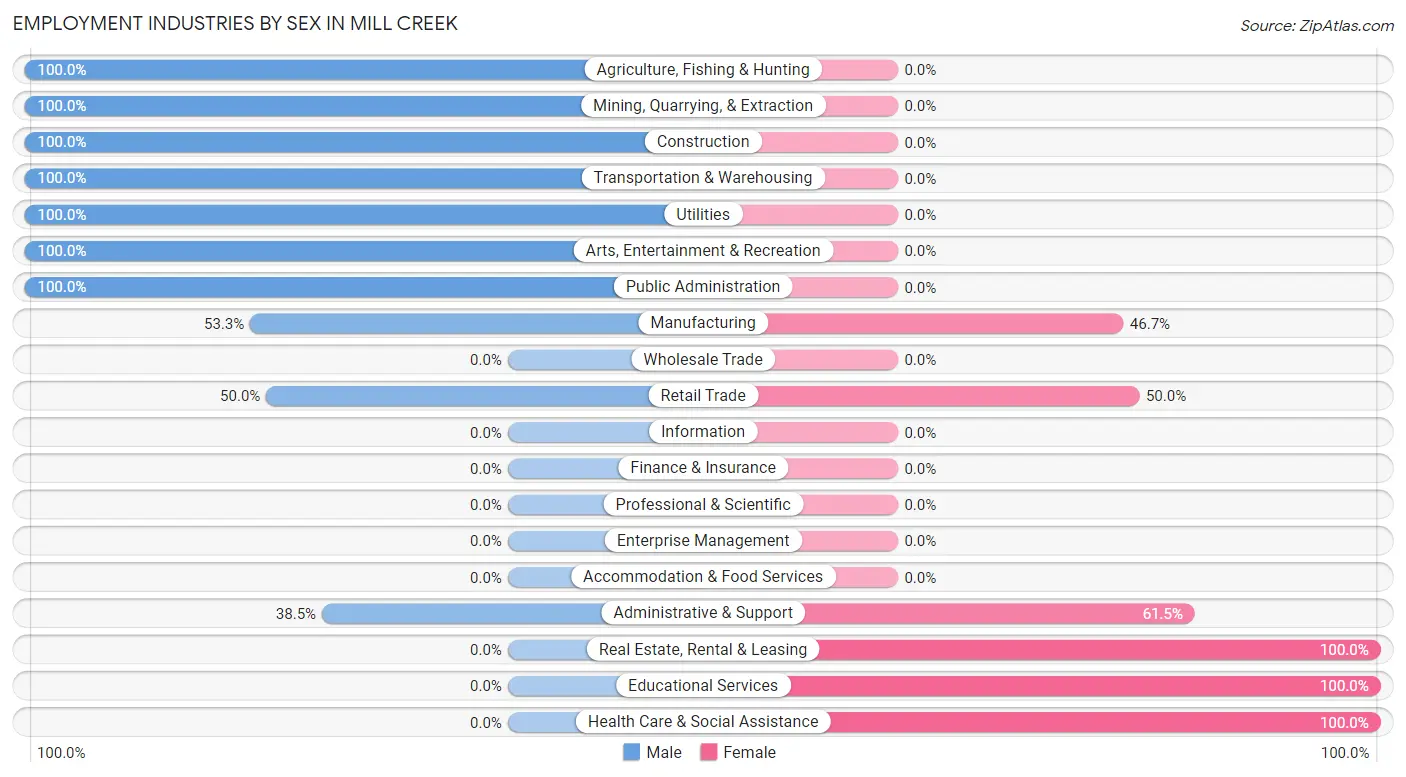
Employment Industries by Sex in Mill Creek
The Mill Creek industries that see more men than women are Agriculture, Fishing & Hunting (100.0%), Mining, Quarrying, & Extraction (100.0%), and Construction (100.0%), whereas the industries that tend to have a higher number of women are Real Estate, Rental & Leasing (100.0%), Educational Services (100.0%), and Health Care & Social Assistance (100.0%).
| Industry | Male | Female |
| Agriculture, Fishing & Hunting | 3 (100.0%) | 0 (0.0%) |
| Mining, Quarrying, & Extraction | 38 (100.0%) | 0 (0.0%) |
| Construction | 28 (100.0%) | 0 (0.0%) |
| Manufacturing | 8 (53.3%) | 7 (46.7%) |
| Wholesale Trade | 0 (0.0%) | 0 (0.0%) |
| Retail Trade | 26 (50.0%) | 26 (50.0%) |
| Transportation & Warehousing | 32 (100.0%) | 0 (0.0%) |
| Utilities | 9 (100.0%) | 0 (0.0%) |
| Information | 0 (0.0%) | 0 (0.0%) |
| Finance & Insurance | 0 (0.0%) | 0 (0.0%) |
| Real Estate, Rental & Leasing | 0 (0.0%) | 6 (100.0%) |
| Professional & Scientific | 0 (0.0%) | 0 (0.0%) |
| Enterprise Management | 0 (0.0%) | 0 (0.0%) |
| Administrative & Support | 5 (38.5%) | 8 (61.5%) |
| Educational Services | 0 (0.0%) | 43 (100.0%) |
| Health Care & Social Assistance | 0 (0.0%) | 26 (100.0%) |
| Arts, Entertainment & Recreation | 3 (100.0%) | 0 (0.0%) |
| Accommodation & Food Services | 0 (0.0%) | 0 (0.0%) |
| Public Administration | 6 (100.0%) | 0 (0.0%) |
| Total | 158 (56.8%) | 120 (43.2%) |
Education in Mill Creek
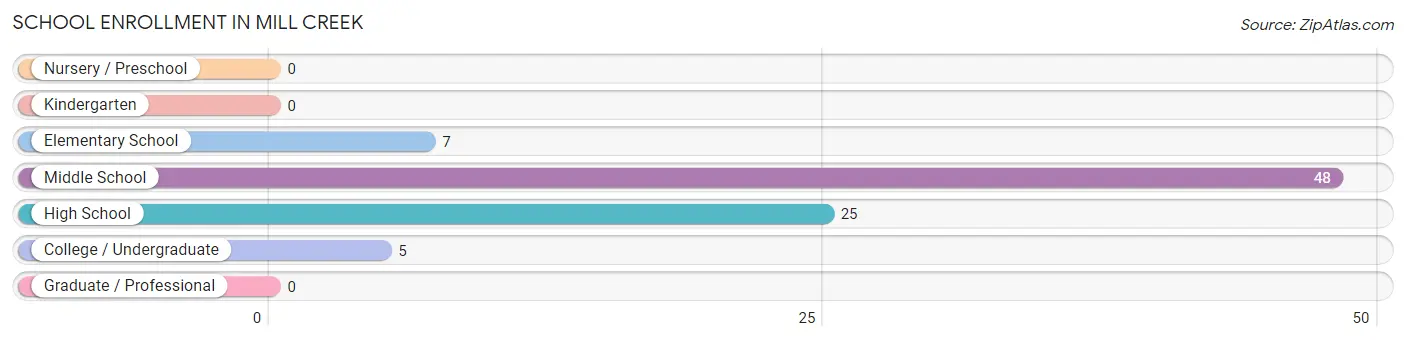
School Enrollment in Mill Creek
The most common levels of schooling among the 85 students in Mill Creek are middle school (48 | 56.5%), high school (25 | 29.4%), and elementary school (7 | 8.2%).
| School Level | # Students | % Students |
| Nursery / Preschool | 0 | 0.0% |
| Kindergarten | 0 | 0.0% |
| Elementary School | 7 | 8.2% |
| Middle School | 48 | 56.5% |
| High School | 25 | 29.4% |
| College / Undergraduate | 5 | 5.9% |
| Graduate / Professional | 0 | 0.0% |
| Total | 85 | 100.0% |
School Enrollment by Age by Funding Source in Mill Creek
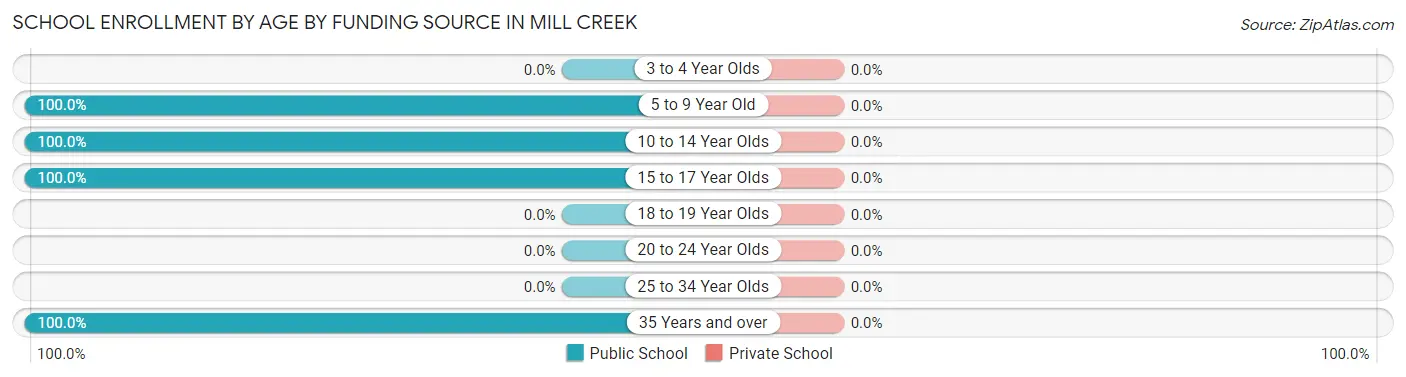
| Age Bracket | Public School | Private School |
| 3 to 4 Year Olds | 0 (0.0%) | 0 (0.0%) |
| 5 to 9 Year Old | 7 (100.0%) | 0 (0.0%) |
| 10 to 14 Year Olds | 48 (100.0%) | 0 (0.0%) |
| 15 to 17 Year Olds | 25 (100.0%) | 0 (0.0%) |
| 18 to 19 Year Olds | 0 (0.0%) | 0 (0.0%) |
| 20 to 24 Year Olds | 0 (0.0%) | 0 (0.0%) |
| 25 to 34 Year Olds | 0 (0.0%) | 0 (0.0%) |
| 35 Years and over | 5 (100.0%) | 0 (0.0%) |
| Total | 85 (100.0%) | 0 (0.0%) |
Educational Attainment by Field of Study in Mill Creek
Education (43 | 75.4%), and business (14 | 24.6%) are the most common fields of study among 57 individuals in Mill Creek who have obtained a bachelor's degree or higher.
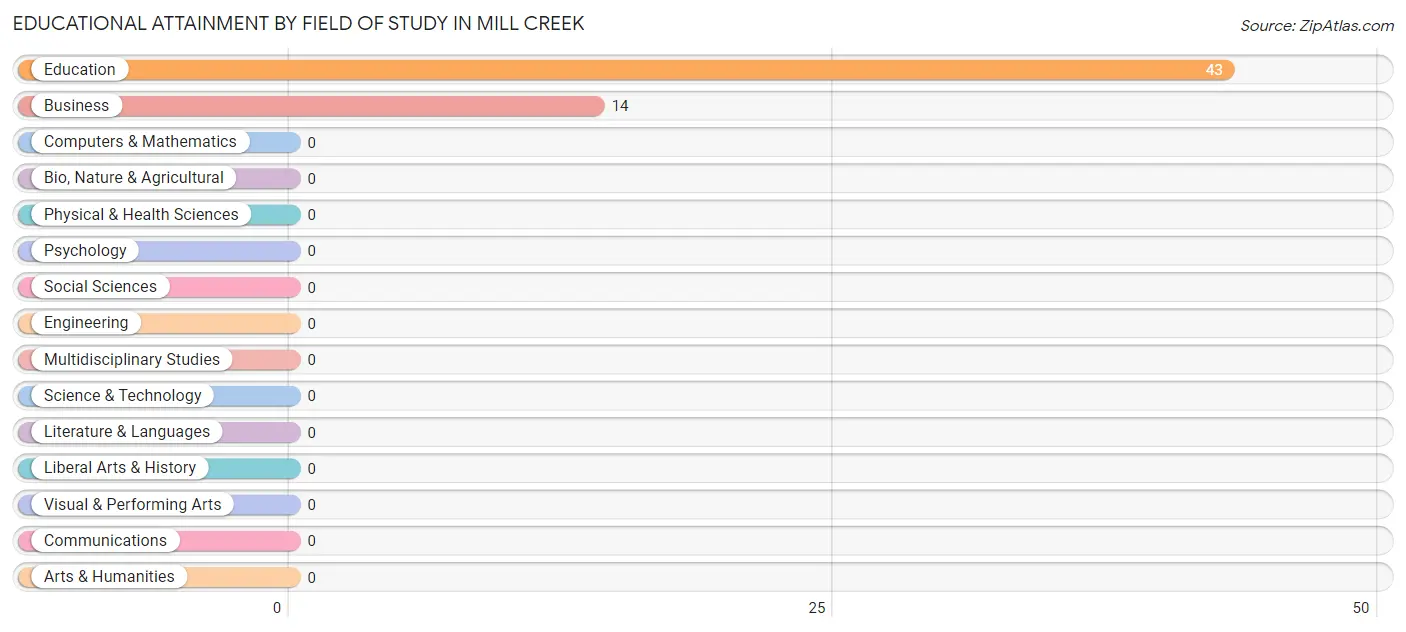
| Field of Study | # Graduates | % Graduates |
| Computers & Mathematics | 0 | 0.0% |
| Bio, Nature & Agricultural | 0 | 0.0% |
| Physical & Health Sciences | 0 | 0.0% |
| Psychology | 0 | 0.0% |
| Social Sciences | 0 | 0.0% |
| Engineering | 0 | 0.0% |
| Multidisciplinary Studies | 0 | 0.0% |
| Science & Technology | 0 | 0.0% |
| Business | 14 | 24.6% |
| Education | 43 | 75.4% |
| Literature & Languages | 0 | 0.0% |
| Liberal Arts & History | 0 | 0.0% |
| Visual & Performing Arts | 0 | 0.0% |
| Communications | 0 | 0.0% |
| Arts & Humanities | 0 | 0.0% |
| Total | 57 | 100.0% |
Transportation & Commute in Mill Creek
Vehicle Availability by Sex in Mill Creek
The most prevalent vehicle ownership categories in Mill Creek are males with 2 vehicles (54, accounting for 35.5%) and females with 2 vehicles (33, making up 70.1%).
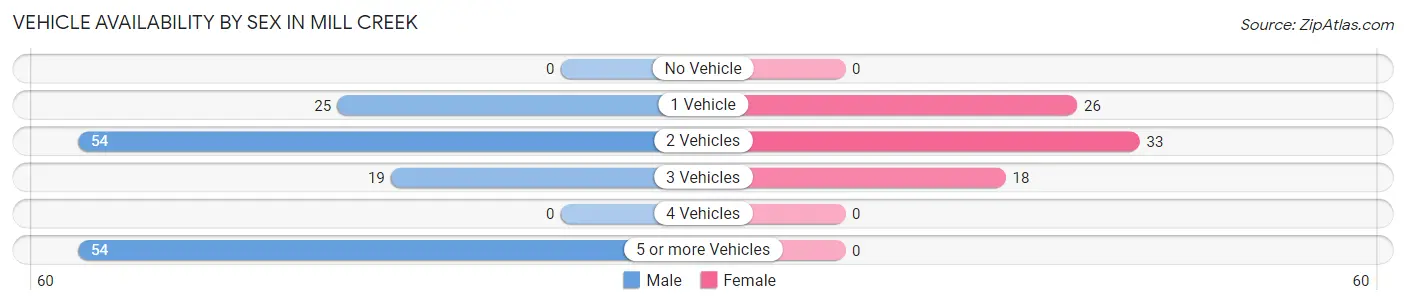
| Vehicles Available | Male | Female |
| No Vehicle | 0 (0.0%) | 0 (0.0%) |
| 1 Vehicle | 25 (16.5%) | 26 (33.8%) |
| 2 Vehicles | 54 (35.5%) | 33 (42.9%) |
| 3 Vehicles | 19 (12.5%) | 18 (23.4%) |
| 4 Vehicles | 0 (0.0%) | 0 (0.0%) |
| 5 or more Vehicles | 54 (35.5%) | 0 (0.0%) |
| Total | 152 (100.0%) | 77 (100.0%) |
Commute Time in Mill Creek
The most frequently occuring commute durations in Mill Creek are 20 to 24 minutes (51 commuters, 27.6%), 60 to 89 minutes (33 commuters, 17.8%), and 5 to 9 minutes (25 commuters, 13.5%).
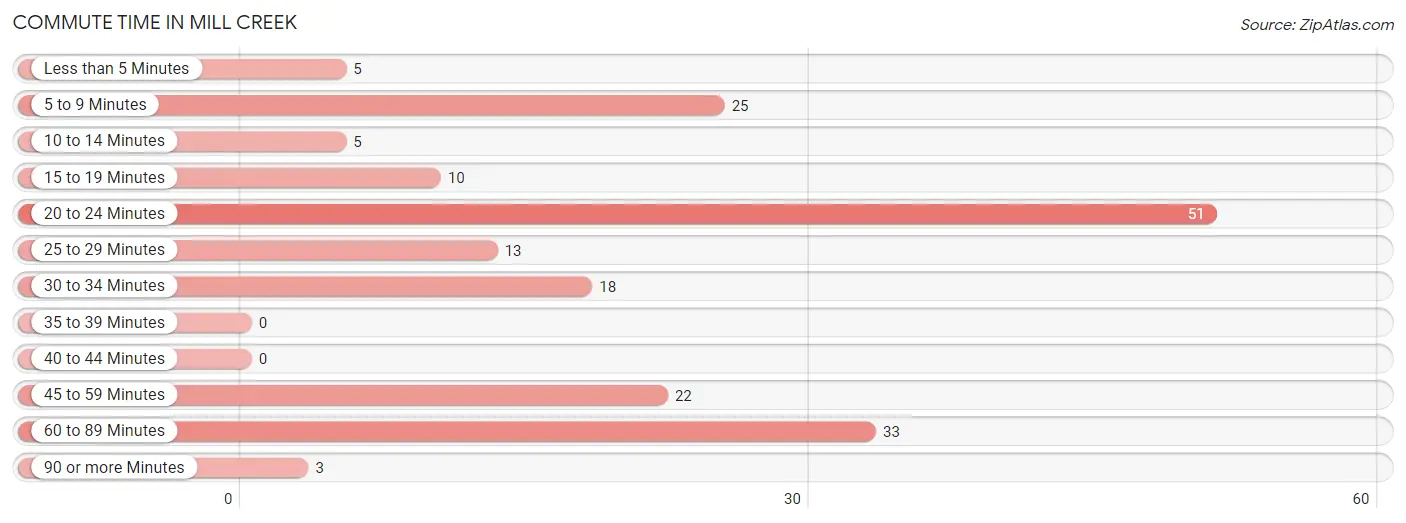
| Commute Time | # Commuters | % Commuters |
| Less than 5 Minutes | 5 | 2.7% |
| 5 to 9 Minutes | 25 | 13.5% |
| 10 to 14 Minutes | 5 | 2.7% |
| 15 to 19 Minutes | 10 | 5.4% |
| 20 to 24 Minutes | 51 | 27.6% |
| 25 to 29 Minutes | 13 | 7.0% |
| 30 to 34 Minutes | 18 | 9.7% |
| 35 to 39 Minutes | 0 | 0.0% |
| 40 to 44 Minutes | 0 | 0.0% |
| 45 to 59 Minutes | 22 | 11.9% |
| 60 to 89 Minutes | 33 | 17.8% |
| 90 or more Minutes | 3 | 1.6% |
Commute Time by Sex in Mill Creek
The most common commute times in Mill Creek are 60 to 89 minutes (25 commuters, 21.5%) for males and 20 to 24 minutes (32 commuters, 46.4%) for females.
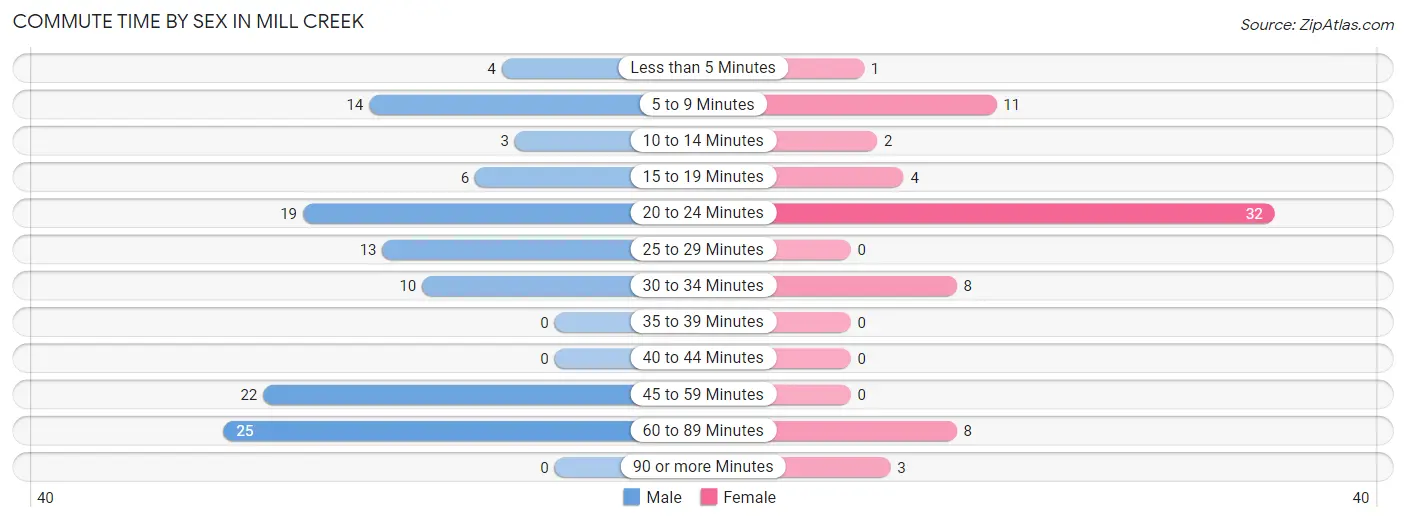
| Commute Time | Male | Female |
| Less than 5 Minutes | 4 (3.5%) | 1 (1.5%) |
| 5 to 9 Minutes | 14 (12.1%) | 11 (15.9%) |
| 10 to 14 Minutes | 3 (2.6%) | 2 (2.9%) |
| 15 to 19 Minutes | 6 (5.2%) | 4 (5.8%) |
| 20 to 24 Minutes | 19 (16.4%) | 32 (46.4%) |
| 25 to 29 Minutes | 13 (11.2%) | 0 (0.0%) |
| 30 to 34 Minutes | 10 (8.6%) | 8 (11.6%) |
| 35 to 39 Minutes | 0 (0.0%) | 0 (0.0%) |
| 40 to 44 Minutes | 0 (0.0%) | 0 (0.0%) |
| 45 to 59 Minutes | 22 (19.0%) | 0 (0.0%) |
| 60 to 89 Minutes | 25 (21.5%) | 8 (11.6%) |
| 90 or more Minutes | 0 (0.0%) | 3 (4.3%) |
Time of Departure to Work by Sex in Mill Creek
The most frequent times of departure to work in Mill Creek are 8:00 AM to 8:29 AM (25, 21.5%) for males and 7:00 AM to 7:29 AM (31, 44.9%) for females.
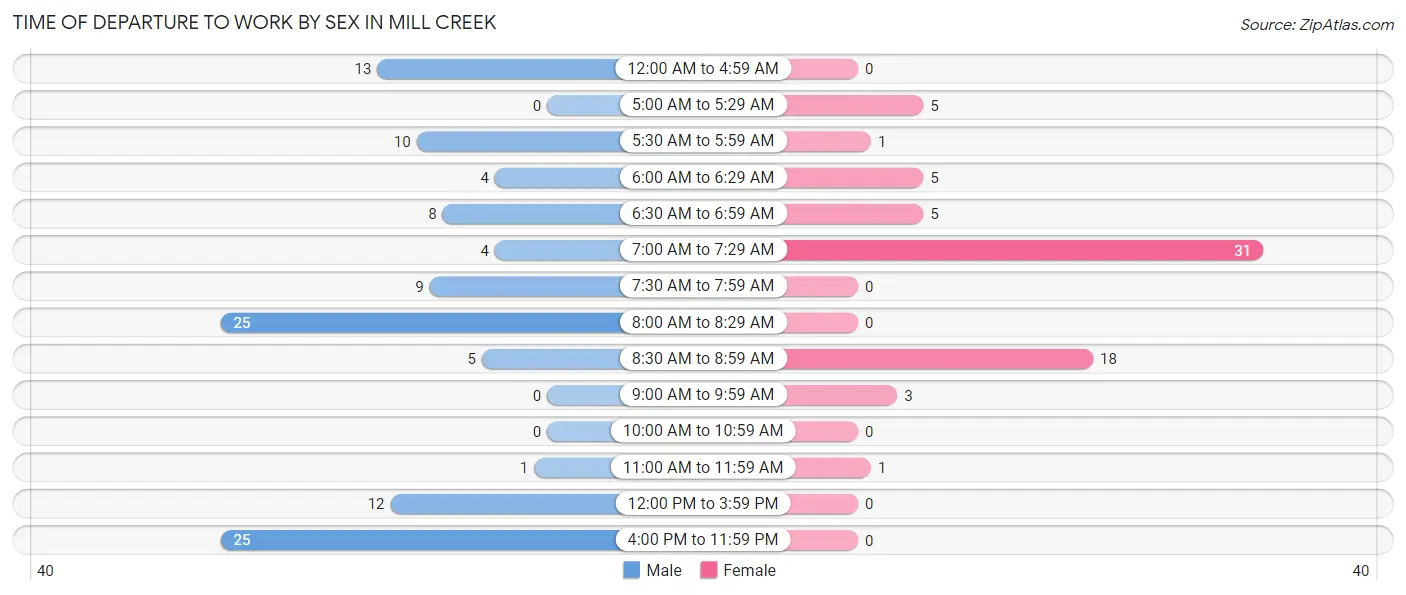
| Time of Departure | Male | Female |
| 12:00 AM to 4:59 AM | 13 (11.2%) | 0 (0.0%) |
| 5:00 AM to 5:29 AM | 0 (0.0%) | 5 (7.2%) |
| 5:30 AM to 5:59 AM | 10 (8.6%) | 1 (1.5%) |
| 6:00 AM to 6:29 AM | 4 (3.5%) | 5 (7.2%) |
| 6:30 AM to 6:59 AM | 8 (6.9%) | 5 (7.2%) |
| 7:00 AM to 7:29 AM | 4 (3.5%) | 31 (44.9%) |
| 7:30 AM to 7:59 AM | 9 (7.8%) | 0 (0.0%) |
| 8:00 AM to 8:29 AM | 25 (21.5%) | 0 (0.0%) |
| 8:30 AM to 8:59 AM | 5 (4.3%) | 18 (26.1%) |
| 9:00 AM to 9:59 AM | 0 (0.0%) | 3 (4.3%) |
| 10:00 AM to 10:59 AM | 0 (0.0%) | 0 (0.0%) |
| 11:00 AM to 11:59 AM | 1 (0.9%) | 1 (1.5%) |
| 12:00 PM to 3:59 PM | 12 (10.3%) | 0 (0.0%) |
| 4:00 PM to 11:59 PM | 25 (21.5%) | 0 (0.0%) |
| Total | 116 (100.0%) | 69 (100.0%) |
Housing Occupancy in Mill Creek
Occupancy by Ownership in Mill Creek
Of the total 260 dwellings in Mill Creek, owner-occupied units account for 187 (71.9%), while renter-occupied units make up 73 (28.1%).
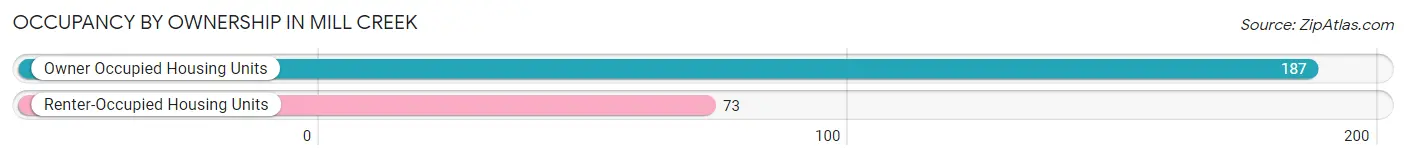
| Occupancy | # Housing Units | % Housing Units |
| Owner Occupied Housing Units | 187 | 71.9% |
| Renter-Occupied Housing Units | 73 | 28.1% |
| Total Occupied Housing Units | 260 | 100.0% |
Occupancy by Household Size in Mill Creek
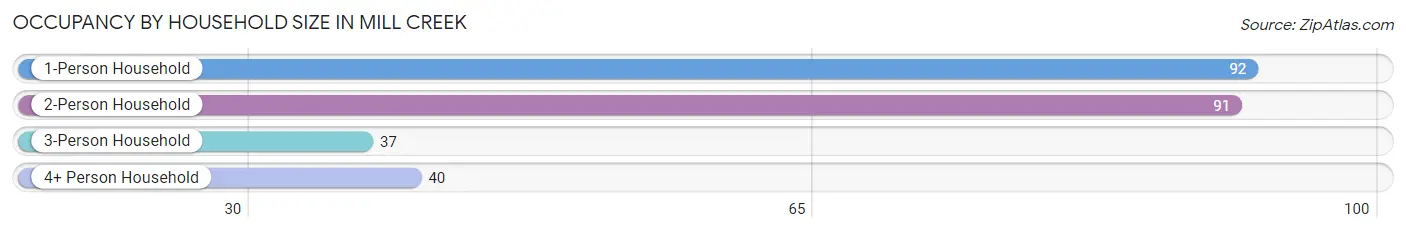
| Household Size | # Housing Units | % Housing Units |
| 1-Person Household | 92 | 35.4% |
| 2-Person Household | 91 | 35.0% |
| 3-Person Household | 37 | 14.2% |
| 4+ Person Household | 40 | 15.4% |
| Total Housing Units | 260 | 100.0% |
Occupancy by Ownership by Household Size in Mill Creek
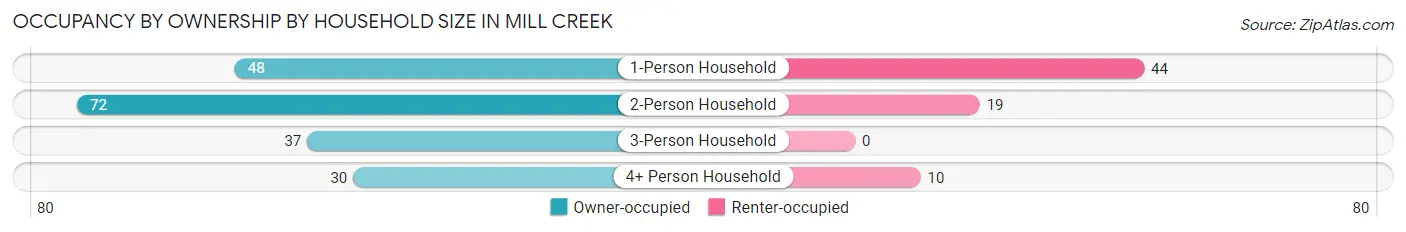
| Household Size | Owner-occupied | Renter-occupied |
| 1-Person Household | 48 (52.2%) | 44 (47.8%) |
| 2-Person Household | 72 (79.1%) | 19 (20.9%) |
| 3-Person Household | 37 (100.0%) | 0 (0.0%) |
| 4+ Person Household | 30 (75.0%) | 10 (25.0%) |
| Total Housing Units | 187 (71.9%) | 73 (28.1%) |
Occupancy by Educational Attainment in Mill Creek
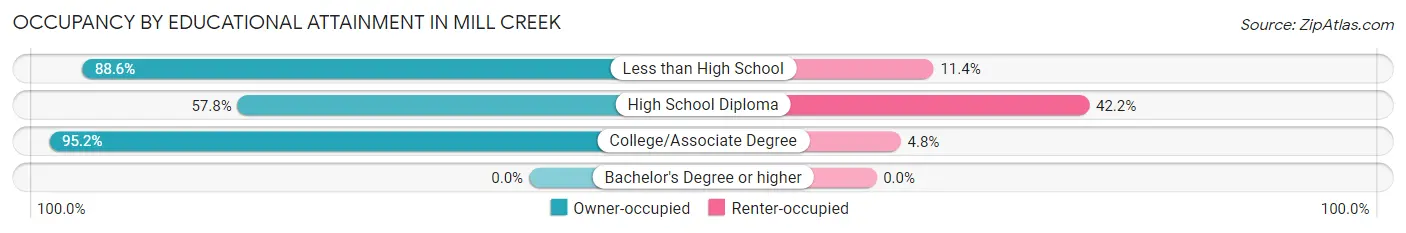
| Household Size | Owner-occupied | Renter-occupied |
| Less than High School | 39 (88.6%) | 5 (11.4%) |
| High School Diploma | 89 (57.8%) | 65 (42.2%) |
| College/Associate Degree | 59 (95.2%) | 3 (4.8%) |
| Bachelor's Degree or higher | 0 (0.0%) | 0 (0.0%) |
Occupancy by Age of Householder in Mill Creek
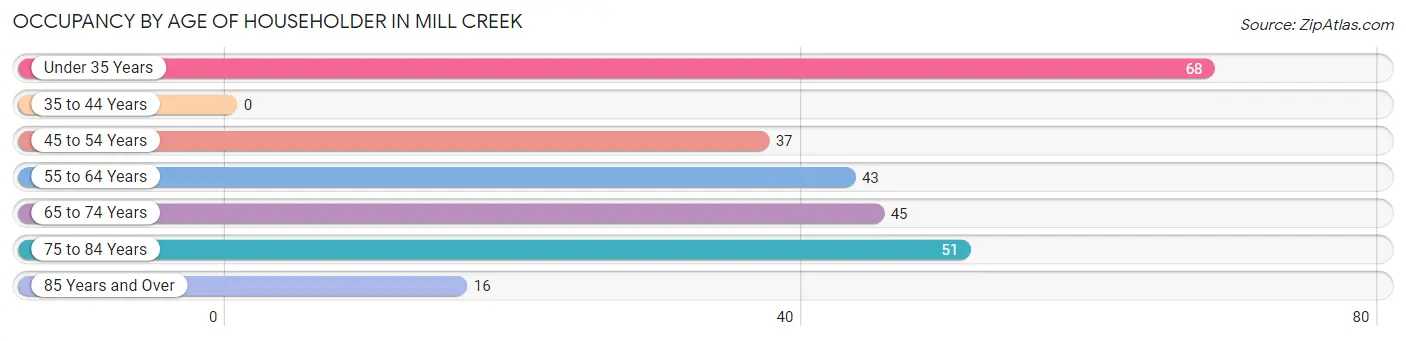
| Age Bracket | # Households | % Households |
| Under 35 Years | 68 | 26.2% |
| 35 to 44 Years | 0 | 0.0% |
| 45 to 54 Years | 37 | 14.2% |
| 55 to 64 Years | 43 | 16.5% |
| 65 to 74 Years | 45 | 17.3% |
| 75 to 84 Years | 51 | 19.6% |
| 85 Years and Over | 16 | 6.1% |
| Total | 260 | 100.0% |
Housing Finances in Mill Creek
Median Income by Occupancy in Mill Creek
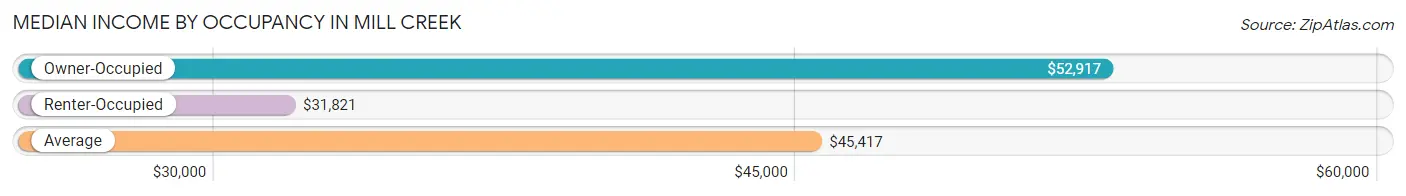
| Occupancy Type | # Households | Median Income |
| Owner-Occupied | 187 (71.9%) | $52,917 |
| Renter-Occupied | 73 (28.1%) | $31,821 |
| Average | 260 (100.0%) | $45,417 |
Occupancy by Householder Income Bracket in Mill Creek
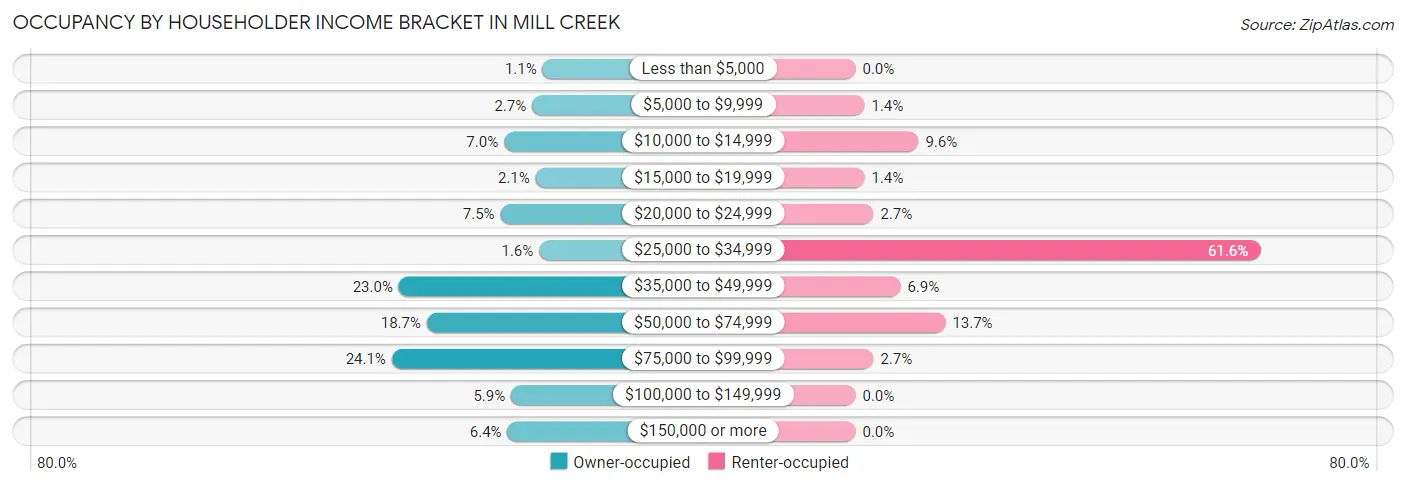
| Income Bracket | Owner-occupied | Renter-occupied |
| Less than $5,000 | 2 (1.1%) | 0 (0.0%) |
| $5,000 to $9,999 | 5 (2.7%) | 1 (1.4%) |
| $10,000 to $14,999 | 13 (7.0%) | 7 (9.6%) |
| $15,000 to $19,999 | 4 (2.1%) | 1 (1.4%) |
| $20,000 to $24,999 | 14 (7.5%) | 2 (2.7%) |
| $25,000 to $34,999 | 3 (1.6%) | 45 (61.6%) |
| $35,000 to $49,999 | 43 (23.0%) | 5 (6.9%) |
| $50,000 to $74,999 | 35 (18.7%) | 10 (13.7%) |
| $75,000 to $99,999 | 45 (24.1%) | 2 (2.7%) |
| $100,000 to $149,999 | 11 (5.9%) | 0 (0.0%) |
| $150,000 or more | 12 (6.4%) | 0 (0.0%) |
| Total | 187 (100.0%) | 73 (100.0%) |
Monthly Housing Cost Tiers in Mill Creek
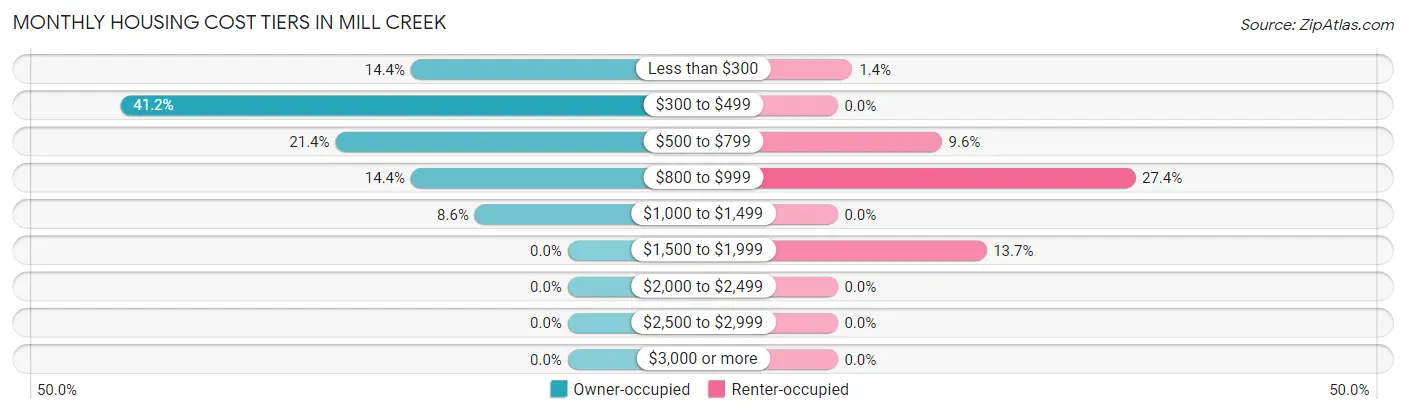
| Monthly Cost | Owner-occupied | Renter-occupied |
| Less than $300 | 27 (14.4%) | 1 (1.4%) |
| $300 to $499 | 77 (41.2%) | 0 (0.0%) |
| $500 to $799 | 40 (21.4%) | 7 (9.6%) |
| $800 to $999 | 27 (14.4%) | 20 (27.4%) |
| $1,000 to $1,499 | 16 (8.6%) | 0 (0.0%) |
| $1,500 to $1,999 | 0 (0.0%) | 10 (13.7%) |
| $2,000 to $2,499 | 0 (0.0%) | 0 (0.0%) |
| $2,500 to $2,999 | 0 (0.0%) | 0 (0.0%) |
| $3,000 or more | 0 (0.0%) | 0 (0.0%) |
| Total | 187 (100.0%) | 73 (100.0%) |
Physical Housing Characteristics in Mill Creek
Housing Structures in Mill Creek
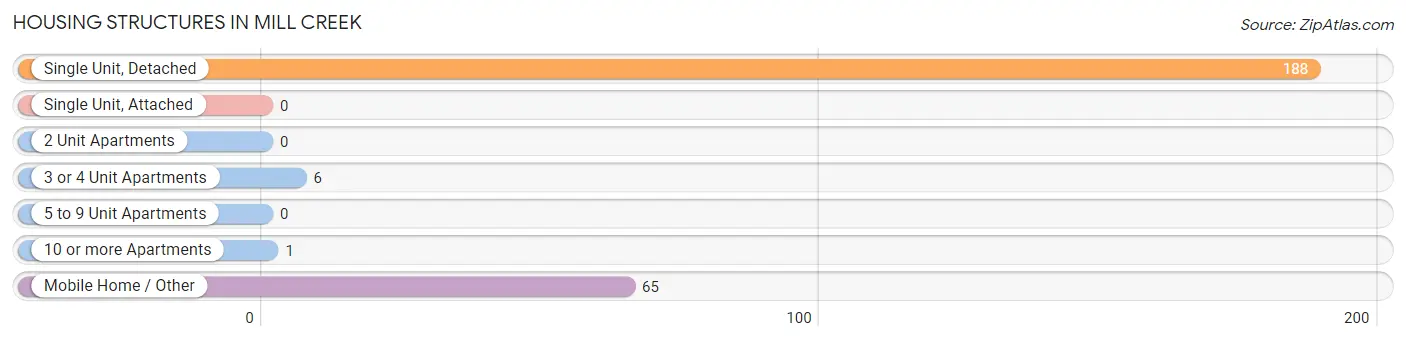
| Structure Type | # Housing Units | % Housing Units |
| Single Unit, Detached | 188 | 72.3% |
| Single Unit, Attached | 0 | 0.0% |
| 2 Unit Apartments | 0 | 0.0% |
| 3 or 4 Unit Apartments | 6 | 2.3% |
| 5 to 9 Unit Apartments | 0 | 0.0% |
| 10 or more Apartments | 1 | 0.4% |
| Mobile Home / Other | 65 | 25.0% |
| Total | 260 | 100.0% |
Housing Structures by Occupancy in Mill Creek
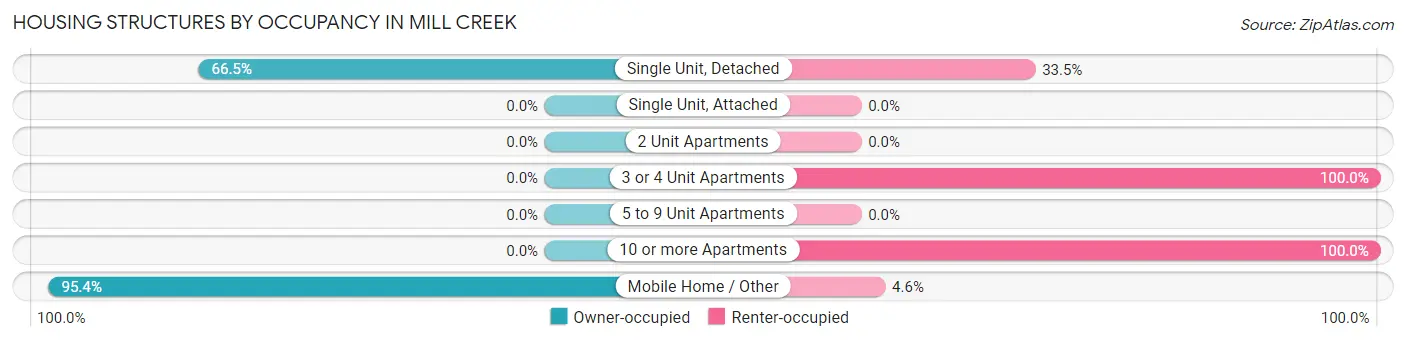
| Structure Type | Owner-occupied | Renter-occupied |
| Single Unit, Detached | 125 (66.5%) | 63 (33.5%) |
| Single Unit, Attached | 0 (0.0%) | 0 (0.0%) |
| 2 Unit Apartments | 0 (0.0%) | 0 (0.0%) |
| 3 or 4 Unit Apartments | 0 (0.0%) | 6 (100.0%) |
| 5 to 9 Unit Apartments | 0 (0.0%) | 0 (0.0%) |
| 10 or more Apartments | 0 (0.0%) | 1 (100.0%) |
| Mobile Home / Other | 62 (95.4%) | 3 (4.6%) |
| Total | 187 (71.9%) | 73 (28.1%) |
Housing Structures by Number of Rooms in Mill Creek
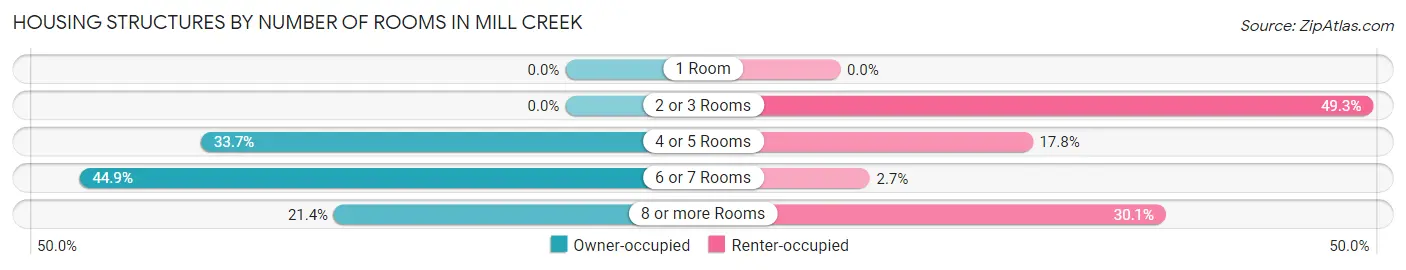
| Number of Rooms | Owner-occupied | Renter-occupied |
| 1 Room | 0 (0.0%) | 0 (0.0%) |
| 2 or 3 Rooms | 0 (0.0%) | 36 (49.3%) |
| 4 or 5 Rooms | 63 (33.7%) | 13 (17.8%) |
| 6 or 7 Rooms | 84 (44.9%) | 2 (2.7%) |
| 8 or more Rooms | 40 (21.4%) | 22 (30.1%) |
| Total | 187 (100.0%) | 73 (100.0%) |
Housing Structure by Heating Type in Mill Creek
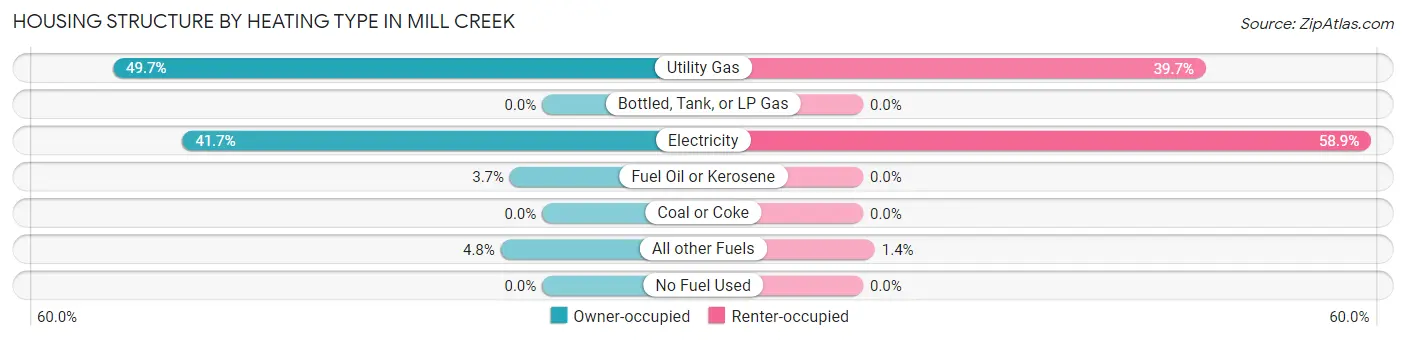
| Heating Type | Owner-occupied | Renter-occupied |
| Utility Gas | 93 (49.7%) | 29 (39.7%) |
| Bottled, Tank, or LP Gas | 0 (0.0%) | 0 (0.0%) |
| Electricity | 78 (41.7%) | 43 (58.9%) |
| Fuel Oil or Kerosene | 7 (3.7%) | 0 (0.0%) |
| Coal or Coke | 0 (0.0%) | 0 (0.0%) |
| All other Fuels | 9 (4.8%) | 1 (1.4%) |
| No Fuel Used | 0 (0.0%) | 0 (0.0%) |
| Total | 187 (100.0%) | 73 (100.0%) |
Household Vehicle Usage in Mill Creek
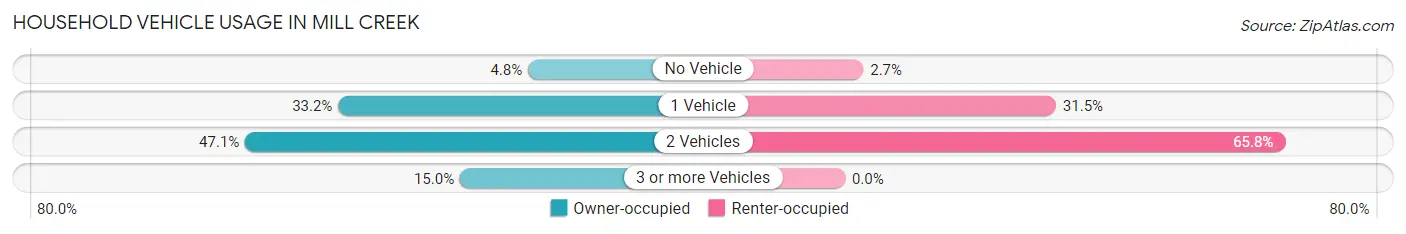
| Vehicles per Household | Owner-occupied | Renter-occupied |
| No Vehicle | 9 (4.8%) | 2 (2.7%) |
| 1 Vehicle | 62 (33.2%) | 23 (31.5%) |
| 2 Vehicles | 88 (47.1%) | 48 (65.7%) |
| 3 or more Vehicles | 28 (15.0%) | 0 (0.0%) |
| Total | 187 (100.0%) | 73 (100.0%) |
Real Estate & Mortgages in Mill Creek
Real Estate and Mortgage Overview in Mill Creek
| Characteristic | Without Mortgage | With Mortgage |
| Housing Units | 136 | 51 |
| Median Property Value | $81,000 | $106,300 |
| Median Household Income | $54,444 | $5 |
| Monthly Housing Costs | $357 | $0 |
| Real Estate Taxes | $323 | $0 |
Property Value by Mortgage Status in Mill Creek
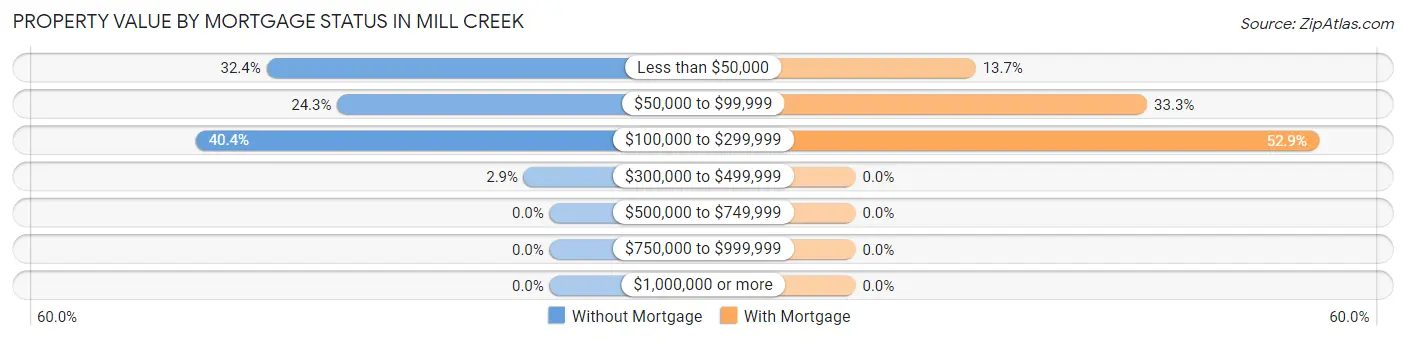
| Property Value | Without Mortgage | With Mortgage |
| Less than $50,000 | 44 (32.4%) | 7 (13.7%) |
| $50,000 to $99,999 | 33 (24.3%) | 17 (33.3%) |
| $100,000 to $299,999 | 55 (40.4%) | 27 (52.9%) |
| $300,000 to $499,999 | 4 (2.9%) | 0 (0.0%) |
| $500,000 to $749,999 | 0 (0.0%) | 0 (0.0%) |
| $750,000 to $999,999 | 0 (0.0%) | 0 (0.0%) |
| $1,000,000 or more | 0 (0.0%) | 0 (0.0%) |
| Total | 136 (100.0%) | 51 (100.0%) |
Household Income by Mortgage Status in Mill Creek
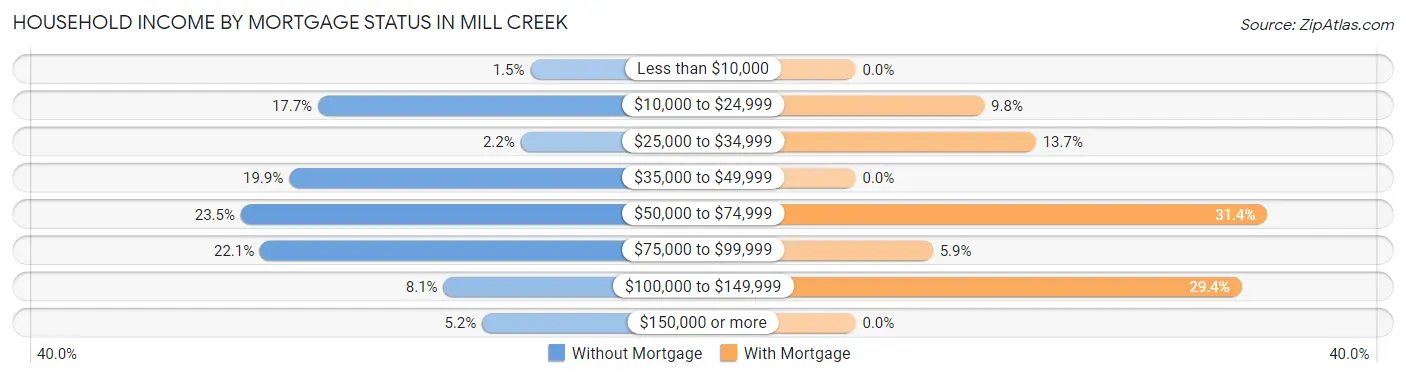
| Household Income | Without Mortgage | With Mortgage |
| Less than $10,000 | 2 (1.5%) | 0 (0.0%) |
| $10,000 to $24,999 | 24 (17.6%) | 5 (9.8%) |
| $25,000 to $34,999 | 3 (2.2%) | 7 (13.7%) |
| $35,000 to $49,999 | 27 (19.9%) | 0 (0.0%) |
| $50,000 to $74,999 | 32 (23.5%) | 16 (31.4%) |
| $75,000 to $99,999 | 30 (22.1%) | 3 (5.9%) |
| $100,000 to $149,999 | 11 (8.1%) | 15 (29.4%) |
| $150,000 or more | 7 (5.1%) | 0 (0.0%) |
| Total | 136 (100.0%) | 51 (100.0%) |
Property Value to Household Income Ratio in Mill Creek
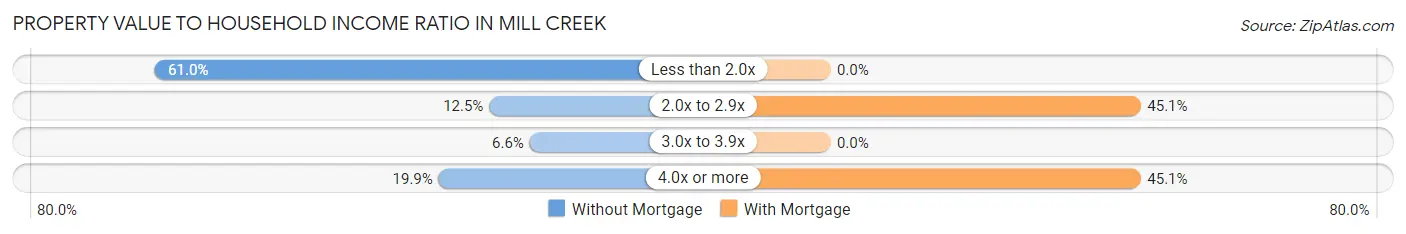
| Value-to-Income Ratio | Without Mortgage | With Mortgage |
| Less than 2.0x | 83 (61.0%) | 0 (0.0%) |
| 2.0x to 2.9x | 17 (12.5%) | 23 (45.1%) |
| 3.0x to 3.9x | 9 (6.6%) | 0 (0.0%) |
| 4.0x or more | 27 (19.9%) | 23 (45.1%) |
| Total | 136 (100.0%) | 51 (100.0%) |
Real Estate Taxes by Mortgage Status in Mill Creek
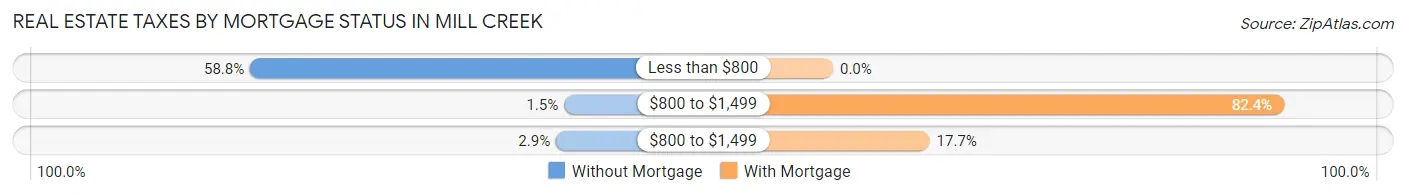
| Property Taxes | Without Mortgage | With Mortgage |
| Less than $800 | 80 (58.8%) | 0 (0.0%) |
| $800 to $1,499 | 2 (1.5%) | 42 (82.4%) |
| $800 to $1,499 | 4 (2.9%) | 9 (17.6%) |
| Total | 136 (100.0%) | 51 (100.0%) |
Health & Disability in Mill Creek
Health Insurance Coverage by Age in Mill Creek
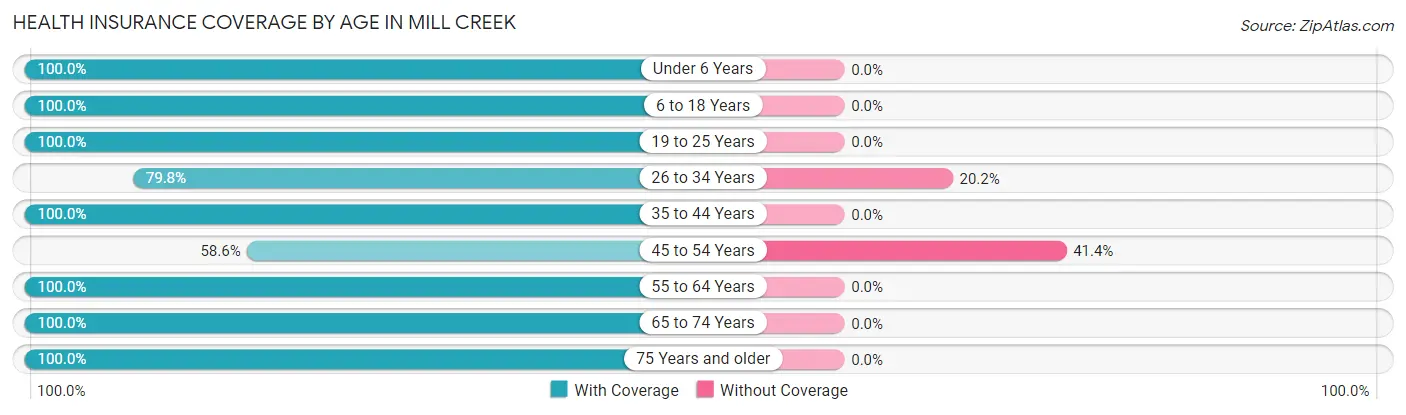
| Age Bracket | With Coverage | Without Coverage |
| Under 6 Years | 99 (100.0%) | 0 (0.0%) |
| 6 to 18 Years | 80 (100.0%) | 0 (0.0%) |
| 19 to 25 Years | 134 (100.0%) | 0 (0.0%) |
| 26 to 34 Years | 83 (79.8%) | 21 (20.2%) |
| 35 to 44 Years | 10 (100.0%) | 0 (0.0%) |
| 45 to 54 Years | 51 (58.6%) | 36 (41.4%) |
| 55 to 64 Years | 75 (100.0%) | 0 (0.0%) |
| 65 to 74 Years | 55 (100.0%) | 0 (0.0%) |
| 75 Years and older | 96 (100.0%) | 0 (0.0%) |
| Total | 683 (92.3%) | 57 (7.7%) |
Health Insurance Coverage by Citizenship Status in Mill Creek
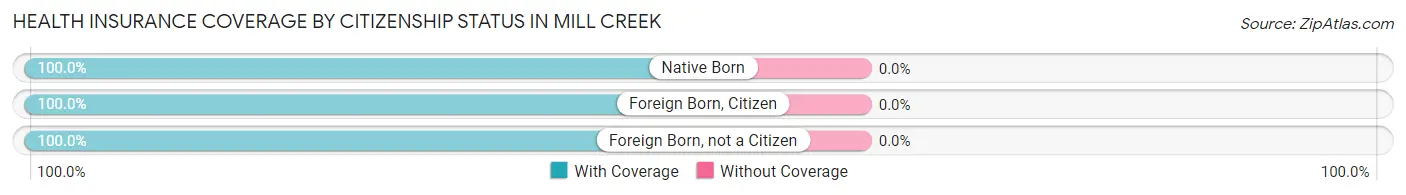
| Citizenship Status | With Coverage | Without Coverage |
| Native Born | 99 (100.0%) | 0 (0.0%) |
| Foreign Born, Citizen | 80 (100.0%) | 0 (0.0%) |
| Foreign Born, not a Citizen | 134 (100.0%) | 0 (0.0%) |
Health Insurance Coverage by Household Income in Mill Creek
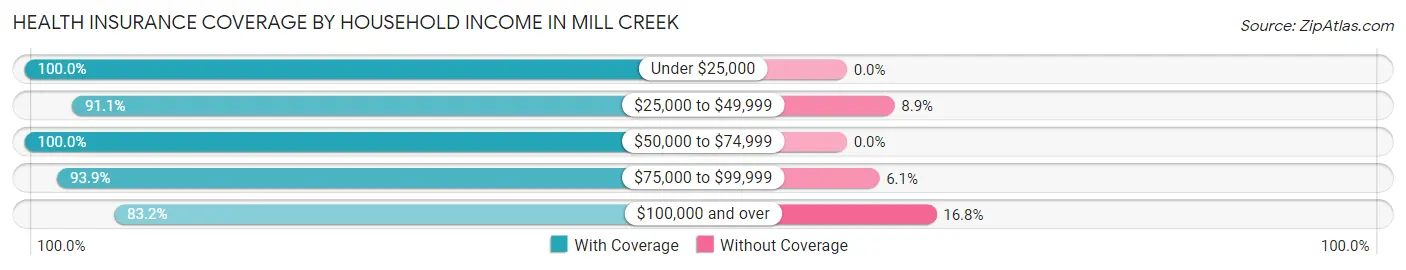
| Household Income | With Coverage | Without Coverage |
| Under $25,000 | 83 (100.0%) | 0 (0.0%) |
| $25,000 to $49,999 | 184 (91.1%) | 18 (8.9%) |
| $50,000 to $74,999 | 107 (100.0%) | 0 (0.0%) |
| $75,000 to $99,999 | 170 (93.9%) | 11 (6.1%) |
| $100,000 and over | 139 (83.2%) | 28 (16.8%) |
Public vs Private Health Insurance Coverage by Age in Mill Creek
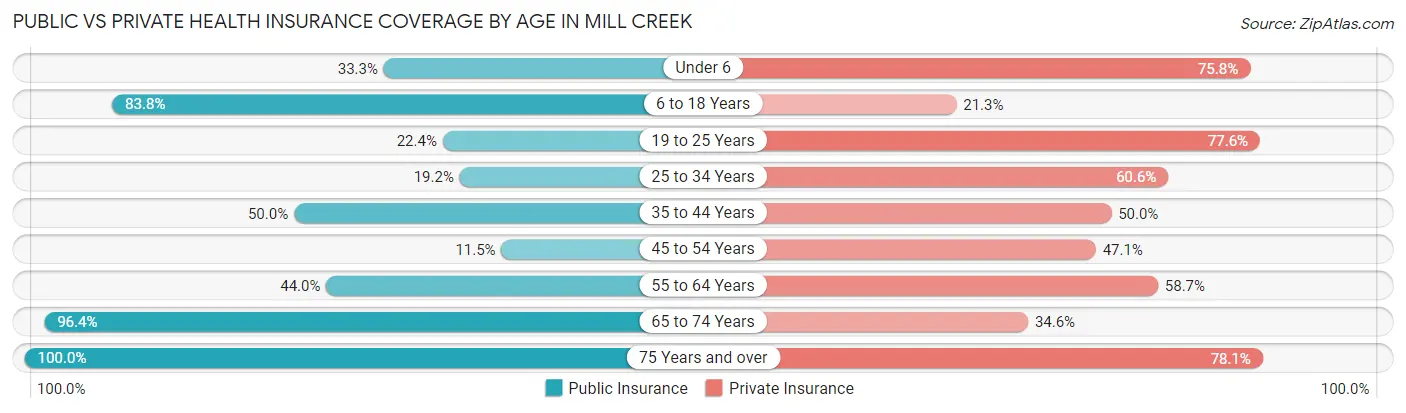
| Age Bracket | Public Insurance | Private Insurance |
| Under 6 | 33 (33.3%) | 75 (75.8%) |
| 6 to 18 Years | 67 (83.8%) | 17 (21.2%) |
| 19 to 25 Years | 30 (22.4%) | 104 (77.6%) |
| 25 to 34 Years | 20 (19.2%) | 63 (60.6%) |
| 35 to 44 Years | 5 (50.0%) | 5 (50.0%) |
| 45 to 54 Years | 10 (11.5%) | 41 (47.1%) |
| 55 to 64 Years | 33 (44.0%) | 44 (58.7%) |
| 65 to 74 Years | 53 (96.4%) | 19 (34.5%) |
| 75 Years and over | 96 (100.0%) | 75 (78.1%) |
| Total | 347 (46.9%) | 443 (59.9%) |
Disability Status by Sex by Age in Mill Creek
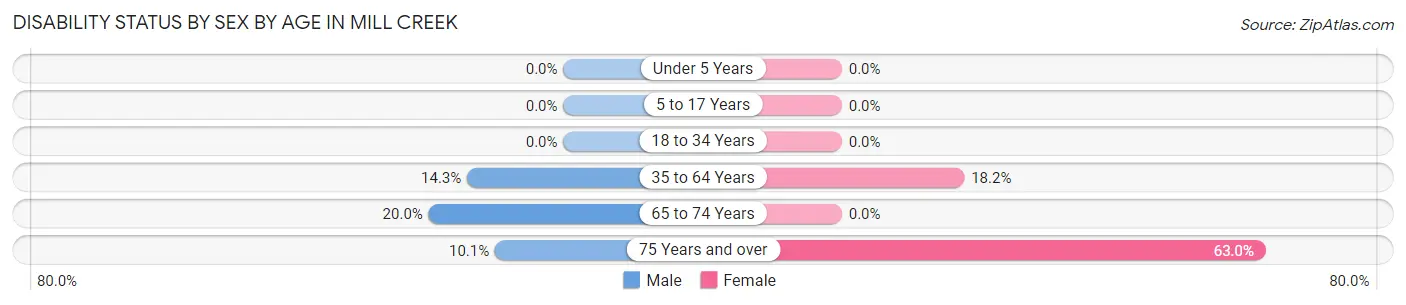
| Age Bracket | Male | Female |
| Under 5 Years | 0 (0.0%) | 0 (0.0%) |
| 5 to 17 Years | 0 (0.0%) | 0 (0.0%) |
| 18 to 34 Years | 0 (0.0%) | 0 (0.0%) |
| 35 to 64 Years | 12 (14.3%) | 16 (18.2%) |
| 65 to 74 Years | 1 (20.0%) | 0 (0.0%) |
| 75 Years and over | 7 (10.1%) | 17 (63.0%) |
Disability Class by Sex by Age in Mill Creek
Disability Class: Hearing Difficulty
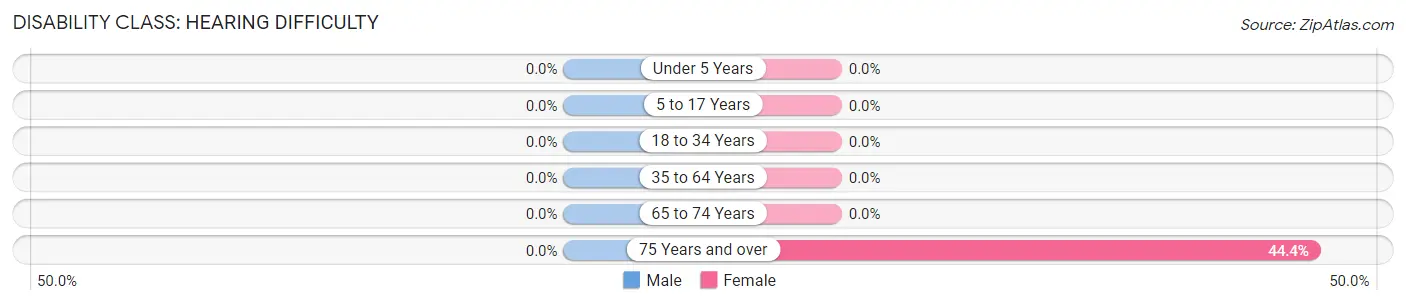
| Age Bracket | Male | Female |
| Under 5 Years | 0 (0.0%) | 0 (0.0%) |
| 5 to 17 Years | 0 (0.0%) | 0 (0.0%) |
| 18 to 34 Years | 0 (0.0%) | 0 (0.0%) |
| 35 to 64 Years | 0 (0.0%) | 0 (0.0%) |
| 65 to 74 Years | 0 (0.0%) | 0 (0.0%) |
| 75 Years and over | 0 (0.0%) | 12 (44.4%) |
Disability Class: Vision Difficulty
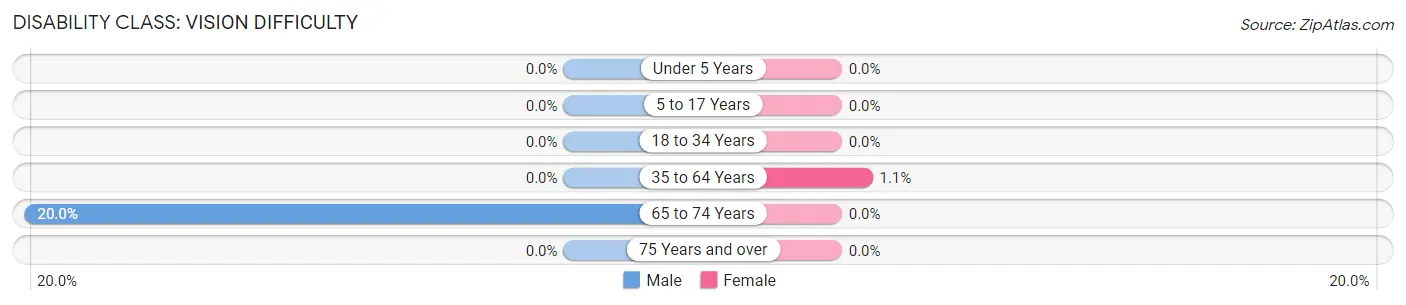
| Age Bracket | Male | Female |
| Under 5 Years | 0 (0.0%) | 0 (0.0%) |
| 5 to 17 Years | 0 (0.0%) | 0 (0.0%) |
| 18 to 34 Years | 0 (0.0%) | 0 (0.0%) |
| 35 to 64 Years | 0 (0.0%) | 1 (1.1%) |
| 65 to 74 Years | 1 (20.0%) | 0 (0.0%) |
| 75 Years and over | 0 (0.0%) | 0 (0.0%) |
Disability Class: Cognitive Difficulty
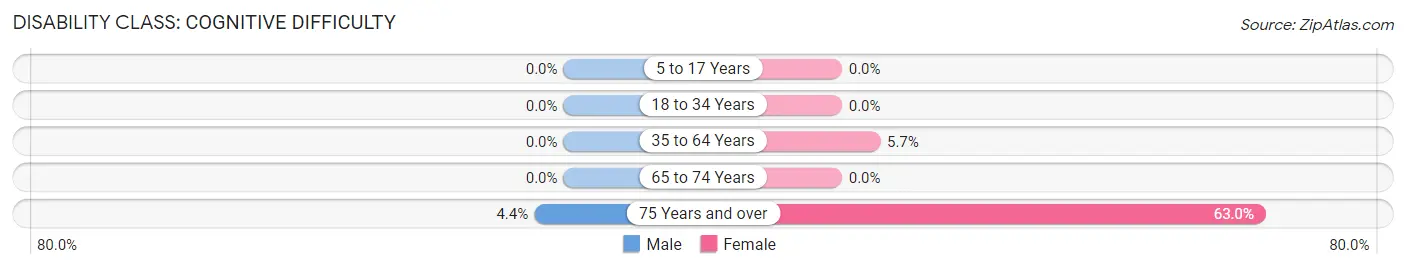
| Age Bracket | Male | Female |
| 5 to 17 Years | 0 (0.0%) | 0 (0.0%) |
| 18 to 34 Years | 0 (0.0%) | 0 (0.0%) |
| 35 to 64 Years | 0 (0.0%) | 5 (5.7%) |
| 65 to 74 Years | 0 (0.0%) | 0 (0.0%) |
| 75 Years and over | 3 (4.3%) | 17 (63.0%) |
Disability Class: Ambulatory Difficulty
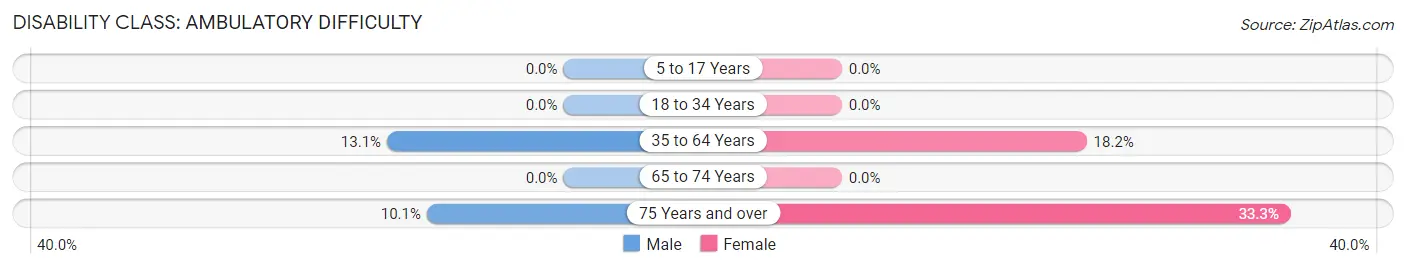
| Age Bracket | Male | Female |
| 5 to 17 Years | 0 (0.0%) | 0 (0.0%) |
| 18 to 34 Years | 0 (0.0%) | 0 (0.0%) |
| 35 to 64 Years | 11 (13.1%) | 16 (18.2%) |
| 65 to 74 Years | 0 (0.0%) | 0 (0.0%) |
| 75 Years and over | 7 (10.1%) | 9 (33.3%) |
Disability Class: Self-Care Difficulty
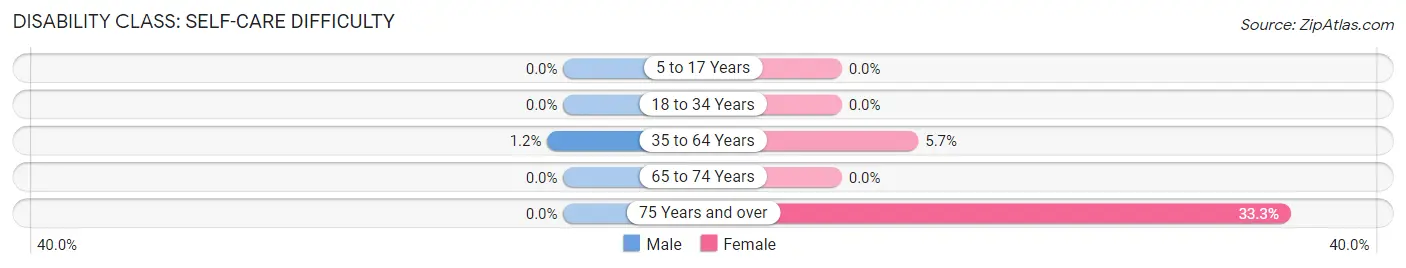
| Age Bracket | Male | Female |
| 5 to 17 Years | 0 (0.0%) | 0 (0.0%) |
| 18 to 34 Years | 0 (0.0%) | 0 (0.0%) |
| 35 to 64 Years | 1 (1.2%) | 5 (5.7%) |
| 65 to 74 Years | 0 (0.0%) | 0 (0.0%) |
| 75 Years and over | 0 (0.0%) | 9 (33.3%) |
Technology Access in Mill Creek
Computing Device Access in Mill Creek
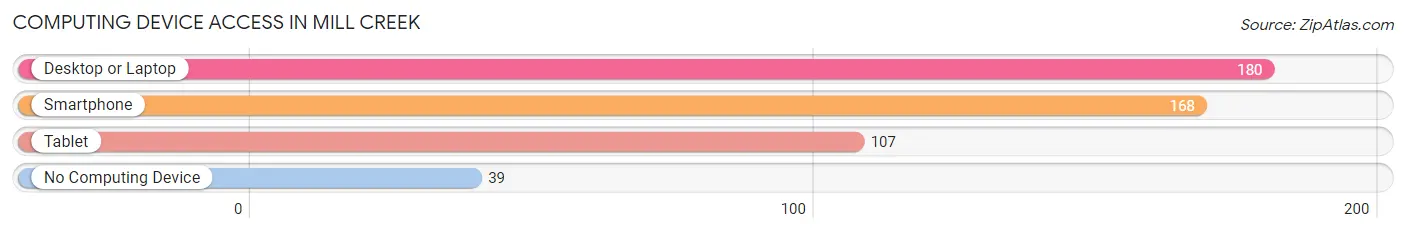
| Device Type | # Households | % Households |
| Desktop or Laptop | 180 | 69.2% |
| Smartphone | 168 | 64.6% |
| Tablet | 107 | 41.1% |
| No Computing Device | 39 | 15.0% |
| Total | 260 | 100.0% |
Internet Access in Mill Creek
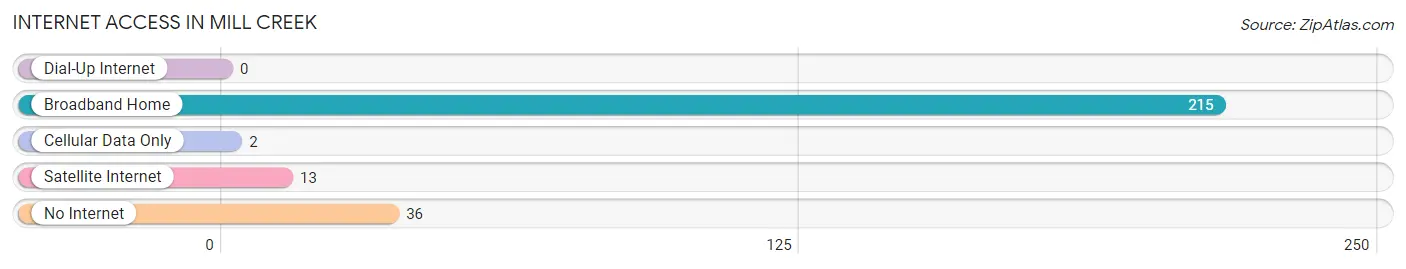
| Internet Type | # Households | % Households |
| Dial-Up Internet | 0 | 0.0% |
| Broadband Home | 215 | 82.7% |
| Cellular Data Only | 2 | 0.8% |
| Satellite Internet | 13 | 5.0% |
| No Internet | 36 | 13.9% |
| Total | 260 | 100.0% |
Mill Creek Summary
Mill Creek is a small unincorporated community located in the eastern panhandle of West Virginia, in Berkeley County. It is situated along the Potomac River, approximately five miles south of Martinsburg. The community is part of the Hagerstown-Martinsburg Metropolitan Statistical Area.
History
Mill Creek was first settled in the late 1700s by German immigrants. The community was originally known as “Mueller’s Mill” after the first settler, John Mueller. The name was later changed to Mill Creek. The community was a popular stop for travelers on the National Road, which ran through the area.
In the early 1800s, the community was home to a number of mills, including a grist mill, a saw mill, and a paper mill. The paper mill was owned by the Miller family, who also owned a large tract of land in the area. The Millers were prominent in the community and were instrumental in the development of the area.
In the late 1800s, the community was home to a number of businesses, including a general store, a blacksmith shop, and a post office. The post office was established in 1891 and is still in operation today.
Geography
Mill Creek is located in the eastern panhandle of West Virginia, in Berkeley County. It is situated along the Potomac River, approximately five miles south of Martinsburg. The community is part of the Hagerstown-Martinsburg Metropolitan Statistical Area.
The climate in Mill Creek is characterized by hot, humid summers and cold, wet winters. The average annual temperature is around 54°F, with an average high of around 75°F in the summer and an average low of around 34°F in the winter.
Economy
Mill Creek is a small, rural community with a limited economy. The primary industries in the area are agriculture and tourism. The community is home to a number of farms, which produce a variety of crops, including corn, soybeans, and hay.
The community is also home to a number of tourist attractions, including the historic Miller House, the Mill Creek Country Club, and the Mill Creek Wildlife Management Area. The area is also popular for outdoor activities such as fishing, hunting, and camping.
Demographics
As of the 2010 census, the population of Mill Creek was 1,845. The racial makeup of the community was 94.3% White, 2.7% African American, 0.3% Native American, 0.7% Asian, 0.1% Pacific Islander, and 1.9% from other races. The median household income was $45,938, and the median family income was $51,938.
The population of Mill Creek is largely rural and is composed of a mix of families and individuals. The community is home to a number of churches, including the Mill Creek United Methodist Church, the Mill Creek Baptist Church, and the Mill Creek Presbyterian Church. The community is also home to a number of schools, including Mill Creek Elementary School and Mill Creek Middle School.
Common Questions
What is the Total Population of Mill Creek?
Total Population of Mill Creek is 740.
What is the Total Male Population of Mill Creek?
Total Male Population of Mill Creek is 403.
What is the Total Female Population of Mill Creek?
Total Female Population of Mill Creek is 337.
What is the Ratio of Males per 100 Females in Mill Creek?
There are 119.58 Males per 100 Females in Mill Creek.
What is the Ratio of Females per 100 Males in Mill Creek?
There are 83.62 Females per 100 Males in Mill Creek.
What is the Median Population Age in Mill Creek?
Median Population Age in Mill Creek is 32.1 Years.
What is the Average Family Size in Mill Creek
Average Family Size in Mill Creek is 3.9 People.
What is the Average Household Size in Mill Creek
Average Household Size in Mill Creek is 2.9 People.
What is Per Capita Income in Mill Creek?
Per Capita income in Mill Creek is $24,140.
What is the Median Family Income in Mill Creek?
Median Family Income in Mill Creek is $66,875.
What is the Median Household income in Mill Creek?
Median Household Income in Mill Creek is $45,417.
What is Income or Wage Gap in Mill Creek?
Income or Wage Gap in Mill Creek is 3.6%.
Women in Mill Creek earn 96.4 cents for every dollar earned by a man.
What is Family Income Deficit in Mill Creek?
Family Income Deficit in Mill Creek is $11,436.
Families that are below poverty line in Mill Creek earn $11,436 less on average than the poverty threshold level.
What is Inequality or Gini Index in Mill Creek?
Inequality or Gini Index in Mill Creek is 0.38.
How Large is the Labor Force in Mill Creek?
There are 313 People in the Labor Forcein in Mill Creek.
What is the Percentage of People in the Labor Force in Mill Creek?
53.4% of People are in the Labor Force in Mill Creek.
What is the Unemployment Rate in Mill Creek?
Unemployment Rate in Mill Creek is 11.2%.