McConnell, WV
McConnell Map
McConnell Overview
899
TOTAL POPULATION
453
MALE POPULATION
446
FEMALE POPULATION
101.57
MALES / 100 FEMALES
98.45
FEMALES / 100 MALES
43.7
MEDIAN AGE
4.1
AVG FAMILY SIZE
3.1
AVG HOUSEHOLD SIZE
$25,495
PER CAPITA INCOME
$26,620
AVG FAMILY INCOME
$26,991
AVG HOUSEHOLD INCOME
0.61
INEQUALITY / GINI INDEX
173
LABOR FORCE [ PEOPLE ]
26.0%
PERCENT IN LABOR FORCE
58.4%
UNEMPLOYMENT RATE
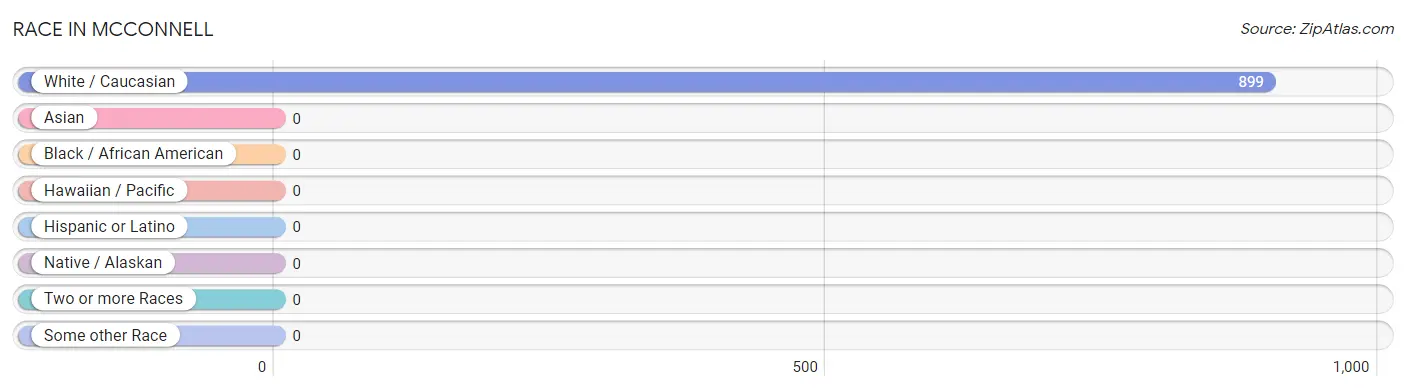
Race in McConnell
The most populous races in McConnell are , and White / Caucasian (899 | 100.0%).
| Race | # Population | % Population |
| Asian | 0 | 0.0% |
| Black / African American | 0 | 0.0% |
| Hawaiian / Pacific | 0 | 0.0% |
| Hispanic or Latino | 0 | 0.0% |
| Native / Alaskan | 0 | 0.0% |
| White / Caucasian | 899 | 100.0% |
| Two or more Races | 0 | 0.0% |
| Some other Race | 0 | 0.0% |
| Total | 899 | 100.0% |
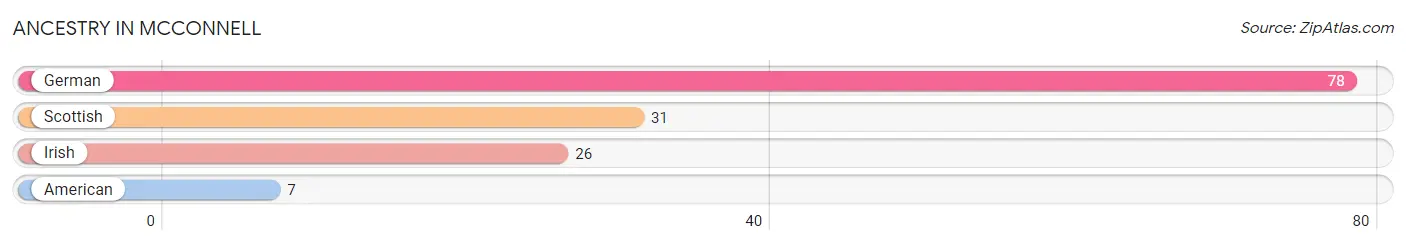
Ancestry in McConnell
The most populous ancestries reported in McConnell are German (78 | 8.7%), Scottish (31 | 3.5%), Irish (26 | 2.9%), and American (7 | 0.8%), together accounting for 15.8% of all McConnell residents.
| Ancestry | # Population | % Population |
| American | 7 | 0.8% |
| German | 78 | 8.7% |
| Irish | 26 | 2.9% |
| Scottish | 31 | 3.5% | View All 4 Rows |
Immigrants in McConnell

| Immigration Origin | # Population | % Population | View All 0 Rows |
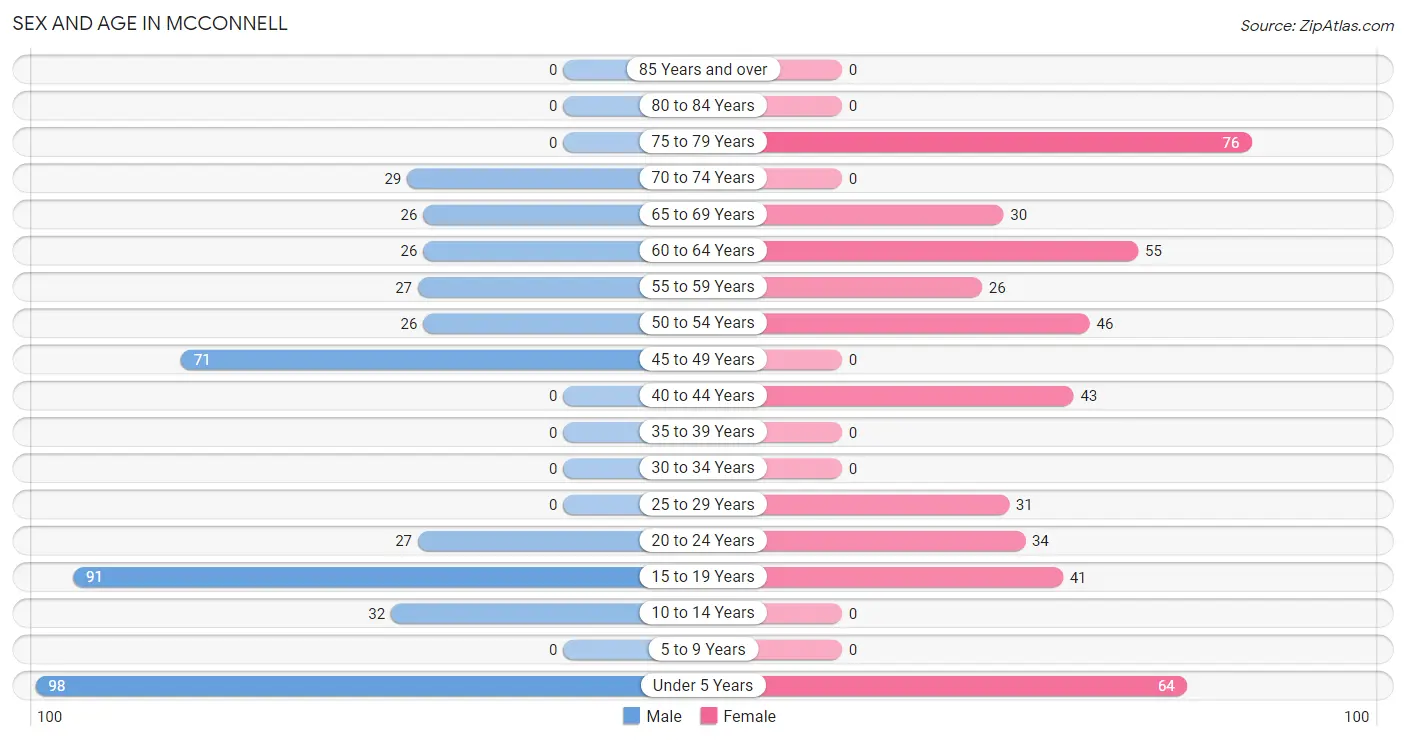
Sex and Age in McConnell
Sex and Age in McConnell
The most populous age groups in McConnell are Under 5 Years (98 | 21.6%) for men and 75 to 79 Years (76 | 17.0%) for women.
| Age Bracket | Male | Female |
| Under 5 Years | 98 (21.6%) | 64 (14.3%) |
| 5 to 9 Years | 0 (0.0%) | 0 (0.0%) |
| 10 to 14 Years | 32 (7.1%) | 0 (0.0%) |
| 15 to 19 Years | 91 (20.1%) | 41 (9.2%) |
| 20 to 24 Years | 27 (6.0%) | 34 (7.6%) |
| 25 to 29 Years | 0 (0.0%) | 31 (7.0%) |
| 30 to 34 Years | 0 (0.0%) | 0 (0.0%) |
| 35 to 39 Years | 0 (0.0%) | 0 (0.0%) |
| 40 to 44 Years | 0 (0.0%) | 43 (9.6%) |
| 45 to 49 Years | 71 (15.7%) | 0 (0.0%) |
| 50 to 54 Years | 26 (5.7%) | 46 (10.3%) |
| 55 to 59 Years | 27 (6.0%) | 26 (5.8%) |
| 60 to 64 Years | 26 (5.7%) | 55 (12.3%) |
| 65 to 69 Years | 26 (5.7%) | 30 (6.7%) |
| 70 to 74 Years | 29 (6.4%) | 0 (0.0%) |
| 75 to 79 Years | 0 (0.0%) | 76 (17.0%) |
| 80 to 84 Years | 0 (0.0%) | 0 (0.0%) |
| 85 Years and over | 0 (0.0%) | 0 (0.0%) |
| Total | 453 (100.0%) | 446 (100.0%) |
Families and Households in McConnell
Median Family Size in McConnell
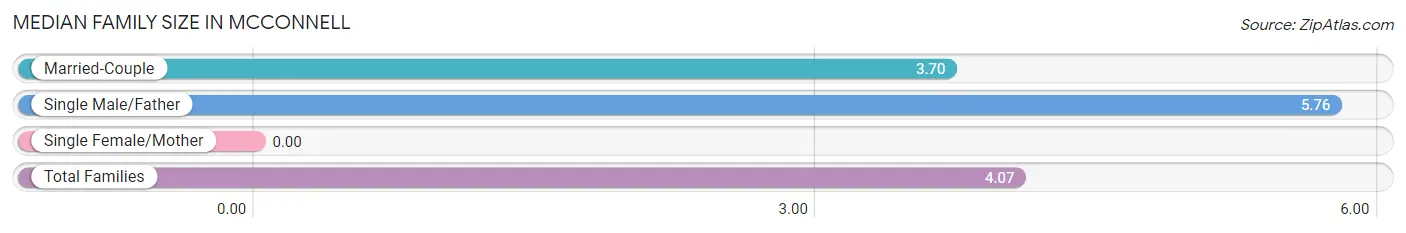
| Family Type | # Families | Family Size |
| Married-Couple | 155 (82.0%) | 3.70 |
| Single Male/Father | 34 (18.0%) | 5.76 |
| Single Female/Mother | 0 (0.0%) | - |
| Total Families | 189 (100.0%) | 4.07 |
Median Household Size in McConnell
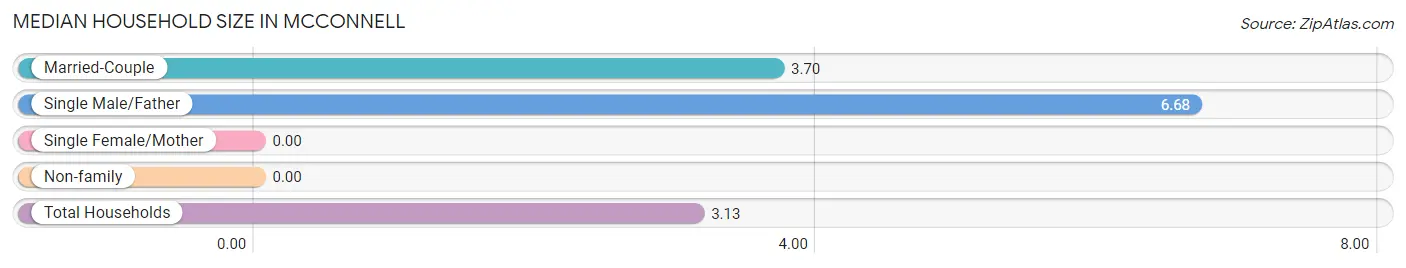
| Household Type | # Households | Household Size |
| Married-Couple | 155 (54.0%) | 3.70 |
| Single Male/Father | 34 (11.8%) | 6.68 |
| Single Female/Mother | 0 (0.0%) | - |
| Non-family | 98 (34.2%) | - |
| Total Households | 287 (100.0%) | 3.13 |
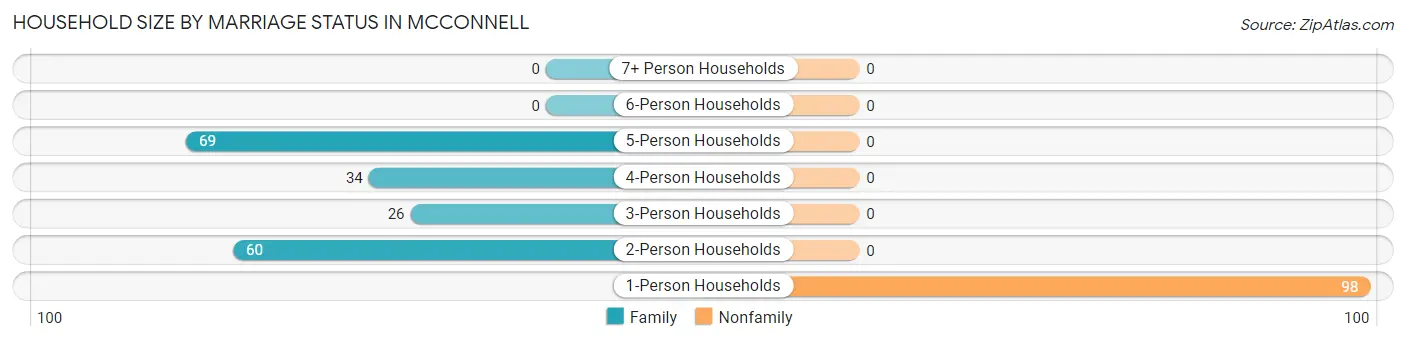
Household Size by Marriage Status in McConnell
Out of a total of 287 households in McConnell, 189 (65.8%) are family households, while 98 (34.2%) are nonfamily households. The most numerous type of family households are 5-person households, comprising 69, and the most common type of nonfamily households are 1-person households, comprising 98.
| Household Size | Family Households | Nonfamily Households |
| 1-Person Households | - | 98 (34.2%) |
| 2-Person Households | 60 (20.9%) | 0 (0.0%) |
| 3-Person Households | 26 (9.1%) | 0 (0.0%) |
| 4-Person Households | 34 (11.8%) | 0 (0.0%) |
| 5-Person Households | 69 (24.0%) | 0 (0.0%) |
| 6-Person Households | 0 (0.0%) | 0 (0.0%) |
| 7+ Person Households | 0 (0.0%) | 0 (0.0%) |
| Total | 189 (65.8%) | 98 (34.2%) |
Female Fertility in McConnell
Fertility by Age in McConnell
Average fertility rate in McConnell is 208.0 births per 1,000 women. Women in the age bracket of 20 to 34 years have the highest fertility rate with 477.0 births per 1,000 women. Women in the age bracket of 20 to 34 years acount for 100.0% of all women with births.
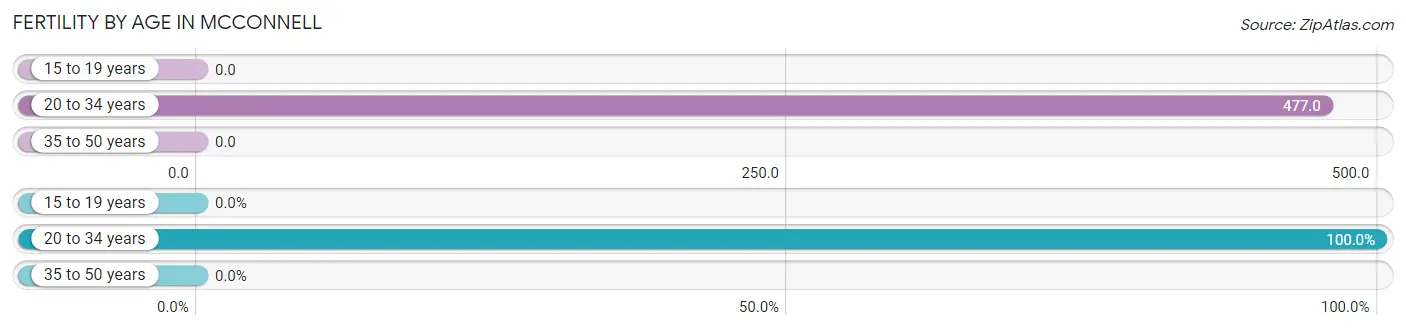
| Age Bracket | Women with Births | Births / 1,000 Women |
| 15 to 19 years | 0 (0.0%) | 0.0 |
| 20 to 34 years | 31 (100.0%) | 477.0 |
| 35 to 50 years | 0 (0.0%) | 0.0 |
| Total | 31 (100.0%) | 208.0 |
Fertility by Age by Marriage Status in McConnell
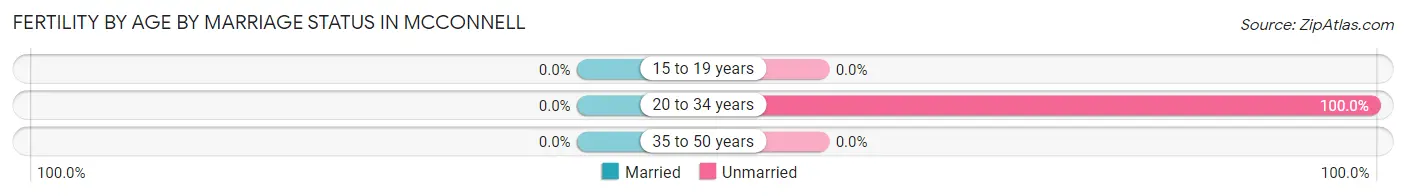
| Age Bracket | Married | Unmarried |
| 15 to 19 years | 0 (0.0%) | 0 (0.0%) |
| 20 to 34 years | 0 (0.0%) | 31 (100.0%) |
| 35 to 50 years | 0 (0.0%) | 0 (0.0%) |
| Total | 0 (0.0%) | 31 (100.0%) |
Fertility by Education in McConnell
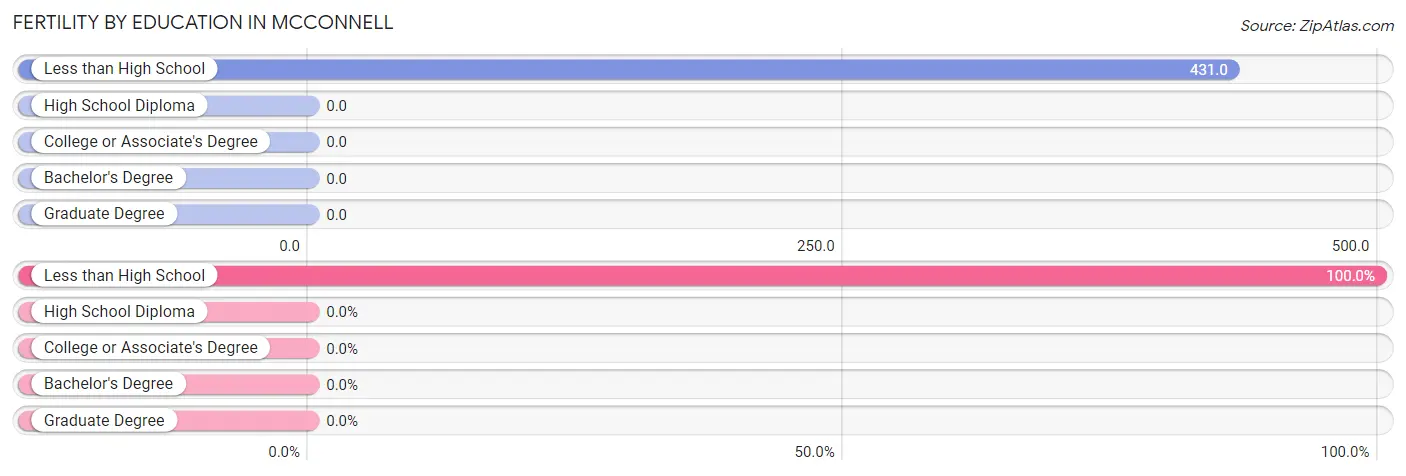
| Educational Attainment | Women with Births | Births / 1,000 Women |
| Less than High School | 31 (100.0%) | 431.0 |
| High School Diploma | 0 (0.0%) | 0.0 |
| College or Associate's Degree | 0 (0.0%) | 0.0 |
| Bachelor's Degree | 0 (0.0%) | 0.0 |
| Graduate Degree | 0 (0.0%) | 0.0 |
| Total | 31 (100.0%) | 208.0 |
Fertility by Education by Marriage Status in McConnell
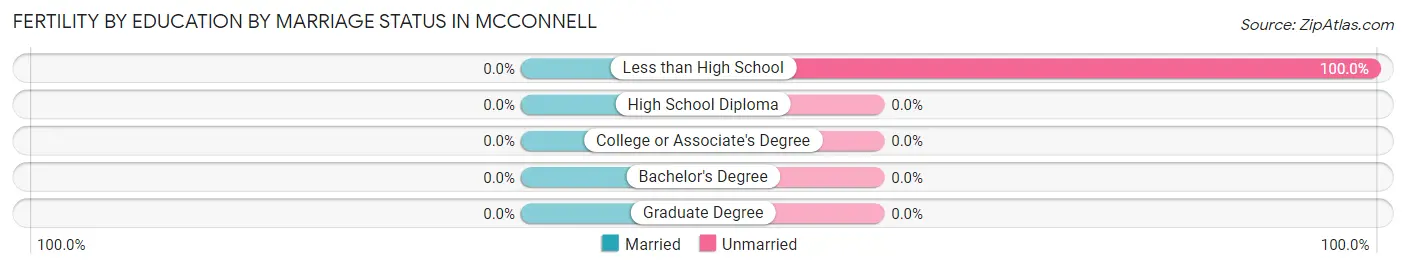
| Educational Attainment | Married | Unmarried |
| Less than High School | 0 (0.0%) | 31 (100.0%) |
| High School Diploma | 0 (0.0%) | 0 (0.0%) |
| College or Associate's Degree | 0 (0.0%) | 0 (0.0%) |
| Bachelor's Degree | 0 (0.0%) | 0 (0.0%) |
| Graduate Degree | 0 (0.0%) | 0 (0.0%) |
| Total | 0 (0.0%) | 31 (100.0%) |
Income in McConnell
Income Overview in McConnell
Per Capita Income in McConnell is $25,495, while median incomes of families and households are $26,620 and $26,991 respectively.
| Characteristic | Number | Measure |
| Per Capita Income | 899 | $25,495 |
| Median Family Income | 189 | $26,620 |
| Mean Family Income | 189 | $84,343 |
| Median Household Income | 287 | $26,991 |
| Mean Household Income | 287 | $76,262 |
| Income Deficit | 189 | $0 |
| Wage / Income Gap (%) | 899 | 0.00% |
| Wage / Income Gap ($) | 899 | 100.00¢ per $1 |
| Gini / Inequality Index | 899 | 0.61 |
Earnings by Sex in McConnell
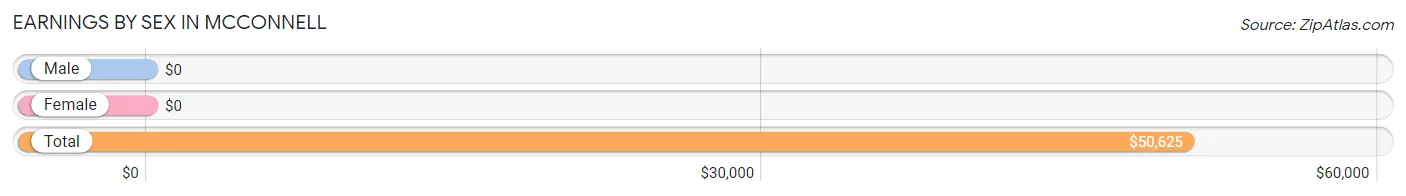
| Sex | Number | Average Earnings |
| Male | 75 (62.0%) | $0 |
| Female | 46 (38.0%) | $0 |
| Total | 121 (100.0%) | $50,625 |
Earnings by Sex by Income Bracket in McConnell
The most common earnings brackets in McConnell are $2,499 or less for men (27 | 36.0%) and $50,000 to $54,999 for women (46 | 100.0%).
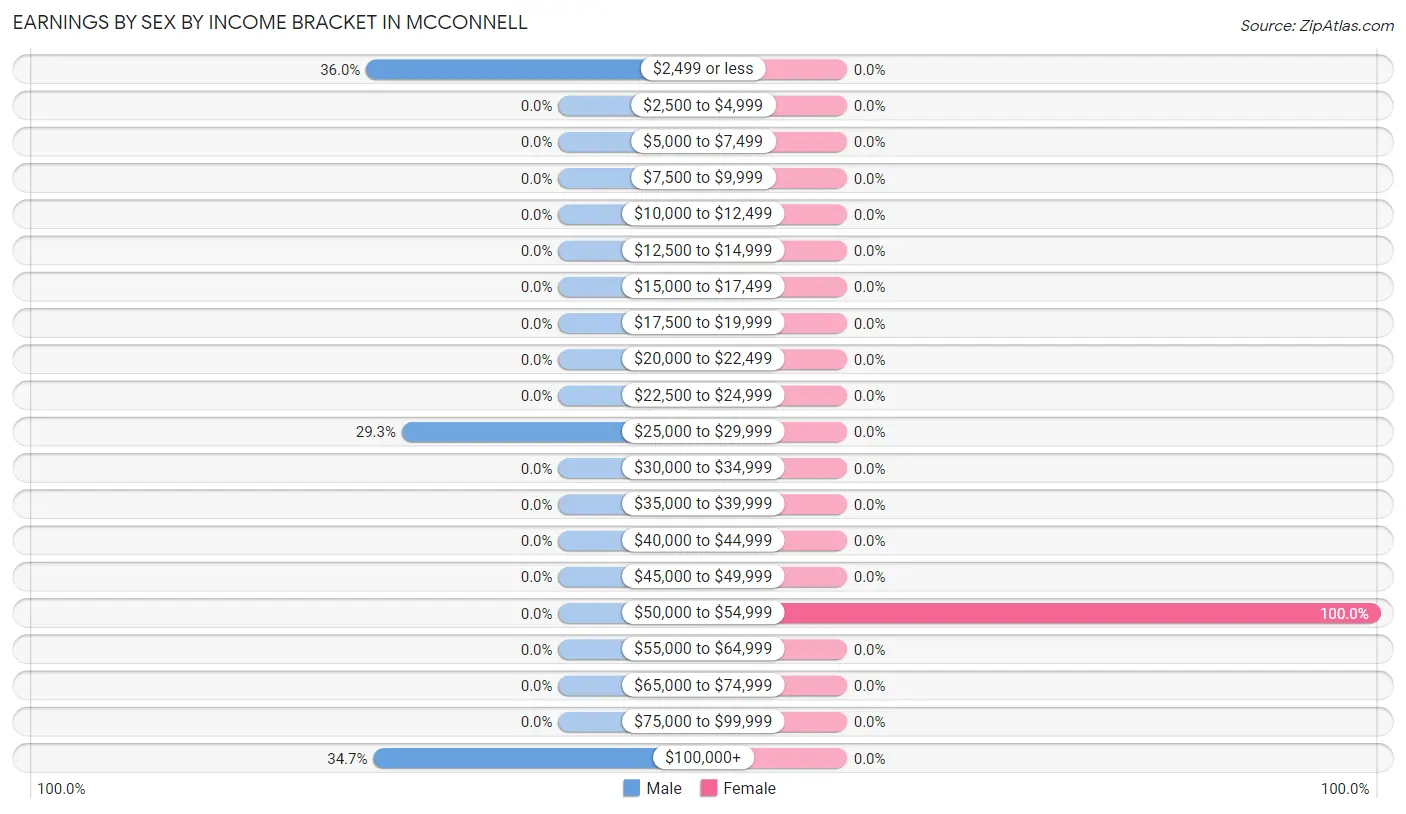
| Income | Male | Female |
| $2,499 or less | 27 (36.0%) | 0 (0.0%) |
| $2,500 to $4,999 | 0 (0.0%) | 0 (0.0%) |
| $5,000 to $7,499 | 0 (0.0%) | 0 (0.0%) |
| $7,500 to $9,999 | 0 (0.0%) | 0 (0.0%) |
| $10,000 to $12,499 | 0 (0.0%) | 0 (0.0%) |
| $12,500 to $14,999 | 0 (0.0%) | 0 (0.0%) |
| $15,000 to $17,499 | 0 (0.0%) | 0 (0.0%) |
| $17,500 to $19,999 | 0 (0.0%) | 0 (0.0%) |
| $20,000 to $22,499 | 0 (0.0%) | 0 (0.0%) |
| $22,500 to $24,999 | 0 (0.0%) | 0 (0.0%) |
| $25,000 to $29,999 | 22 (29.3%) | 0 (0.0%) |
| $30,000 to $34,999 | 0 (0.0%) | 0 (0.0%) |
| $35,000 to $39,999 | 0 (0.0%) | 0 (0.0%) |
| $40,000 to $44,999 | 0 (0.0%) | 0 (0.0%) |
| $45,000 to $49,999 | 0 (0.0%) | 0 (0.0%) |
| $50,000 to $54,999 | 0 (0.0%) | 46 (100.0%) |
| $55,000 to $64,999 | 0 (0.0%) | 0 (0.0%) |
| $65,000 to $74,999 | 0 (0.0%) | 0 (0.0%) |
| $75,000 to $99,999 | 0 (0.0%) | 0 (0.0%) |
| $100,000+ | 26 (34.7%) | 0 (0.0%) |
| Total | 75 (100.0%) | 46 (100.0%) |
Earnings by Sex by Educational Attainment in McConnell
| Educational Attainment | Male Income | Female Income |
| Less than High School | - | - |
| High School Diploma | - | - |
| College or Associate's Degree | - | - |
| Bachelor's Degree | - | - |
| Graduate Degree | - | - |
| Total | - | - |
Family Income in McConnell
Family Income Brackets in McConnell
According to the McConnell family income data, there are 43 families falling into the $15,000 to $24,999 income range, which is the most common income bracket and makes up 22.8% of all families.
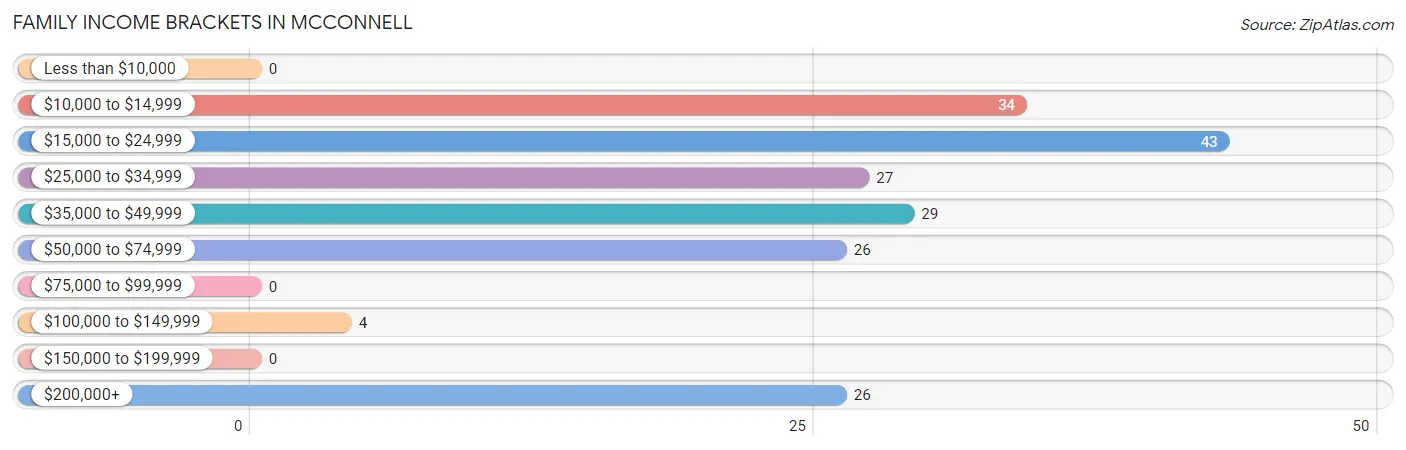
| Income Bracket | # Families | % Families |
| Less than $10,000 | 0 | 0.0% |
| $10,000 to $14,999 | 34 | 18.0% |
| $15,000 to $24,999 | 43 | 22.8% |
| $25,000 to $34,999 | 27 | 14.3% |
| $35,000 to $49,999 | 29 | 15.3% |
| $50,000 to $74,999 | 26 | 13.8% |
| $75,000 to $99,999 | 0 | 0.0% |
| $100,000 to $149,999 | 4 | 2.1% |
| $150,000 to $199,999 | 0 | 0.0% |
| $200,000+ | 26 | 13.8% |
Family Income by Famaliy Size in McConnell
2-person families (60 | 31.8%) account for the highest median family income in McConnell with $35,259 per family, while 2-person families (60 | 31.8%) have the highest median income of $17,630 per family member.
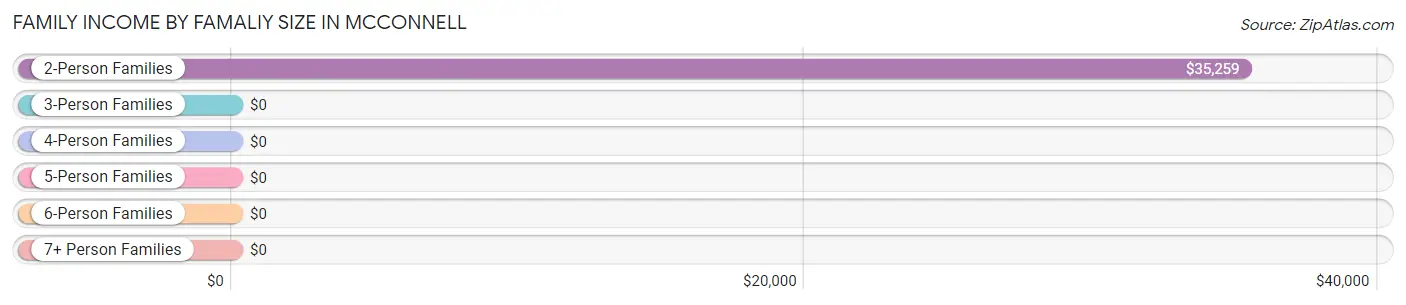
| Income Bracket | # Families | Median Income |
| 2-Person Families | 60 (31.8%) | $35,259 |
| 3-Person Families | 60 (31.8%) | $0 |
| 4-Person Families | 0 (0.0%) | $0 |
| 5-Person Families | 69 (36.5%) | $0 |
| 6-Person Families | 0 (0.0%) | $0 |
| 7+ Person Families | 0 (0.0%) | $0 |
| Total | 189 (100.0%) | $26,620 |
Family Income by Number of Earners in McConnell
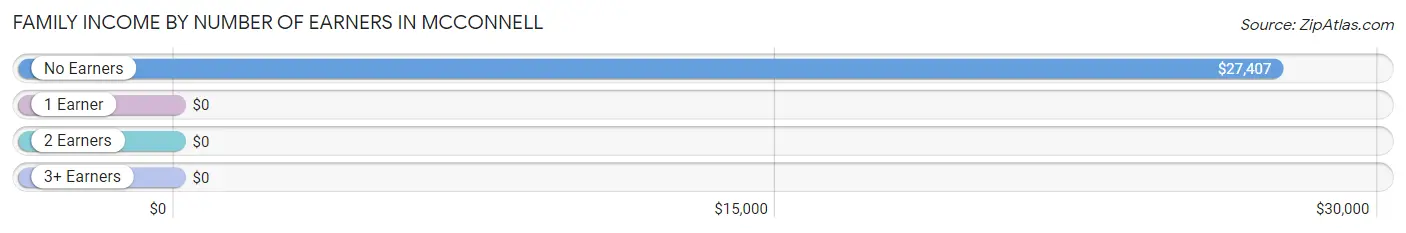
| Number of Earners | # Families | Median Income |
| No Earners | 120 (63.5%) | $27,407 |
| 1 Earner | 43 (22.8%) | $0 |
| 2 Earners | 26 (13.8%) | $0 |
| 3+ Earners | 0 (0.0%) | $0 |
| Total | 189 (100.0%) | $26,620 |
Household Income in McConnell
Household Income Brackets in McConnell
With 88 households falling in the category, the $15,000 to $24,999 income range is the most frequent in McConnell, accounting for 30.7% of all households.
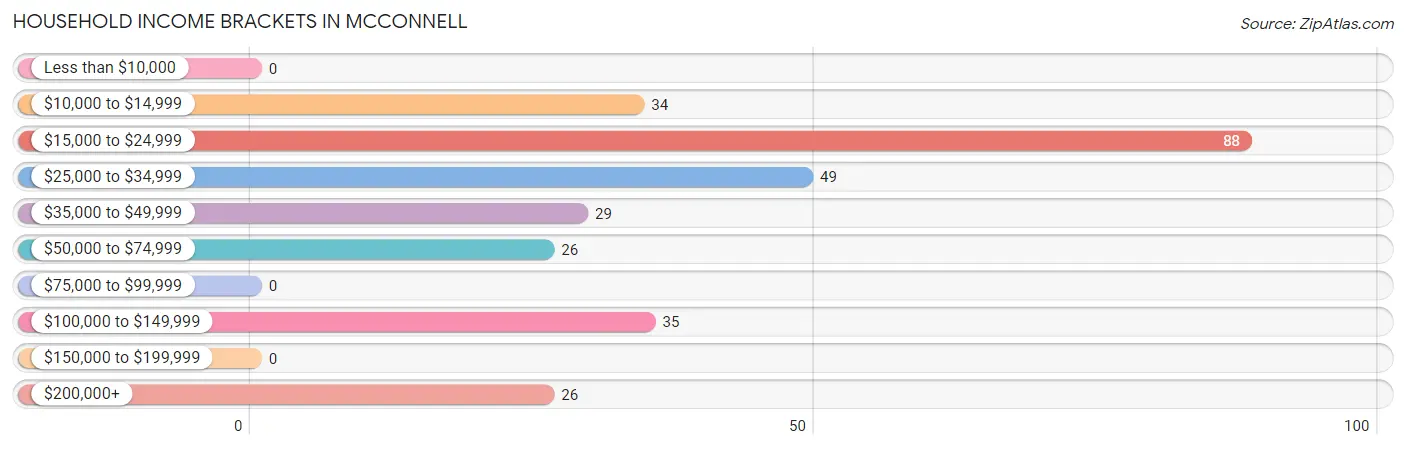
| Income Bracket | # Households | % Households |
| Less than $10,000 | 0 | 0.0% |
| $10,000 to $14,999 | 34 | 11.8% |
| $15,000 to $24,999 | 88 | 30.7% |
| $25,000 to $34,999 | 49 | 17.1% |
| $35,000 to $49,999 | 29 | 10.1% |
| $50,000 to $74,999 | 26 | 9.1% |
| $75,000 to $99,999 | 0 | 0.0% |
| $100,000 to $149,999 | 35 | 12.2% |
| $150,000 to $199,999 | 0 | 0.0% |
| $200,000+ | 26 | 9.1% |
Household Income by Householder Age in McConnell
The median household income in McConnell is $26,991, with the highest median household income of $27,083 found in the 45 to 64 years age bracket for the primary householder. A total of 113 households (39.4%) fall into this category.
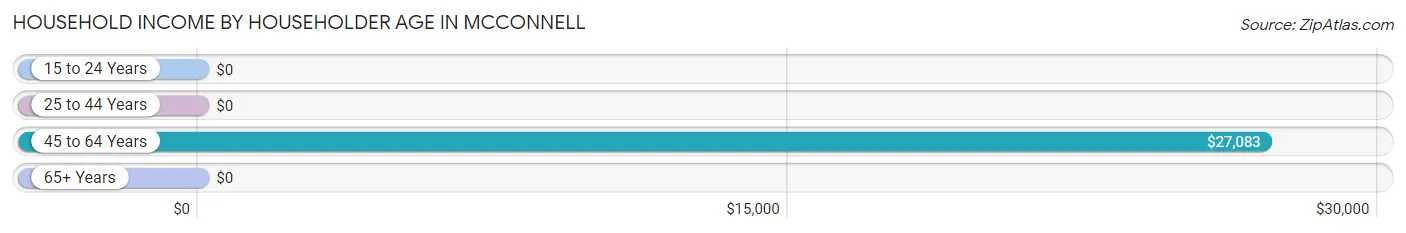
| Income Bracket | # Households | Median Income |
| 15 to 24 Years | 0 (0.0%) | $0 |
| 25 to 44 Years | 43 (15.0%) | $0 |
| 45 to 64 Years | 113 (39.4%) | $27,083 |
| 65+ Years | 131 (45.6%) | $0 |
| Total | 287 (100.0%) | $26,991 |
Poverty in McConnell
Income Below Poverty by Sex and Age in McConnell
With 43.3% poverty level for males and 44.8% for females among the residents of McConnell, under 5 year old males and under 5 year old females are the most vulnerable to poverty, with 98 males (100.0%) and 64 females (100.0%) in their respective age groups living below the poverty level.
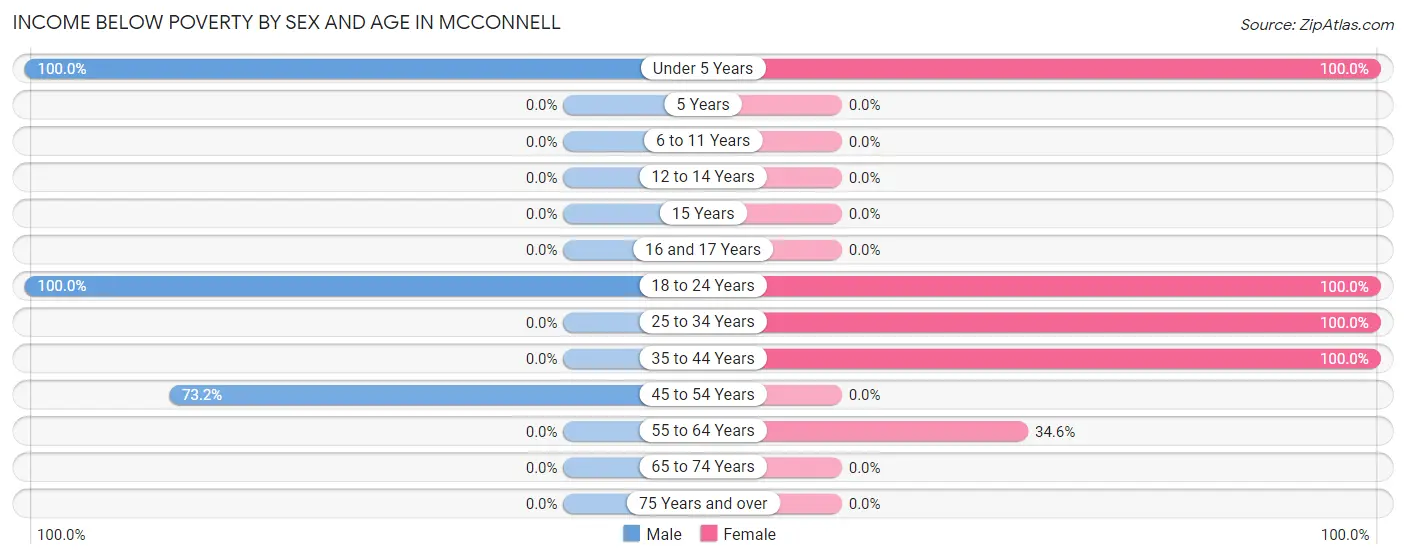
| Age Bracket | Male | Female |
| Under 5 Years | 98 (100.0%) | 64 (100.0%) |
| 5 Years | 0 (0.0%) | 0 (0.0%) |
| 6 to 11 Years | 0 (0.0%) | 0 (0.0%) |
| 12 to 14 Years | 0 (0.0%) | 0 (0.0%) |
| 15 Years | 0 (0.0%) | 0 (0.0%) |
| 16 and 17 Years | 0 (0.0%) | 0 (0.0%) |
| 18 to 24 Years | 27 (100.0%) | 34 (100.0%) |
| 25 to 34 Years | 0 (0.0%) | 31 (100.0%) |
| 35 to 44 Years | 0 (0.0%) | 43 (100.0%) |
| 45 to 54 Years | 71 (73.2%) | 0 (0.0%) |
| 55 to 64 Years | 0 (0.0%) | 28 (34.6%) |
| 65 to 74 Years | 0 (0.0%) | 0 (0.0%) |
| 75 Years and over | 0 (0.0%) | 0 (0.0%) |
| Total | 196 (43.3%) | 200 (44.8%) |
Income Above Poverty by Sex and Age in McConnell
According to the poverty statistics in McConnell, males aged 12 to 14 years and females aged 16 and 17 years are the age groups that are most secure financially, with 100.0% of males and 100.0% of females in these age groups living above the poverty line.
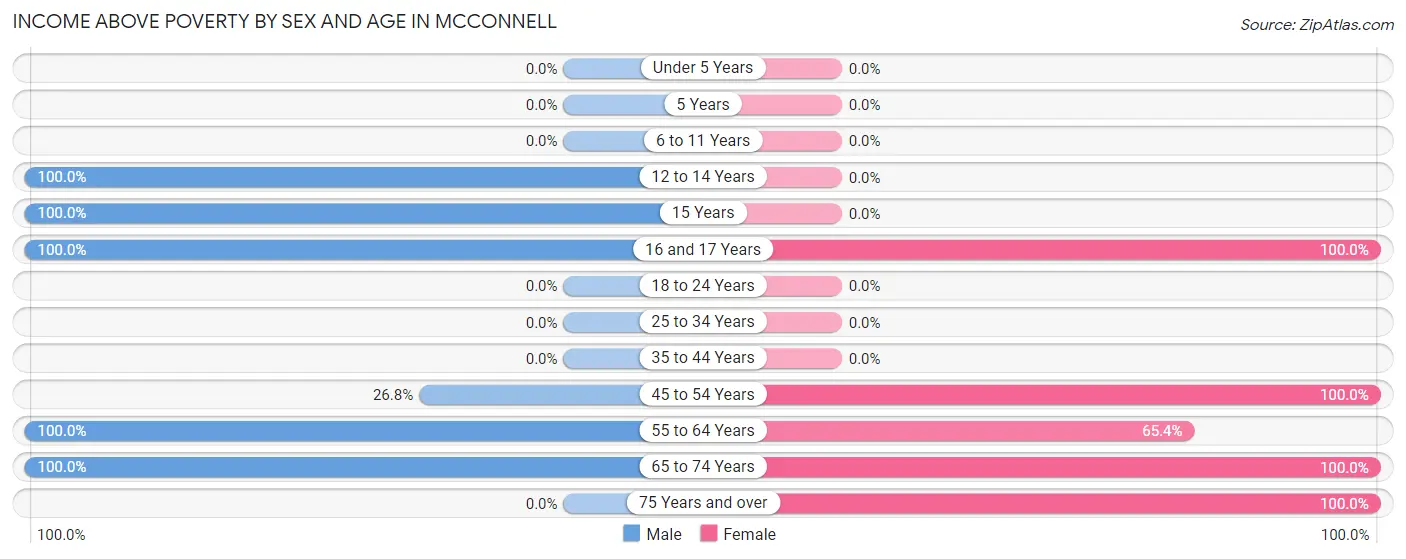
| Age Bracket | Male | Female |
| Under 5 Years | 0 (0.0%) | 0 (0.0%) |
| 5 Years | 0 (0.0%) | 0 (0.0%) |
| 6 to 11 Years | 0 (0.0%) | 0 (0.0%) |
| 12 to 14 Years | 32 (100.0%) | 0 (0.0%) |
| 15 Years | 39 (100.0%) | 0 (0.0%) |
| 16 and 17 Years | 52 (100.0%) | 41 (100.0%) |
| 18 to 24 Years | 0 (0.0%) | 0 (0.0%) |
| 25 to 34 Years | 0 (0.0%) | 0 (0.0%) |
| 35 to 44 Years | 0 (0.0%) | 0 (0.0%) |
| 45 to 54 Years | 26 (26.8%) | 46 (100.0%) |
| 55 to 64 Years | 53 (100.0%) | 53 (65.4%) |
| 65 to 74 Years | 55 (100.0%) | 30 (100.0%) |
| 75 Years and over | 0 (0.0%) | 76 (100.0%) |
| Total | 257 (56.7%) | 246 (55.2%) |
Income Below Poverty Among Married-Couple Families in McConnell
The poverty statistics for married-couple families in McConnell show that 27.7% or 43 of the total 155 families live below the poverty line. Families with no children have the highest poverty rate of 41.7%, comprising of 43 families. On the other hand, families with 1 or 2 children have the lowest poverty rate of 0.0%, which includes 0 families.
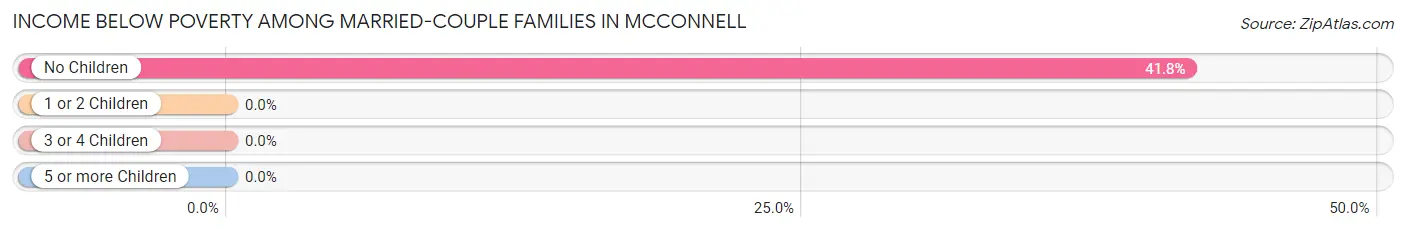
| Children | Above Poverty | Below Poverty |
| No Children | 60 (58.3%) | 43 (41.7%) |
| 1 or 2 Children | 26 (100.0%) | 0 (0.0%) |
| 3 or 4 Children | 26 (100.0%) | 0 (0.0%) |
| 5 or more Children | 0 (0.0%) | 0 (0.0%) |
| Total | 112 (72.3%) | 43 (27.7%) |
Income Below Poverty Among Single-Parent Households in McConnell
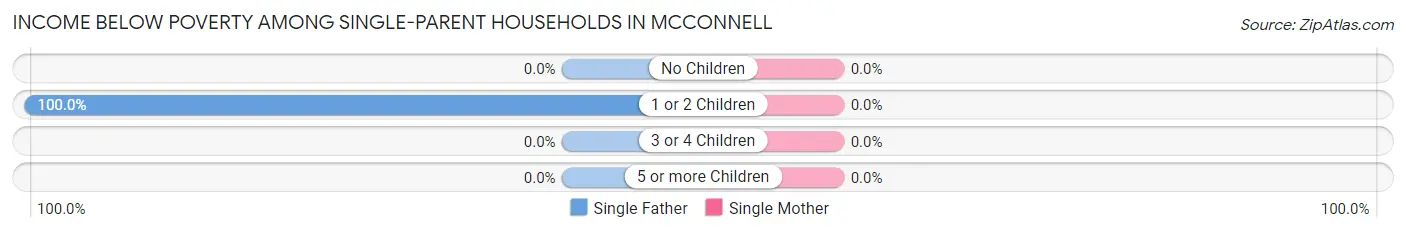
| Children | Single Father | Single Mother |
| No Children | 0 (0.0%) | 0 (0.0%) |
| 1 or 2 Children | 34 (100.0%) | 0 (0.0%) |
| 3 or 4 Children | 0 (0.0%) | 0 (0.0%) |
| 5 or more Children | 0 (0.0%) | 0 (0.0%) |
| Total | 34 (100.0%) | 0 (0.0%) |
Income Below Poverty Among Married-Couple vs Single-Parent Households in McConnell
The poverty data for McConnell shows that 43 of the married-couple family households (27.7%) and 34 of the single-parent households (100.0%) are living below the poverty level. Within the married-couple family households, those with no children have the highest poverty rate, with 43 households (41.7%) falling below the poverty line. Among the single-parent households, those with 1 or 2 children have the highest poverty rate, with 34 household (100.0%) living below poverty.
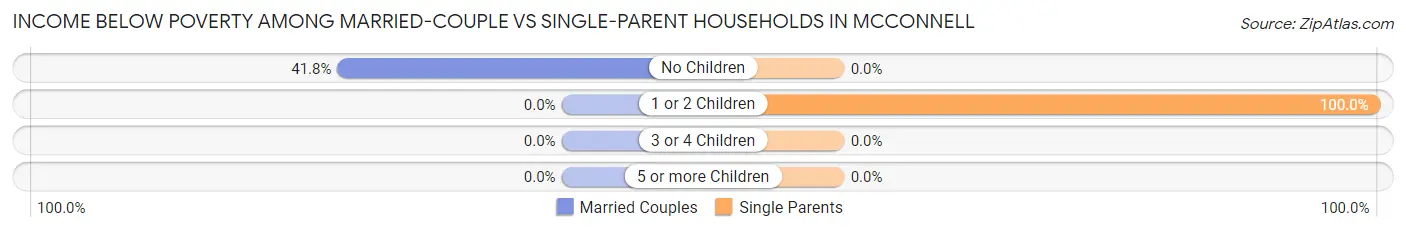
| Children | Married-Couple Families | Single-Parent Households |
| No Children | 43 (41.7%) | 0 (0.0%) |
| 1 or 2 Children | 0 (0.0%) | 34 (100.0%) |
| 3 or 4 Children | 0 (0.0%) | 0 (0.0%) |
| 5 or more Children | 0 (0.0%) | 0 (0.0%) |
| Total | 43 (27.7%) | 34 (100.0%) |
Employment Characteristics in McConnell
Employment by Class of Employer in McConnell
Among the 46 employed individuals in McConnell, , and private company employees (46 | 100.0%) make up the most common classes of employment.
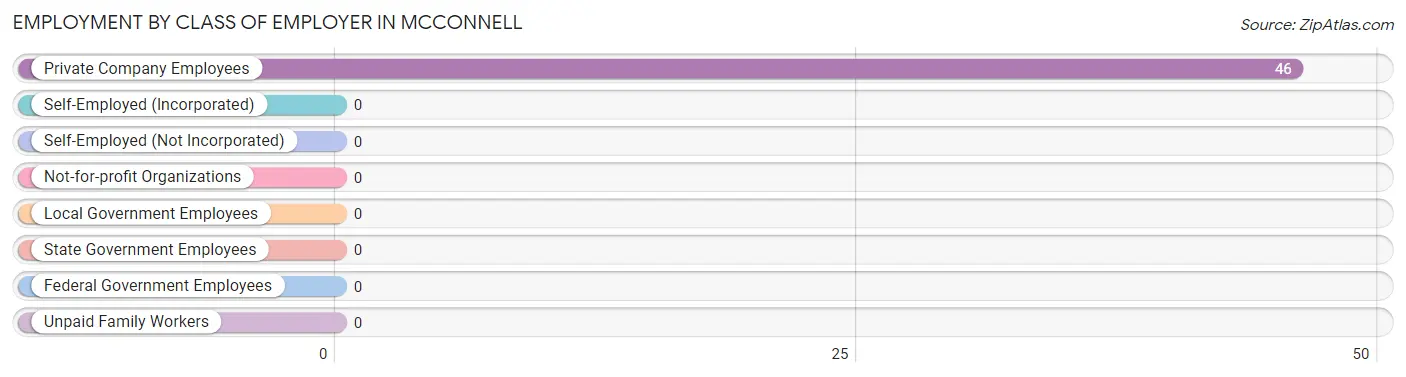
| Employer Class | # Employees | % Employees |
| Private Company Employees | 46 | 100.0% |
| Self-Employed (Incorporated) | 0 | 0.0% |
| Self-Employed (Not Incorporated) | 0 | 0.0% |
| Not-for-profit Organizations | 0 | 0.0% |
| Local Government Employees | 0 | 0.0% |
| State Government Employees | 0 | 0.0% |
| Federal Government Employees | 0 | 0.0% |
| Unpaid Family Workers | 0 | 0.0% |
| Total | 46 | 100.0% |
Employment Status by Age in McConnell
According to the labor force statistics for McConnell, out of the total population over 16 years of age (666), 26.0% or 173 individuals are in the labor force, with 58.4% or 101 of them unemployed. The age group with the highest labor force participation rate is 16 to 19 years, with 55.9% or 52 individuals in the labor force. Within the labor force, the 16 to 19 years age range has the highest percentage of unemployed individuals, with 100.0% or 52 of them being unemployed.
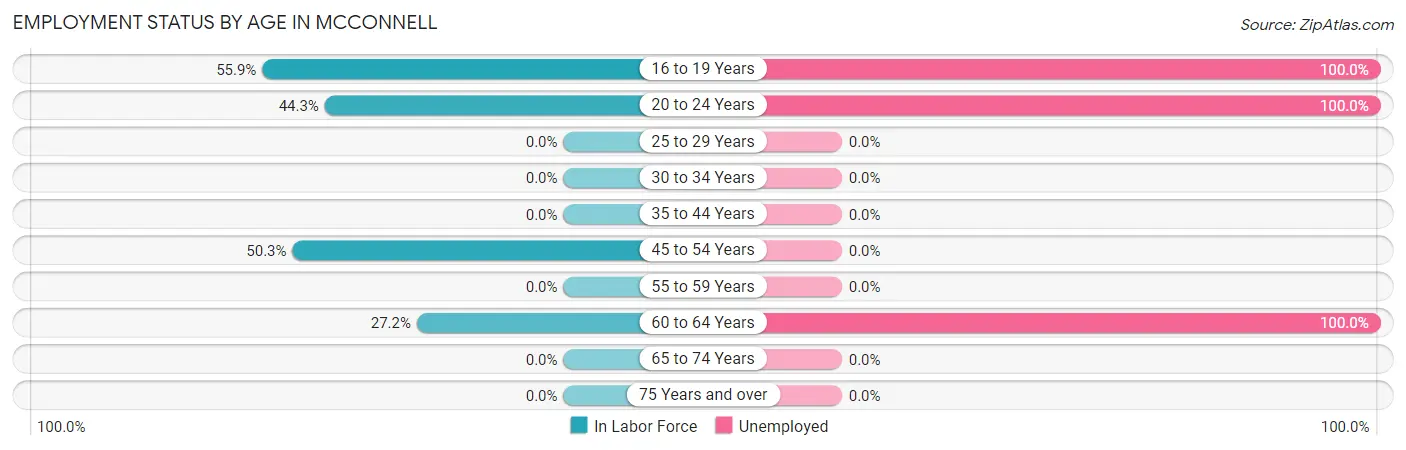
| Age Bracket | In Labor Force | Unemployed |
| 16 to 19 Years | 52 (55.9%) | 52 (100.0%) |
| 20 to 24 Years | 27 (44.3%) | 27 (100.0%) |
| 25 to 29 Years | 0 (0.0%) | 0 (0.0%) |
| 30 to 34 Years | 0 (0.0%) | 0 (0.0%) |
| 35 to 44 Years | 0 (0.0%) | 0 (0.0%) |
| 45 to 54 Years | 72 (50.3%) | 0 (0.0%) |
| 55 to 59 Years | 0 (0.0%) | 0 (0.0%) |
| 60 to 64 Years | 22 (27.2%) | 22 (100.0%) |
| 65 to 74 Years | 0 (0.0%) | 0 (0.0%) |
| 75 Years and over | 0 (0.0%) | 0 (0.0%) |
| Total | 173 (26.0%) | 101 (58.4%) |
Employment Status by Educational Attainment in McConnell
According to labor force statistics for McConnell, 26.8% of individuals (94) out of the total population between 25 and 64 years of age (351) are in the labor force, with 23.4% or 22 of them being unemployed. The group with the highest labor force participation rate are those with the educational attainment of bachelor's degree or higher, with 86.7% or 26 individuals in the labor force. Within the labor force, individuals with high school diploma education have the highest percentage of unemployment, with 32.4% or 22 of them being unemployed.
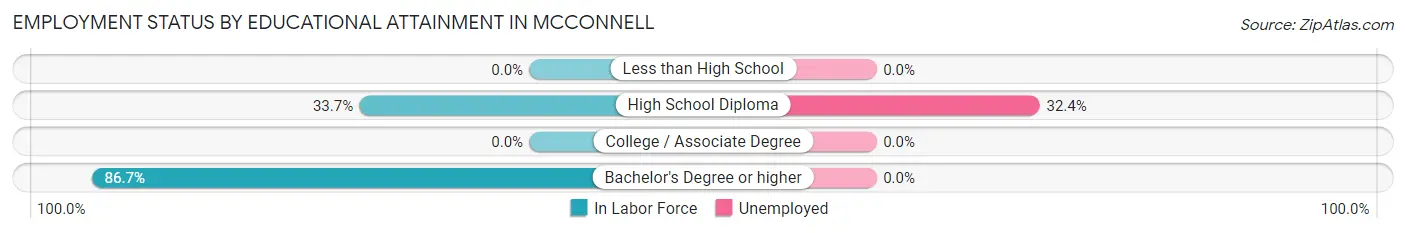
| Educational Attainment | In Labor Force | Unemployed |
| Less than High School | 0 (0.0%) | 0 (0.0%) |
| High School Diploma | 68 (33.7%) | 65 (32.4%) |
| College / Associate Degree | 0 (0.0%) | 0 (0.0%) |
| Bachelor's Degree or higher | 26 (86.7%) | 0 (0.0%) |
| Total | 94 (26.8%) | 82 (23.4%) |
Employment Occupations by Sex in McConnell
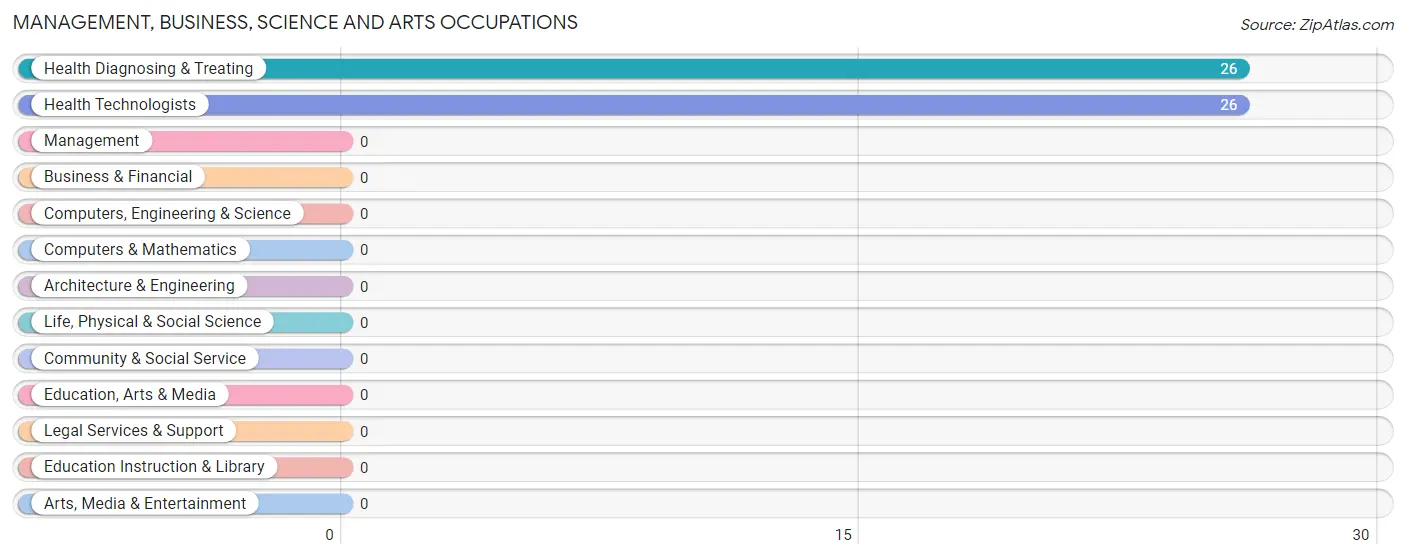
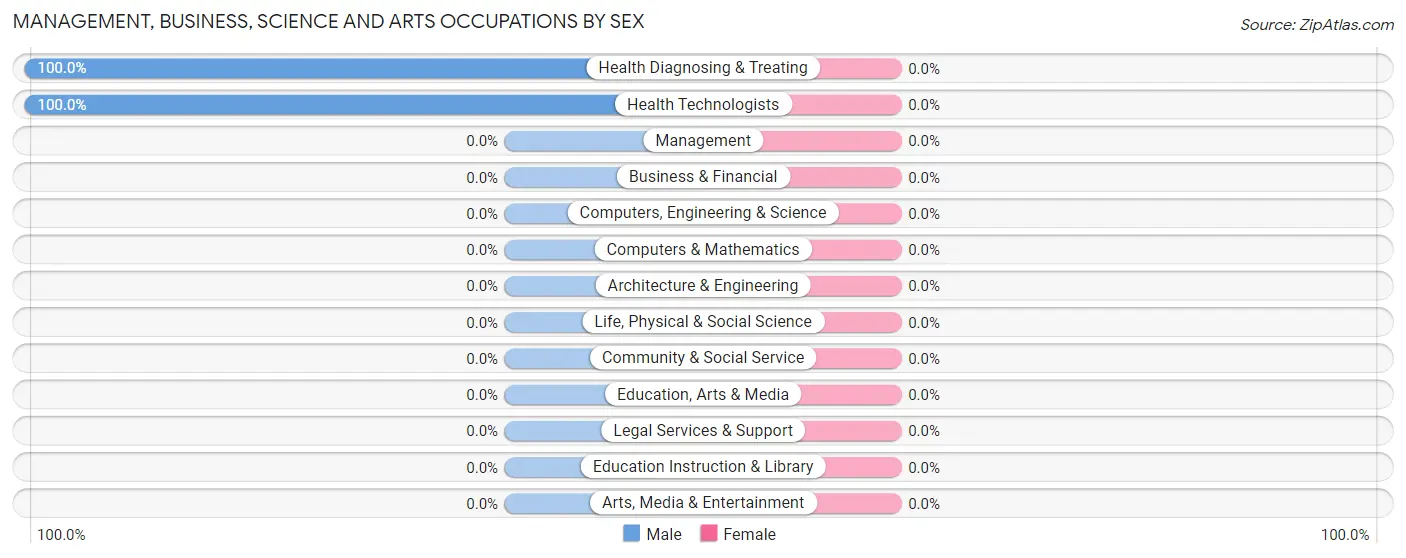
Management, Business, Science and Arts Occupations
The most common Management, Business, Science and Arts occupations in McConnell are Health Diagnosing & Treating (26 | 36.1%), and Health Technologists (26 | 36.1%).
Management, Business, Science and Arts Occupations by Sex
| Occupation | Male | Female |
| Management | 0 (0.0%) | 0 (0.0%) |
| Business & Financial | 0 (0.0%) | 0 (0.0%) |
| Computers, Engineering & Science | 0 (0.0%) | 0 (0.0%) |
| Computers & Mathematics | 0 (0.0%) | 0 (0.0%) |
| Architecture & Engineering | 0 (0.0%) | 0 (0.0%) |
| Life, Physical & Social Science | 0 (0.0%) | 0 (0.0%) |
| Community & Social Service | 0 (0.0%) | 0 (0.0%) |
| Education, Arts & Media | 0 (0.0%) | 0 (0.0%) |
| Legal Services & Support | 0 (0.0%) | 0 (0.0%) |
| Education Instruction & Library | 0 (0.0%) | 0 (0.0%) |
| Arts, Media & Entertainment | 0 (0.0%) | 0 (0.0%) |
| Health Diagnosing & Treating | 26 (100.0%) | 0 (0.0%) |
| Health Technologists | 26 (100.0%) | 0 (0.0%) |
| Total (Category) | 26 (100.0%) | 0 (0.0%) |
| Total (Overall) | 26 (36.1%) | 46 (63.9%) |
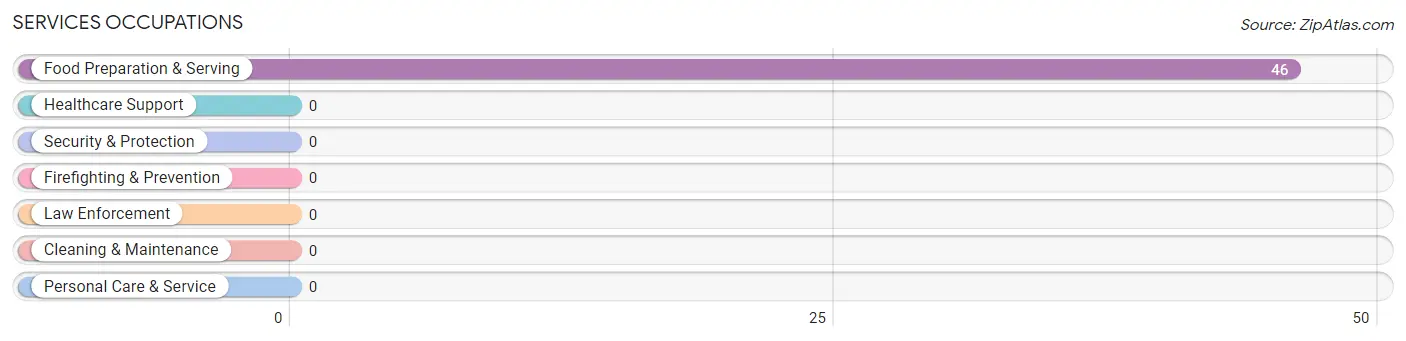
Services Occupations
The most common Services occupations in McConnell are , and Food Preparation & Serving (46 | 63.9%).
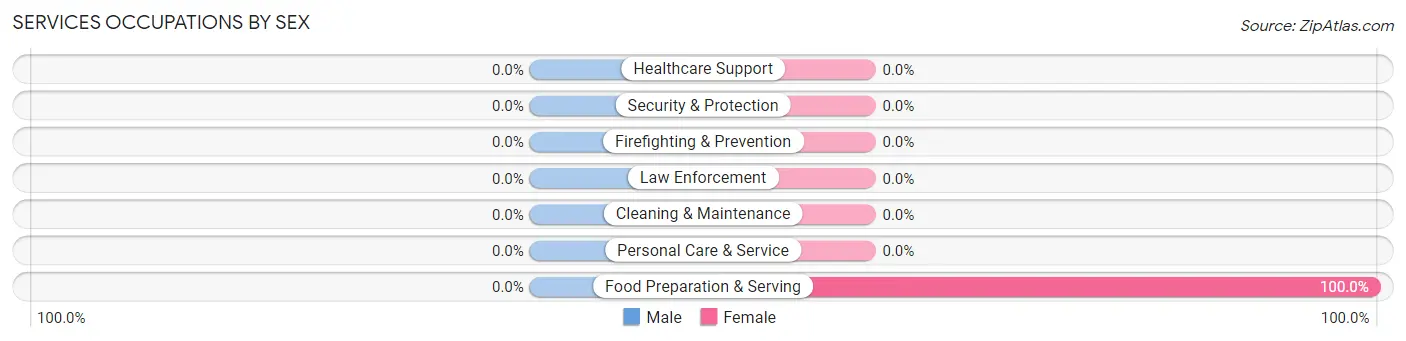
Services Occupations by Sex
| Occupation | Male | Female |
| Healthcare Support | 0 (0.0%) | 0 (0.0%) |
| Security & Protection | 0 (0.0%) | 0 (0.0%) |
| Firefighting & Prevention | 0 (0.0%) | 0 (0.0%) |
| Law Enforcement | 0 (0.0%) | 0 (0.0%) |
| Food Preparation & Serving | 0 (0.0%) | 46 (100.0%) |
| Cleaning & Maintenance | 0 (0.0%) | 0 (0.0%) |
| Personal Care & Service | 0 (0.0%) | 0 (0.0%) |
| Total (Category) | 0 (0.0%) | 46 (100.0%) |
| Total (Overall) | 26 (36.1%) | 46 (63.9%) |
Sales and Office Occupations
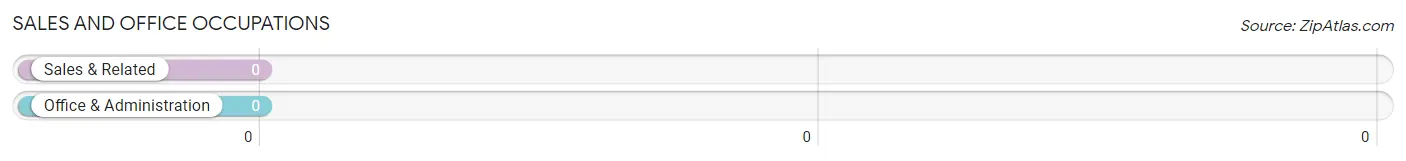
Sales and Office Occupations by Sex
| Occupation | Male | Female |
| Sales & Related | 0 (0.0%) | 0 (0.0%) |
| Office & Administration | 0 (0.0%) | 0 (0.0%) |
| Total (Category) | 0 (0.0%) | 0 (0.0%) |
| Total (Overall) | 26 (36.1%) | 46 (63.9%) |
Natural Resources, Construction and Maintenance Occupations
Natural Resources, Construction and Maintenance Occupations by Sex
| Occupation | Male | Female |
| Farming, Fishing & Forestry | 0 (0.0%) | 0 (0.0%) |
| Construction & Extraction | 0 (0.0%) | 0 (0.0%) |
| Installation, Maintenance & Repair | 0 (0.0%) | 0 (0.0%) |
| Total (Category) | 0 (0.0%) | 0 (0.0%) |
| Total (Overall) | 26 (36.1%) | 46 (63.9%) |
Production, Transportation and Moving Occupations
Production, Transportation and Moving Occupations by Sex
| Occupation | Male | Female |
| Production | 0 (0.0%) | 0 (0.0%) |
| Transportation | 0 (0.0%) | 0 (0.0%) |
| Material Moving | 0 (0.0%) | 0 (0.0%) |
| Total (Category) | 0 (0.0%) | 0 (0.0%) |
| Total (Overall) | 26 (36.1%) | 46 (63.9%) |
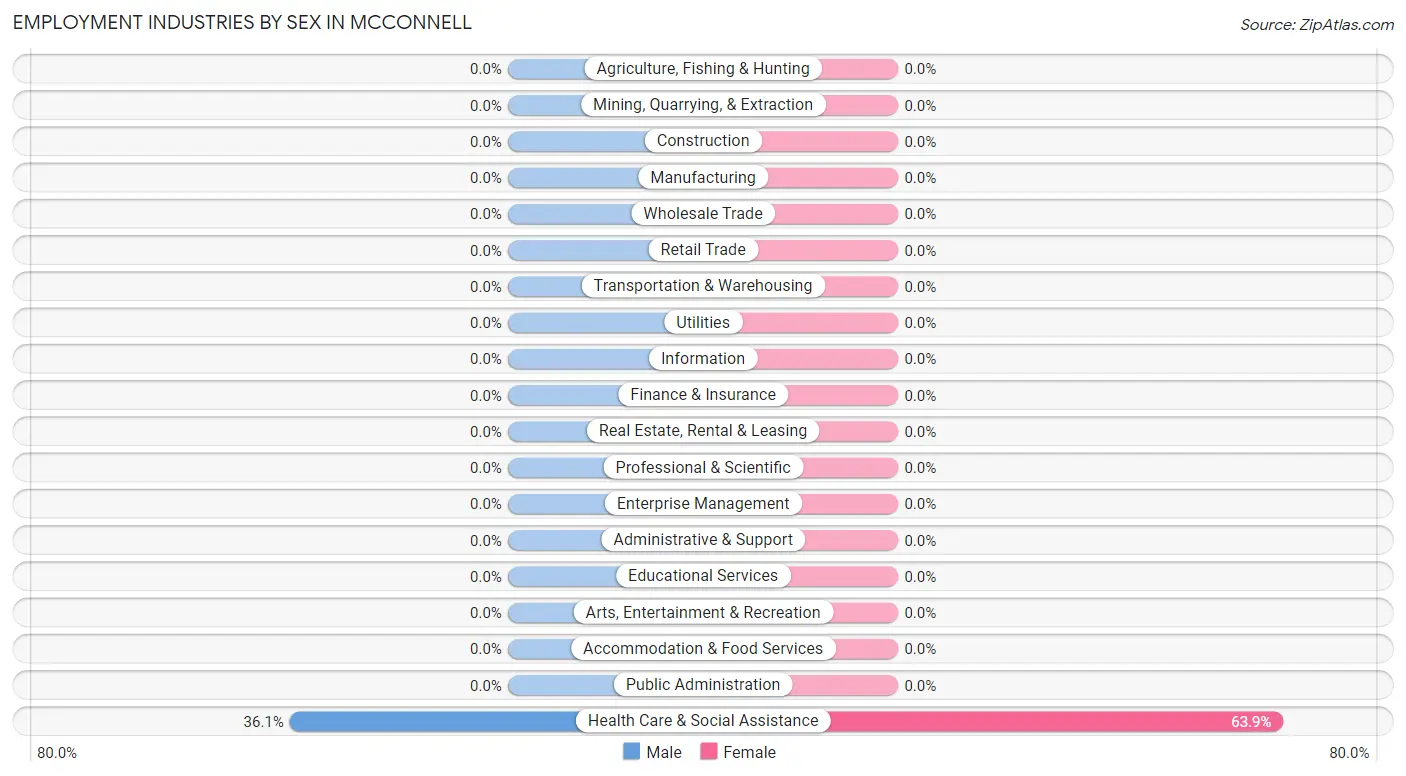
Employment Industries by Sex in McConnell
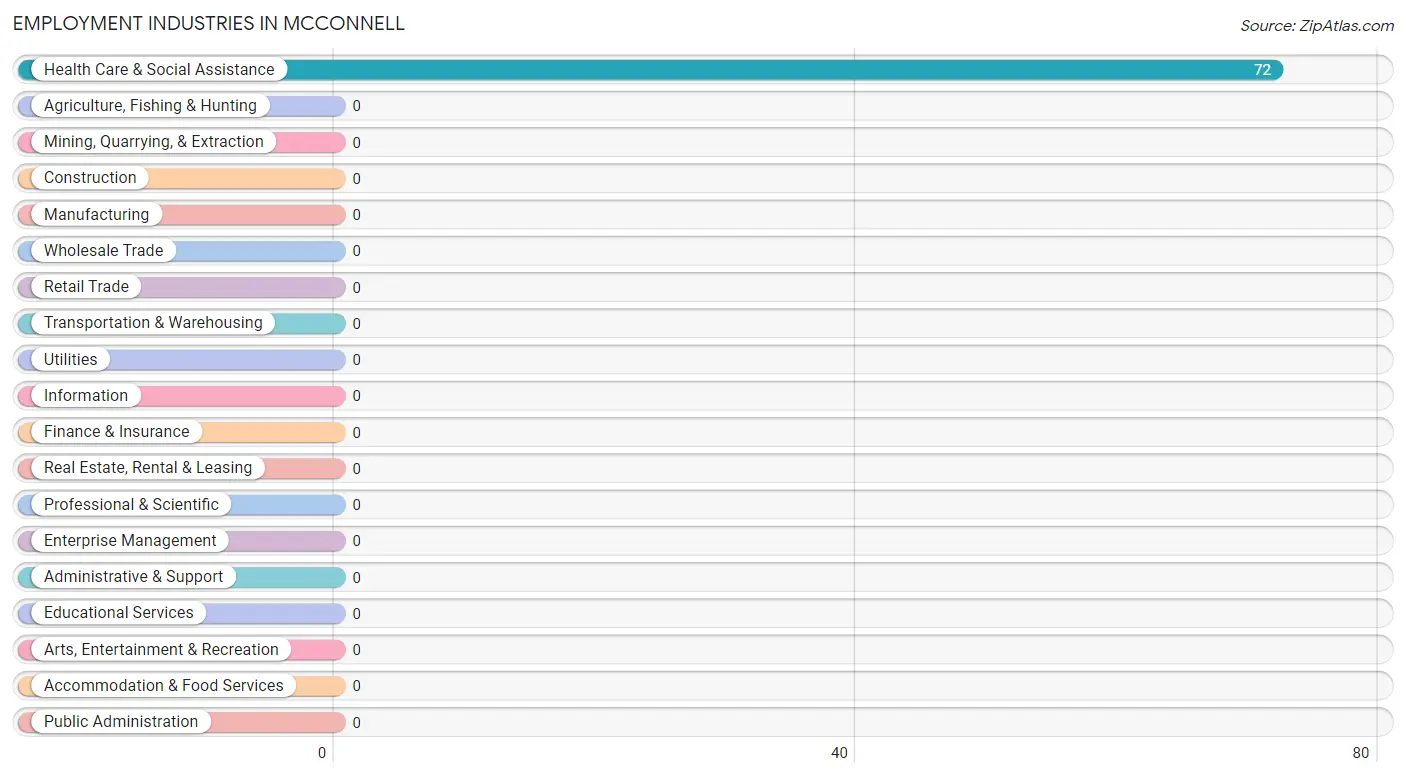
Employment Industries in McConnell
The major employment industries in McConnell include , and Health Care & Social Assistance (72 | 100.0%).
Employment Industries by Sex in McConnell
| Industry | Male | Female |
| Agriculture, Fishing & Hunting | 0 (0.0%) | 0 (0.0%) |
| Mining, Quarrying, & Extraction | 0 (0.0%) | 0 (0.0%) |
| Construction | 0 (0.0%) | 0 (0.0%) |
| Manufacturing | 0 (0.0%) | 0 (0.0%) |
| Wholesale Trade | 0 (0.0%) | 0 (0.0%) |
| Retail Trade | 0 (0.0%) | 0 (0.0%) |
| Transportation & Warehousing | 0 (0.0%) | 0 (0.0%) |
| Utilities | 0 (0.0%) | 0 (0.0%) |
| Information | 0 (0.0%) | 0 (0.0%) |
| Finance & Insurance | 0 (0.0%) | 0 (0.0%) |
| Real Estate, Rental & Leasing | 0 (0.0%) | 0 (0.0%) |
| Professional & Scientific | 0 (0.0%) | 0 (0.0%) |
| Enterprise Management | 0 (0.0%) | 0 (0.0%) |
| Administrative & Support | 0 (0.0%) | 0 (0.0%) |
| Educational Services | 0 (0.0%) | 0 (0.0%) |
| Health Care & Social Assistance | 26 (36.1%) | 46 (63.9%) |
| Arts, Entertainment & Recreation | 0 (0.0%) | 0 (0.0%) |
| Accommodation & Food Services | 0 (0.0%) | 0 (0.0%) |
| Public Administration | 0 (0.0%) | 0 (0.0%) |
| Total | 26 (36.1%) | 46 (63.9%) |
Education in McConnell
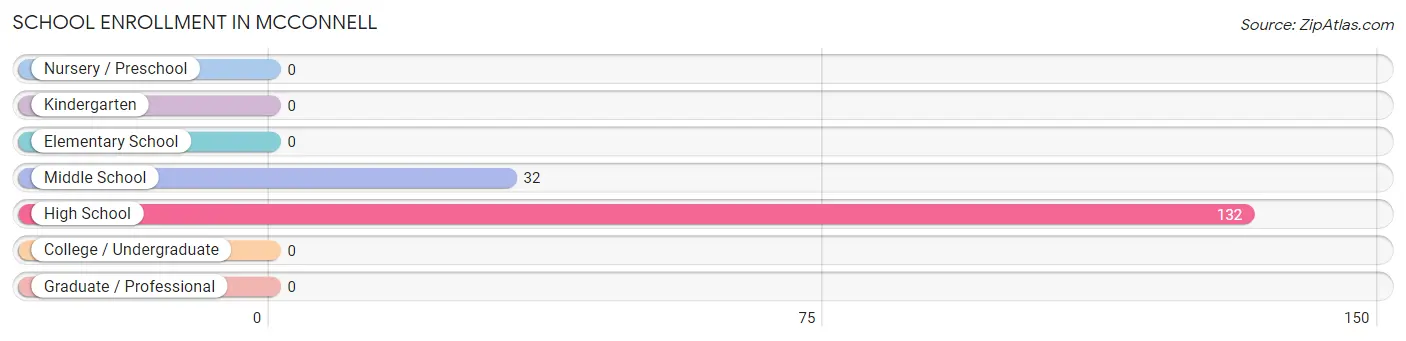
School Enrollment in McConnell
The most common levels of schooling among the 164 students in McConnell are high school (132 | 80.5%), and middle school (32 | 19.5%).
| School Level | # Students | % Students |
| Nursery / Preschool | 0 | 0.0% |
| Kindergarten | 0 | 0.0% |
| Elementary School | 0 | 0.0% |
| Middle School | 32 | 19.5% |
| High School | 132 | 80.5% |
| College / Undergraduate | 0 | 0.0% |
| Graduate / Professional | 0 | 0.0% |
| Total | 164 | 100.0% |
School Enrollment by Age by Funding Source in McConnell
Out of a total of 164 students who are enrolled in schools in McConnell, 32 (19.5%) attend a private institution, while the remaining 132 (80.5%) are enrolled in public schools. The age group of 10 to 14 year olds has the highest likelihood of being enrolled in private schools, with 32 (100.0% in the age bracket) enrolled. Conversely, the age group of 15 to 17 year olds has the lowest likelihood of being enrolled in a private school, with 132 (100.0% in the age bracket) attending a public institution.
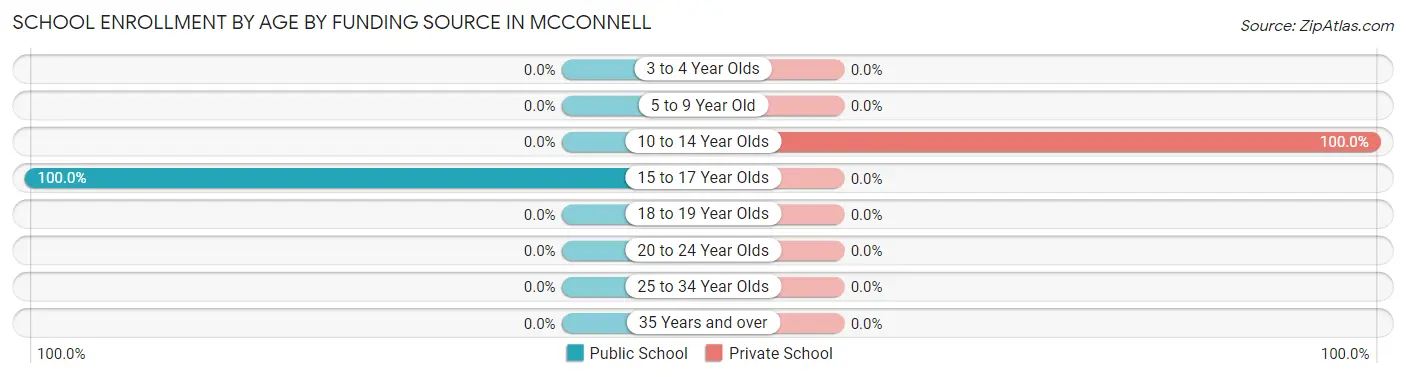
| Age Bracket | Public School | Private School |
| 3 to 4 Year Olds | 0 (0.0%) | 0 (0.0%) |
| 5 to 9 Year Old | 0 (0.0%) | 0 (0.0%) |
| 10 to 14 Year Olds | 0 (0.0%) | 32 (100.0%) |
| 15 to 17 Year Olds | 132 (100.0%) | 0 (0.0%) |
| 18 to 19 Year Olds | 0 (0.0%) | 0 (0.0%) |
| 20 to 24 Year Olds | 0 (0.0%) | 0 (0.0%) |
| 25 to 34 Year Olds | 0 (0.0%) | 0 (0.0%) |
| 35 Years and over | 0 (0.0%) | 0 (0.0%) |
| Total | 132 (80.5%) | 32 (19.5%) |
Educational Attainment by Field of Study in McConnell
Business (30 | 50.8%), bio, nature & agricultural (26 | 44.1%), and arts & humanities (3 | 5.1%) are the most common fields of study among 59 individuals in McConnell who have obtained a bachelor's degree or higher.
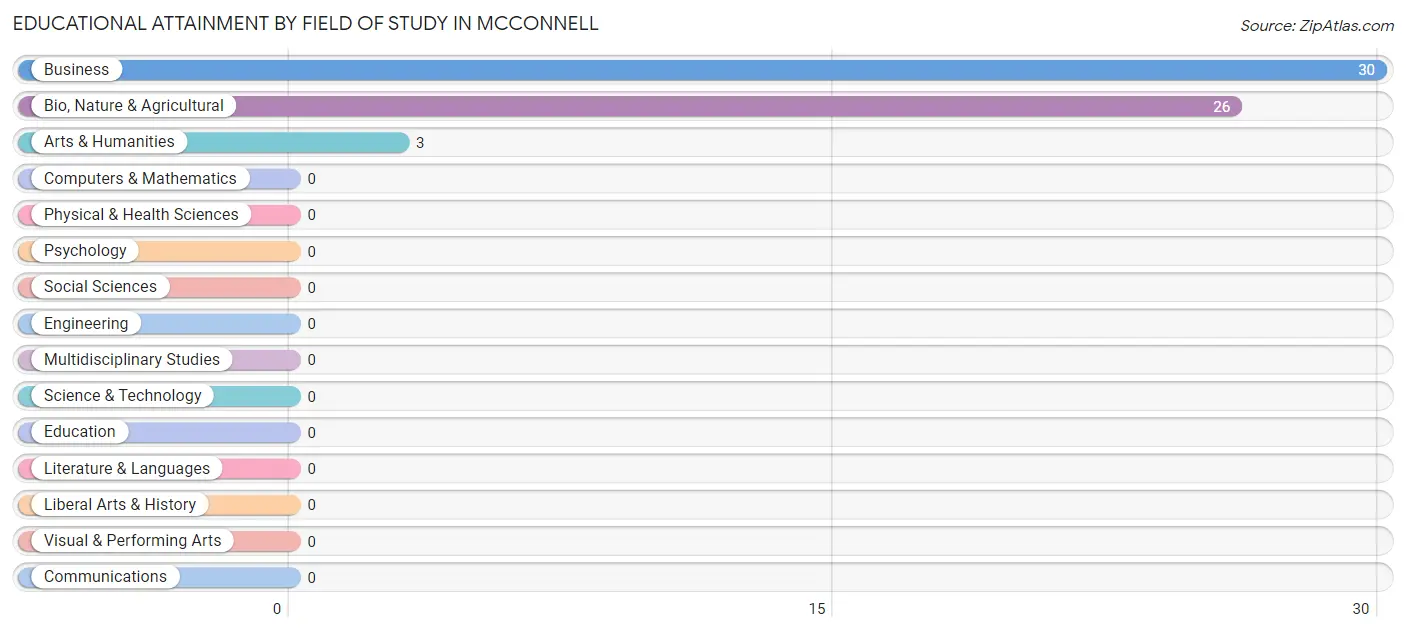
| Field of Study | # Graduates | % Graduates |
| Computers & Mathematics | 0 | 0.0% |
| Bio, Nature & Agricultural | 26 | 44.1% |
| Physical & Health Sciences | 0 | 0.0% |
| Psychology | 0 | 0.0% |
| Social Sciences | 0 | 0.0% |
| Engineering | 0 | 0.0% |
| Multidisciplinary Studies | 0 | 0.0% |
| Science & Technology | 0 | 0.0% |
| Business | 30 | 50.8% |
| Education | 0 | 0.0% |
| Literature & Languages | 0 | 0.0% |
| Liberal Arts & History | 0 | 0.0% |
| Visual & Performing Arts | 0 | 0.0% |
| Communications | 0 | 0.0% |
| Arts & Humanities | 3 | 5.1% |
| Total | 59 | 100.0% |
Transportation & Commute in McConnell
Vehicle Availability by Sex in McConnell
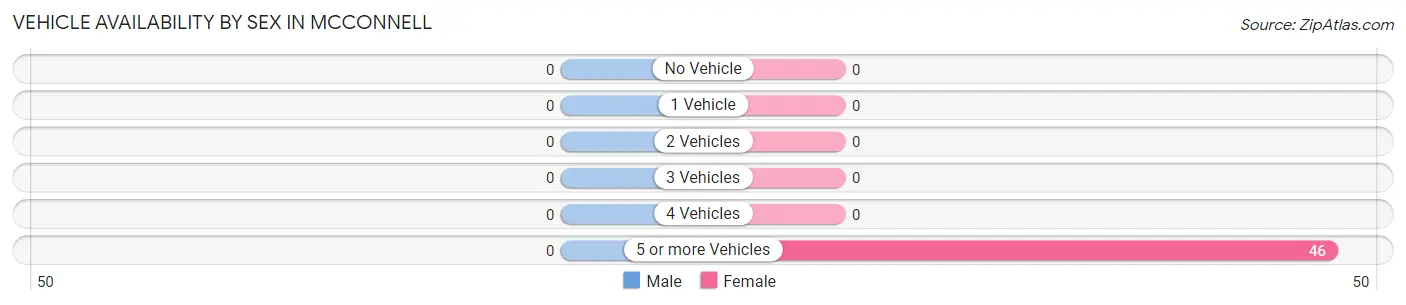
| Vehicles Available | Male | Female |
| No Vehicle | 0 (0.0%) | 0 (0.0%) |
| 1 Vehicle | 0 (0.0%) | 0 (0.0%) |
| 2 Vehicles | 0 (0.0%) | 0 (0.0%) |
| 3 Vehicles | 0 (0.0%) | 0 (0.0%) |
| 4 Vehicles | 0 (0.0%) | 0 (0.0%) |
| 5 or more Vehicles | 0 (0.0%) | 46 (100.0%) |
| Total | 0 (0.0%) | 46 (100.0%) |
Commute Time in McConnell
The most frequently occuring commute durations in McConnell are 5 to 9 minutes (46 commuters, 100.0%), less than 5 minutes (0 commuters, 0.0%), and 10 to 14 minutes (0 commuters, 0.0%).
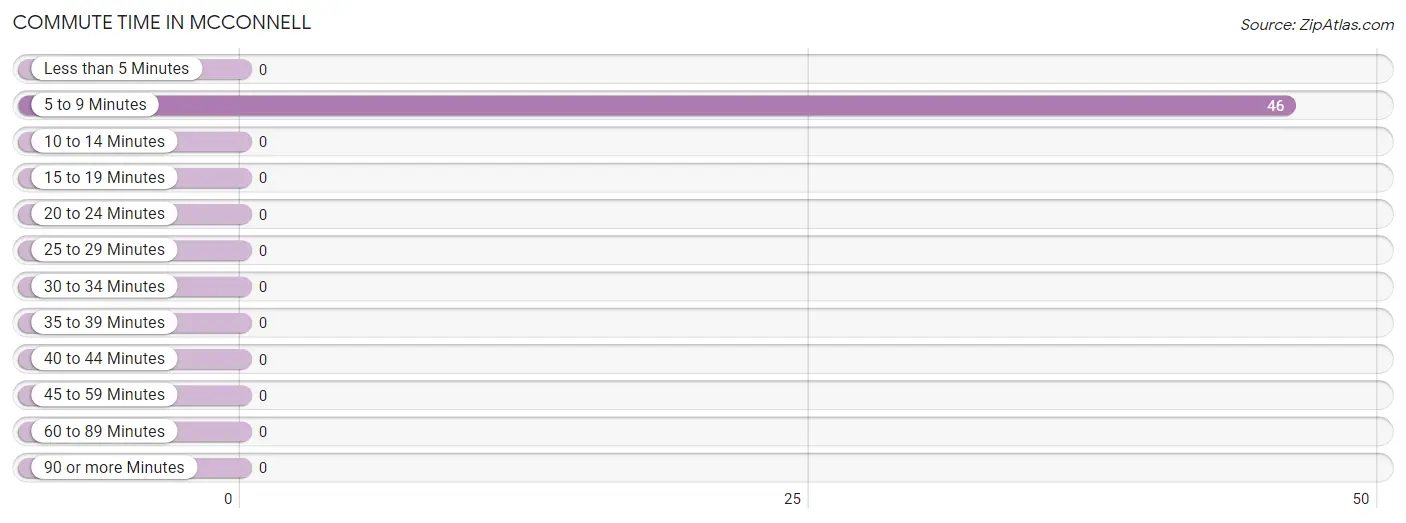
| Commute Time | # Commuters | % Commuters |
| Less than 5 Minutes | 0 | 0.0% |
| 5 to 9 Minutes | 46 | 100.0% |
| 10 to 14 Minutes | 0 | 0.0% |
| 15 to 19 Minutes | 0 | 0.0% |
| 20 to 24 Minutes | 0 | 0.0% |
| 25 to 29 Minutes | 0 | 0.0% |
| 30 to 34 Minutes | 0 | 0.0% |
| 35 to 39 Minutes | 0 | 0.0% |
| 40 to 44 Minutes | 0 | 0.0% |
| 45 to 59 Minutes | 0 | 0.0% |
| 60 to 89 Minutes | 0 | 0.0% |
| 90 or more Minutes | 0 | 0.0% |
Commute Time by Sex in McConnell
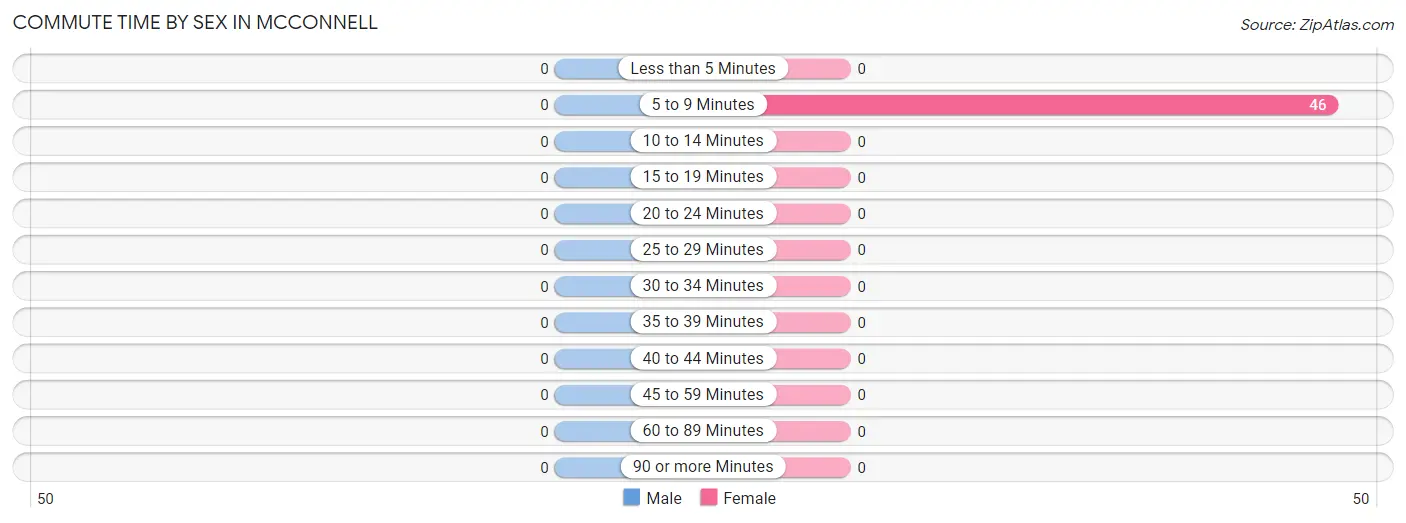
| Commute Time | Male | Female |
| Less than 5 Minutes | 0 (0.0%) | 0 (0.0%) |
| 5 to 9 Minutes | 0 (0.0%) | 46 (100.0%) |
| 10 to 14 Minutes | 0 (0.0%) | 0 (0.0%) |
| 15 to 19 Minutes | 0 (0.0%) | 0 (0.0%) |
| 20 to 24 Minutes | 0 (0.0%) | 0 (0.0%) |
| 25 to 29 Minutes | 0 (0.0%) | 0 (0.0%) |
| 30 to 34 Minutes | 0 (0.0%) | 0 (0.0%) |
| 35 to 39 Minutes | 0 (0.0%) | 0 (0.0%) |
| 40 to 44 Minutes | 0 (0.0%) | 0 (0.0%) |
| 45 to 59 Minutes | 0 (0.0%) | 0 (0.0%) |
| 60 to 89 Minutes | 0 (0.0%) | 0 (0.0%) |
| 90 or more Minutes | 0 (0.0%) | 0 (0.0%) |
Time of Departure to Work by Sex in McConnell
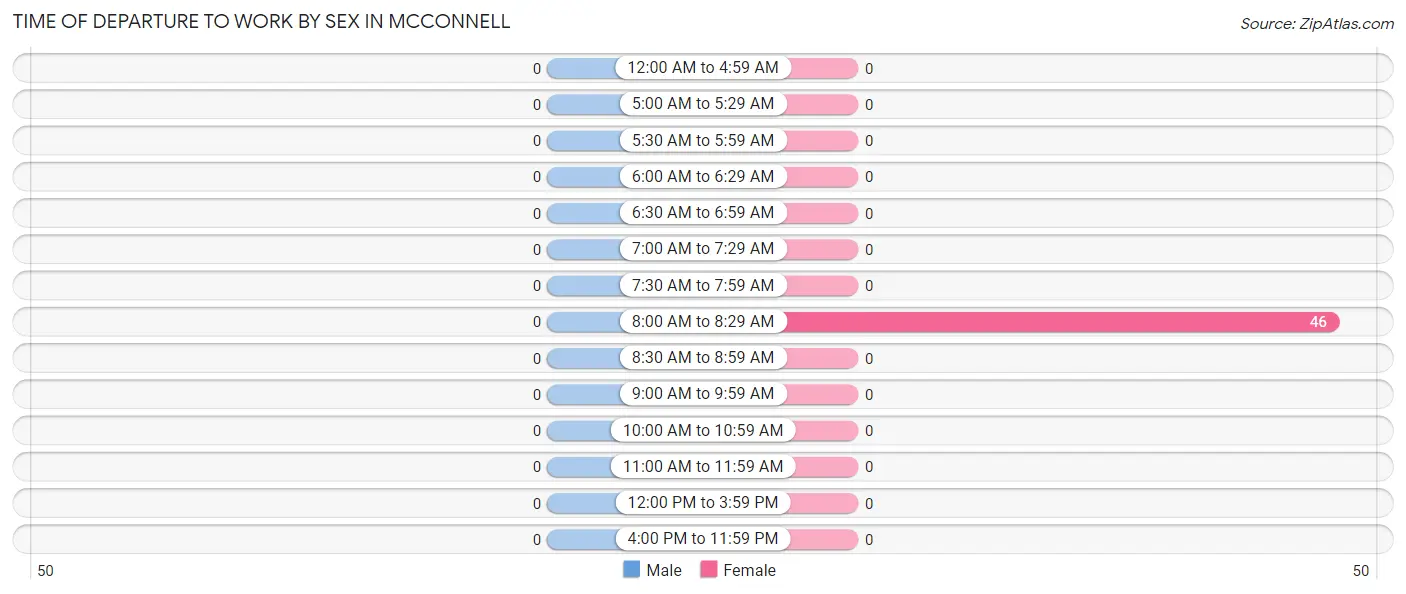
| Time of Departure | Male | Female |
| 12:00 AM to 4:59 AM | 0 (0.0%) | 0 (0.0%) |
| 5:00 AM to 5:29 AM | 0 (0.0%) | 0 (0.0%) |
| 5:30 AM to 5:59 AM | 0 (0.0%) | 0 (0.0%) |
| 6:00 AM to 6:29 AM | 0 (0.0%) | 0 (0.0%) |
| 6:30 AM to 6:59 AM | 0 (0.0%) | 0 (0.0%) |
| 7:00 AM to 7:29 AM | 0 (0.0%) | 0 (0.0%) |
| 7:30 AM to 7:59 AM | 0 (0.0%) | 0 (0.0%) |
| 8:00 AM to 8:29 AM | 0 (0.0%) | 46 (100.0%) |
| 8:30 AM to 8:59 AM | 0 (0.0%) | 0 (0.0%) |
| 9:00 AM to 9:59 AM | 0 (0.0%) | 0 (0.0%) |
| 10:00 AM to 10:59 AM | 0 (0.0%) | 0 (0.0%) |
| 11:00 AM to 11:59 AM | 0 (0.0%) | 0 (0.0%) |
| 12:00 PM to 3:59 PM | 0 (0.0%) | 0 (0.0%) |
| 4:00 PM to 11:59 PM | 0 (0.0%) | 0 (0.0%) |
| Total | 0 (0.0%) | 46 (100.0%) |
Housing Occupancy in McConnell
Occupancy by Ownership in McConnell
Of the total 287 dwellings in McConnell, owner-occupied units account for 227 (79.1%), while renter-occupied units make up 60 (20.9%).
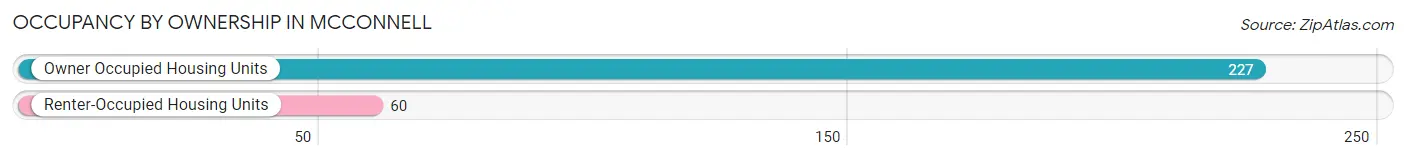
| Occupancy | # Housing Units | % Housing Units |
| Owner Occupied Housing Units | 227 | 79.1% |
| Renter-Occupied Housing Units | 60 | 20.9% |
| Total Occupied Housing Units | 287 | 100.0% |
Occupancy by Household Size in McConnell
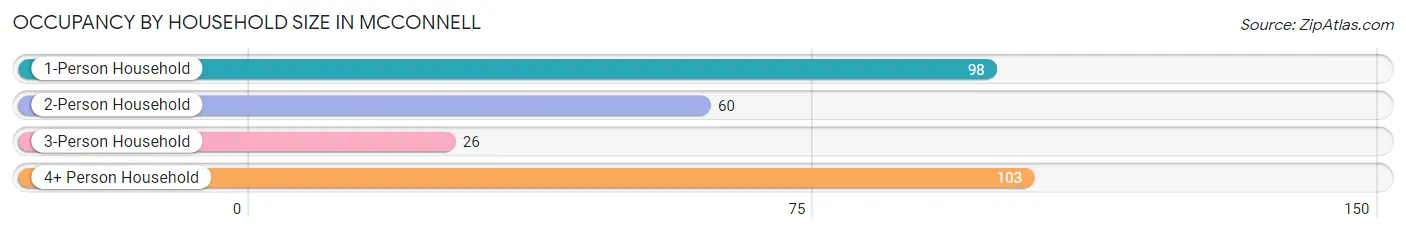
| Household Size | # Housing Units | % Housing Units |
| 1-Person Household | 98 | 34.2% |
| 2-Person Household | 60 | 20.9% |
| 3-Person Household | 26 | 9.1% |
| 4+ Person Household | 103 | 35.9% |
| Total Housing Units | 287 | 100.0% |
Occupancy by Ownership by Household Size in McConnell
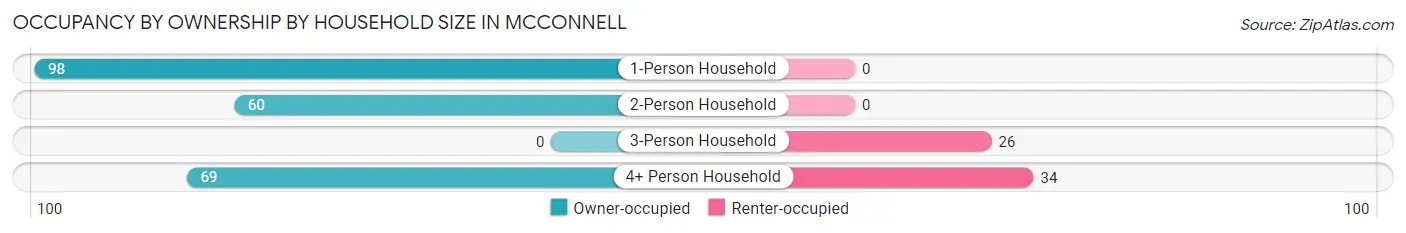
| Household Size | Owner-occupied | Renter-occupied |
| 1-Person Household | 98 (100.0%) | 0 (0.0%) |
| 2-Person Household | 60 (100.0%) | 0 (0.0%) |
| 3-Person Household | 0 (0.0%) | 26 (100.0%) |
| 4+ Person Household | 69 (67.0%) | 34 (33.0%) |
| Total Housing Units | 227 (79.1%) | 60 (20.9%) |
Occupancy by Educational Attainment in McConnell
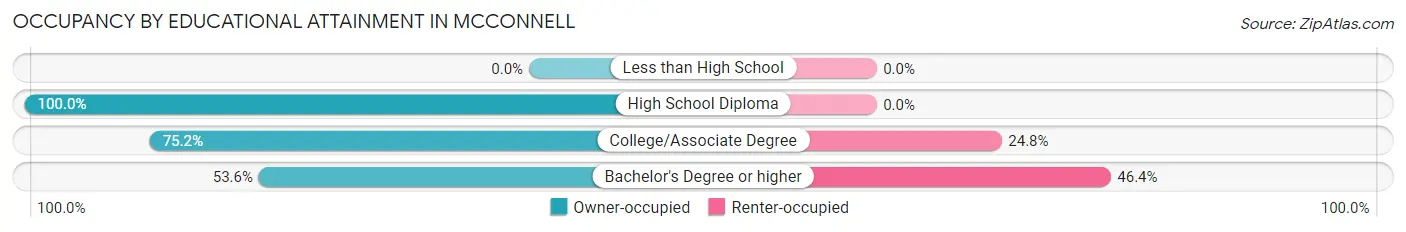
| Household Size | Owner-occupied | Renter-occupied |
| Less than High School | 0 (0.0%) | 0 (0.0%) |
| High School Diploma | 94 (100.0%) | 0 (0.0%) |
| College/Associate Degree | 103 (75.2%) | 34 (24.8%) |
| Bachelor's Degree or higher | 30 (53.6%) | 26 (46.4%) |
Occupancy by Age of Householder in McConnell
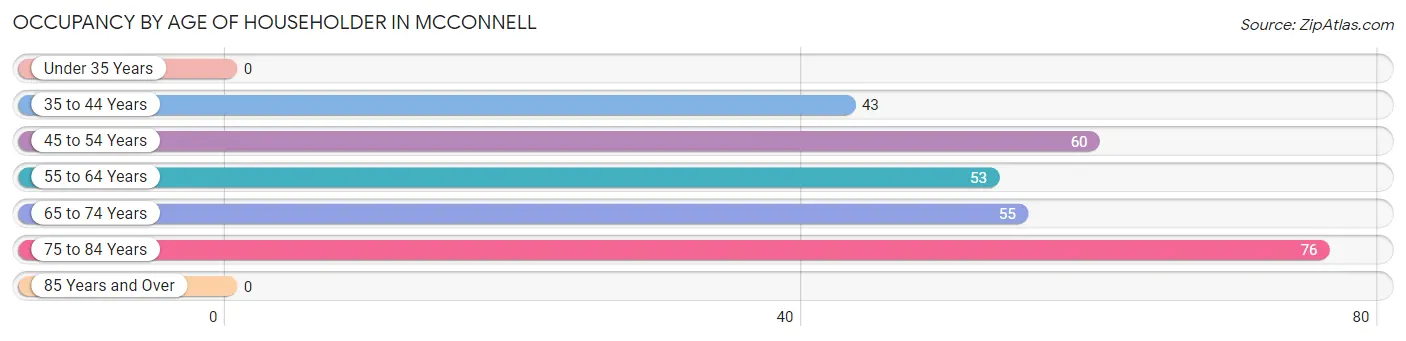
| Age Bracket | # Households | % Households |
| Under 35 Years | 0 | 0.0% |
| 35 to 44 Years | 43 | 15.0% |
| 45 to 54 Years | 60 | 20.9% |
| 55 to 64 Years | 53 | 18.5% |
| 65 to 74 Years | 55 | 19.2% |
| 75 to 84 Years | 76 | 26.5% |
| 85 Years and Over | 0 | 0.0% |
| Total | 287 | 100.0% |
Housing Finances in McConnell
Median Income by Occupancy in McConnell
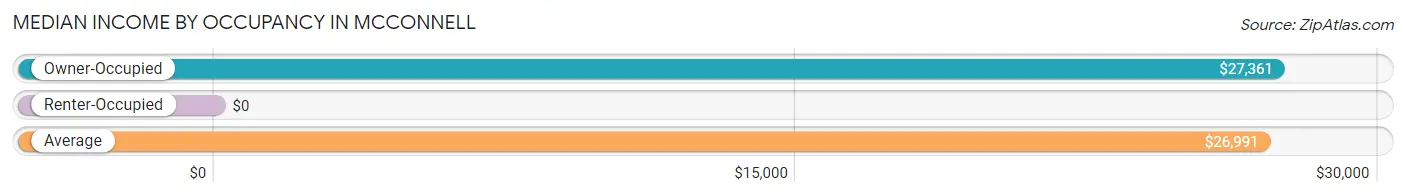
| Occupancy Type | # Households | Median Income |
| Owner-Occupied | 227 (79.1%) | $27,361 |
| Renter-Occupied | 60 (20.9%) | $0 |
| Average | 287 (100.0%) | $26,991 |
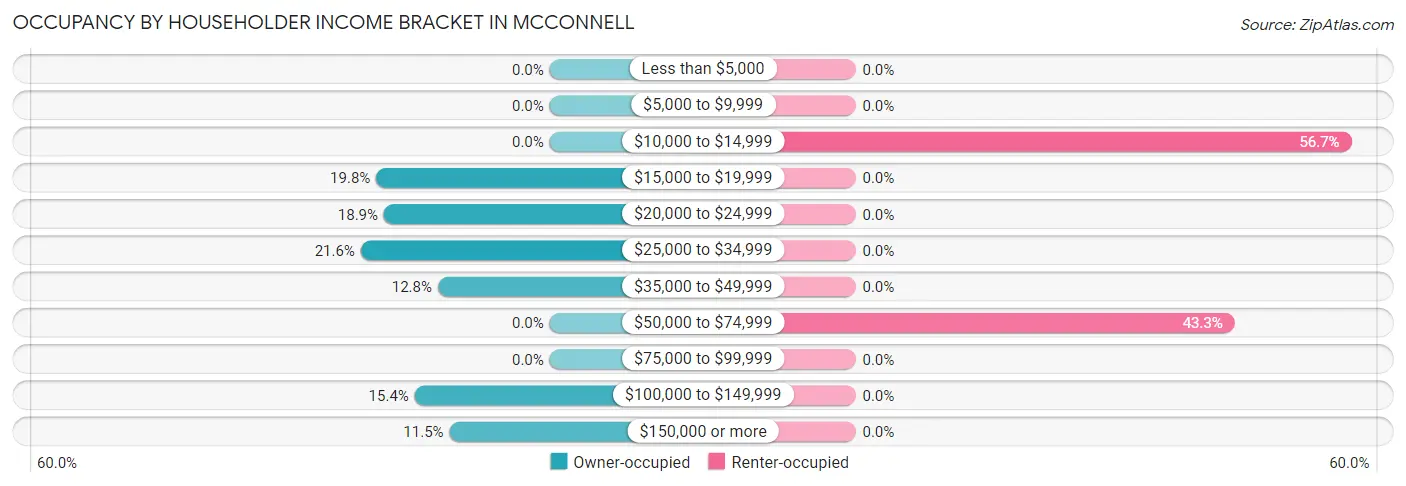
Occupancy by Householder Income Bracket in McConnell
| Income Bracket | Owner-occupied | Renter-occupied |
| Less than $5,000 | 0 (0.0%) | 0 (0.0%) |
| $5,000 to $9,999 | 0 (0.0%) | 0 (0.0%) |
| $10,000 to $14,999 | 0 (0.0%) | 34 (56.7%) |
| $15,000 to $19,999 | 45 (19.8%) | 0 (0.0%) |
| $20,000 to $24,999 | 43 (18.9%) | 0 (0.0%) |
| $25,000 to $34,999 | 49 (21.6%) | 0 (0.0%) |
| $35,000 to $49,999 | 29 (12.8%) | 0 (0.0%) |
| $50,000 to $74,999 | 0 (0.0%) | 26 (43.3%) |
| $75,000 to $99,999 | 0 (0.0%) | 0 (0.0%) |
| $100,000 to $149,999 | 35 (15.4%) | 0 (0.0%) |
| $150,000 or more | 26 (11.5%) | 0 (0.0%) |
| Total | 227 (100.0%) | 60 (100.0%) |
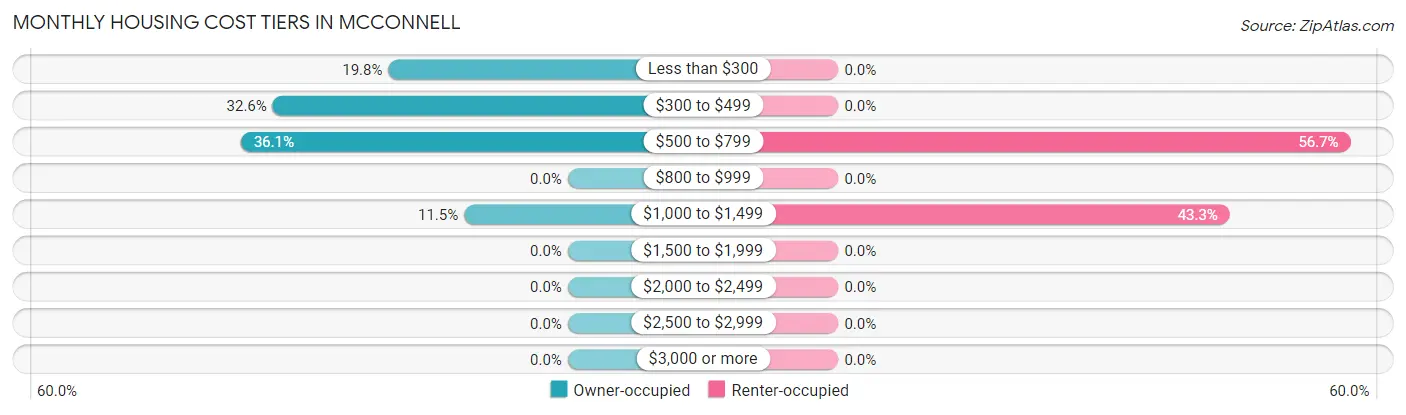
Monthly Housing Cost Tiers in McConnell
| Monthly Cost | Owner-occupied | Renter-occupied |
| Less than $300 | 45 (19.8%) | 0 (0.0%) |
| $300 to $499 | 74 (32.6%) | 0 (0.0%) |
| $500 to $799 | 82 (36.1%) | 34 (56.7%) |
| $800 to $999 | 0 (0.0%) | 0 (0.0%) |
| $1,000 to $1,499 | 26 (11.5%) | 26 (43.3%) |
| $1,500 to $1,999 | 0 (0.0%) | 0 (0.0%) |
| $2,000 to $2,499 | 0 (0.0%) | 0 (0.0%) |
| $2,500 to $2,999 | 0 (0.0%) | 0 (0.0%) |
| $3,000 or more | 0 (0.0%) | 0 (0.0%) |
| Total | 227 (100.0%) | 60 (100.0%) |
Physical Housing Characteristics in McConnell
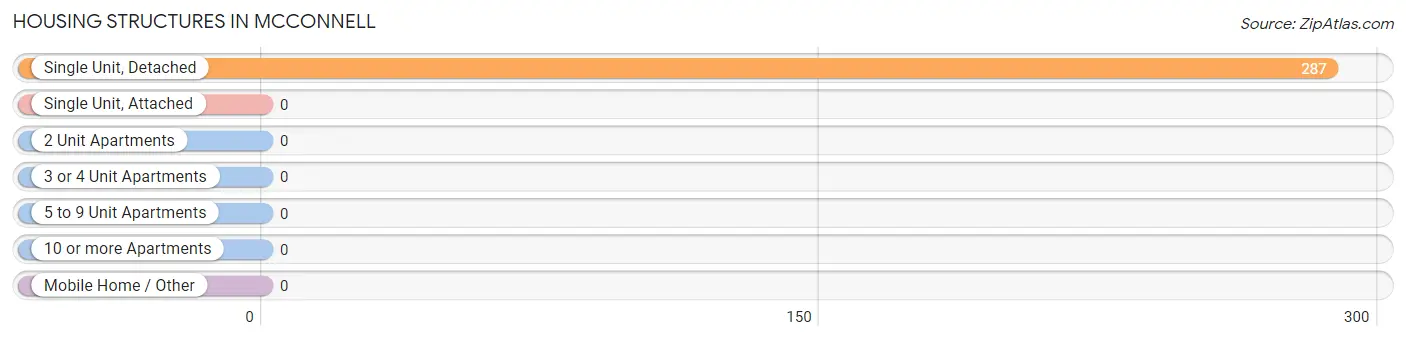
Housing Structures in McConnell
| Structure Type | # Housing Units | % Housing Units |
| Single Unit, Detached | 287 | 100.0% |
| Single Unit, Attached | 0 | 0.0% |
| 2 Unit Apartments | 0 | 0.0% |
| 3 or 4 Unit Apartments | 0 | 0.0% |
| 5 to 9 Unit Apartments | 0 | 0.0% |
| 10 or more Apartments | 0 | 0.0% |
| Mobile Home / Other | 0 | 0.0% |
| Total | 287 | 100.0% |
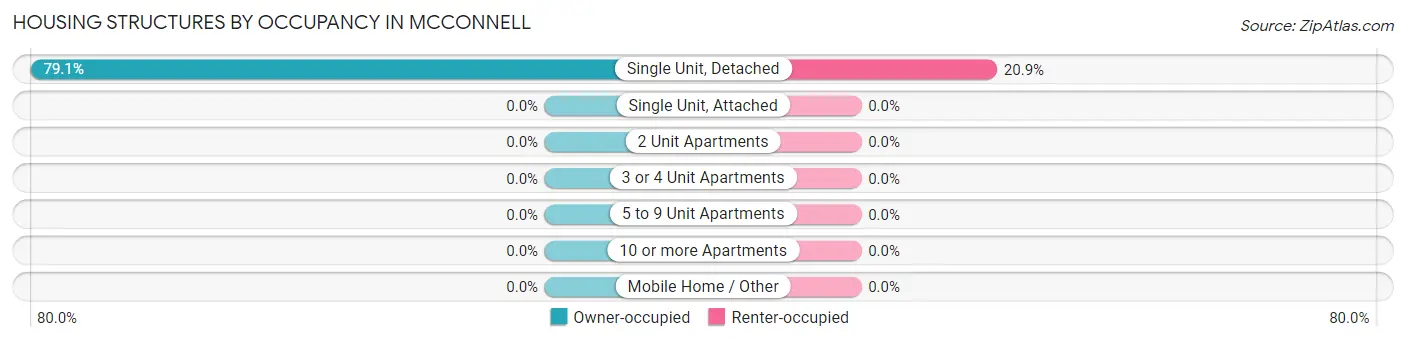
Housing Structures by Occupancy in McConnell
| Structure Type | Owner-occupied | Renter-occupied |
| Single Unit, Detached | 227 (79.1%) | 60 (20.9%) |
| Single Unit, Attached | 0 (0.0%) | 0 (0.0%) |
| 2 Unit Apartments | 0 (0.0%) | 0 (0.0%) |
| 3 or 4 Unit Apartments | 0 (0.0%) | 0 (0.0%) |
| 5 to 9 Unit Apartments | 0 (0.0%) | 0 (0.0%) |
| 10 or more Apartments | 0 (0.0%) | 0 (0.0%) |
| Mobile Home / Other | 0 (0.0%) | 0 (0.0%) |
| Total | 227 (79.1%) | 60 (20.9%) |
Housing Structures by Number of Rooms in McConnell
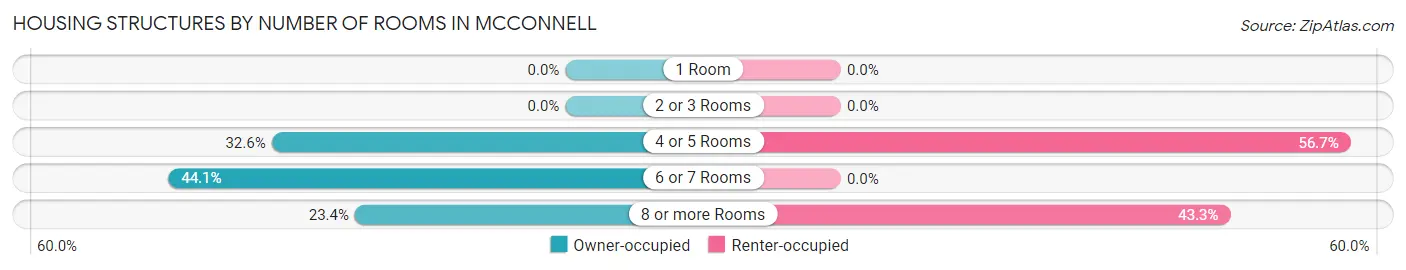
| Number of Rooms | Owner-occupied | Renter-occupied |
| 1 Room | 0 (0.0%) | 0 (0.0%) |
| 2 or 3 Rooms | 0 (0.0%) | 0 (0.0%) |
| 4 or 5 Rooms | 74 (32.6%) | 34 (56.7%) |
| 6 or 7 Rooms | 100 (44.1%) | 0 (0.0%) |
| 8 or more Rooms | 53 (23.4%) | 26 (43.3%) |
| Total | 227 (100.0%) | 60 (100.0%) |
Housing Structure by Heating Type in McConnell
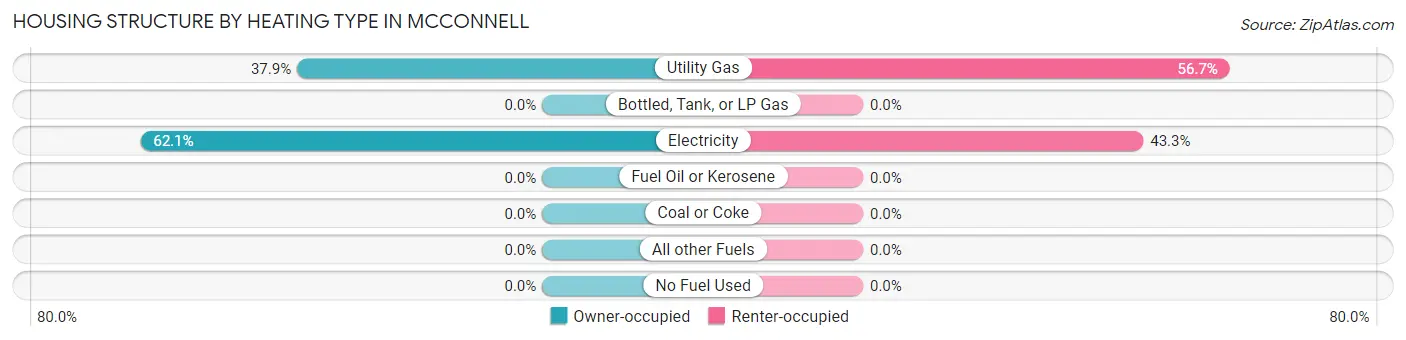
| Heating Type | Owner-occupied | Renter-occupied |
| Utility Gas | 86 (37.9%) | 34 (56.7%) |
| Bottled, Tank, or LP Gas | 0 (0.0%) | 0 (0.0%) |
| Electricity | 141 (62.1%) | 26 (43.3%) |
| Fuel Oil or Kerosene | 0 (0.0%) | 0 (0.0%) |
| Coal or Coke | 0 (0.0%) | 0 (0.0%) |
| All other Fuels | 0 (0.0%) | 0 (0.0%) |
| No Fuel Used | 0 (0.0%) | 0 (0.0%) |
| Total | 227 (100.0%) | 60 (100.0%) |
Household Vehicle Usage in McConnell
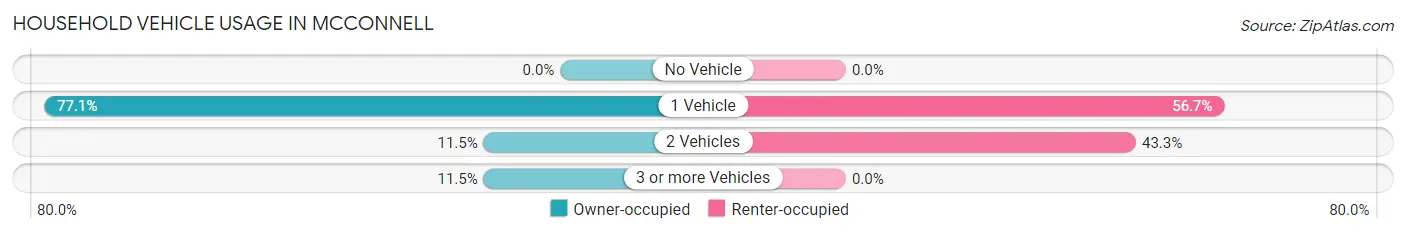
| Vehicles per Household | Owner-occupied | Renter-occupied |
| No Vehicle | 0 (0.0%) | 0 (0.0%) |
| 1 Vehicle | 175 (77.1%) | 34 (56.7%) |
| 2 Vehicles | 26 (11.5%) | 26 (43.3%) |
| 3 or more Vehicles | 26 (11.5%) | 0 (0.0%) |
| Total | 227 (100.0%) | 60 (100.0%) |
Real Estate & Mortgages in McConnell
Real Estate and Mortgage Overview in McConnell
| Characteristic | Without Mortgage | With Mortgage |
| Housing Units | 176 | 51 |
| Median Property Value | - | - |
| Median Household Income | - | - |
| Monthly Housing Costs | $329 | $0 |
| Real Estate Taxes | $340 | $0 |
Property Value by Mortgage Status in McConnell
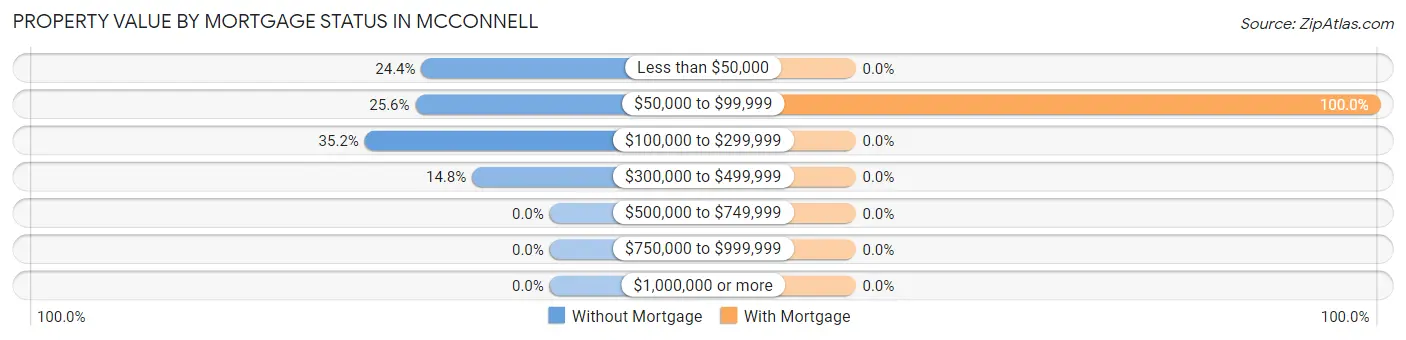
| Property Value | Without Mortgage | With Mortgage |
| Less than $50,000 | 43 (24.4%) | 0 (0.0%) |
| $50,000 to $99,999 | 45 (25.6%) | 51 (100.0%) |
| $100,000 to $299,999 | 62 (35.2%) | 0 (0.0%) |
| $300,000 to $499,999 | 26 (14.8%) | 0 (0.0%) |
| $500,000 to $749,999 | 0 (0.0%) | 0 (0.0%) |
| $750,000 to $999,999 | 0 (0.0%) | 0 (0.0%) |
| $1,000,000 or more | 0 (0.0%) | 0 (0.0%) |
| Total | 176 (100.0%) | 51 (100.0%) |
Household Income by Mortgage Status in McConnell
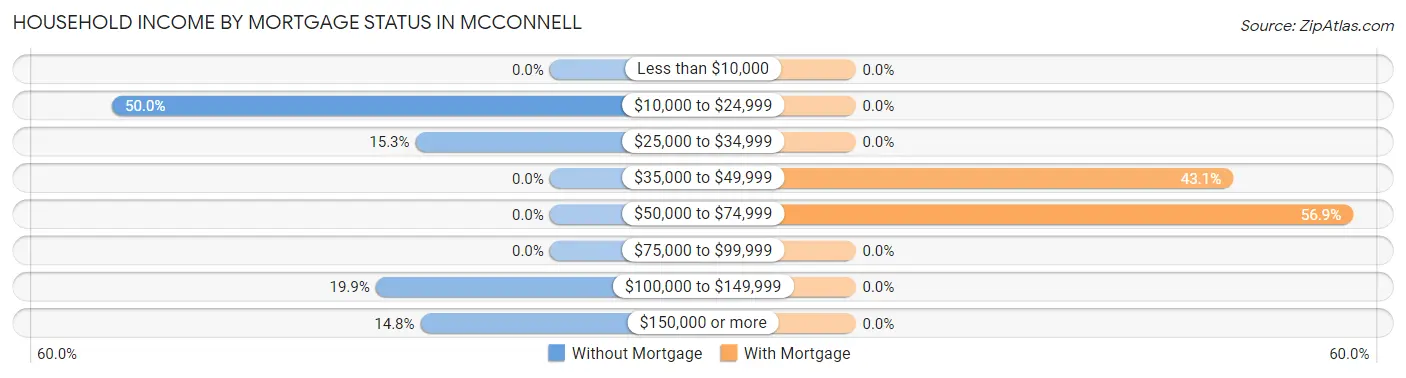
| Household Income | Without Mortgage | With Mortgage |
| Less than $10,000 | 0 (0.0%) | 0 (0.0%) |
| $10,000 to $24,999 | 88 (50.0%) | 0 (0.0%) |
| $25,000 to $34,999 | 27 (15.3%) | 0 (0.0%) |
| $35,000 to $49,999 | 0 (0.0%) | 22 (43.1%) |
| $50,000 to $74,999 | 0 (0.0%) | 29 (56.9%) |
| $75,000 to $99,999 | 0 (0.0%) | 0 (0.0%) |
| $100,000 to $149,999 | 35 (19.9%) | 0 (0.0%) |
| $150,000 or more | 26 (14.8%) | 0 (0.0%) |
| Total | 176 (100.0%) | 51 (100.0%) |
Property Value to Household Income Ratio in McConnell
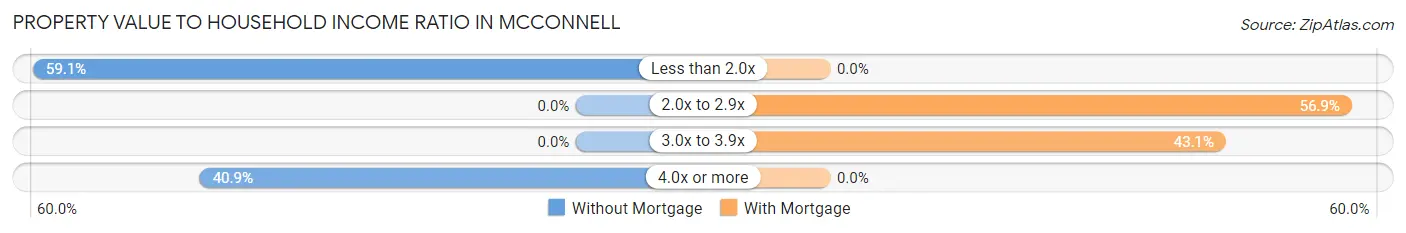
| Value-to-Income Ratio | Without Mortgage | With Mortgage |
| Less than 2.0x | 104 (59.1%) | 0 (0.0%) |
| 2.0x to 2.9x | 0 (0.0%) | 29 (56.9%) |
| 3.0x to 3.9x | 0 (0.0%) | 22 (43.1%) |
| 4.0x or more | 72 (40.9%) | 0 (0.0%) |
| Total | 176 (100.0%) | 51 (100.0%) |
Real Estate Taxes by Mortgage Status in McConnell
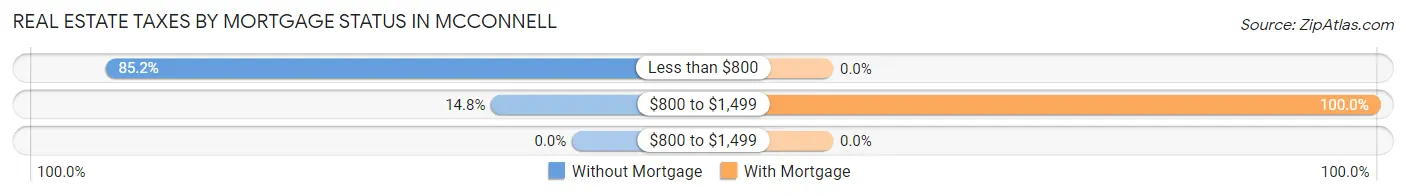
| Property Taxes | Without Mortgage | With Mortgage |
| Less than $800 | 150 (85.2%) | 0 (0.0%) |
| $800 to $1,499 | 26 (14.8%) | 51 (100.0%) |
| $800 to $1,499 | 0 (0.0%) | 0 (0.0%) |
| Total | 176 (100.0%) | 51 (100.0%) |
Health & Disability in McConnell
Health Insurance Coverage by Age in McConnell
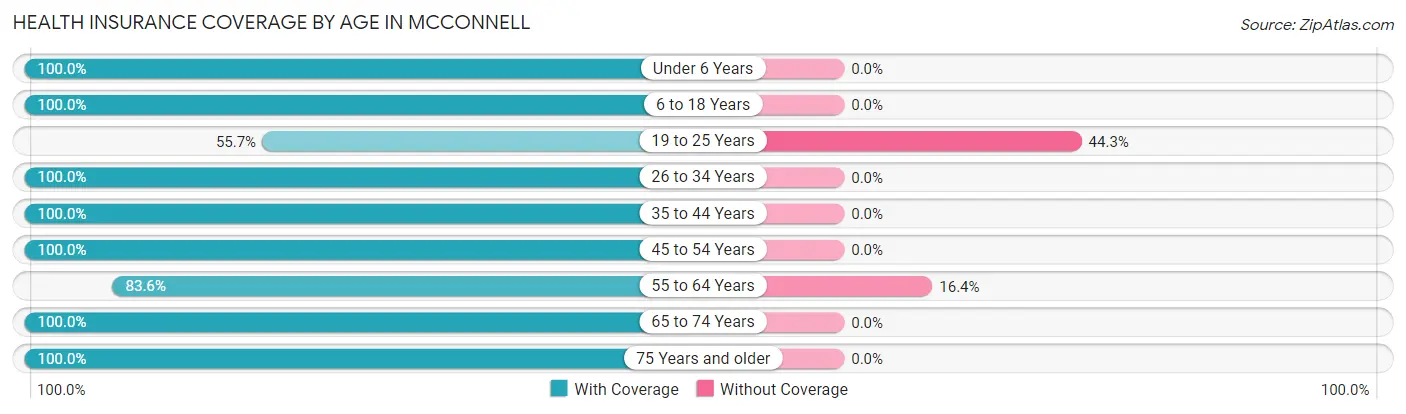
| Age Bracket | With Coverage | Without Coverage |
| Under 6 Years | 162 (100.0%) | 0 (0.0%) |
| 6 to 18 Years | 164 (100.0%) | 0 (0.0%) |
| 19 to 25 Years | 34 (55.7%) | 27 (44.3%) |
| 26 to 34 Years | 31 (100.0%) | 0 (0.0%) |
| 35 to 44 Years | 43 (100.0%) | 0 (0.0%) |
| 45 to 54 Years | 143 (100.0%) | 0 (0.0%) |
| 55 to 64 Years | 112 (83.6%) | 22 (16.4%) |
| 65 to 74 Years | 85 (100.0%) | 0 (0.0%) |
| 75 Years and older | 76 (100.0%) | 0 (0.0%) |
| Total | 850 (94.6%) | 49 (5.4%) |
Health Insurance Coverage by Citizenship Status in McConnell
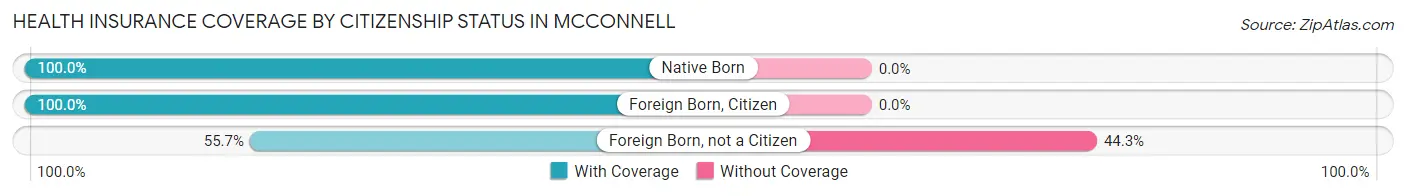
| Citizenship Status | With Coverage | Without Coverage |
| Native Born | 162 (100.0%) | 0 (0.0%) |
| Foreign Born, Citizen | 164 (100.0%) | 0 (0.0%) |
| Foreign Born, not a Citizen | 34 (55.7%) | 27 (44.3%) |
Health Insurance Coverage by Household Income in McConnell
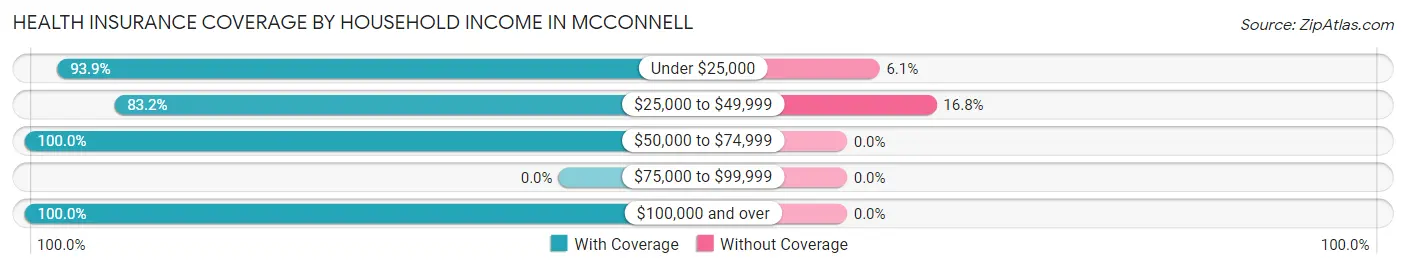
| Household Income | With Coverage | Without Coverage |
| Under $25,000 | 414 (93.9%) | 27 (6.1%) |
| $25,000 to $49,999 | 109 (83.2%) | 22 (16.8%) |
| $50,000 to $74,999 | 85 (100.0%) | 0 (0.0%) |
| $75,000 to $99,999 | 0 (0.0%) | 0 (0.0%) |
| $100,000 and over | 242 (100.0%) | 0 (0.0%) |
Public vs Private Health Insurance Coverage by Age in McConnell
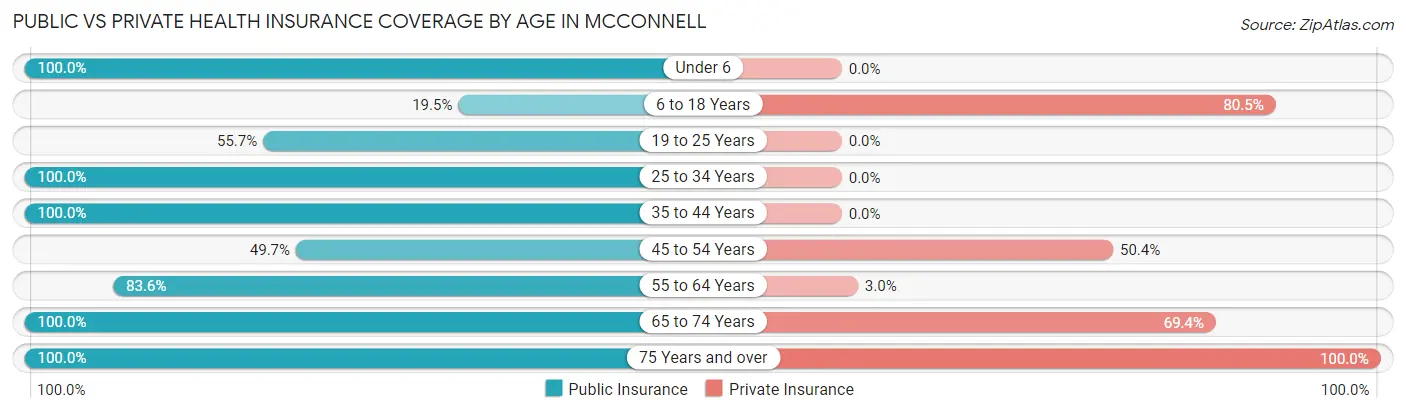
| Age Bracket | Public Insurance | Private Insurance |
| Under 6 | 162 (100.0%) | 0 (0.0%) |
| 6 to 18 Years | 32 (19.5%) | 132 (80.5%) |
| 19 to 25 Years | 34 (55.7%) | 0 (0.0%) |
| 25 to 34 Years | 31 (100.0%) | 0 (0.0%) |
| 35 to 44 Years | 43 (100.0%) | 0 (0.0%) |
| 45 to 54 Years | 71 (49.6%) | 72 (50.3%) |
| 55 to 64 Years | 112 (83.6%) | 4 (3.0%) |
| 65 to 74 Years | 85 (100.0%) | 59 (69.4%) |
| 75 Years and over | 76 (100.0%) | 76 (100.0%) |
| Total | 646 (71.9%) | 343 (38.2%) |
Disability Status by Sex by Age in McConnell
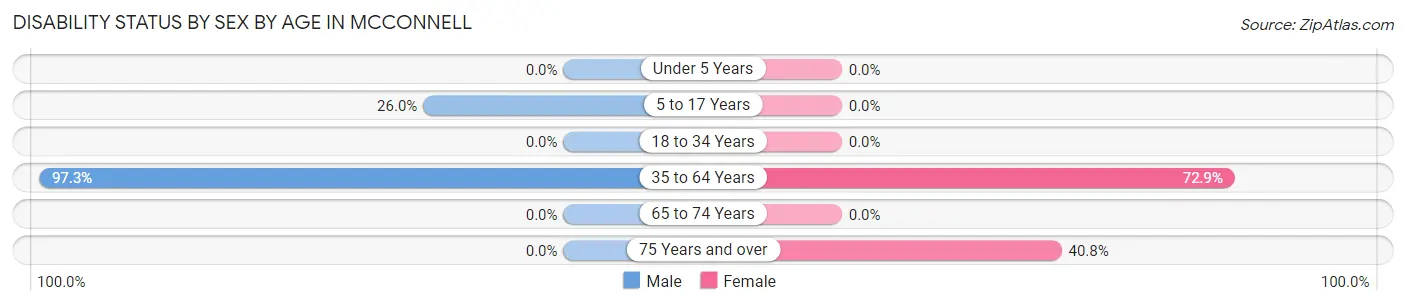
| Age Bracket | Male | Female |
| Under 5 Years | 0 (0.0%) | 0 (0.0%) |
| 5 to 17 Years | 32 (26.0%) | 0 (0.0%) |
| 18 to 34 Years | 0 (0.0%) | 0 (0.0%) |
| 35 to 64 Years | 146 (97.3%) | 124 (72.9%) |
| 65 to 74 Years | 0 (0.0%) | 0 (0.0%) |
| 75 Years and over | 0 (0.0%) | 31 (40.8%) |
Disability Class by Sex by Age in McConnell
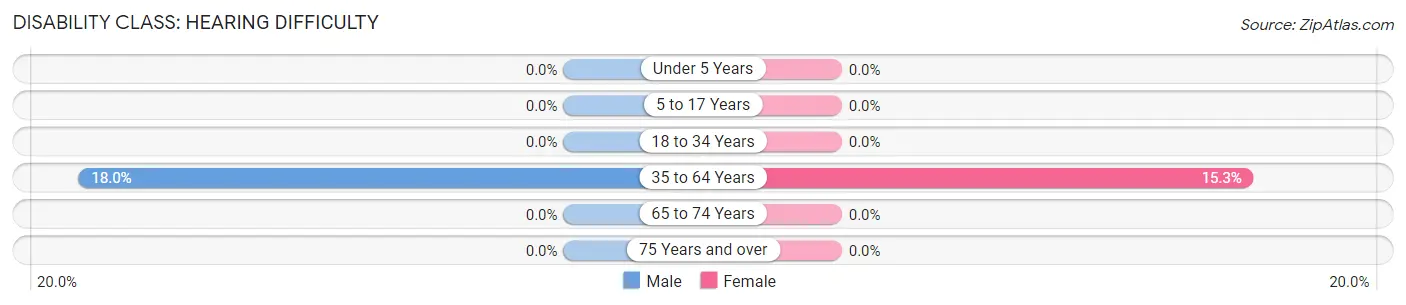
Disability Class: Hearing Difficulty
| Age Bracket | Male | Female |
| Under 5 Years | 0 (0.0%) | 0 (0.0%) |
| 5 to 17 Years | 0 (0.0%) | 0 (0.0%) |
| 18 to 34 Years | 0 (0.0%) | 0 (0.0%) |
| 35 to 64 Years | 27 (18.0%) | 26 (15.3%) |
| 65 to 74 Years | 0 (0.0%) | 0 (0.0%) |
| 75 Years and over | 0 (0.0%) | 0 (0.0%) |
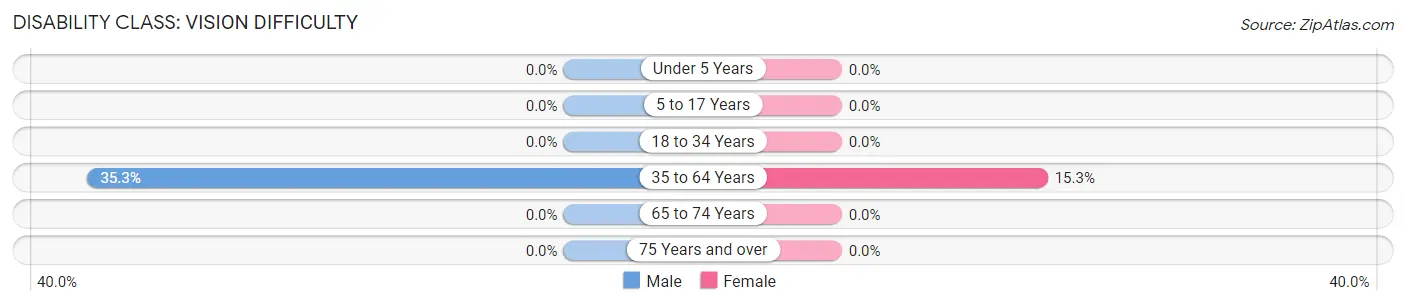
Disability Class: Vision Difficulty
| Age Bracket | Male | Female |
| Under 5 Years | 0 (0.0%) | 0 (0.0%) |
| 5 to 17 Years | 0 (0.0%) | 0 (0.0%) |
| 18 to 34 Years | 0 (0.0%) | 0 (0.0%) |
| 35 to 64 Years | 53 (35.3%) | 26 (15.3%) |
| 65 to 74 Years | 0 (0.0%) | 0 (0.0%) |
| 75 Years and over | 0 (0.0%) | 0 (0.0%) |
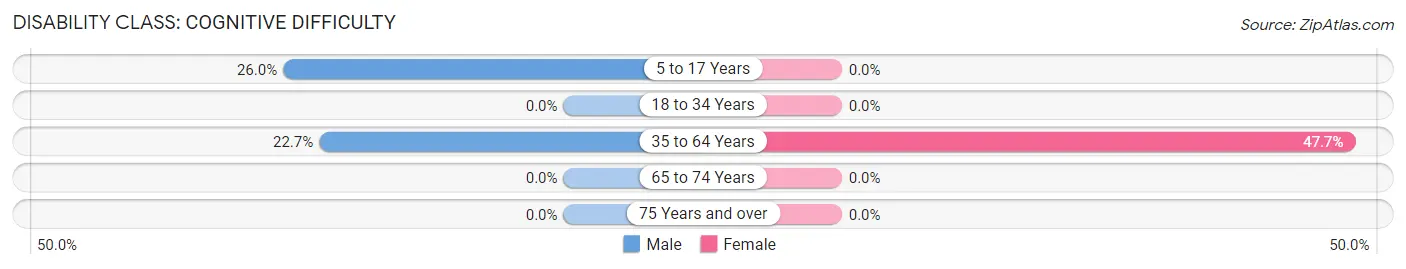
Disability Class: Cognitive Difficulty
| Age Bracket | Male | Female |
| 5 to 17 Years | 32 (26.0%) | 0 (0.0%) |
| 18 to 34 Years | 0 (0.0%) | 0 (0.0%) |
| 35 to 64 Years | 34 (22.7%) | 81 (47.6%) |
| 65 to 74 Years | 0 (0.0%) | 0 (0.0%) |
| 75 Years and over | 0 (0.0%) | 0 (0.0%) |
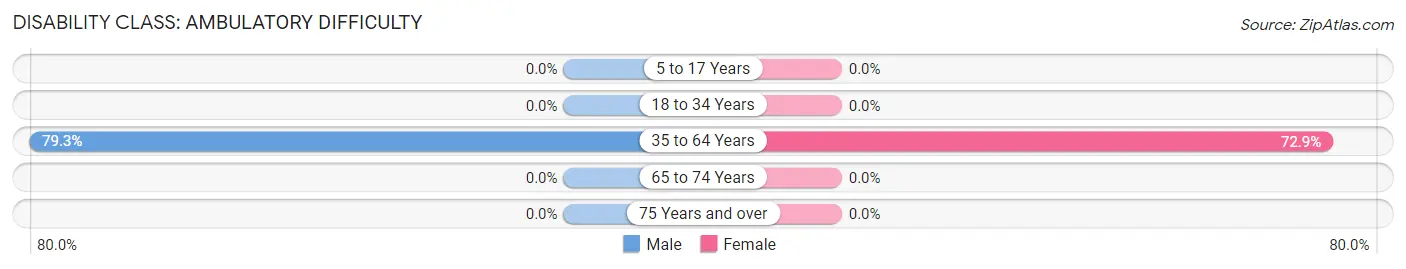
Disability Class: Ambulatory Difficulty
| Age Bracket | Male | Female |
| 5 to 17 Years | 0 (0.0%) | 0 (0.0%) |
| 18 to 34 Years | 0 (0.0%) | 0 (0.0%) |
| 35 to 64 Years | 119 (79.3%) | 124 (72.9%) |
| 65 to 74 Years | 0 (0.0%) | 0 (0.0%) |
| 75 Years and over | 0 (0.0%) | 0 (0.0%) |
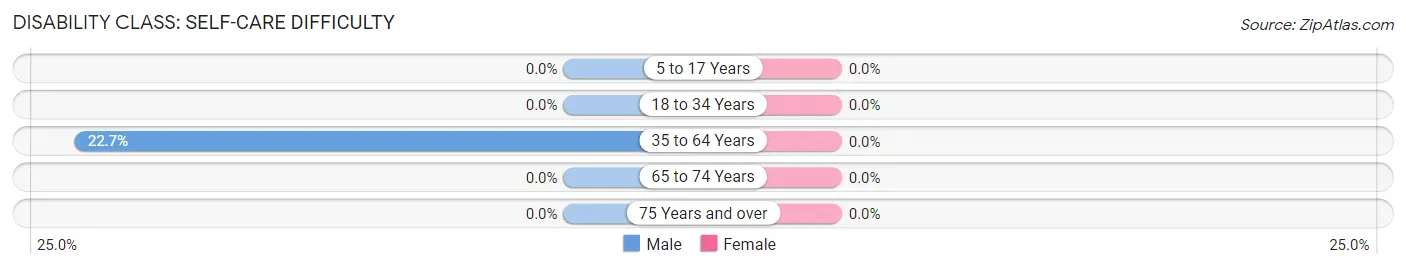
Disability Class: Self-Care Difficulty
| Age Bracket | Male | Female |
| 5 to 17 Years | 0 (0.0%) | 0 (0.0%) |
| 18 to 34 Years | 0 (0.0%) | 0 (0.0%) |
| 35 to 64 Years | 34 (22.7%) | 0 (0.0%) |
| 65 to 74 Years | 0 (0.0%) | 0 (0.0%) |
| 75 Years and over | 0 (0.0%) | 0 (0.0%) |
Technology Access in McConnell
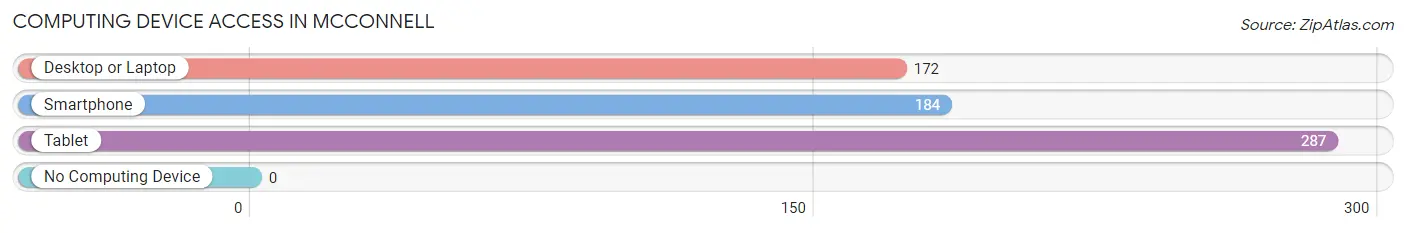
Computing Device Access in McConnell
| Device Type | # Households | % Households |
| Desktop or Laptop | 172 | 59.9% |
| Smartphone | 184 | 64.1% |
| Tablet | 287 | 100.0% |
| No Computing Device | 0 | 0.0% |
| Total | 287 | 100.0% |
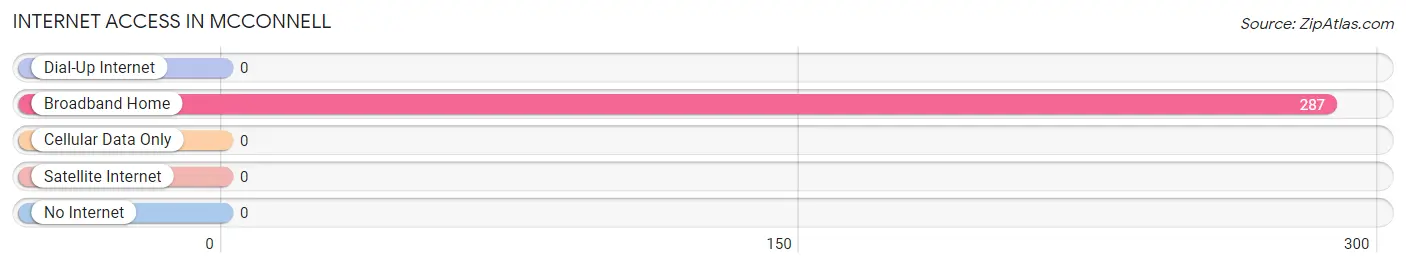
Internet Access in McConnell
| Internet Type | # Households | % Households |
| Dial-Up Internet | 0 | 0.0% |
| Broadband Home | 287 | 100.0% |
| Cellular Data Only | 0 | 0.0% |
| Satellite Internet | 0 | 0.0% |
| No Internet | 0 | 0.0% |
| Total | 287 | 100.0% |
McConnell Summary
Mcconnell is a small unincorporated community located in the northern part of Harrison County, West Virginia. It is situated along the banks of the West Fork River, and is surrounded by the towns of Bridgeport, Clarksburg, and Shinnston. The population of Mcconnell was estimated to be around 200 people in 2020.
History
Mcconnell was first settled in the early 1800s by a group of settlers from Pennsylvania. The town was named after the McConnell family, who were among the first settlers. The town was originally known as McConnellsville, but the name was later shortened to Mcconnell.
The town was an important stop on the Baltimore and Ohio Railroad, which ran through the area in the late 1800s. The railroad brought many new people to the area, and the town grew rapidly. By the early 1900s, Mcconnell had become a thriving community with a variety of businesses, including a hotel, a general store, a post office, and a blacksmith shop.
Geography
Mcconnell is located in the northern part of Harrison County, West Virginia. It is situated along the banks of the West Fork River, and is surrounded by the towns of Bridgeport, Clarksburg, and Shinnston. The town is located at an elevation of 890 feet above sea level.
The climate in Mcconnell is classified as humid continental, with hot summers and cold winters. The average annual temperature is around 50 degrees Fahrenheit, and the average annual precipitation is around 40 inches.
Economy
Mcconnell is a small, rural community with a limited economy. The town is home to a few small businesses, including a general store, a post office, and a few restaurants. The town also has a few small manufacturing businesses, such as a furniture factory and a woodworking shop.
The town is also home to a few farms, which produce a variety of crops, including corn, soybeans, and hay. The town also has a few small coal mines, which provide employment for some of the residents.
Demographics
The population of Mcconnell was estimated to be around 200 people in 2020. The town is predominantly white, with a small minority population. The median household income in Mcconnell is around $30,000, and the median home value is around $90,000.
The town is served by the Harrison County School District, which provides education for the town's children. The town also has a few churches, including the Mcconnell United Methodist Church and the Mcconnell Baptist Church.
Conclusion
Mcconnell is a small, rural community located in the northern part of Harrison County, West Virginia. The town has a long history, and was once an important stop on the Baltimore and Ohio Railroad. The town has a limited economy, and is home to a few small businesses and farms. The population of Mcconnell is estimated to be around 200 people, and the town is predominantly white. The town is served by the Harrison County School District, and has a few churches.
Common Questions
What is the Total Population of McConnell?
Total Population of McConnell is 899.
What is the Total Male Population of McConnell?
Total Male Population of McConnell is 453.
What is the Total Female Population of McConnell?
Total Female Population of McConnell is 446.
What is the Ratio of Males per 100 Females in McConnell?
There are 101.57 Males per 100 Females in McConnell.
What is the Ratio of Females per 100 Males in McConnell?
There are 98.45 Females per 100 Males in McConnell.
What is the Median Population Age in McConnell?
Median Population Age in McConnell is 43.7 Years.
What is the Average Family Size in McConnell
Average Family Size in McConnell is 4.1 People.
What is the Average Household Size in McConnell
Average Household Size in McConnell is 3.1 People.
What is Per Capita Income in McConnell?
Per Capita income in McConnell is $25,495.
What is the Median Family Income in McConnell?
Median Family Income in McConnell is $26,620.
What is the Median Household income in McConnell?
Median Household Income in McConnell is $26,991.
What is Inequality or Gini Index in McConnell?
Inequality or Gini Index in McConnell is 0.61.
How Large is the Labor Force in McConnell?
There are 173 People in the Labor Forcein in McConnell.
What is the Percentage of People in the Labor Force in McConnell?
26.0% of People are in the Labor Force in McConnell.
What is the Unemployment Rate in McConnell?
Unemployment Rate in McConnell is 58.4%.