Hartford City, WV
Hartford City Map
Hartford City Overview
586
TOTAL POPULATION
306
MALE POPULATION
280
FEMALE POPULATION
109.29
MALES / 100 FEMALES
91.50
FEMALES / 100 MALES
46.8
MEDIAN AGE
2.9
AVG FAMILY SIZE
2.4
AVG HOUSEHOLD SIZE
$23,727
PER CAPITA INCOME
$55,526
AVG FAMILY INCOME
$50,114
AVG HOUSEHOLD INCOME
0.37
INEQUALITY / GINI INDEX
234
LABOR FORCE [ PEOPLE ]
50.0%
PERCENT IN LABOR FORCE
2.6%
UNEMPLOYMENT RATE
Hartford City Area Codes
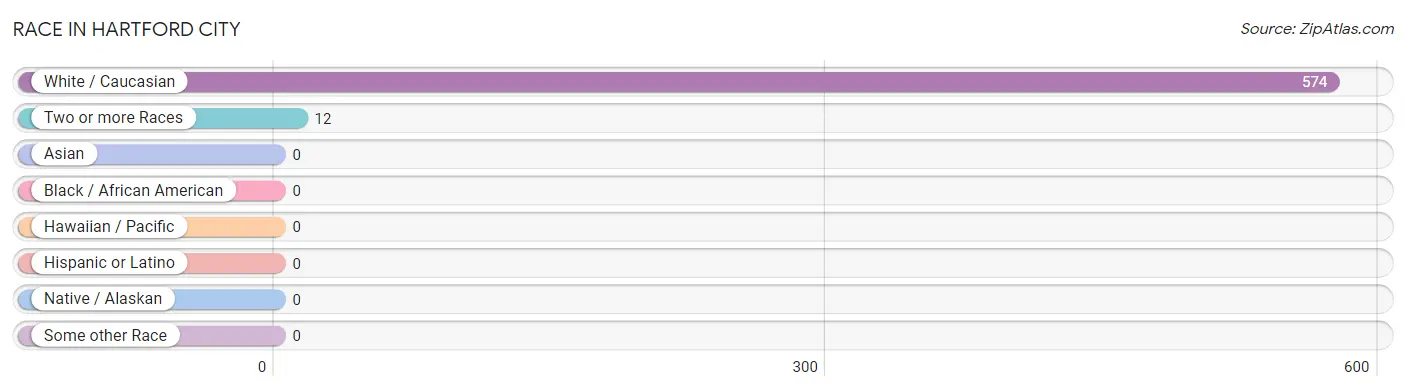
Race in Hartford City
The most populous races in Hartford City are White / Caucasian (574 | 98.0%), and Two or more Races (12 | 2.1%).
| Race | # Population | % Population |
| Asian | 0 | 0.0% |
| Black / African American | 0 | 0.0% |
| Hawaiian / Pacific | 0 | 0.0% |
| Hispanic or Latino | 0 | 0.0% |
| Native / Alaskan | 0 | 0.0% |
| White / Caucasian | 574 | 98.0% |
| Two or more Races | 12 | 2.1% |
| Some other Race | 0 | 0.0% |
| Total | 586 | 100.0% |
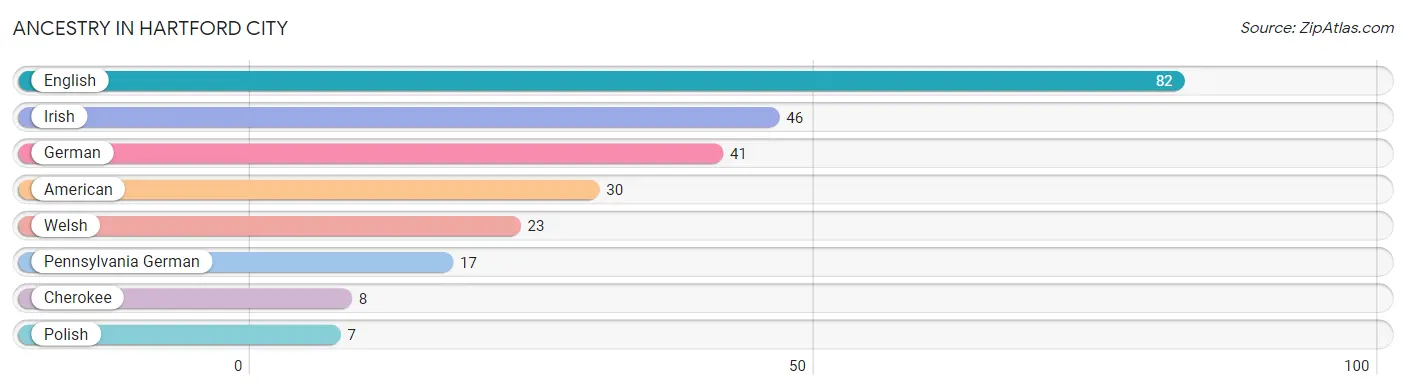
Ancestry in Hartford City
The most populous ancestries reported in Hartford City are English (82 | 14.0%), Irish (46 | 7.9%), German (41 | 7.0%), American (30 | 5.1%), and Welsh (23 | 3.9%), together accounting for 37.9% of all Hartford City residents.
| Ancestry | # Population | % Population |
| American | 30 | 5.1% |
| Cherokee | 8 | 1.4% |
| English | 82 | 14.0% |
| German | 41 | 7.0% |
| Irish | 46 | 7.9% |
| Pennsylvania German | 17 | 2.9% |
| Polish | 7 | 1.2% |
| Welsh | 23 | 3.9% | View All 8 Rows |
Immigrants in Hartford City

| Immigration Origin | # Population | % Population | View All 0 Rows |
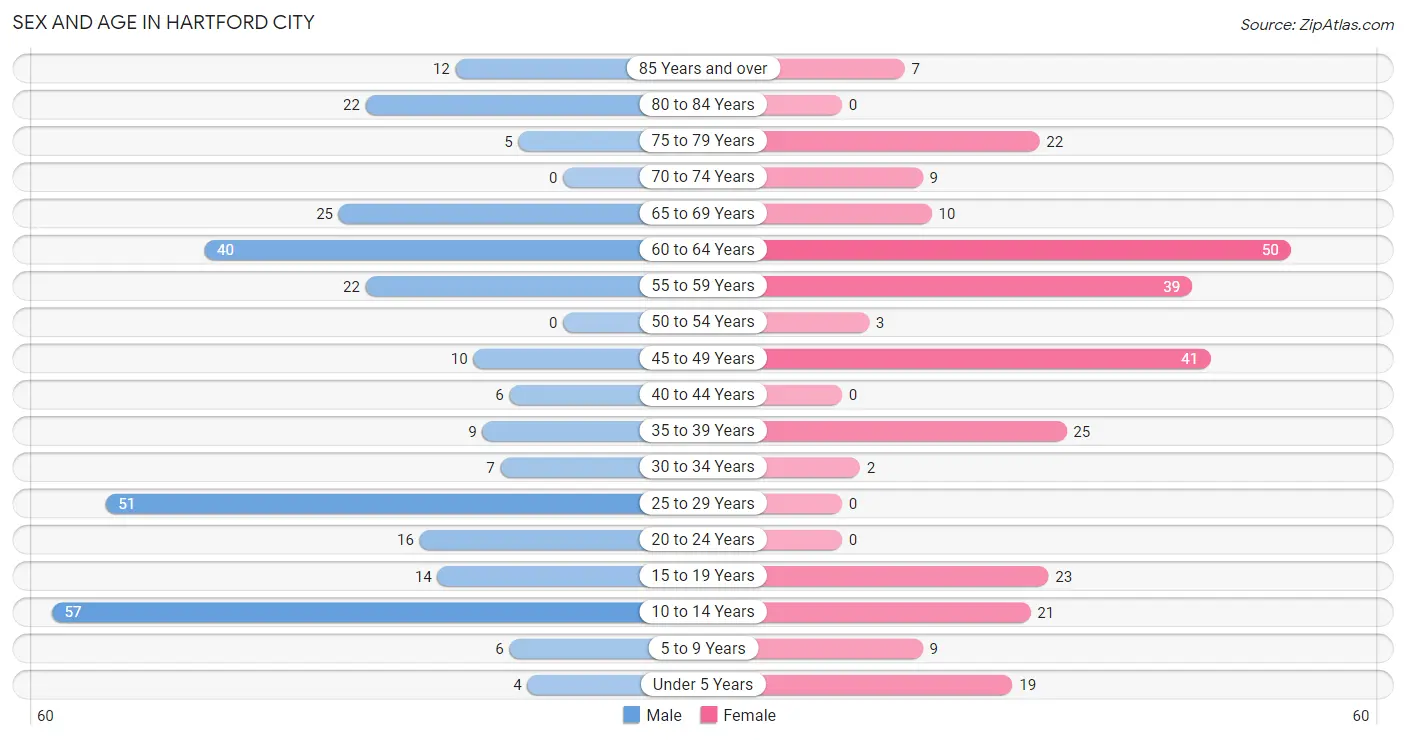
Sex and Age in Hartford City
Sex and Age in Hartford City
The most populous age groups in Hartford City are 10 to 14 Years (57 | 18.6%) for men and 60 to 64 Years (50 | 17.9%) for women.
| Age Bracket | Male | Female |
| Under 5 Years | 4 (1.3%) | 19 (6.8%) |
| 5 to 9 Years | 6 (2.0%) | 9 (3.2%) |
| 10 to 14 Years | 57 (18.6%) | 21 (7.5%) |
| 15 to 19 Years | 14 (4.6%) | 23 (8.2%) |
| 20 to 24 Years | 16 (5.2%) | 0 (0.0%) |
| 25 to 29 Years | 51 (16.7%) | 0 (0.0%) |
| 30 to 34 Years | 7 (2.3%) | 2 (0.7%) |
| 35 to 39 Years | 9 (2.9%) | 25 (8.9%) |
| 40 to 44 Years | 6 (2.0%) | 0 (0.0%) |
| 45 to 49 Years | 10 (3.3%) | 41 (14.6%) |
| 50 to 54 Years | 0 (0.0%) | 3 (1.1%) |
| 55 to 59 Years | 22 (7.2%) | 39 (13.9%) |
| 60 to 64 Years | 40 (13.1%) | 50 (17.9%) |
| 65 to 69 Years | 25 (8.2%) | 10 (3.6%) |
| 70 to 74 Years | 0 (0.0%) | 9 (3.2%) |
| 75 to 79 Years | 5 (1.6%) | 22 (7.9%) |
| 80 to 84 Years | 22 (7.2%) | 0 (0.0%) |
| 85 Years and over | 12 (3.9%) | 7 (2.5%) |
| Total | 306 (100.0%) | 280 (100.0%) |
Families and Households in Hartford City
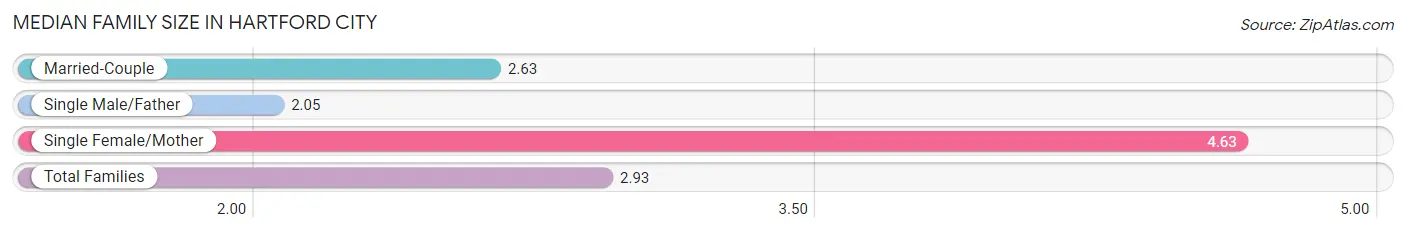
Median Family Size in Hartford City
The median family size in Hartford City is 2.93 persons per family, with single female/mother families (32 | 18.8%) accounting for the largest median family size of 4.63 persons per family. On the other hand, single male/father families (22 | 12.9%) represent the smallest median family size with 2.05 persons per family.
| Family Type | # Families | Family Size |
| Married-Couple | 116 (68.2%) | 2.63 |
| Single Male/Father | 22 (12.9%) | 2.05 |
| Single Female/Mother | 32 (18.8%) | 4.63 |
| Total Families | 170 (100.0%) | 2.93 |
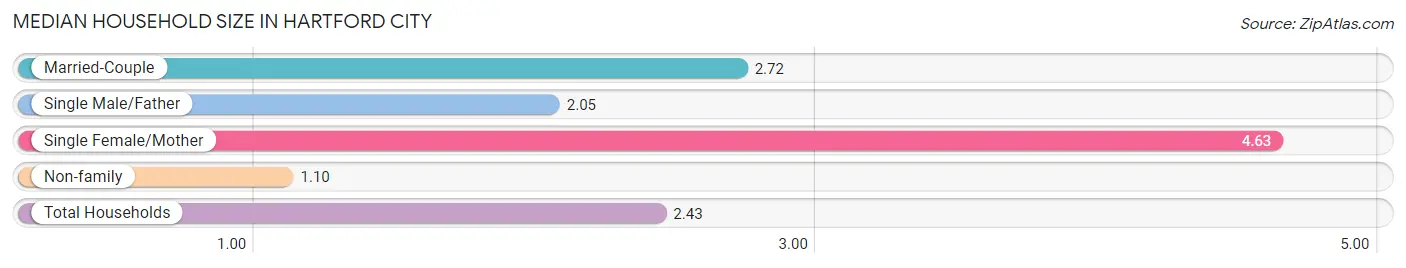
Median Household Size in Hartford City
The median household size in Hartford City is 2.43 persons per household, with single female/mother households (32 | 13.3%) accounting for the largest median household size of 4.63 persons per household. non-family households (71 | 29.5%) represent the smallest median household size with 1.10 persons per household.
| Household Type | # Households | Household Size |
| Married-Couple | 116 (48.1%) | 2.72 |
| Single Male/Father | 22 (9.1%) | 2.05 |
| Single Female/Mother | 32 (13.3%) | 4.63 |
| Non-family | 71 (29.5%) | 1.10 |
| Total Households | 241 (100.0%) | 2.43 |
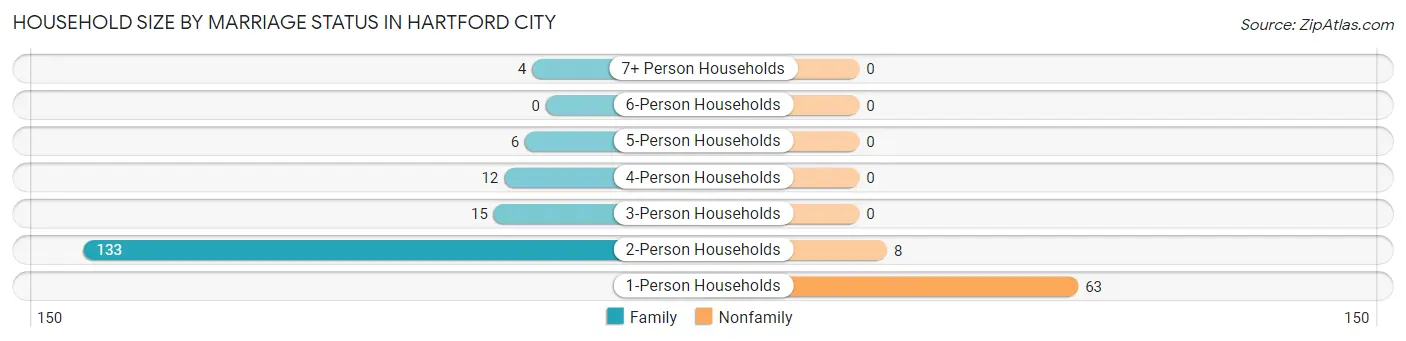
Household Size by Marriage Status in Hartford City
Out of a total of 241 households in Hartford City, 170 (70.5%) are family households, while 71 (29.5%) are nonfamily households. The most numerous type of family households are 2-person households, comprising 133, and the most common type of nonfamily households are 1-person households, comprising 63.
| Household Size | Family Households | Nonfamily Households |
| 1-Person Households | - | 63 (26.1%) |
| 2-Person Households | 133 (55.2%) | 8 (3.3%) |
| 3-Person Households | 15 (6.2%) | 0 (0.0%) |
| 4-Person Households | 12 (5.0%) | 0 (0.0%) |
| 5-Person Households | 6 (2.5%) | 0 (0.0%) |
| 6-Person Households | 0 (0.0%) | 0 (0.0%) |
| 7+ Person Households | 4 (1.7%) | 0 (0.0%) |
| Total | 170 (70.5%) | 71 (29.5%) |
Female Fertility in Hartford City
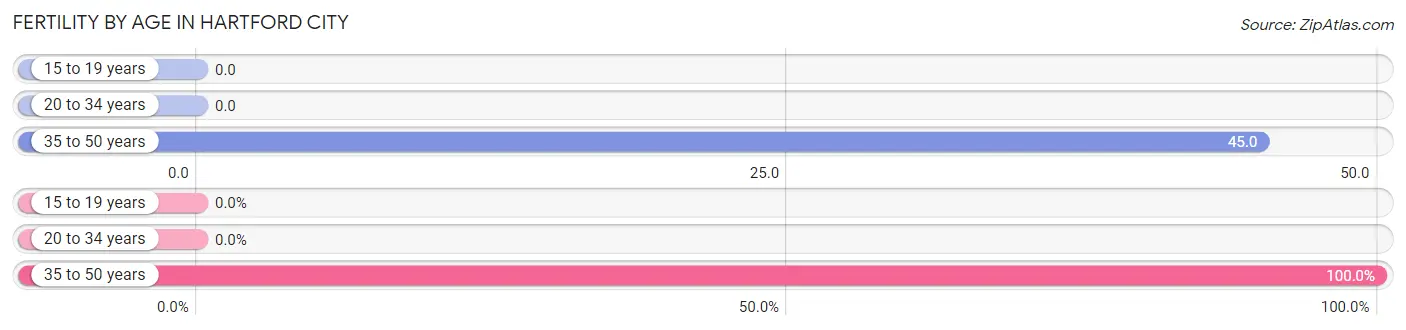
Fertility by Age in Hartford City
Average fertility rate in Hartford City is 33.0 births per 1,000 women. Women in the age bracket of 35 to 50 years have the highest fertility rate with 45.0 births per 1,000 women. Women in the age bracket of 35 to 50 years acount for 100.0% of all women with births.
| Age Bracket | Women with Births | Births / 1,000 Women |
| 15 to 19 years | 0 (0.0%) | 0.0 |
| 20 to 34 years | 0 (0.0%) | 0.0 |
| 35 to 50 years | 3 (100.0%) | 45.0 |
| Total | 3 (100.0%) | 33.0 |
Fertility by Age by Marriage Status in Hartford City
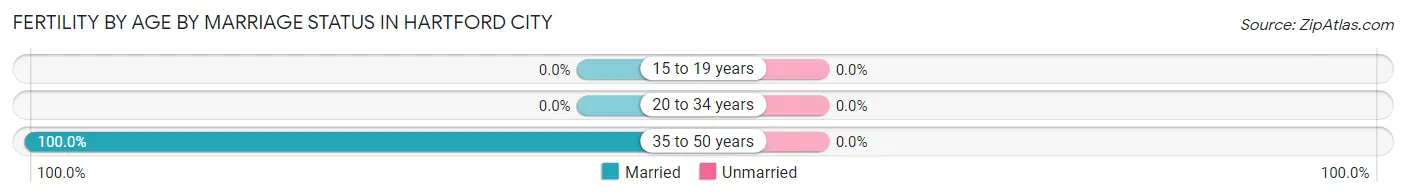
| Age Bracket | Married | Unmarried |
| 15 to 19 years | 0 (0.0%) | 0 (0.0%) |
| 20 to 34 years | 0 (0.0%) | 0 (0.0%) |
| 35 to 50 years | 3 (100.0%) | 0 (0.0%) |
| Total | 3 (100.0%) | 0 (0.0%) |
Fertility by Education in Hartford City
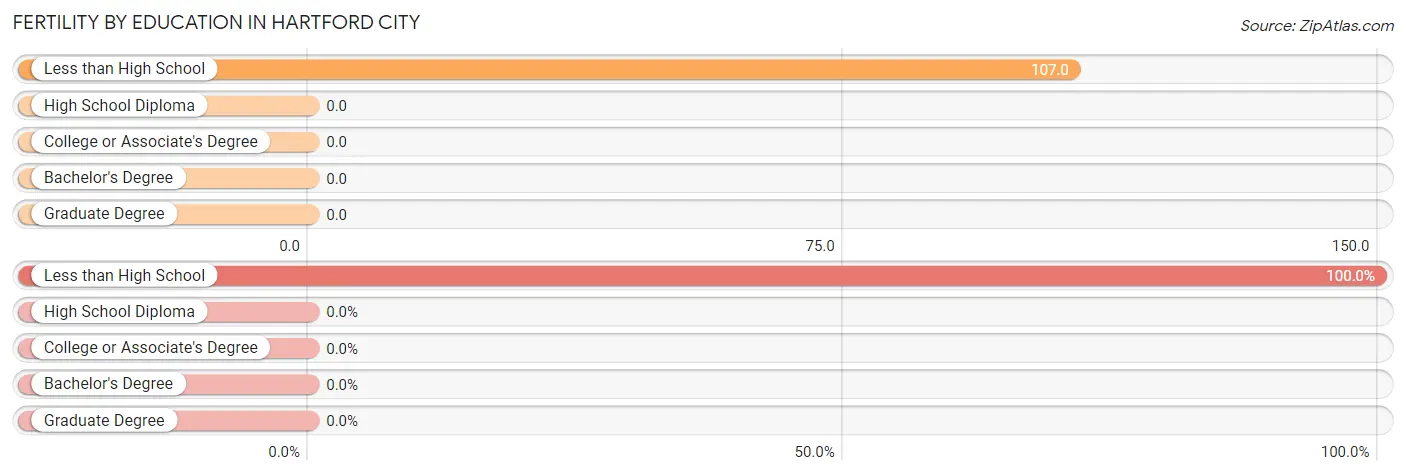
| Educational Attainment | Women with Births | Births / 1,000 Women |
| Less than High School | 3 (100.0%) | 107.0 |
| High School Diploma | 0 (0.0%) | 0.0 |
| College or Associate's Degree | 0 (0.0%) | 0.0 |
| Bachelor's Degree | 0 (0.0%) | 0.0 |
| Graduate Degree | 0 (0.0%) | 0.0 |
| Total | 3 (100.0%) | 33.0 |
Fertility by Education by Marriage Status in Hartford City
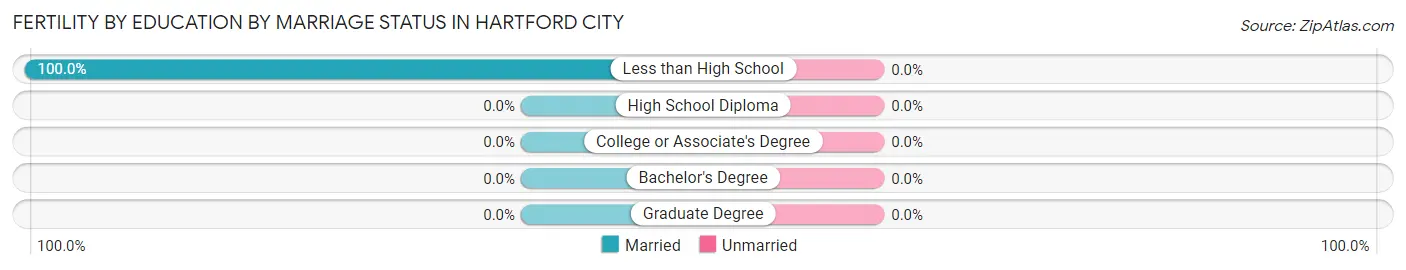
| Educational Attainment | Married | Unmarried |
| Less than High School | 3 (100.0%) | 0 (0.0%) |
| High School Diploma | 0 (0.0%) | 0 (0.0%) |
| College or Associate's Degree | 0 (0.0%) | 0 (0.0%) |
| Bachelor's Degree | 0 (0.0%) | 0 (0.0%) |
| Graduate Degree | 0 (0.0%) | 0 (0.0%) |
| Total | 3 (100.0%) | 0 (0.0%) |
Income in Hartford City
Income Overview in Hartford City
Per Capita Income in Hartford City is $23,727, while median incomes of families and households are $55,526 and $50,114 respectively.
| Characteristic | Number | Measure |
| Per Capita Income | 586 | $23,727 |
| Median Family Income | 170 | $55,526 |
| Mean Family Income | 170 | $60,481 |
| Median Household Income | 241 | $50,114 |
| Mean Household Income | 241 | $54,969 |
| Income Deficit | 170 | $0 |
| Wage / Income Gap (%) | 586 | 0.00% |
| Wage / Income Gap ($) | 586 | 100.00¢ per $1 |
| Gini / Inequality Index | 586 | 0.37 |
Earnings by Sex in Hartford City
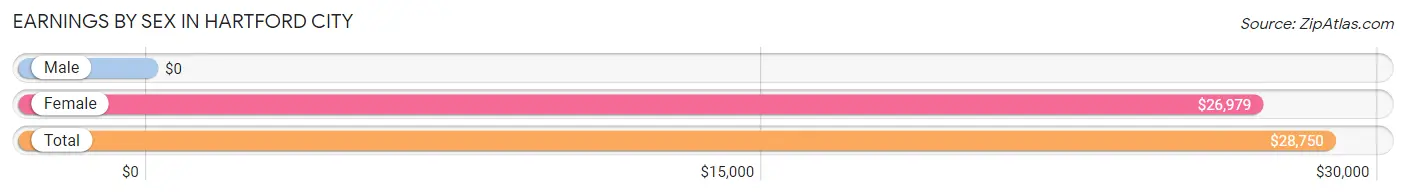
| Sex | Number | Average Earnings |
| Male | 145 (62.0%) | $0 |
| Female | 89 (38.0%) | $26,979 |
| Total | 234 (100.0%) | $28,750 |
Earnings by Sex by Income Bracket in Hartford City
The most common earnings brackets in Hartford City are $55,000 to $64,999 for men (32 | 22.1%) and $25,000 to $29,999 for women (20 | 22.5%).
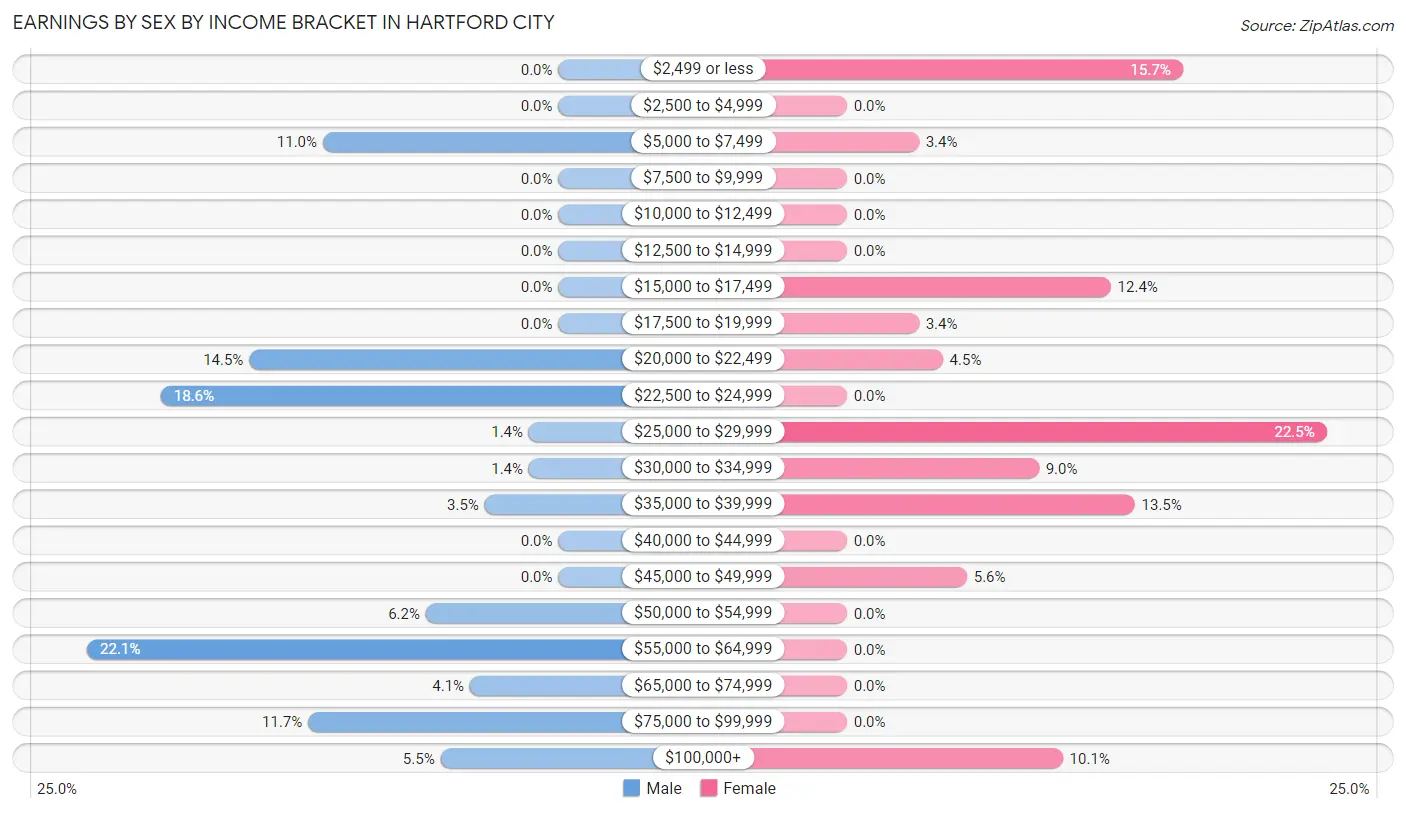
| Income | Male | Female |
| $2,499 or less | 0 (0.0%) | 14 (15.7%) |
| $2,500 to $4,999 | 0 (0.0%) | 0 (0.0%) |
| $5,000 to $7,499 | 16 (11.0%) | 3 (3.4%) |
| $7,500 to $9,999 | 0 (0.0%) | 0 (0.0%) |
| $10,000 to $12,499 | 0 (0.0%) | 0 (0.0%) |
| $12,500 to $14,999 | 0 (0.0%) | 0 (0.0%) |
| $15,000 to $17,499 | 0 (0.0%) | 11 (12.4%) |
| $17,500 to $19,999 | 0 (0.0%) | 3 (3.4%) |
| $20,000 to $22,499 | 21 (14.5%) | 4 (4.5%) |
| $22,500 to $24,999 | 27 (18.6%) | 0 (0.0%) |
| $25,000 to $29,999 | 2 (1.4%) | 20 (22.5%) |
| $30,000 to $34,999 | 2 (1.4%) | 8 (9.0%) |
| $35,000 to $39,999 | 5 (3.5%) | 12 (13.5%) |
| $40,000 to $44,999 | 0 (0.0%) | 0 (0.0%) |
| $45,000 to $49,999 | 0 (0.0%) | 5 (5.6%) |
| $50,000 to $54,999 | 9 (6.2%) | 0 (0.0%) |
| $55,000 to $64,999 | 32 (22.1%) | 0 (0.0%) |
| $65,000 to $74,999 | 6 (4.1%) | 0 (0.0%) |
| $75,000 to $99,999 | 17 (11.7%) | 0 (0.0%) |
| $100,000+ | 8 (5.5%) | 9 (10.1%) |
| Total | 145 (100.0%) | 89 (100.0%) |
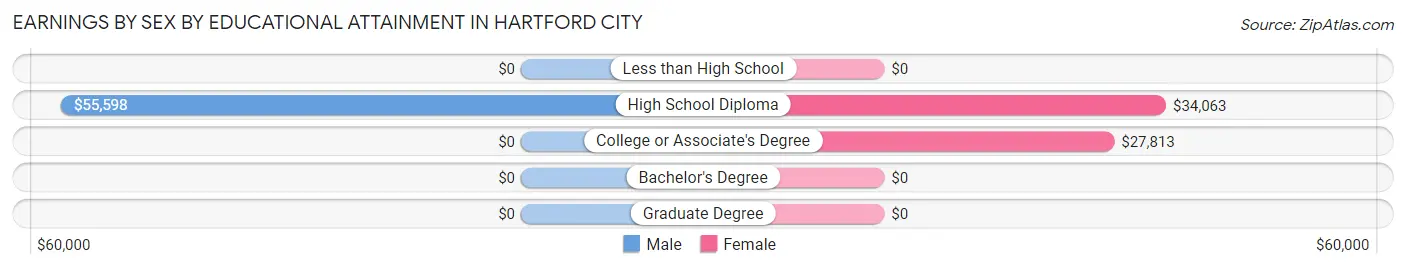
Earnings by Sex by Educational Attainment in Hartford City
Average earnings in Hartford City are $54,583 for men and $28,438 for women, a difference of 47.9%. Men with an educational attainment of high school diploma enjoy the highest average annual earnings of $55,598, while those with high school diploma education earn the least with $55,598. Women with an educational attainment of high school diploma earn the most with the average annual earnings of $34,063, while those with college or associate's degree education have the smallest earnings of $27,813.
| Educational Attainment | Male Income | Female Income |
| Less than High School | - | - |
| High School Diploma | $55,598 | $34,063 |
| College or Associate's Degree | - | - |
| Bachelor's Degree | - | - |
| Graduate Degree | - | - |
| Total | $54,583 | $28,438 |
Family Income in Hartford City
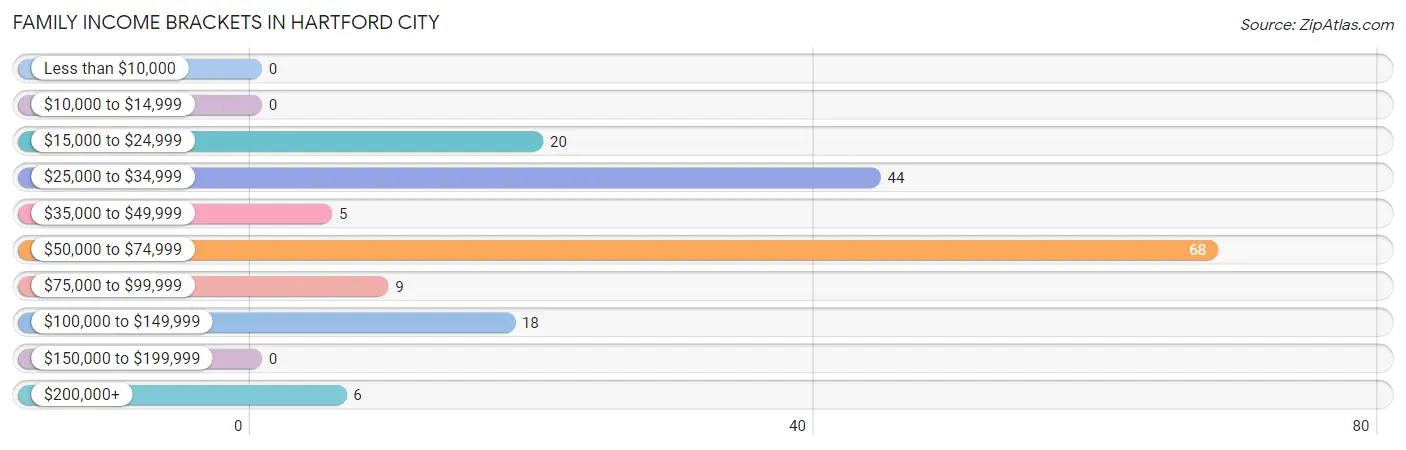
Family Income Brackets in Hartford City
According to the Hartford City family income data, there are 68 families falling into the $50,000 to $74,999 income range, which is the most common income bracket and makes up 40.0% of all families.
| Income Bracket | # Families | % Families |
| Less than $10,000 | 0 | 0.0% |
| $10,000 to $14,999 | 0 | 0.0% |
| $15,000 to $24,999 | 20 | 11.8% |
| $25,000 to $34,999 | 44 | 25.9% |
| $35,000 to $49,999 | 5 | 2.9% |
| $50,000 to $74,999 | 68 | 40.0% |
| $75,000 to $99,999 | 9 | 5.3% |
| $100,000 to $149,999 | 18 | 10.6% |
| $150,000 to $199,999 | 0 | 0.0% |
| $200,000+ | 6 | 3.5% |
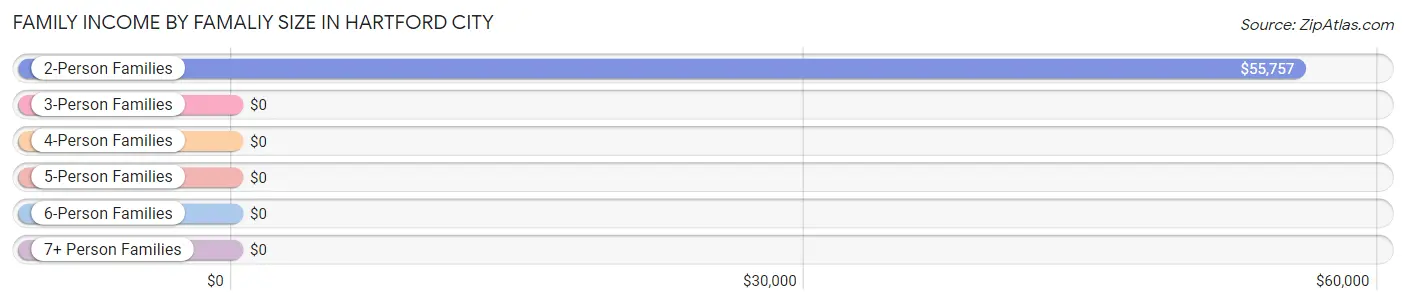
Family Income by Famaliy Size in Hartford City
2-person families (133 | 78.2%) account for the highest median family income in Hartford City with $55,757 per family, while 2-person families (133 | 78.2%) have the highest median income of $27,878 per family member.
| Income Bracket | # Families | Median Income |
| 2-Person Families | 133 (78.2%) | $55,757 |
| 3-Person Families | 15 (8.8%) | $0 |
| 4-Person Families | 18 (10.6%) | $0 |
| 5-Person Families | 0 (0.0%) | $0 |
| 6-Person Families | 0 (0.0%) | $0 |
| 7+ Person Families | 4 (2.4%) | $0 |
| Total | 170 (100.0%) | $55,526 |
Family Income by Number of Earners in Hartford City
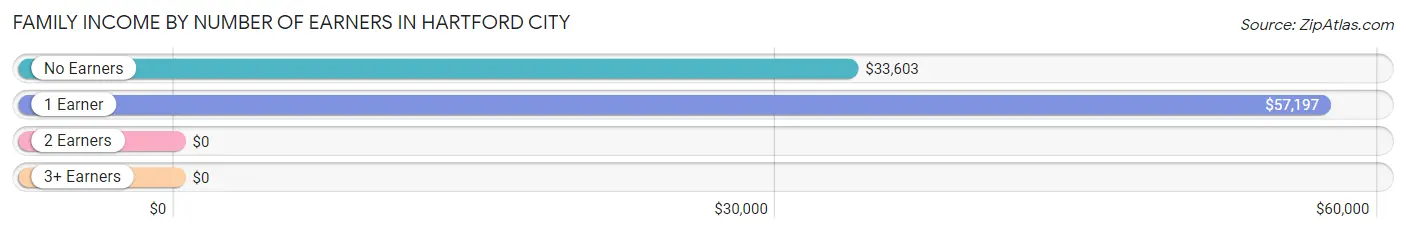
| Number of Earners | # Families | Median Income |
| No Earners | 39 (22.9%) | $33,603 |
| 1 Earner | 76 (44.7%) | $57,197 |
| 2 Earners | 55 (32.4%) | $0 |
| 3+ Earners | 0 (0.0%) | $0 |
| Total | 170 (100.0%) | $55,526 |
Household Income in Hartford City
Household Income Brackets in Hartford City
With 71 households falling in the category, the $50,000 to $74,999 income range is the most frequent in Hartford City, accounting for 29.5% of all households.
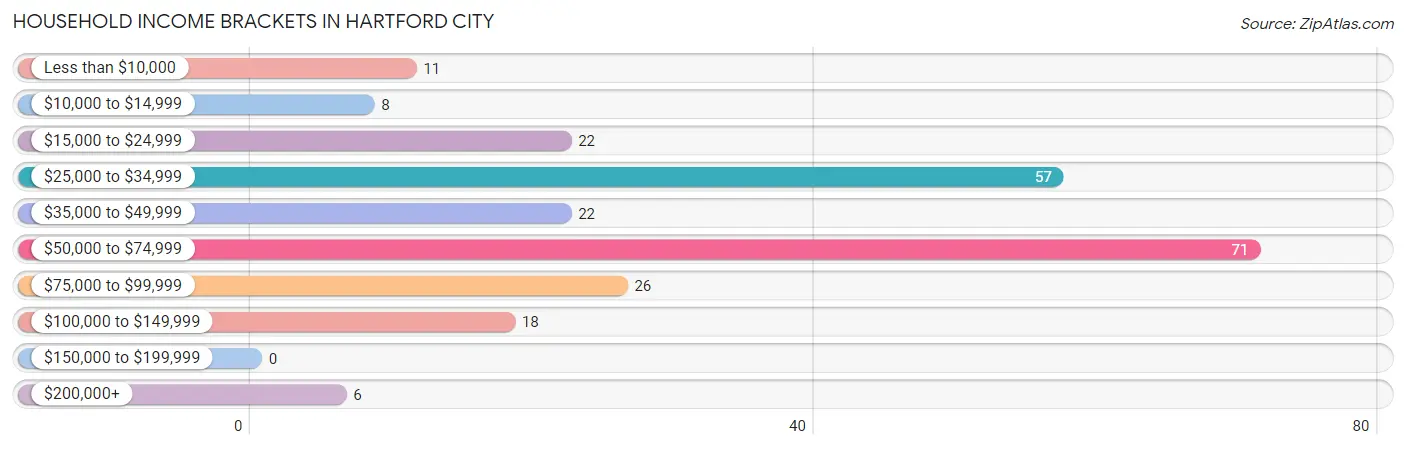
| Income Bracket | # Households | % Households |
| Less than $10,000 | 11 | 4.6% |
| $10,000 to $14,999 | 8 | 3.3% |
| $15,000 to $24,999 | 22 | 9.1% |
| $25,000 to $34,999 | 57 | 23.7% |
| $35,000 to $49,999 | 22 | 9.1% |
| $50,000 to $74,999 | 71 | 29.5% |
| $75,000 to $99,999 | 26 | 10.8% |
| $100,000 to $149,999 | 18 | 7.5% |
| $150,000 to $199,999 | 0 | 0.0% |
| $200,000+ | 6 | 2.5% |
Household Income by Householder Age in Hartford City
The median household income in Hartford City is $50,114, with the highest median household income of $56,136 found in the 45 to 64 years age bracket for the primary householder. A total of 86 households (35.7%) fall into this category.
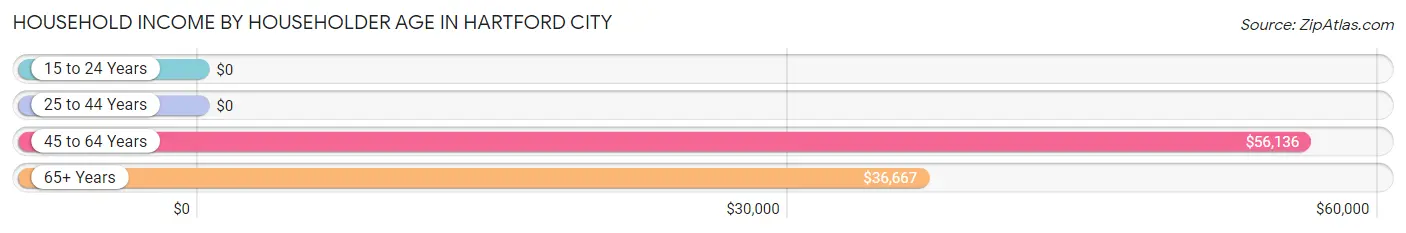
| Income Bracket | # Households | Median Income |
| 15 to 24 Years | 0 (0.0%) | $0 |
| 25 to 44 Years | 71 (29.5%) | $0 |
| 45 to 64 Years | 86 (35.7%) | $56,136 |
| 65+ Years | 84 (34.8%) | $36,667 |
| Total | 241 (100.0%) | $50,114 |
Poverty in Hartford City
Income Below Poverty by Sex and Age in Hartford City
With 10.1% poverty level for males and 22.9% for females among the residents of Hartford City, 6 to 11 year old males and 15 year old females are the most vulnerable to poverty, with 6 males (23.1%) and 2 females (100.0%) in their respective age groups living below the poverty level.
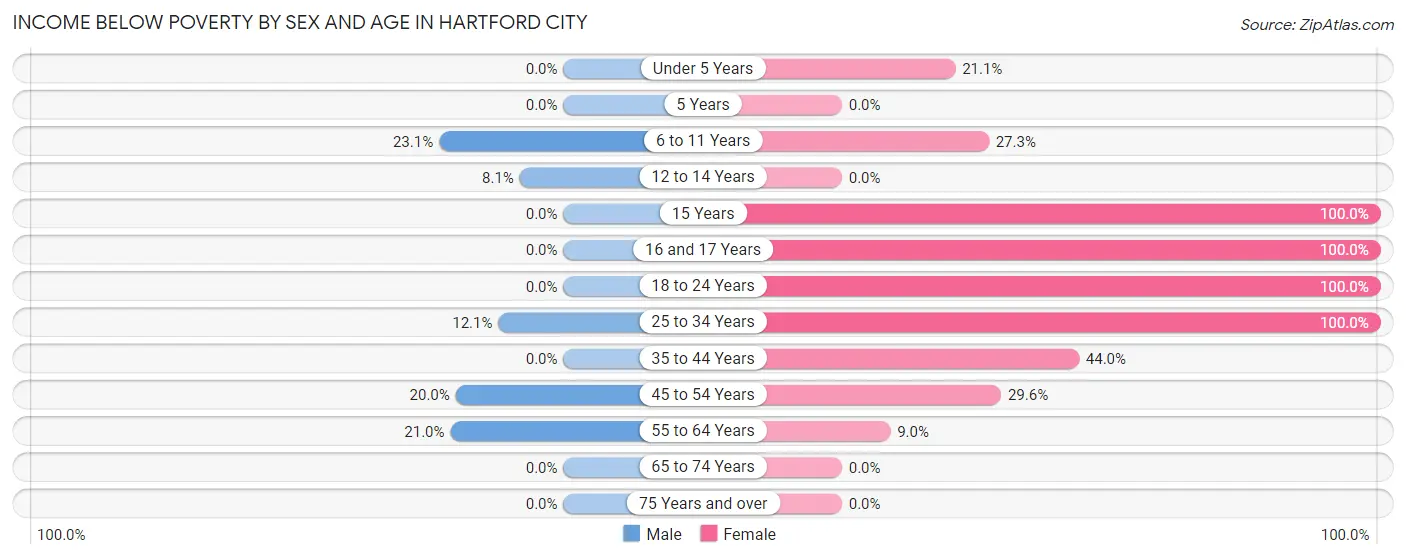
| Age Bracket | Male | Female |
| Under 5 Years | 0 (0.0%) | 4 (21.0%) |
| 5 Years | 0 (0.0%) | 0 (0.0%) |
| 6 to 11 Years | 6 (23.1%) | 3 (27.3%) |
| 12 to 14 Years | 3 (8.1%) | 0 (0.0%) |
| 15 Years | 0 (0.0%) | 2 (100.0%) |
| 16 and 17 Years | 0 (0.0%) | 8 (100.0%) |
| 18 to 24 Years | 0 (0.0%) | 13 (100.0%) |
| 25 to 34 Years | 7 (12.1%) | 2 (100.0%) |
| 35 to 44 Years | 0 (0.0%) | 11 (44.0%) |
| 45 to 54 Years | 2 (20.0%) | 13 (29.5%) |
| 55 to 64 Years | 13 (21.0%) | 8 (9.0%) |
| 65 to 74 Years | 0 (0.0%) | 0 (0.0%) |
| 75 Years and over | 0 (0.0%) | 0 (0.0%) |
| Total | 31 (10.1%) | 64 (22.9%) |
Income Above Poverty by Sex and Age in Hartford City
According to the poverty statistics in Hartford City, males aged under 5 years and females aged 12 to 14 years are the age groups that are most secure financially, with 100.0% of males and 100.0% of females in these age groups living above the poverty line.
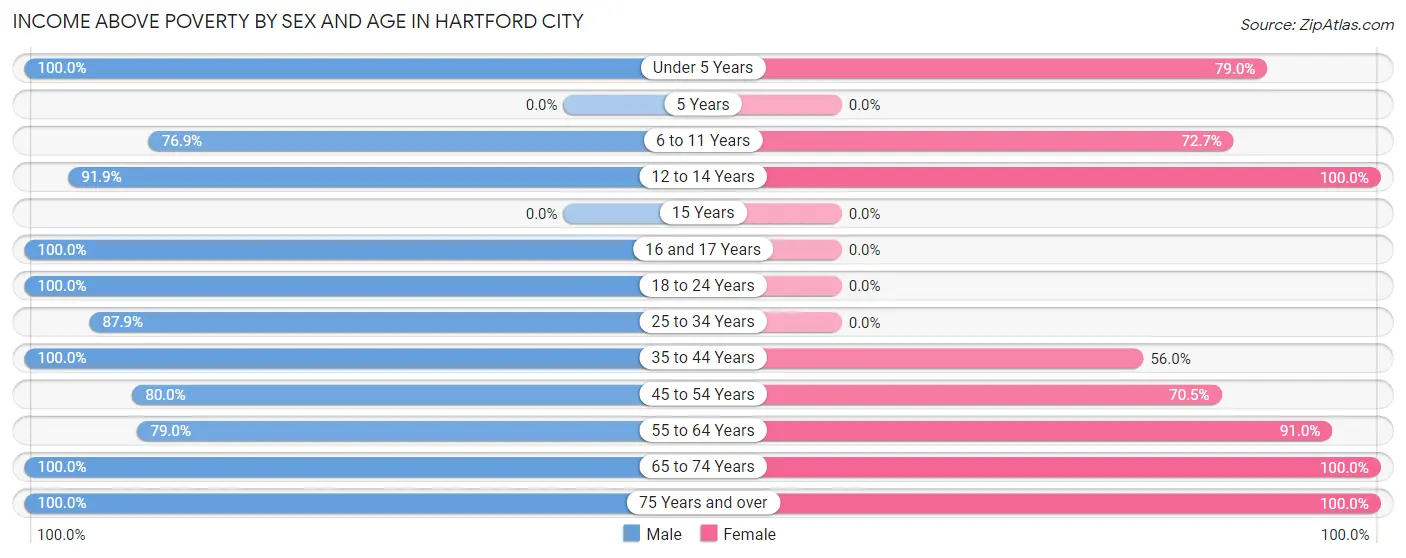
| Age Bracket | Male | Female |
| Under 5 Years | 4 (100.0%) | 15 (78.9%) |
| 5 Years | 0 (0.0%) | 0 (0.0%) |
| 6 to 11 Years | 20 (76.9%) | 8 (72.7%) |
| 12 to 14 Years | 34 (91.9%) | 19 (100.0%) |
| 15 Years | 0 (0.0%) | 0 (0.0%) |
| 16 and 17 Years | 14 (100.0%) | 0 (0.0%) |
| 18 to 24 Years | 16 (100.0%) | 0 (0.0%) |
| 25 to 34 Years | 51 (87.9%) | 0 (0.0%) |
| 35 to 44 Years | 15 (100.0%) | 14 (56.0%) |
| 45 to 54 Years | 8 (80.0%) | 31 (70.5%) |
| 55 to 64 Years | 49 (79.0%) | 81 (91.0%) |
| 65 to 74 Years | 25 (100.0%) | 19 (100.0%) |
| 75 Years and over | 39 (100.0%) | 29 (100.0%) |
| Total | 275 (89.9%) | 216 (77.1%) |
Income Below Poverty Among Married-Couple Families in Hartford City
The poverty statistics for married-couple families in Hartford City show that 3.5% or 4 of the total 116 families live below the poverty line. Families with 3 or 4 children have the highest poverty rate of 100.0%, comprising of 2 families. On the other hand, families with no children have the lowest poverty rate of 0.0%, which includes 0 families.
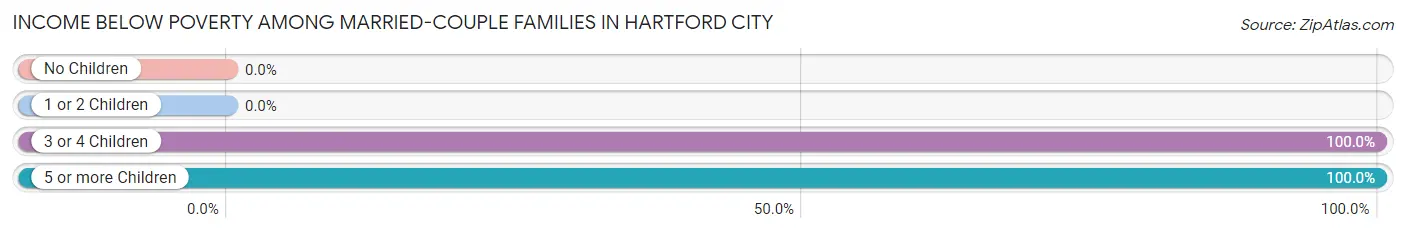
| Children | Above Poverty | Below Poverty |
| No Children | 93 (100.0%) | 0 (0.0%) |
| 1 or 2 Children | 19 (100.0%) | 0 (0.0%) |
| 3 or 4 Children | 0 (0.0%) | 2 (100.0%) |
| 5 or more Children | 0 (0.0%) | 2 (100.0%) |
| Total | 112 (96.6%) | 4 (3.5%) |
Income Below Poverty Among Single-Parent Households in Hartford City
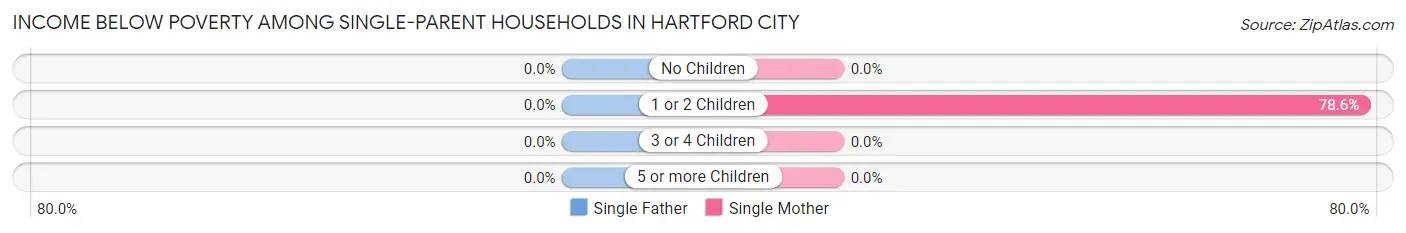
| Children | Single Father | Single Mother |
| No Children | 0 (0.0%) | 0 (0.0%) |
| 1 or 2 Children | 0 (0.0%) | 11 (78.6%) |
| 3 or 4 Children | 0 (0.0%) | 0 (0.0%) |
| 5 or more Children | 0 (0.0%) | 0 (0.0%) |
| Total | 0 (0.0%) | 11 (34.4%) |
Income Below Poverty Among Married-Couple vs Single-Parent Households in Hartford City
The poverty data for Hartford City shows that 4 of the married-couple family households (3.5%) and 11 of the single-parent households (20.4%) are living below the poverty level. Within the married-couple family households, those with 3 or 4 children have the highest poverty rate, with 2 households (100.0%) falling below the poverty line. Among the single-parent households, those with 1 or 2 children have the highest poverty rate, with 11 household (55.0%) living below poverty.
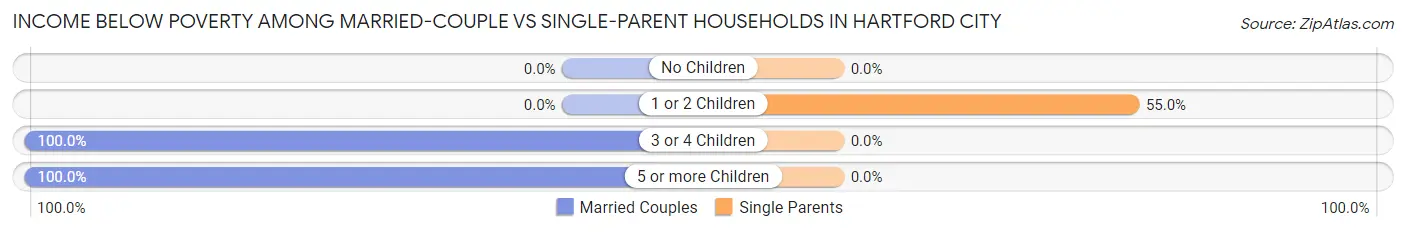
| Children | Married-Couple Families | Single-Parent Households |
| No Children | 0 (0.0%) | 0 (0.0%) |
| 1 or 2 Children | 0 (0.0%) | 11 (55.0%) |
| 3 or 4 Children | 2 (100.0%) | 0 (0.0%) |
| 5 or more Children | 2 (100.0%) | 0 (0.0%) |
| Total | 4 (3.5%) | 11 (20.4%) |
Employment Characteristics in Hartford City
Employment by Class of Employer in Hartford City
Among the 225 employed individuals in Hartford City, private company employees (167 | 74.2%), not-for-profit organizations (21 | 9.3%), and state government employees (21 | 9.3%) make up the most common classes of employment.
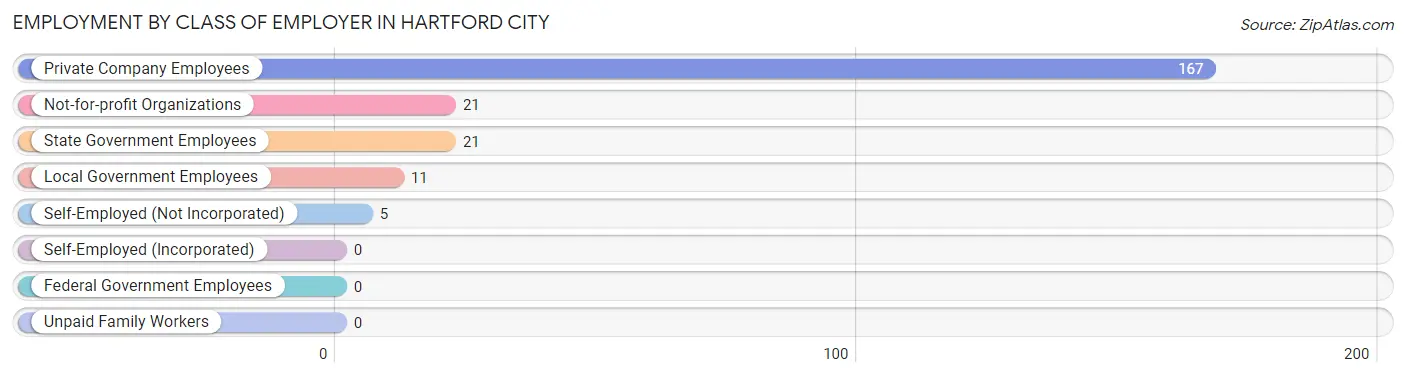
| Employer Class | # Employees | % Employees |
| Private Company Employees | 167 | 74.2% |
| Self-Employed (Incorporated) | 0 | 0.0% |
| Self-Employed (Not Incorporated) | 5 | 2.2% |
| Not-for-profit Organizations | 21 | 9.3% |
| Local Government Employees | 11 | 4.9% |
| State Government Employees | 21 | 9.3% |
| Federal Government Employees | 0 | 0.0% |
| Unpaid Family Workers | 0 | 0.0% |
| Total | 225 | 100.0% |
Employment Status by Age in Hartford City
According to the labor force statistics for Hartford City, out of the total population over 16 years of age (468), 50.0% or 234 individuals are in the labor force, with 2.6% or 6 of them unemployed. The age group with the highest labor force participation rate is 20 to 24 years, with 100.0% or 16 individuals in the labor force. Within the labor force, the 35 to 44 years age range has the highest percentage of unemployed individuals, with 19.4% or 6 of them being unemployed.
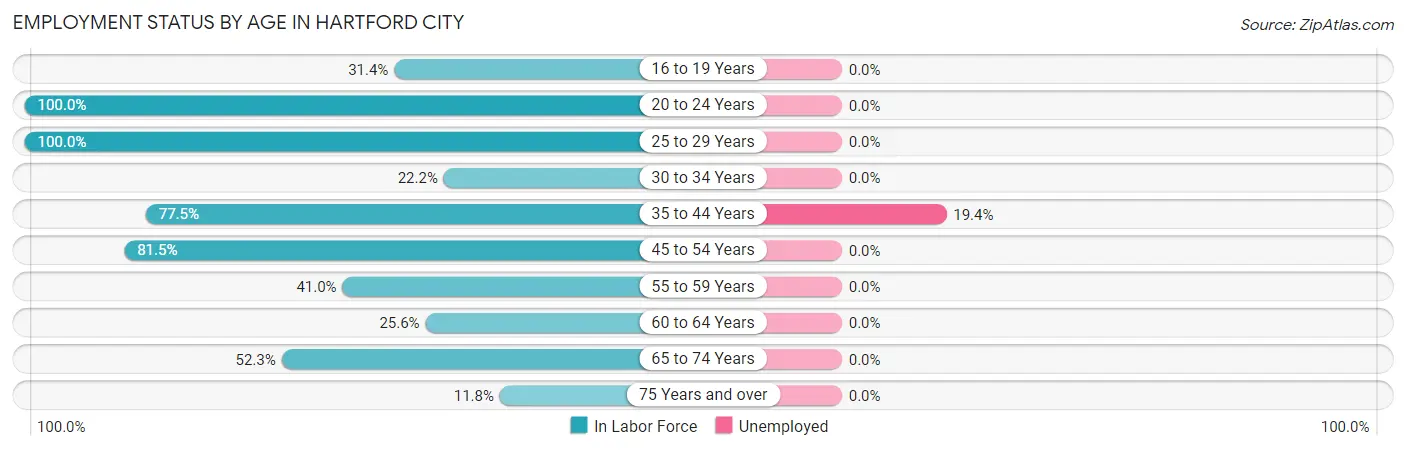
| Age Bracket | In Labor Force | Unemployed |
| 16 to 19 Years | 11 (31.4%) | 0 (0.0%) |
| 20 to 24 Years | 16 (100.0%) | 0 (0.0%) |
| 25 to 29 Years | 51 (100.0%) | 0 (0.0%) |
| 30 to 34 Years | 2 (22.2%) | 0 (0.0%) |
| 35 to 44 Years | 31 (77.5%) | 6 (19.4%) |
| 45 to 54 Years | 44 (81.5%) | 0 (0.0%) |
| 55 to 59 Years | 25 (41.0%) | 0 (0.0%) |
| 60 to 64 Years | 23 (25.6%) | 0 (0.0%) |
| 65 to 74 Years | 23 (52.3%) | 0 (0.0%) |
| 75 Years and over | 8 (11.8%) | 0 (0.0%) |
| Total | 234 (50.0%) | 6 (2.6%) |
Employment Status by Educational Attainment in Hartford City
According to labor force statistics for Hartford City, 57.7% of individuals (176) out of the total population between 25 and 64 years of age (305) are in the labor force, with 3.4% or 6 of them being unemployed. The group with the highest labor force participation rate are those with the educational attainment of high school diploma, with 80.0% or 104 individuals in the labor force. Within the labor force, individuals with high school diploma education have the highest percentage of unemployment, with 5.8% or 6 of them being unemployed.
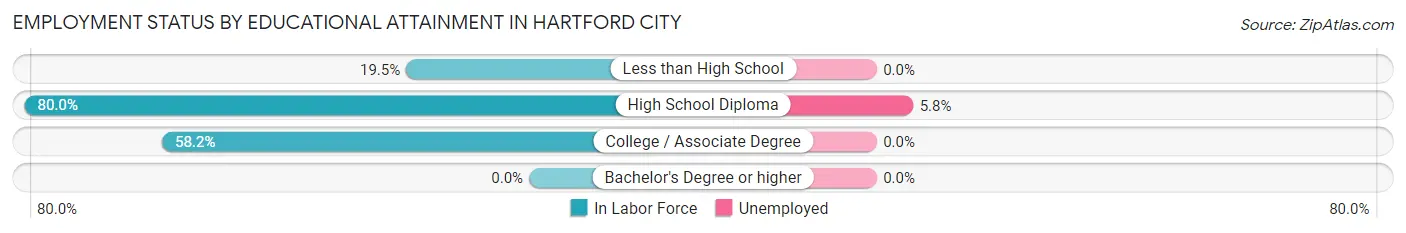
| Educational Attainment | In Labor Force | Unemployed |
| Less than High School | 15 (19.5%) | 0 (0.0%) |
| High School Diploma | 104 (80.0%) | 8 (5.8%) |
| College / Associate Degree | 57 (58.2%) | 0 (0.0%) |
| Bachelor's Degree or higher | 0 (0.0%) | 0 (0.0%) |
| Total | 176 (57.7%) | 10 (3.4%) |
Employment Occupations by Sex in Hartford City
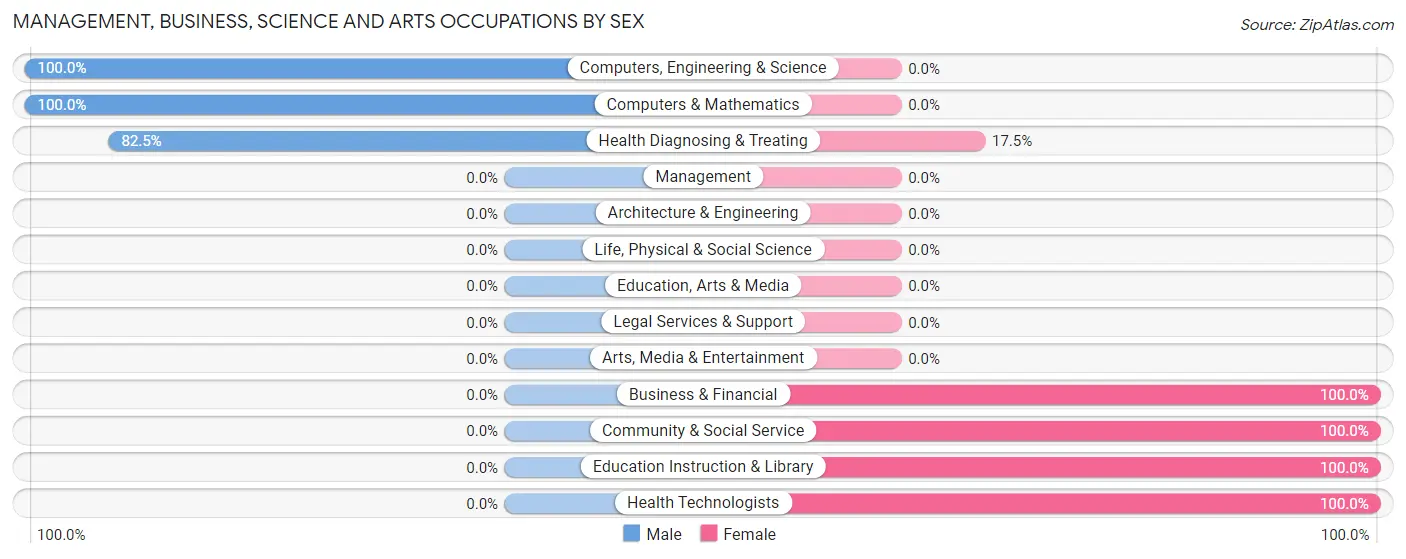
Management, Business, Science and Arts Occupations
The most common Management, Business, Science and Arts occupations in Hartford City are Health Diagnosing & Treating (40 | 17.5%), Community & Social Service (11 | 4.8%), Education Instruction & Library (11 | 4.8%), Business & Financial (5 | 2.2%), and Computers, Engineering & Science (5 | 2.2%).
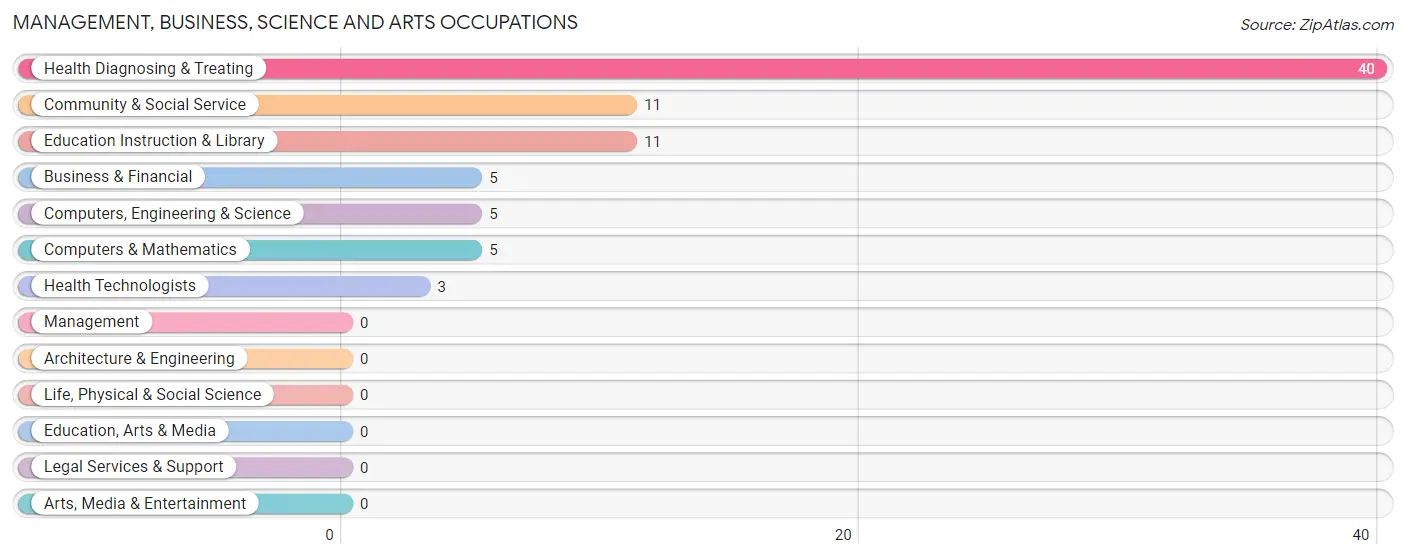
Management, Business, Science and Arts Occupations by Sex
Within the Management, Business, Science and Arts occupations in Hartford City, the most male-oriented occupations are Computers, Engineering & Science (100.0%), Computers & Mathematics (100.0%), and Health Diagnosing & Treating (82.5%), while the most female-oriented occupations are Business & Financial (100.0%), Community & Social Service (100.0%), and Education Instruction & Library (100.0%).
| Occupation | Male | Female |
| Management | 0 (0.0%) | 0 (0.0%) |
| Business & Financial | 0 (0.0%) | 5 (100.0%) |
| Computers, Engineering & Science | 5 (100.0%) | 0 (0.0%) |
| Computers & Mathematics | 5 (100.0%) | 0 (0.0%) |
| Architecture & Engineering | 0 (0.0%) | 0 (0.0%) |
| Life, Physical & Social Science | 0 (0.0%) | 0 (0.0%) |
| Community & Social Service | 0 (0.0%) | 11 (100.0%) |
| Education, Arts & Media | 0 (0.0%) | 0 (0.0%) |
| Legal Services & Support | 0 (0.0%) | 0 (0.0%) |
| Education Instruction & Library | 0 (0.0%) | 11 (100.0%) |
| Arts, Media & Entertainment | 0 (0.0%) | 0 (0.0%) |
| Health Diagnosing & Treating | 33 (82.5%) | 7 (17.5%) |
| Health Technologists | 0 (0.0%) | 3 (100.0%) |
| Total (Category) | 38 (62.3%) | 23 (37.7%) |
| Total (Overall) | 139 (61.0%) | 89 (39.0%) |
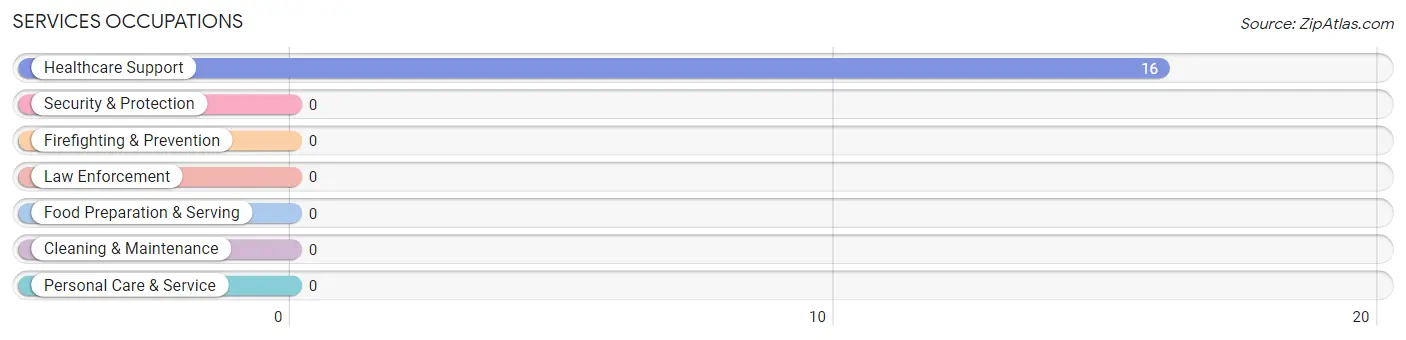
Services Occupations
The most common Services occupations in Hartford City are , and Healthcare Support (16 | 7.0%).
Services Occupations by Sex
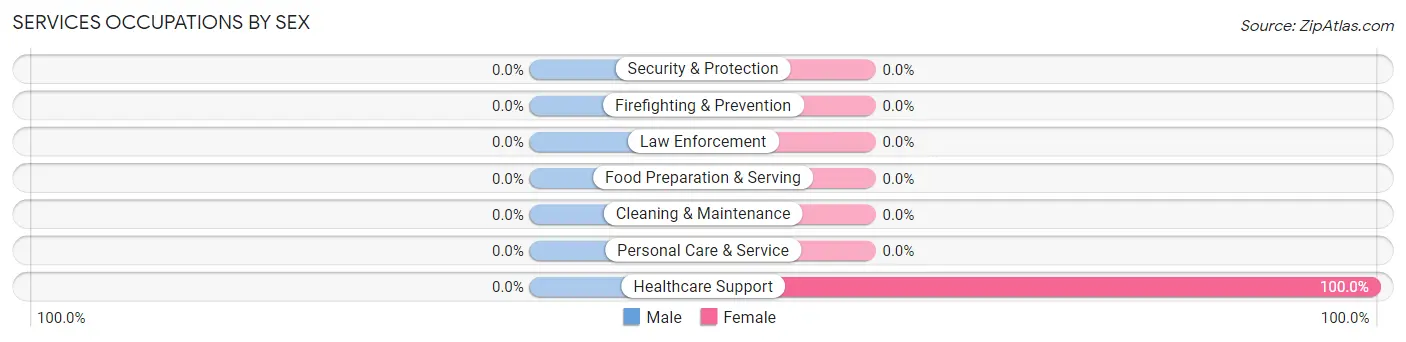
| Occupation | Male | Female |
| Healthcare Support | 0 (0.0%) | 16 (100.0%) |
| Security & Protection | 0 (0.0%) | 0 (0.0%) |
| Firefighting & Prevention | 0 (0.0%) | 0 (0.0%) |
| Law Enforcement | 0 (0.0%) | 0 (0.0%) |
| Food Preparation & Serving | 0 (0.0%) | 0 (0.0%) |
| Cleaning & Maintenance | 0 (0.0%) | 0 (0.0%) |
| Personal Care & Service | 0 (0.0%) | 0 (0.0%) |
| Total (Category) | 0 (0.0%) | 16 (100.0%) |
| Total (Overall) | 139 (61.0%) | 89 (39.0%) |
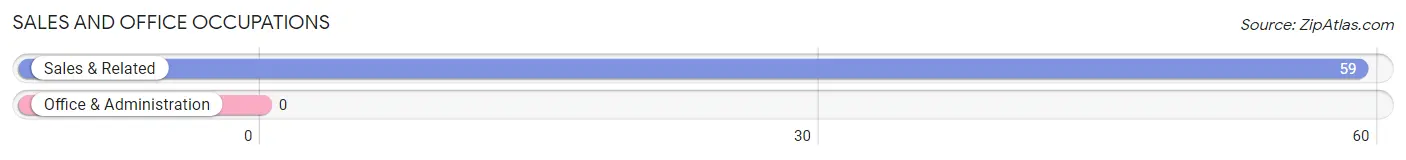
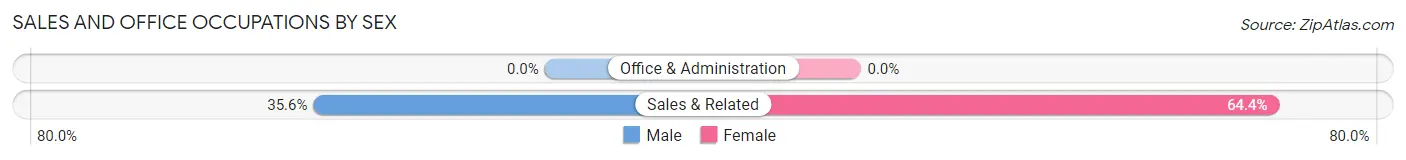
Sales and Office Occupations
The most common Sales and Office occupations in Hartford City are , and Sales & Related (59 | 25.9%).
Sales and Office Occupations by Sex
| Occupation | Male | Female |
| Sales & Related | 21 (35.6%) | 38 (64.4%) |
| Office & Administration | 0 (0.0%) | 0 (0.0%) |
| Total (Category) | 21 (35.6%) | 38 (64.4%) |
| Total (Overall) | 139 (61.0%) | 89 (39.0%) |
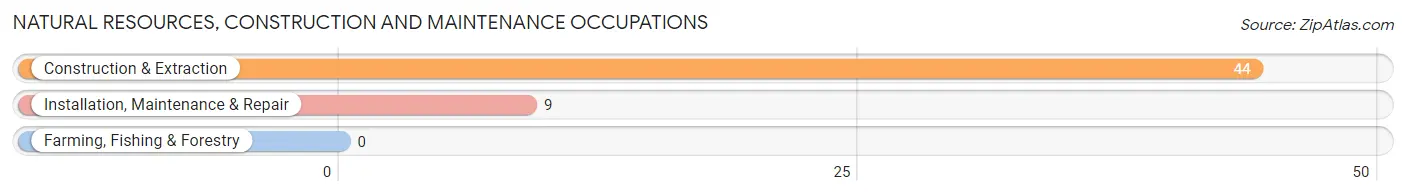
Natural Resources, Construction and Maintenance Occupations
The most common Natural Resources, Construction and Maintenance occupations in Hartford City are Construction & Extraction (44 | 19.3%), and Installation, Maintenance & Repair (9 | 4.0%).
Natural Resources, Construction and Maintenance Occupations by Sex
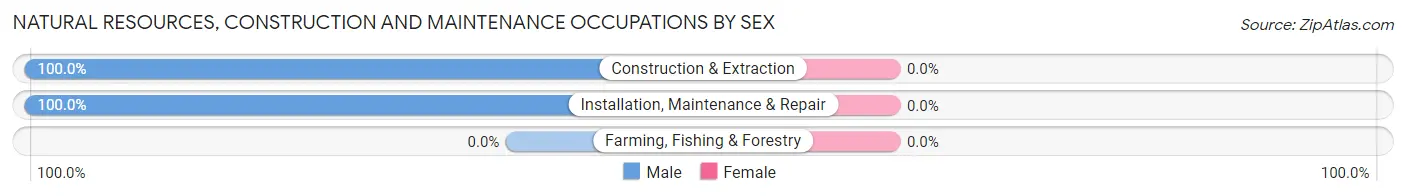
| Occupation | Male | Female |
| Farming, Fishing & Forestry | 0 (0.0%) | 0 (0.0%) |
| Construction & Extraction | 44 (100.0%) | 0 (0.0%) |
| Installation, Maintenance & Repair | 9 (100.0%) | 0 (0.0%) |
| Total (Category) | 53 (100.0%) | 0 (0.0%) |
| Total (Overall) | 139 (61.0%) | 89 (39.0%) |
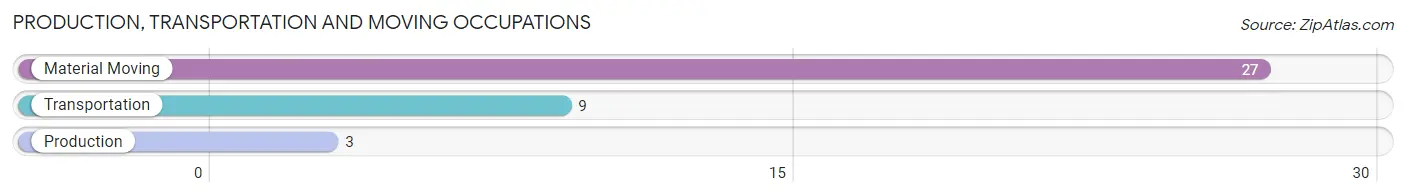
Production, Transportation and Moving Occupations
The most common Production, Transportation and Moving occupations in Hartford City are Material Moving (27 | 11.8%), Transportation (9 | 4.0%), and Production (3 | 1.3%).
Production, Transportation and Moving Occupations by Sex
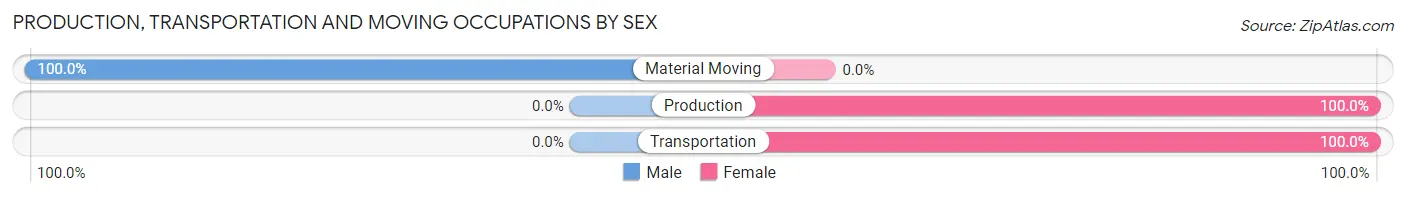
| Occupation | Male | Female |
| Production | 0 (0.0%) | 3 (100.0%) |
| Transportation | 0 (0.0%) | 9 (100.0%) |
| Material Moving | 27 (100.0%) | 0 (0.0%) |
| Total (Category) | 27 (69.2%) | 12 (30.8%) |
| Total (Overall) | 139 (61.0%) | 89 (39.0%) |
Employment Industries by Sex in Hartford City
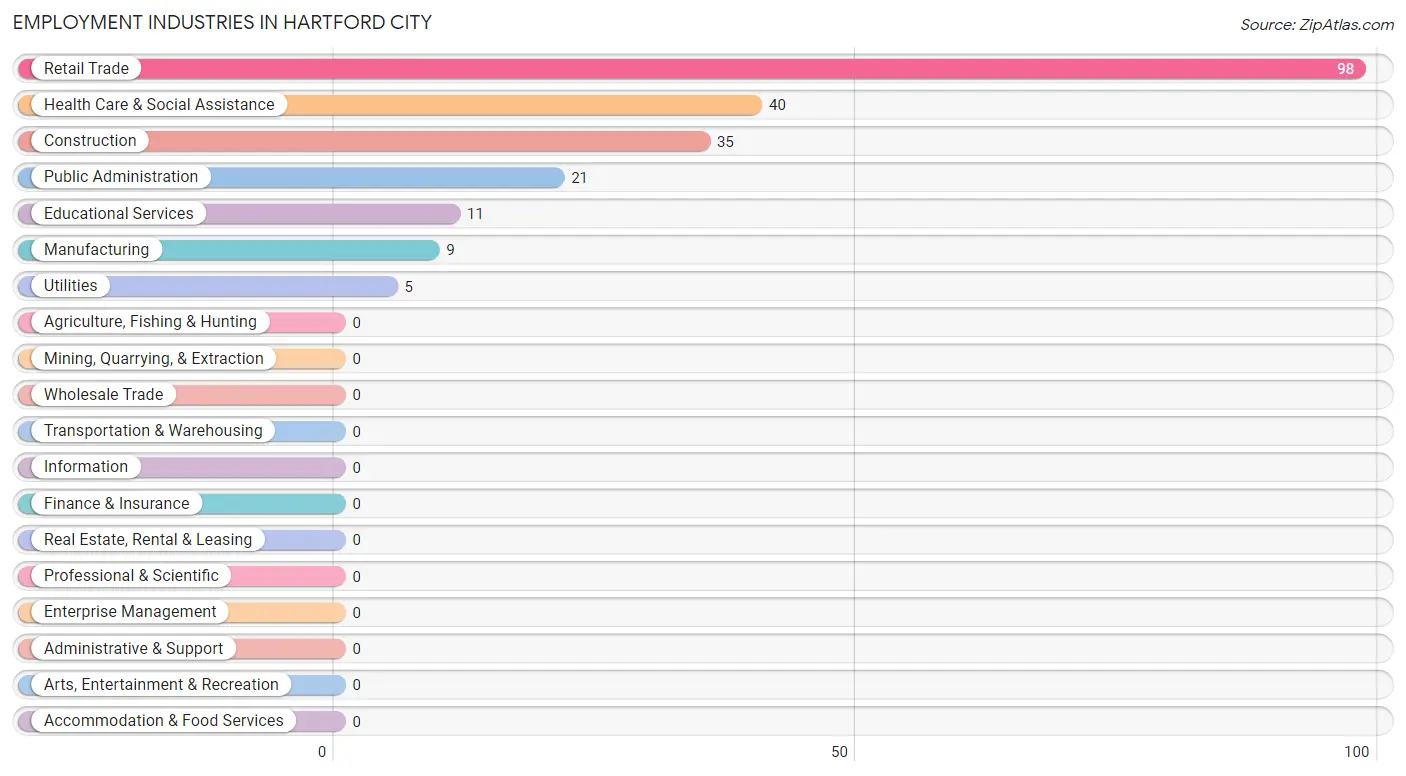
Employment Industries in Hartford City
The major employment industries in Hartford City include Retail Trade (98 | 43.0%), Health Care & Social Assistance (40 | 17.5%), Construction (35 | 15.3%), Public Administration (21 | 9.2%), and Educational Services (11 | 4.8%).
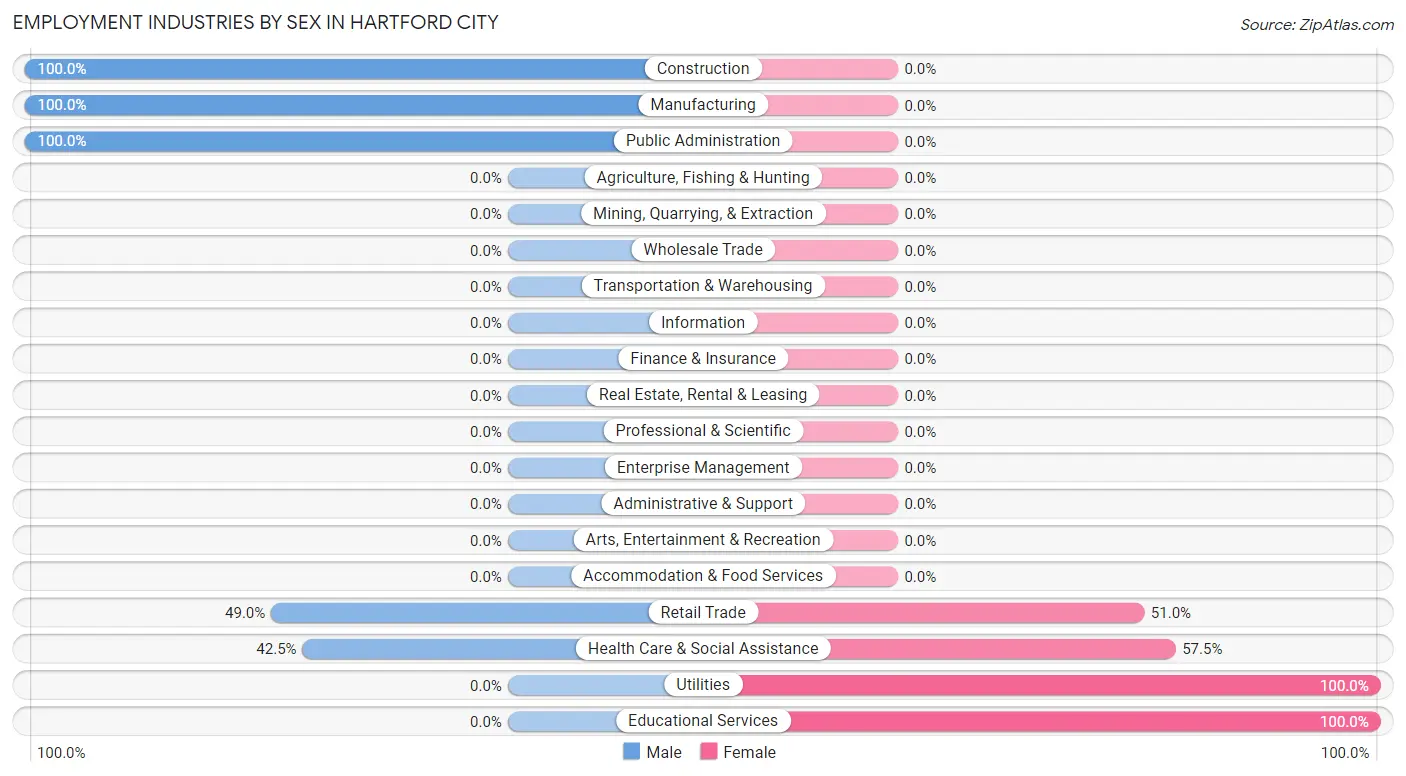
Employment Industries by Sex in Hartford City
The Hartford City industries that see more men than women are Construction (100.0%), Manufacturing (100.0%), and Public Administration (100.0%), whereas the industries that tend to have a higher number of women are Utilities (100.0%), Educational Services (100.0%), and Health Care & Social Assistance (57.5%).
| Industry | Male | Female |
| Agriculture, Fishing & Hunting | 0 (0.0%) | 0 (0.0%) |
| Mining, Quarrying, & Extraction | 0 (0.0%) | 0 (0.0%) |
| Construction | 35 (100.0%) | 0 (0.0%) |
| Manufacturing | 9 (100.0%) | 0 (0.0%) |
| Wholesale Trade | 0 (0.0%) | 0 (0.0%) |
| Retail Trade | 48 (49.0%) | 50 (51.0%) |
| Transportation & Warehousing | 0 (0.0%) | 0 (0.0%) |
| Utilities | 0 (0.0%) | 5 (100.0%) |
| Information | 0 (0.0%) | 0 (0.0%) |
| Finance & Insurance | 0 (0.0%) | 0 (0.0%) |
| Real Estate, Rental & Leasing | 0 (0.0%) | 0 (0.0%) |
| Professional & Scientific | 0 (0.0%) | 0 (0.0%) |
| Enterprise Management | 0 (0.0%) | 0 (0.0%) |
| Administrative & Support | 0 (0.0%) | 0 (0.0%) |
| Educational Services | 0 (0.0%) | 11 (100.0%) |
| Health Care & Social Assistance | 17 (42.5%) | 23 (57.5%) |
| Arts, Entertainment & Recreation | 0 (0.0%) | 0 (0.0%) |
| Accommodation & Food Services | 0 (0.0%) | 0 (0.0%) |
| Public Administration | 21 (100.0%) | 0 (0.0%) |
| Total | 139 (61.0%) | 89 (39.0%) |
Education in Hartford City
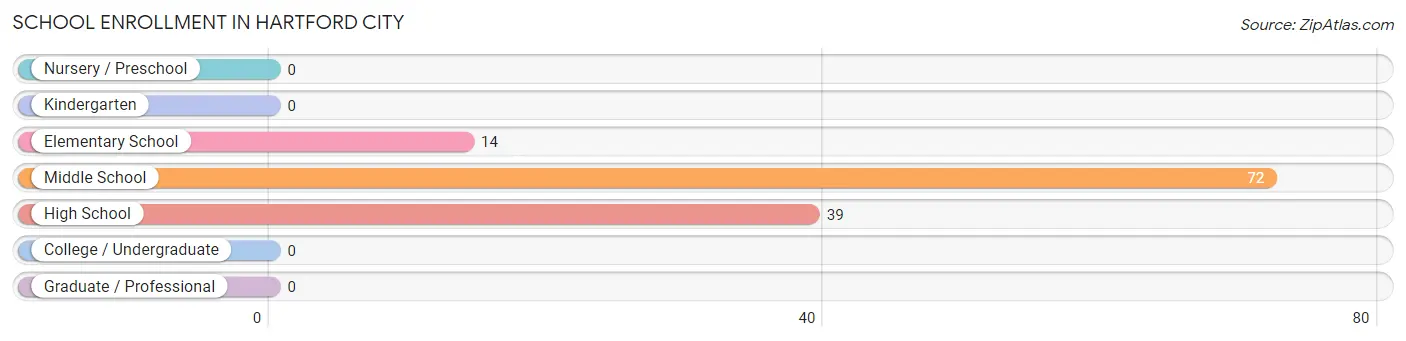
School Enrollment in Hartford City
The most common levels of schooling among the 125 students in Hartford City are middle school (72 | 57.6%), high school (39 | 31.2%), and elementary school (14 | 11.2%).
| School Level | # Students | % Students |
| Nursery / Preschool | 0 | 0.0% |
| Kindergarten | 0 | 0.0% |
| Elementary School | 14 | 11.2% |
| Middle School | 72 | 57.6% |
| High School | 39 | 31.2% |
| College / Undergraduate | 0 | 0.0% |
| Graduate / Professional | 0 | 0.0% |
| Total | 125 | 100.0% |
School Enrollment by Age by Funding Source in Hartford City
Out of a total of 125 students who are enrolled in schools in Hartford City, 11 (8.8%) attend a private institution, while the remaining 114 (91.2%) are enrolled in public schools. The age group of 5 to 9 year old has the highest likelihood of being enrolled in private schools, with 6 (42.9% in the age bracket) enrolled. Conversely, the age group of 15 to 17 year olds has the lowest likelihood of being enrolled in a private school, with 22 (100.0% in the age bracket) attending a public institution.
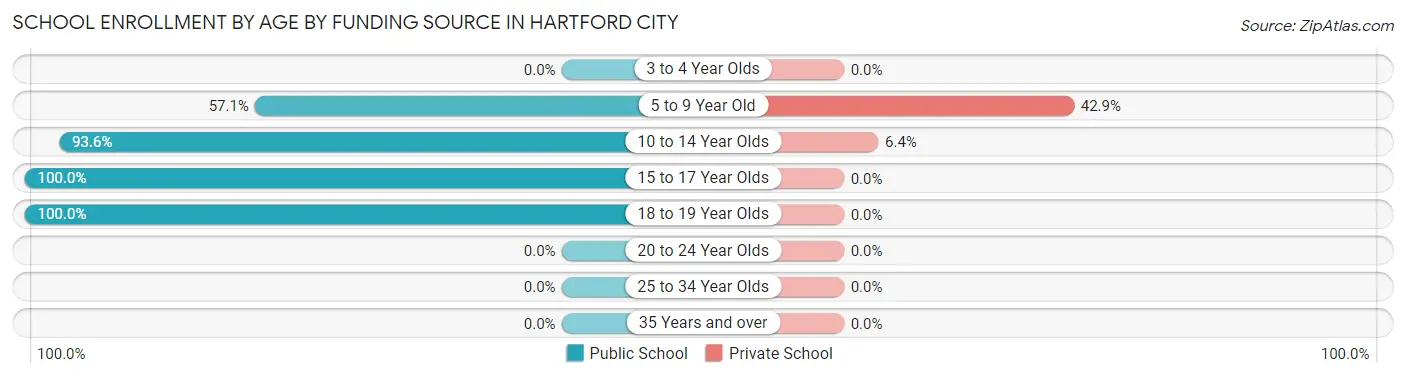
| Age Bracket | Public School | Private School |
| 3 to 4 Year Olds | 0 (0.0%) | 0 (0.0%) |
| 5 to 9 Year Old | 8 (57.1%) | 6 (42.9%) |
| 10 to 14 Year Olds | 73 (93.6%) | 5 (6.4%) |
| 15 to 17 Year Olds | 22 (100.0%) | 0 (0.0%) |
| 18 to 19 Year Olds | 11 (100.0%) | 0 (0.0%) |
| 20 to 24 Year Olds | 0 (0.0%) | 0 (0.0%) |
| 25 to 34 Year Olds | 0 (0.0%) | 0 (0.0%) |
| 35 Years and over | 0 (0.0%) | 0 (0.0%) |
| Total | 114 (91.2%) | 11 (8.8%) |
Educational Attainment by Field of Study in Hartford City
| Field of Study | # Graduates | % Graduates |
| Computers & Mathematics | 0 | 0.0% |
| Bio, Nature & Agricultural | 0 | 0.0% |
| Physical & Health Sciences | 0 | 0.0% |
| Psychology | 0 | 0.0% |
| Social Sciences | 0 | 0.0% |
| Engineering | 0 | 0.0% |
| Multidisciplinary Studies | 0 | 0.0% |
| Science & Technology | 0 | 0.0% |
| Business | 0 | 0.0% |
| Education | 0 | 0.0% |
| Literature & Languages | 0 | 0.0% |
| Liberal Arts & History | 0 | 0.0% |
| Visual & Performing Arts | 0 | 0.0% |
| Communications | 0 | 0.0% |
| Arts & Humanities | 0 | 0.0% |
| Total | 0 | 0.0% |
Transportation & Commute in Hartford City
Vehicle Availability by Sex in Hartford City
The most prevalent vehicle ownership categories in Hartford City are males with 3 vehicles (63, accounting for 45.3%) and females with 3 vehicles (16, making up 73.3%).
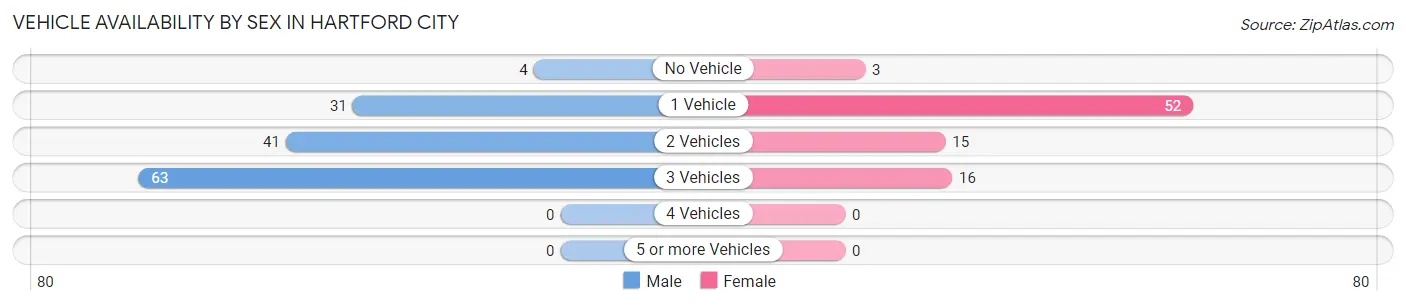
| Vehicles Available | Male | Female |
| No Vehicle | 4 (2.9%) | 3 (3.5%) |
| 1 Vehicle | 31 (22.3%) | 52 (60.5%) |
| 2 Vehicles | 41 (29.5%) | 15 (17.4%) |
| 3 Vehicles | 63 (45.3%) | 16 (18.6%) |
| 4 Vehicles | 0 (0.0%) | 0 (0.0%) |
| 5 or more Vehicles | 0 (0.0%) | 0 (0.0%) |
| Total | 139 (100.0%) | 86 (100.0%) |
Commute Time in Hartford City
The most frequently occuring commute durations in Hartford City are 15 to 19 minutes (50 commuters, 22.5%), 5 to 9 minutes (42 commuters, 18.9%), and 20 to 24 minutes (34 commuters, 15.3%).
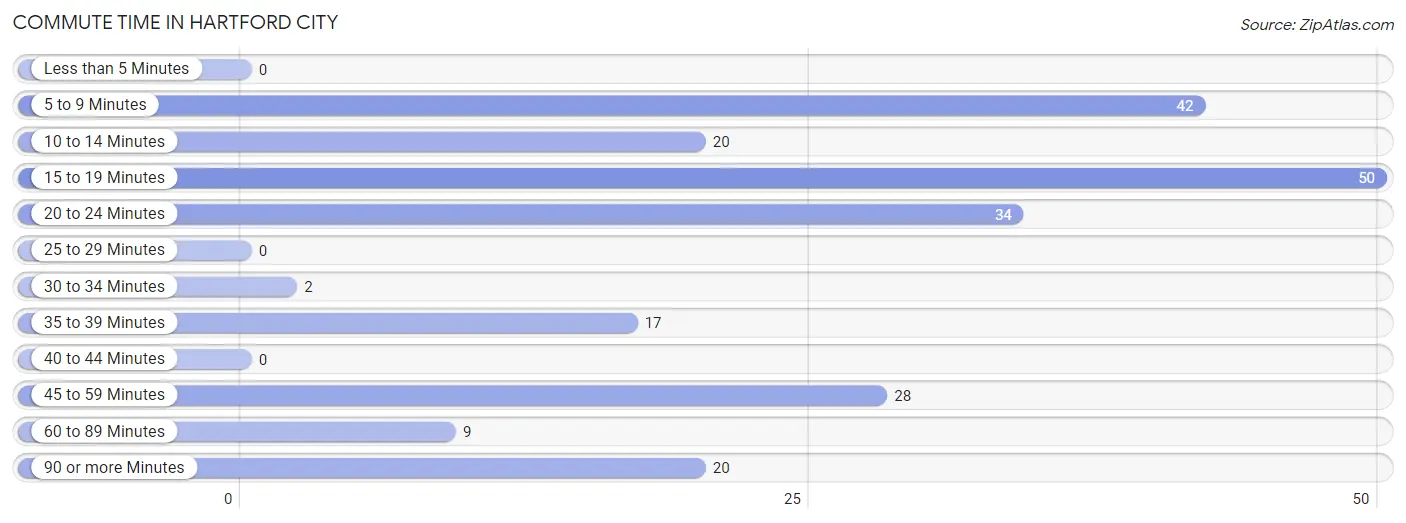
| Commute Time | # Commuters | % Commuters |
| Less than 5 Minutes | 0 | 0.0% |
| 5 to 9 Minutes | 42 | 18.9% |
| 10 to 14 Minutes | 20 | 9.0% |
| 15 to 19 Minutes | 50 | 22.5% |
| 20 to 24 Minutes | 34 | 15.3% |
| 25 to 29 Minutes | 0 | 0.0% |
| 30 to 34 Minutes | 2 | 0.9% |
| 35 to 39 Minutes | 17 | 7.7% |
| 40 to 44 Minutes | 0 | 0.0% |
| 45 to 59 Minutes | 28 | 12.6% |
| 60 to 89 Minutes | 9 | 4.1% |
| 90 or more Minutes | 20 | 9.0% |
Commute Time by Sex in Hartford City
The most common commute times in Hartford City are 15 to 19 minutes (30 commuters, 21.6%) for males and 15 to 19 minutes (20 commuters, 24.1%) for females.
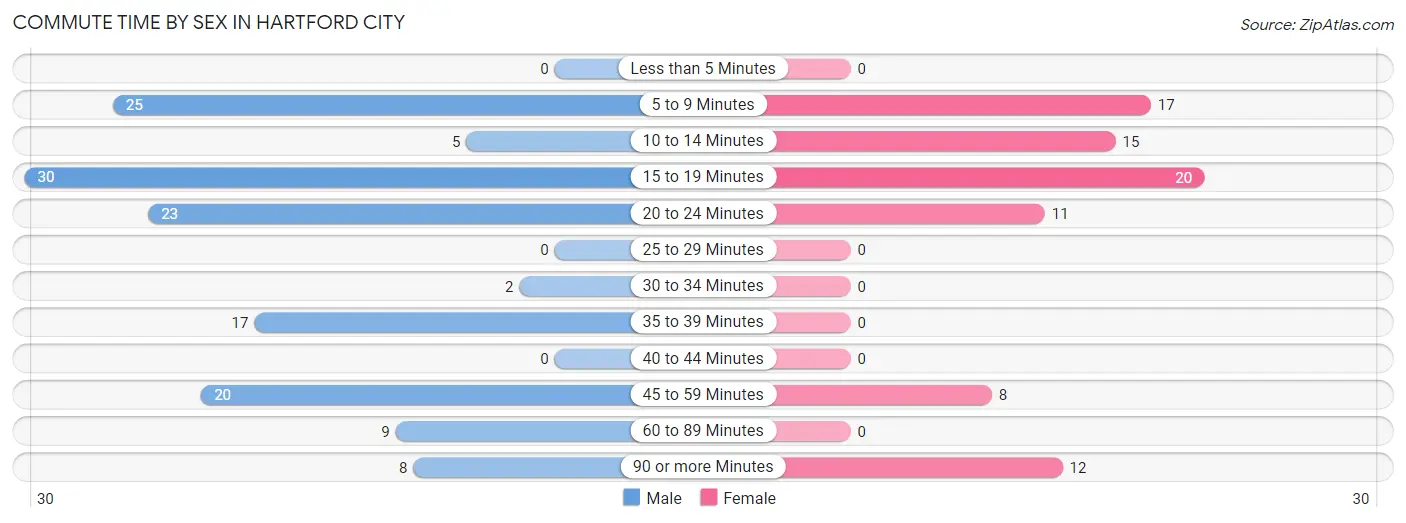
| Commute Time | Male | Female |
| Less than 5 Minutes | 0 (0.0%) | 0 (0.0%) |
| 5 to 9 Minutes | 25 (18.0%) | 17 (20.5%) |
| 10 to 14 Minutes | 5 (3.6%) | 15 (18.1%) |
| 15 to 19 Minutes | 30 (21.6%) | 20 (24.1%) |
| 20 to 24 Minutes | 23 (16.6%) | 11 (13.3%) |
| 25 to 29 Minutes | 0 (0.0%) | 0 (0.0%) |
| 30 to 34 Minutes | 2 (1.4%) | 0 (0.0%) |
| 35 to 39 Minutes | 17 (12.2%) | 0 (0.0%) |
| 40 to 44 Minutes | 0 (0.0%) | 0 (0.0%) |
| 45 to 59 Minutes | 20 (14.4%) | 8 (9.6%) |
| 60 to 89 Minutes | 9 (6.5%) | 0 (0.0%) |
| 90 or more Minutes | 8 (5.8%) | 12 (14.5%) |
Time of Departure to Work by Sex in Hartford City
The most frequent times of departure to work in Hartford City are 7:00 AM to 7:29 AM (37, 26.6%) for males and 12:00 PM to 3:59 PM (32, 38.6%) for females.
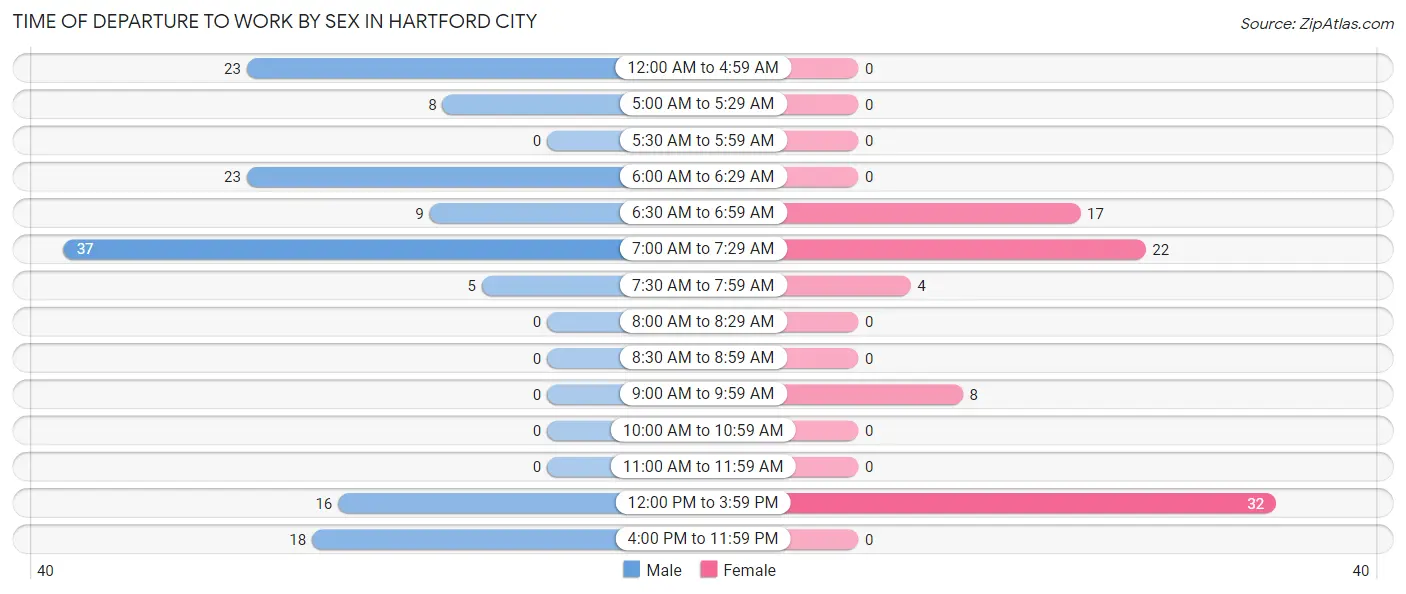
| Time of Departure | Male | Female |
| 12:00 AM to 4:59 AM | 23 (16.6%) | 0 (0.0%) |
| 5:00 AM to 5:29 AM | 8 (5.8%) | 0 (0.0%) |
| 5:30 AM to 5:59 AM | 0 (0.0%) | 0 (0.0%) |
| 6:00 AM to 6:29 AM | 23 (16.6%) | 0 (0.0%) |
| 6:30 AM to 6:59 AM | 9 (6.5%) | 17 (20.5%) |
| 7:00 AM to 7:29 AM | 37 (26.6%) | 22 (26.5%) |
| 7:30 AM to 7:59 AM | 5 (3.6%) | 4 (4.8%) |
| 8:00 AM to 8:29 AM | 0 (0.0%) | 0 (0.0%) |
| 8:30 AM to 8:59 AM | 0 (0.0%) | 0 (0.0%) |
| 9:00 AM to 9:59 AM | 0 (0.0%) | 8 (9.6%) |
| 10:00 AM to 10:59 AM | 0 (0.0%) | 0 (0.0%) |
| 11:00 AM to 11:59 AM | 0 (0.0%) | 0 (0.0%) |
| 12:00 PM to 3:59 PM | 16 (11.5%) | 32 (38.6%) |
| 4:00 PM to 11:59 PM | 18 (13.0%) | 0 (0.0%) |
| Total | 139 (100.0%) | 83 (100.0%) |
Housing Occupancy in Hartford City
Occupancy by Ownership in Hartford City
Of the total 241 dwellings in Hartford City, owner-occupied units account for 182 (75.5%), while renter-occupied units make up 59 (24.5%).
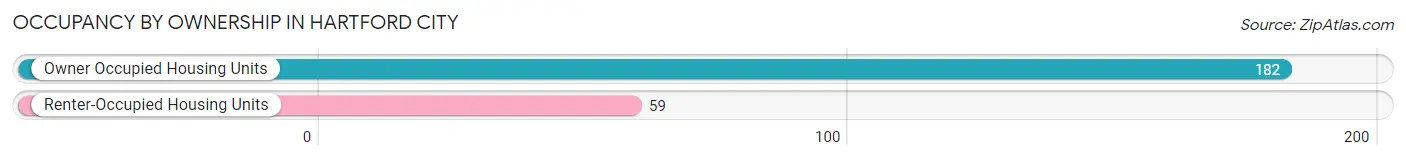
| Occupancy | # Housing Units | % Housing Units |
| Owner Occupied Housing Units | 182 | 75.5% |
| Renter-Occupied Housing Units | 59 | 24.5% |
| Total Occupied Housing Units | 241 | 100.0% |
Occupancy by Household Size in Hartford City
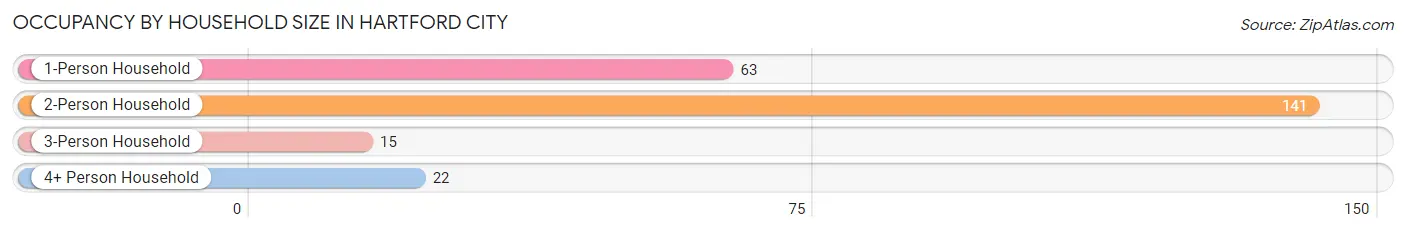
| Household Size | # Housing Units | % Housing Units |
| 1-Person Household | 63 | 26.1% |
| 2-Person Household | 141 | 58.5% |
| 3-Person Household | 15 | 6.2% |
| 4+ Person Household | 22 | 9.1% |
| Total Housing Units | 241 | 100.0% |
Occupancy by Ownership by Household Size in Hartford City
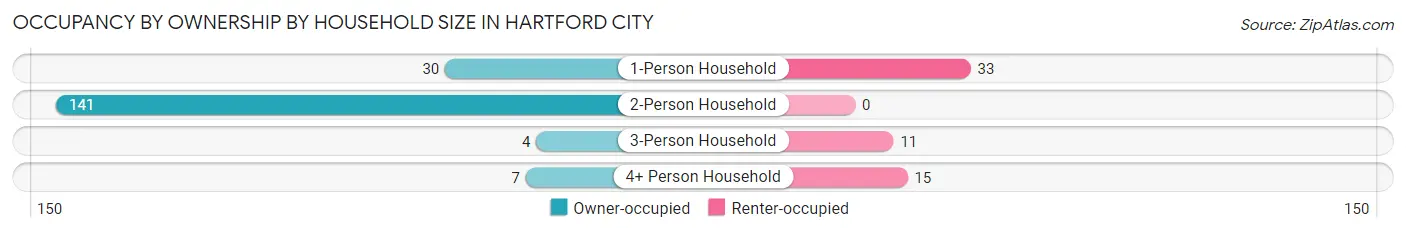
| Household Size | Owner-occupied | Renter-occupied |
| 1-Person Household | 30 (47.6%) | 33 (52.4%) |
| 2-Person Household | 141 (100.0%) | 0 (0.0%) |
| 3-Person Household | 4 (26.7%) | 11 (73.3%) |
| 4+ Person Household | 7 (31.8%) | 15 (68.2%) |
| Total Housing Units | 182 (75.5%) | 59 (24.5%) |
Occupancy by Educational Attainment in Hartford City
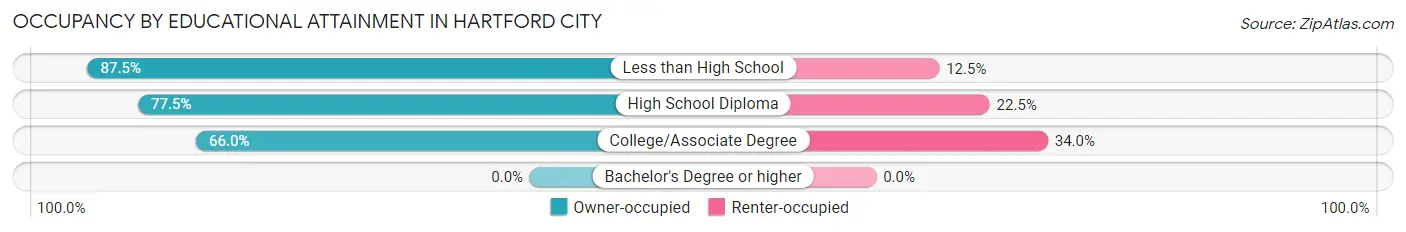
| Household Size | Owner-occupied | Renter-occupied |
| Less than High School | 56 (87.5%) | 8 (12.5%) |
| High School Diploma | 62 (77.5%) | 18 (22.5%) |
| College/Associate Degree | 64 (66.0%) | 33 (34.0%) |
| Bachelor's Degree or higher | 0 (0.0%) | 0 (0.0%) |
Occupancy by Age of Householder in Hartford City
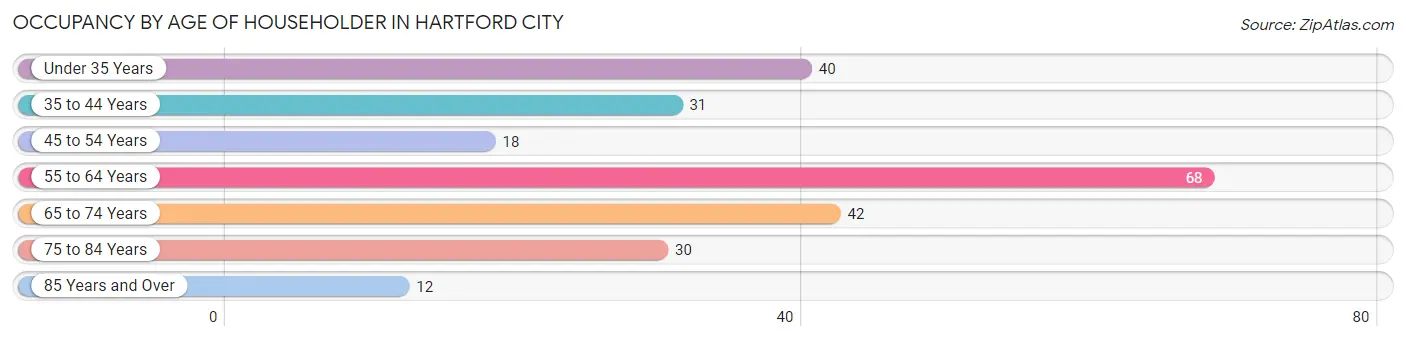
| Age Bracket | # Households | % Households |
| Under 35 Years | 40 | 16.6% |
| 35 to 44 Years | 31 | 12.9% |
| 45 to 54 Years | 18 | 7.5% |
| 55 to 64 Years | 68 | 28.2% |
| 65 to 74 Years | 42 | 17.4% |
| 75 to 84 Years | 30 | 12.4% |
| 85 Years and Over | 12 | 5.0% |
| Total | 241 | 100.0% |
Housing Finances in Hartford City
Median Income by Occupancy in Hartford City
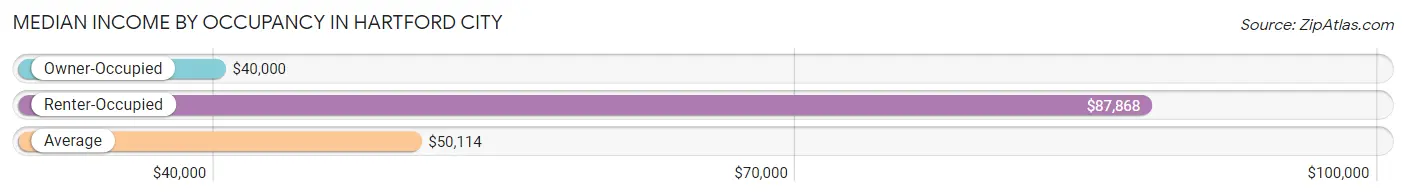
| Occupancy Type | # Households | Median Income |
| Owner-Occupied | 182 (75.5%) | $40,000 |
| Renter-Occupied | 59 (24.5%) | $87,868 |
| Average | 241 (100.0%) | $50,114 |
Occupancy by Householder Income Bracket in Hartford City
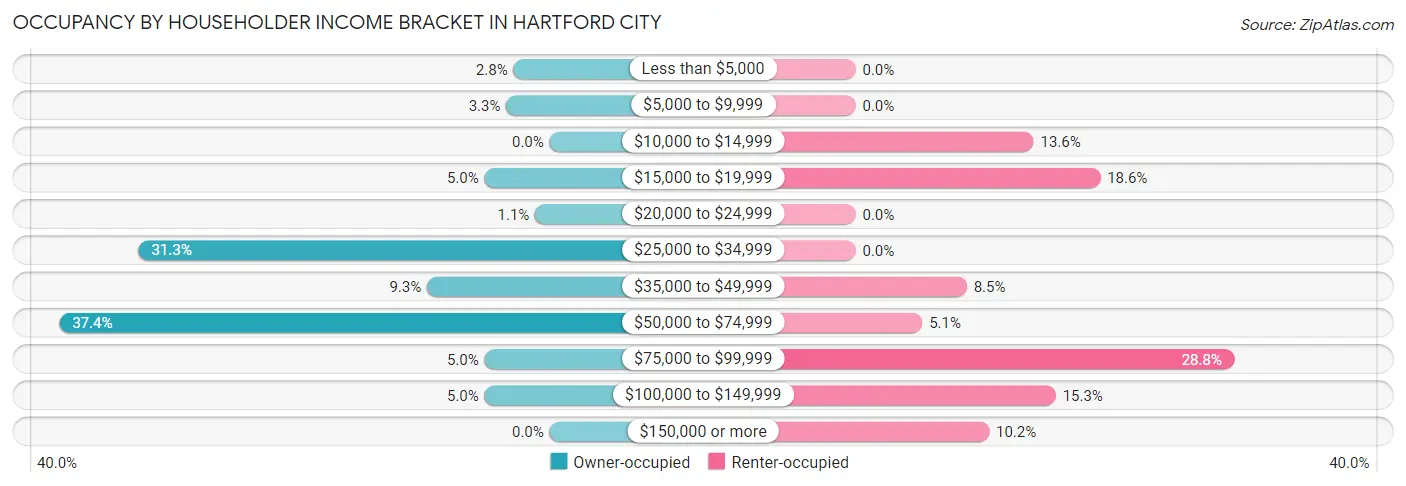
| Income Bracket | Owner-occupied | Renter-occupied |
| Less than $5,000 | 5 (2.8%) | 0 (0.0%) |
| $5,000 to $9,999 | 6 (3.3%) | 0 (0.0%) |
| $10,000 to $14,999 | 0 (0.0%) | 8 (13.6%) |
| $15,000 to $19,999 | 9 (5.0%) | 11 (18.6%) |
| $20,000 to $24,999 | 2 (1.1%) | 0 (0.0%) |
| $25,000 to $34,999 | 57 (31.3%) | 0 (0.0%) |
| $35,000 to $49,999 | 17 (9.3%) | 5 (8.5%) |
| $50,000 to $74,999 | 68 (37.4%) | 3 (5.1%) |
| $75,000 to $99,999 | 9 (5.0%) | 17 (28.8%) |
| $100,000 to $149,999 | 9 (5.0%) | 9 (15.2%) |
| $150,000 or more | 0 (0.0%) | 6 (10.2%) |
| Total | 182 (100.0%) | 59 (100.0%) |
Monthly Housing Cost Tiers in Hartford City
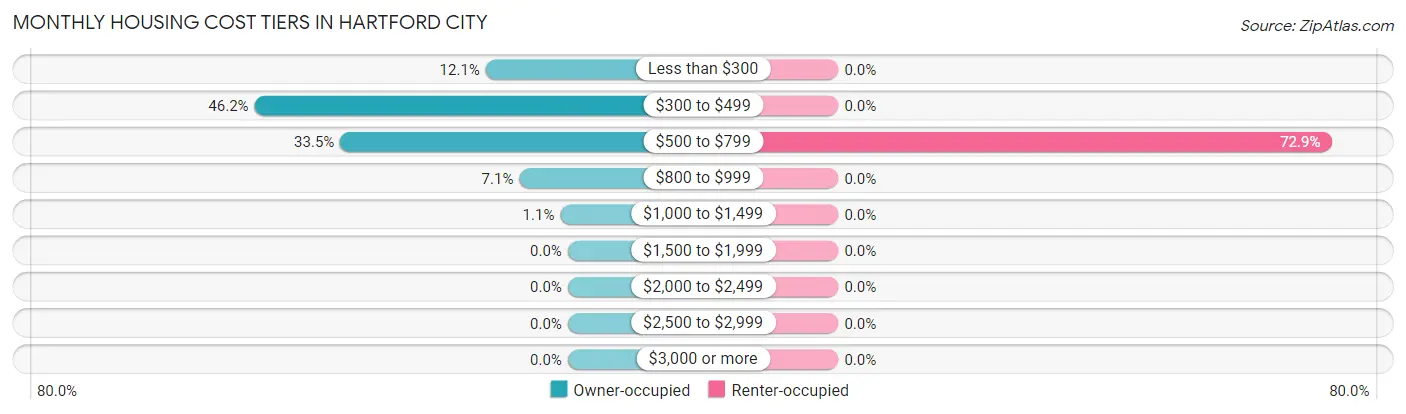
| Monthly Cost | Owner-occupied | Renter-occupied |
| Less than $300 | 22 (12.1%) | 0 (0.0%) |
| $300 to $499 | 84 (46.2%) | 0 (0.0%) |
| $500 to $799 | 61 (33.5%) | 43 (72.9%) |
| $800 to $999 | 13 (7.1%) | 0 (0.0%) |
| $1,000 to $1,499 | 2 (1.1%) | 0 (0.0%) |
| $1,500 to $1,999 | 0 (0.0%) | 0 (0.0%) |
| $2,000 to $2,499 | 0 (0.0%) | 0 (0.0%) |
| $2,500 to $2,999 | 0 (0.0%) | 0 (0.0%) |
| $3,000 or more | 0 (0.0%) | 0 (0.0%) |
| Total | 182 (100.0%) | 59 (100.0%) |
Physical Housing Characteristics in Hartford City
Housing Structures in Hartford City
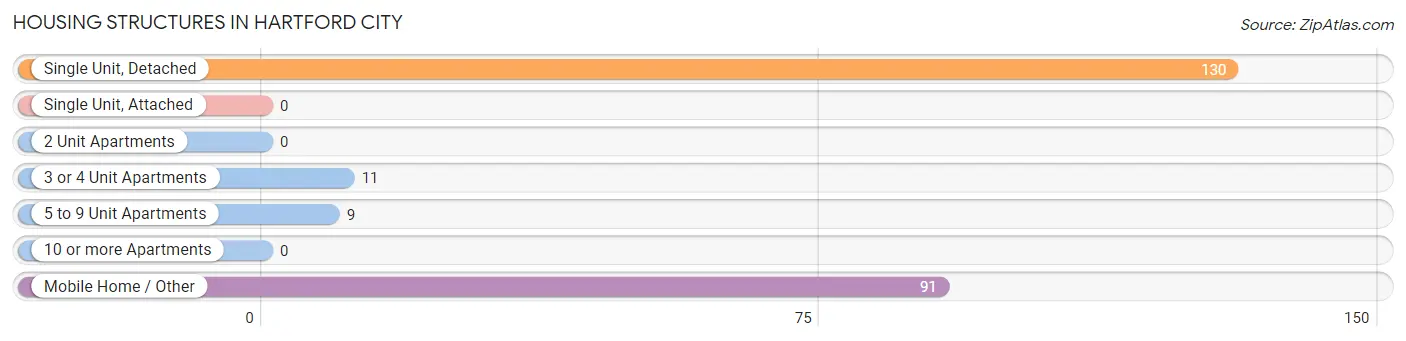
| Structure Type | # Housing Units | % Housing Units |
| Single Unit, Detached | 130 | 53.9% |
| Single Unit, Attached | 0 | 0.0% |
| 2 Unit Apartments | 0 | 0.0% |
| 3 or 4 Unit Apartments | 11 | 4.6% |
| 5 to 9 Unit Apartments | 9 | 3.7% |
| 10 or more Apartments | 0 | 0.0% |
| Mobile Home / Other | 91 | 37.8% |
| Total | 241 | 100.0% |
Housing Structures by Occupancy in Hartford City
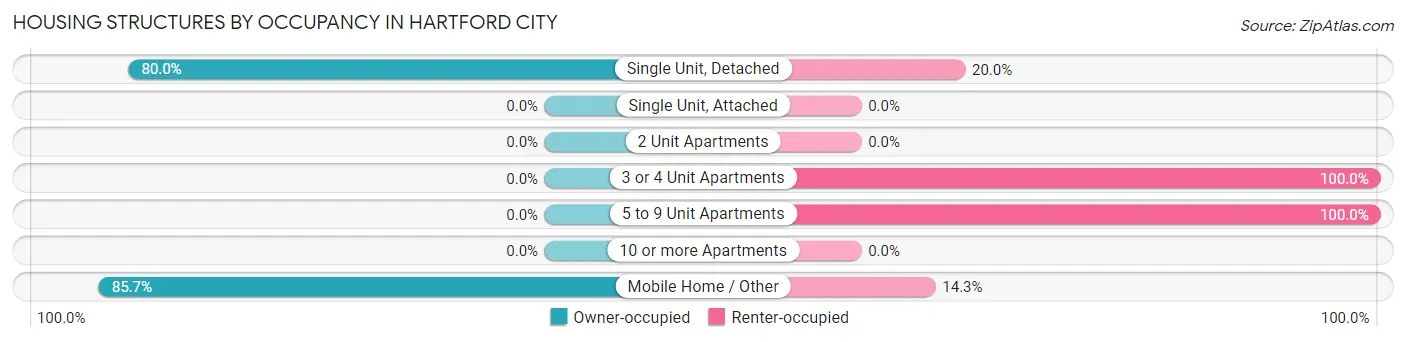
| Structure Type | Owner-occupied | Renter-occupied |
| Single Unit, Detached | 104 (80.0%) | 26 (20.0%) |
| Single Unit, Attached | 0 (0.0%) | 0 (0.0%) |
| 2 Unit Apartments | 0 (0.0%) | 0 (0.0%) |
| 3 or 4 Unit Apartments | 0 (0.0%) | 11 (100.0%) |
| 5 to 9 Unit Apartments | 0 (0.0%) | 9 (100.0%) |
| 10 or more Apartments | 0 (0.0%) | 0 (0.0%) |
| Mobile Home / Other | 78 (85.7%) | 13 (14.3%) |
| Total | 182 (75.5%) | 59 (24.5%) |
Housing Structures by Number of Rooms in Hartford City
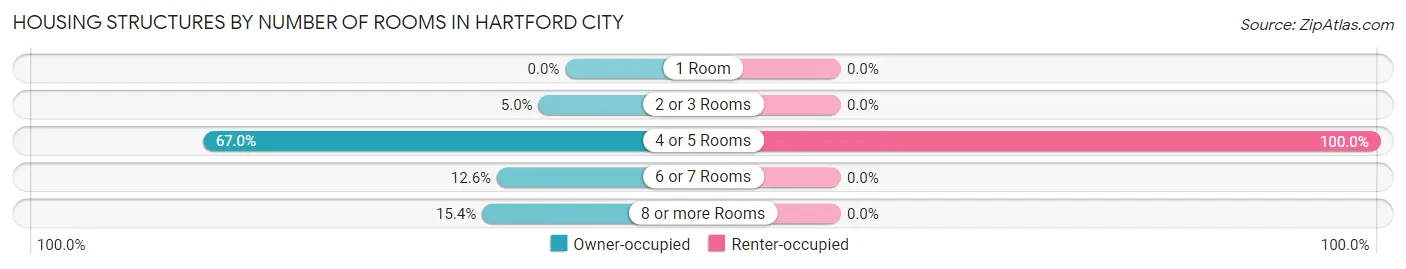
| Number of Rooms | Owner-occupied | Renter-occupied |
| 1 Room | 0 (0.0%) | 0 (0.0%) |
| 2 or 3 Rooms | 9 (5.0%) | 0 (0.0%) |
| 4 or 5 Rooms | 122 (67.0%) | 59 (100.0%) |
| 6 or 7 Rooms | 23 (12.6%) | 0 (0.0%) |
| 8 or more Rooms | 28 (15.4%) | 0 (0.0%) |
| Total | 182 (100.0%) | 59 (100.0%) |
Housing Structure by Heating Type in Hartford City
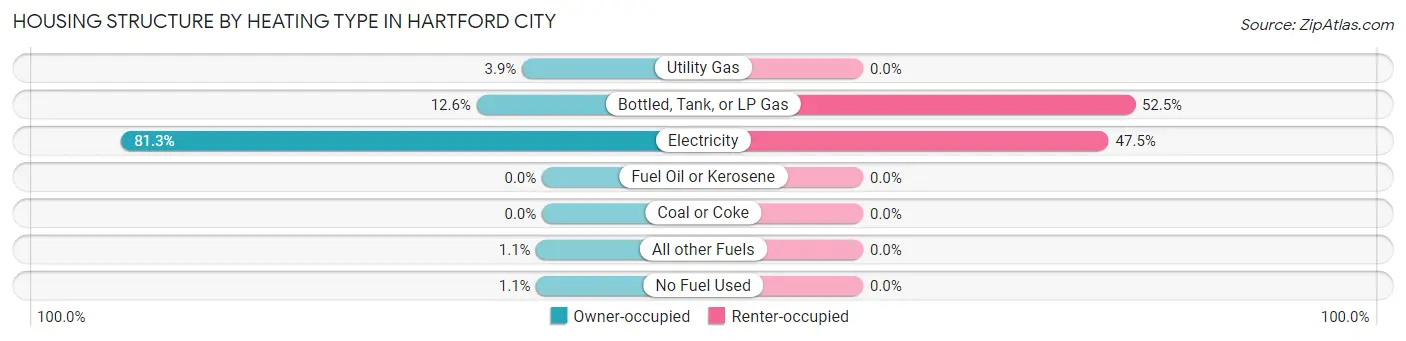
| Heating Type | Owner-occupied | Renter-occupied |
| Utility Gas | 7 (3.8%) | 0 (0.0%) |
| Bottled, Tank, or LP Gas | 23 (12.6%) | 31 (52.5%) |
| Electricity | 148 (81.3%) | 28 (47.5%) |
| Fuel Oil or Kerosene | 0 (0.0%) | 0 (0.0%) |
| Coal or Coke | 0 (0.0%) | 0 (0.0%) |
| All other Fuels | 2 (1.1%) | 0 (0.0%) |
| No Fuel Used | 2 (1.1%) | 0 (0.0%) |
| Total | 182 (100.0%) | 59 (100.0%) |
Household Vehicle Usage in Hartford City
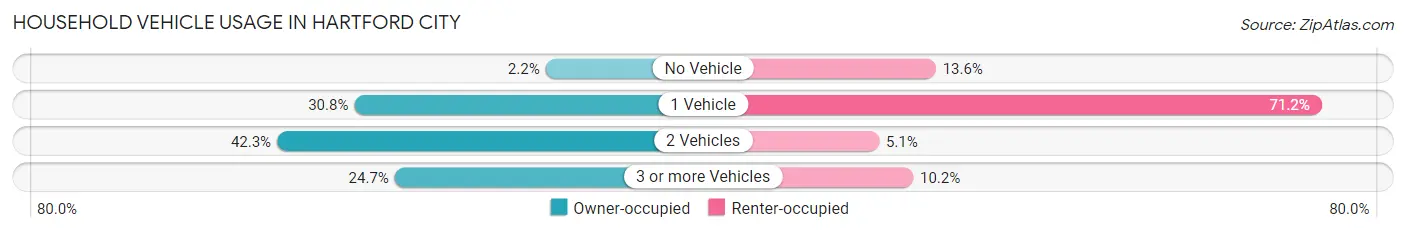
| Vehicles per Household | Owner-occupied | Renter-occupied |
| No Vehicle | 4 (2.2%) | 8 (13.6%) |
| 1 Vehicle | 56 (30.8%) | 42 (71.2%) |
| 2 Vehicles | 77 (42.3%) | 3 (5.1%) |
| 3 or more Vehicles | 45 (24.7%) | 6 (10.2%) |
| Total | 182 (100.0%) | 59 (100.0%) |
Real Estate & Mortgages in Hartford City
Real Estate and Mortgage Overview in Hartford City
| Characteristic | Without Mortgage | With Mortgage |
| Housing Units | 147 | 35 |
| Median Property Value | $66,500 | $112,500 |
| Median Household Income | $34,856 | $0 |
| Monthly Housing Costs | $452 | $0 |
| Real Estate Taxes | $407 | $2 |
Property Value by Mortgage Status in Hartford City
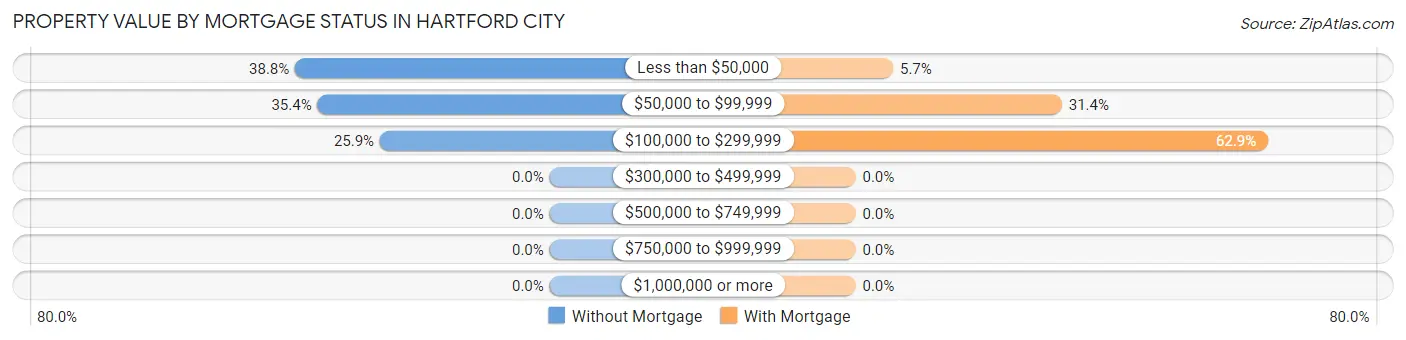
| Property Value | Without Mortgage | With Mortgage |
| Less than $50,000 | 57 (38.8%) | 2 (5.7%) |
| $50,000 to $99,999 | 52 (35.4%) | 11 (31.4%) |
| $100,000 to $299,999 | 38 (25.9%) | 22 (62.9%) |
| $300,000 to $499,999 | 0 (0.0%) | 0 (0.0%) |
| $500,000 to $749,999 | 0 (0.0%) | 0 (0.0%) |
| $750,000 to $999,999 | 0 (0.0%) | 0 (0.0%) |
| $1,000,000 or more | 0 (0.0%) | 0 (0.0%) |
| Total | 147 (100.0%) | 35 (100.0%) |
Household Income by Mortgage Status in Hartford City
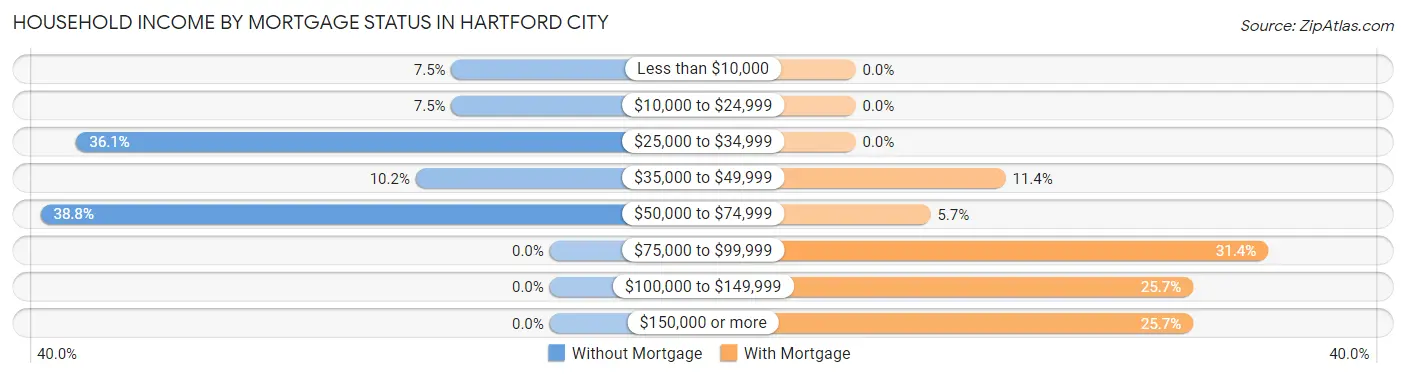
| Household Income | Without Mortgage | With Mortgage |
| Less than $10,000 | 11 (7.5%) | 0 (0.0%) |
| $10,000 to $24,999 | 11 (7.5%) | 0 (0.0%) |
| $25,000 to $34,999 | 53 (36.0%) | 0 (0.0%) |
| $35,000 to $49,999 | 15 (10.2%) | 4 (11.4%) |
| $50,000 to $74,999 | 57 (38.8%) | 2 (5.7%) |
| $75,000 to $99,999 | 0 (0.0%) | 11 (31.4%) |
| $100,000 to $149,999 | 0 (0.0%) | 9 (25.7%) |
| $150,000 or more | 0 (0.0%) | 9 (25.7%) |
| Total | 147 (100.0%) | 35 (100.0%) |
Property Value to Household Income Ratio in Hartford City
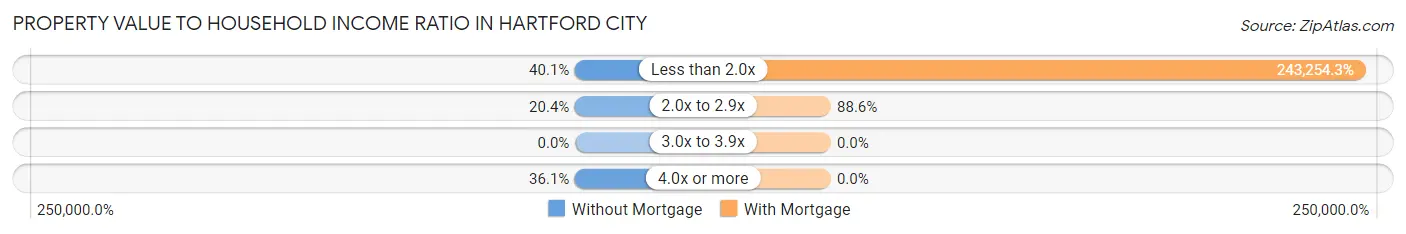
| Value-to-Income Ratio | Without Mortgage | With Mortgage |
| Less than 2.0x | 59 (40.1%) | 85,139 (243,254.3%) |
| 2.0x to 2.9x | 30 (20.4%) | 31 (88.6%) |
| 3.0x to 3.9x | 0 (0.0%) | 0 (0.0%) |
| 4.0x or more | 53 (36.0%) | 0 (0.0%) |
| Total | 147 (100.0%) | 35 (100.0%) |
Real Estate Taxes by Mortgage Status in Hartford City
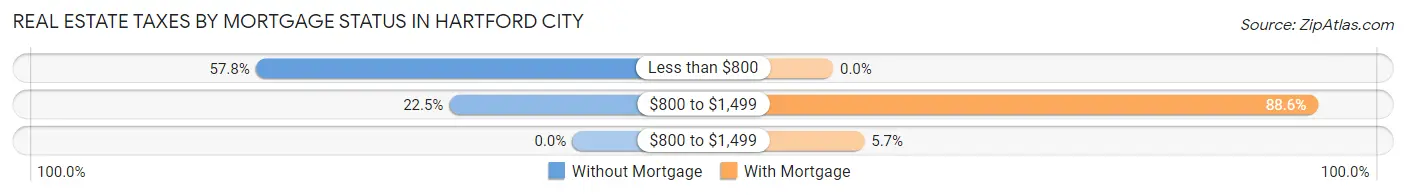
| Property Taxes | Without Mortgage | With Mortgage |
| Less than $800 | 85 (57.8%) | 0 (0.0%) |
| $800 to $1,499 | 33 (22.5%) | 31 (88.6%) |
| $800 to $1,499 | 0 (0.0%) | 2 (5.7%) |
| Total | 147 (100.0%) | 35 (100.0%) |
Health & Disability in Hartford City
Health Insurance Coverage by Age in Hartford City
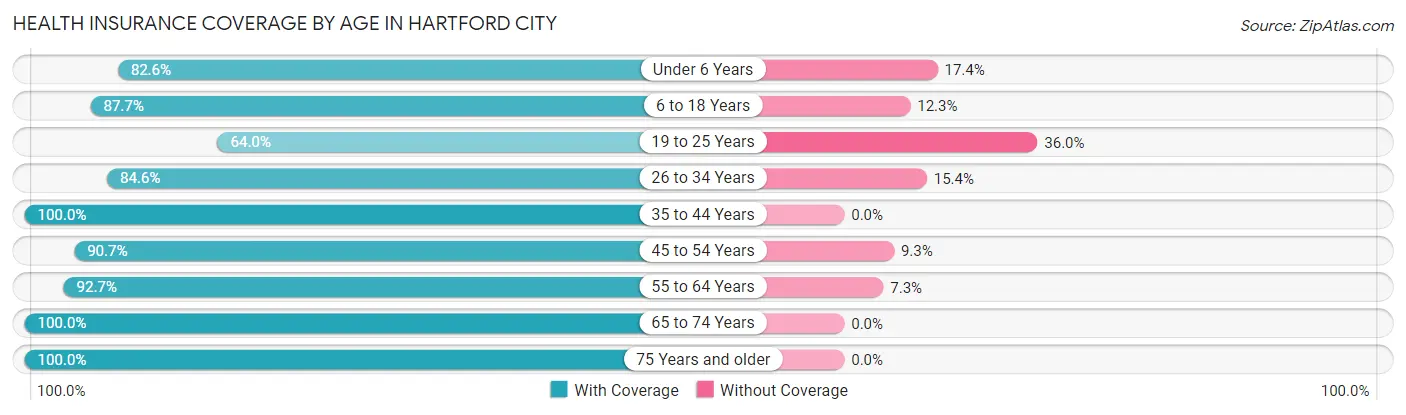
| Age Bracket | With Coverage | Without Coverage |
| Under 6 Years | 19 (82.6%) | 4 (17.4%) |
| 6 to 18 Years | 114 (87.7%) | 16 (12.3%) |
| 19 to 25 Years | 32 (64.0%) | 18 (36.0%) |
| 26 to 34 Years | 22 (84.6%) | 4 (15.4%) |
| 35 to 44 Years | 40 (100.0%) | 0 (0.0%) |
| 45 to 54 Years | 49 (90.7%) | 5 (9.3%) |
| 55 to 64 Years | 140 (92.7%) | 11 (7.3%) |
| 65 to 74 Years | 44 (100.0%) | 0 (0.0%) |
| 75 Years and older | 68 (100.0%) | 0 (0.0%) |
| Total | 528 (90.1%) | 58 (9.9%) |
Health Insurance Coverage by Citizenship Status in Hartford City
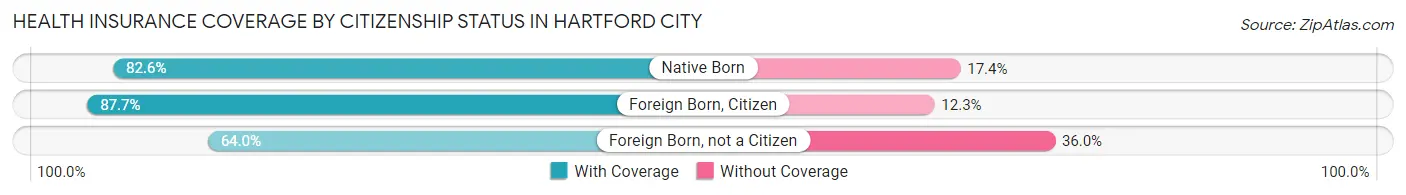
| Citizenship Status | With Coverage | Without Coverage |
| Native Born | 19 (82.6%) | 4 (17.4%) |
| Foreign Born, Citizen | 114 (87.7%) | 16 (12.3%) |
| Foreign Born, not a Citizen | 32 (64.0%) | 18 (36.0%) |
Health Insurance Coverage by Household Income in Hartford City
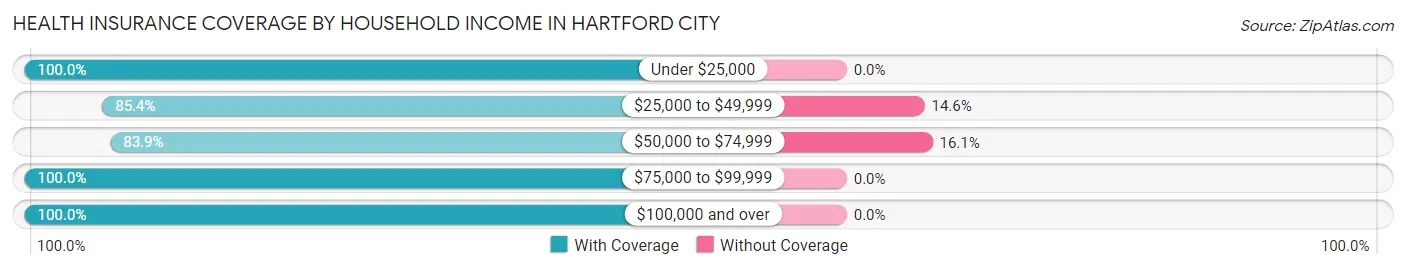
| Household Income | With Coverage | Without Coverage |
| Under $25,000 | 67 (100.0%) | 0 (0.0%) |
| $25,000 to $49,999 | 211 (85.4%) | 36 (14.6%) |
| $50,000 to $74,999 | 115 (83.9%) | 22 (16.1%) |
| $75,000 to $99,999 | 38 (100.0%) | 0 (0.0%) |
| $100,000 and over | 97 (100.0%) | 0 (0.0%) |
Public vs Private Health Insurance Coverage by Age in Hartford City

| Age Bracket | Public Insurance | Private Insurance |
| Under 6 | 4 (17.4%) | 19 (82.6%) |
| 6 to 18 Years | 99 (76.1%) | 29 (22.3%) |
| 19 to 25 Years | 0 (0.0%) | 32 (64.0%) |
| 25 to 34 Years | 5 (19.2%) | 17 (65.4%) |
| 35 to 44 Years | 11 (27.5%) | 29 (72.5%) |
| 45 to 54 Years | 22 (40.7%) | 27 (50.0%) |
| 55 to 64 Years | 54 (35.8%) | 95 (62.9%) |
| 65 to 74 Years | 39 (88.6%) | 26 (59.1%) |
| 75 Years and over | 68 (100.0%) | 63 (92.6%) |
| Total | 302 (51.5%) | 337 (57.5%) |
Disability Status by Sex by Age in Hartford City
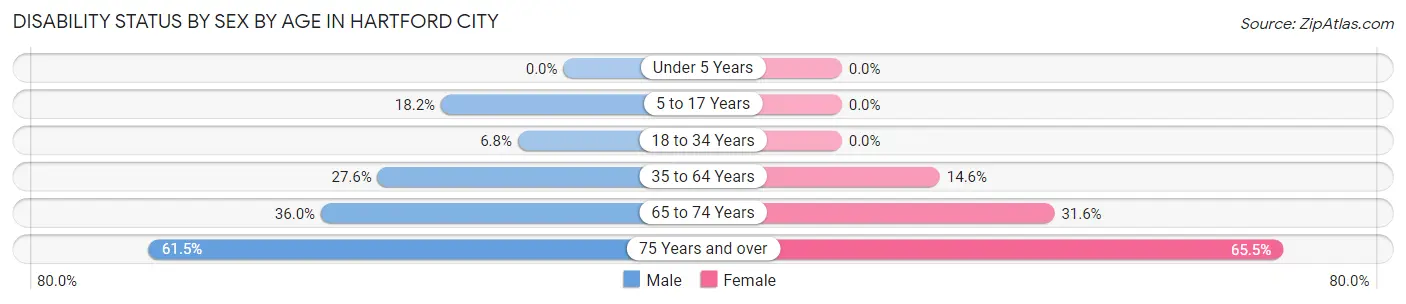
| Age Bracket | Male | Female |
| Under 5 Years | 0 (0.0%) | 0 (0.0%) |
| 5 to 17 Years | 14 (18.2%) | 0 (0.0%) |
| 18 to 34 Years | 5 (6.8%) | 0 (0.0%) |
| 35 to 64 Years | 24 (27.6%) | 23 (14.6%) |
| 65 to 74 Years | 9 (36.0%) | 6 (31.6%) |
| 75 Years and over | 24 (61.5%) | 19 (65.5%) |
Disability Class by Sex by Age in Hartford City
Disability Class: Hearing Difficulty
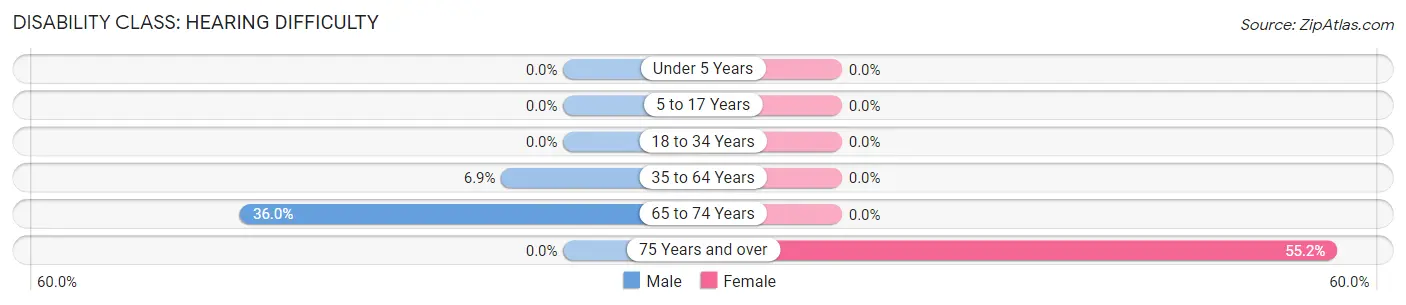
| Age Bracket | Male | Female |
| Under 5 Years | 0 (0.0%) | 0 (0.0%) |
| 5 to 17 Years | 0 (0.0%) | 0 (0.0%) |
| 18 to 34 Years | 0 (0.0%) | 0 (0.0%) |
| 35 to 64 Years | 6 (6.9%) | 0 (0.0%) |
| 65 to 74 Years | 9 (36.0%) | 0 (0.0%) |
| 75 Years and over | 0 (0.0%) | 16 (55.2%) |
Disability Class: Vision Difficulty
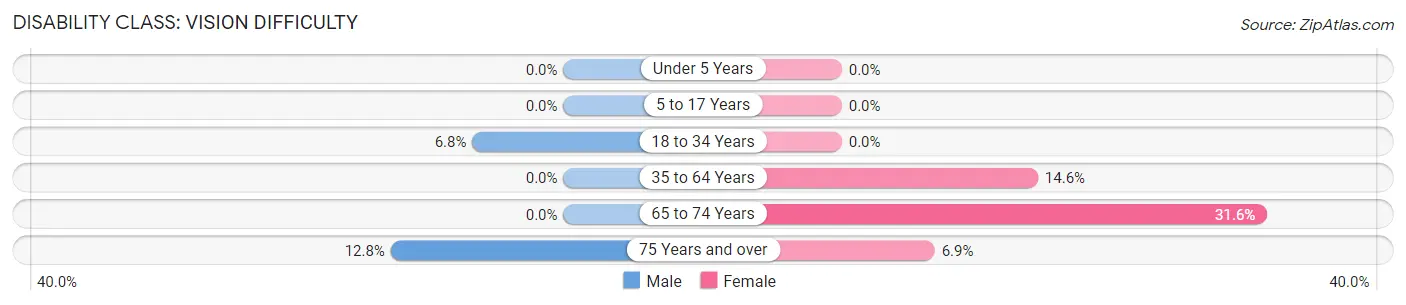
| Age Bracket | Male | Female |
| Under 5 Years | 0 (0.0%) | 0 (0.0%) |
| 5 to 17 Years | 0 (0.0%) | 0 (0.0%) |
| 18 to 34 Years | 5 (6.8%) | 0 (0.0%) |
| 35 to 64 Years | 0 (0.0%) | 23 (14.6%) |
| 65 to 74 Years | 0 (0.0%) | 6 (31.6%) |
| 75 Years and over | 5 (12.8%) | 2 (6.9%) |
Disability Class: Cognitive Difficulty
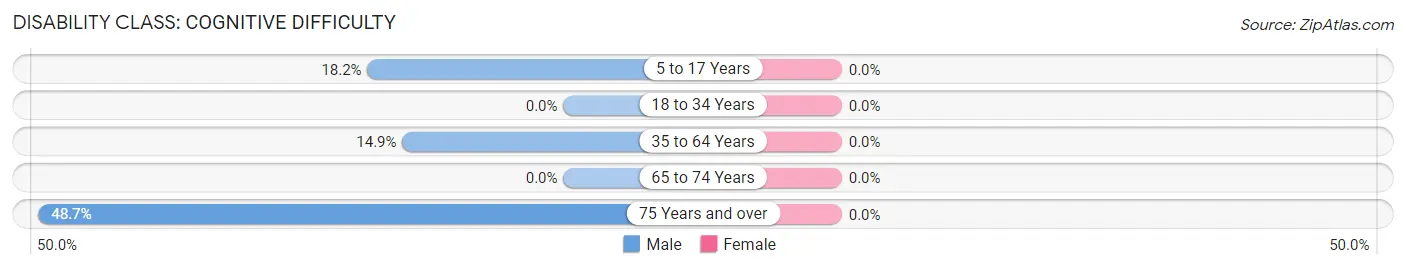
| Age Bracket | Male | Female |
| 5 to 17 Years | 14 (18.2%) | 0 (0.0%) |
| 18 to 34 Years | 0 (0.0%) | 0 (0.0%) |
| 35 to 64 Years | 13 (14.9%) | 0 (0.0%) |
| 65 to 74 Years | 0 (0.0%) | 0 (0.0%) |
| 75 Years and over | 19 (48.7%) | 0 (0.0%) |
Disability Class: Ambulatory Difficulty
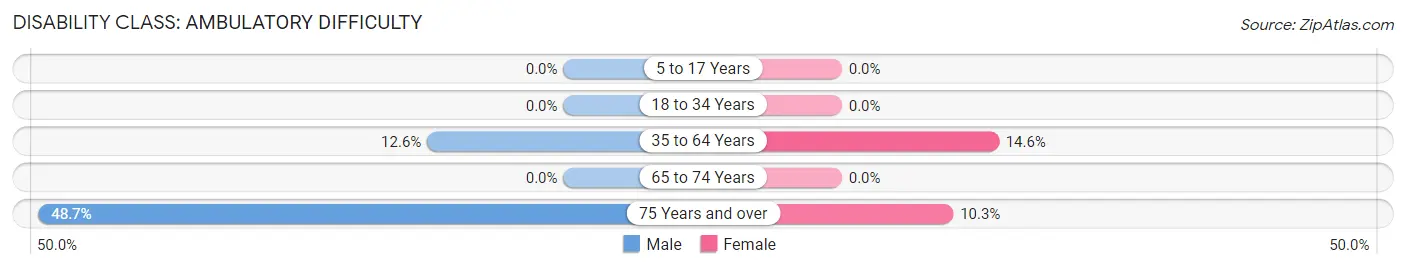
| Age Bracket | Male | Female |
| 5 to 17 Years | 0 (0.0%) | 0 (0.0%) |
| 18 to 34 Years | 0 (0.0%) | 0 (0.0%) |
| 35 to 64 Years | 11 (12.6%) | 23 (14.6%) |
| 65 to 74 Years | 0 (0.0%) | 0 (0.0%) |
| 75 Years and over | 19 (48.7%) | 3 (10.3%) |
Disability Class: Self-Care Difficulty
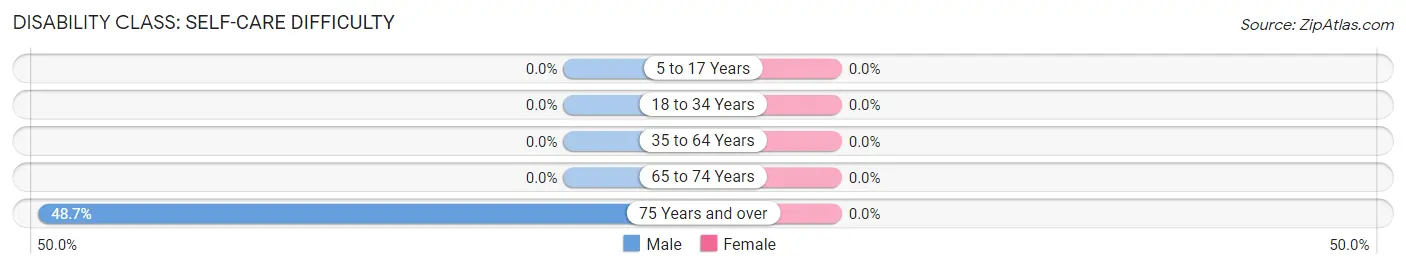
| Age Bracket | Male | Female |
| 5 to 17 Years | 0 (0.0%) | 0 (0.0%) |
| 18 to 34 Years | 0 (0.0%) | 0 (0.0%) |
| 35 to 64 Years | 0 (0.0%) | 0 (0.0%) |
| 65 to 74 Years | 0 (0.0%) | 0 (0.0%) |
| 75 Years and over | 19 (48.7%) | 0 (0.0%) |
Technology Access in Hartford City
Computing Device Access in Hartford City
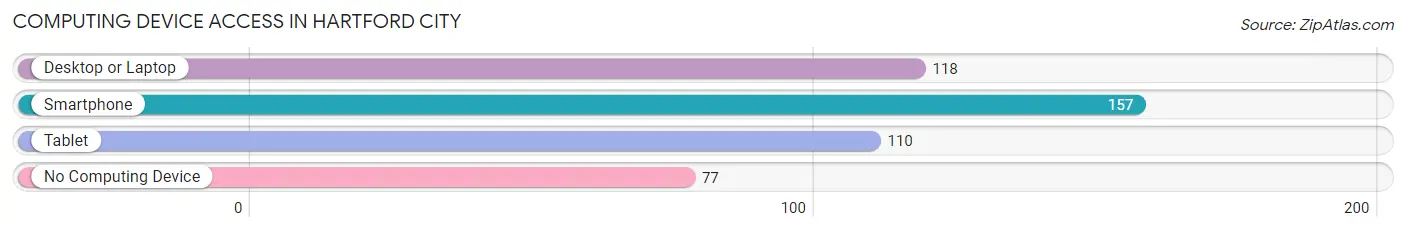
| Device Type | # Households | % Households |
| Desktop or Laptop | 118 | 49.0% |
| Smartphone | 157 | 65.1% |
| Tablet | 110 | 45.6% |
| No Computing Device | 77 | 32.0% |
| Total | 241 | 100.0% |
Internet Access in Hartford City
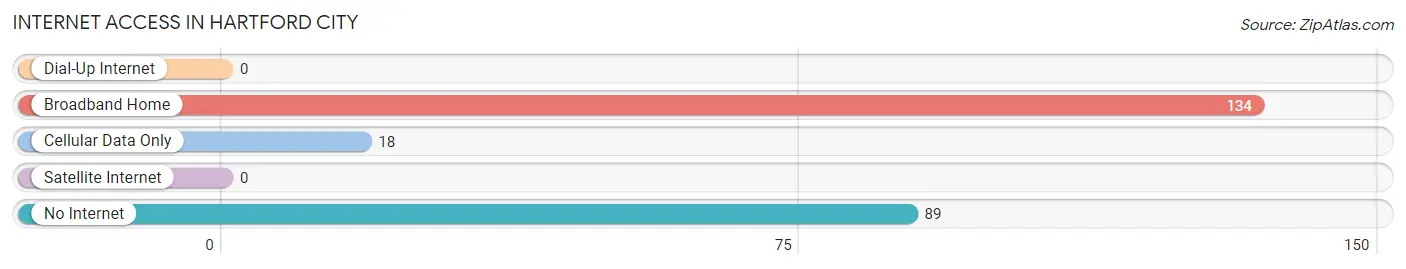
| Internet Type | # Households | % Households |
| Dial-Up Internet | 0 | 0.0% |
| Broadband Home | 134 | 55.6% |
| Cellular Data Only | 18 | 7.5% |
| Satellite Internet | 0 | 0.0% |
| No Internet | 89 | 36.9% |
| Total | 241 | 100.0% |
Hartford City Summary
Hartford City is a small town located in the northern panhandle of West Virginia. It is situated in the Ohio River Valley, and is the county seat of Tyler County. The town has a population of 1,845 people, according to the 2010 census.
History
Hartford City was founded in 1848 by a group of settlers from Hartford, Connecticut. The town was named after the Connecticut city, and was incorporated in 1853. The town was originally a farming community, but soon developed into a manufacturing center. The first industry in the town was a woolen mill, which was established in 1854. The mill was followed by a sawmill, a gristmill, and a tannery.
In the late 19th century, Hartford City became a major center for oil and gas production. The town was home to several oil refineries, and was the site of the first oil well in West Virginia. The oil industry brought a great deal of wealth to the town, and many of the town's buildings were constructed during this period.
Geography
Hartford City is located in the northern panhandle of West Virginia, in the Ohio River Valley. The town is situated on the banks of the Ohio River, and is surrounded by rolling hills and forests. The town is located about 30 miles south of Wheeling, West Virginia, and about 60 miles north of Pittsburgh, Pennsylvania.
The climate in Hartford City is humid continental, with hot summers and cold winters. The average annual temperature is around 50 degrees Fahrenheit, and the average annual precipitation is around 40 inches.
Economy
The economy of Hartford City is largely based on manufacturing and tourism. The town is home to several manufacturing companies, including a steel mill, a paper mill, and a plastics factory. The town is also home to several tourist attractions, including a historic downtown area, a museum, and a state park.
The town is also home to several small businesses, including restaurants, shops, and other services. The town is served by several major highways, including Interstate 70 and US Route 250.
Demographics
According to the 2010 census, the population of Hartford City was 1,845 people. The racial makeup of the town was 95.3% White, 1.2% African American, 0.3% Native American, 0.3% Asian, 0.1% Pacific Islander, and 2.8% from other races. The median household income was $30,938, and the median family income was $37,813.
Conclusion
Hartford City is a small town located in the northern panhandle of West Virginia. It is situated in the Ohio River Valley, and is the county seat of Tyler County. The town has a population of 1,845 people, according to the 2010 census. The economy of Hartford City is largely based on manufacturing and tourism, and the town is home to several tourist attractions. The racial makeup of the town is predominantly white, with a small percentage of African Americans, Native Americans, Asians, and Pacific Islanders.
Common Questions
What is the Total Population of Hartford City?
Total Population of Hartford City is 586.
What is the Total Male Population of Hartford City?
Total Male Population of Hartford City is 306.
What is the Total Female Population of Hartford City?
Total Female Population of Hartford City is 280.
What is the Ratio of Males per 100 Females in Hartford City?
There are 109.29 Males per 100 Females in Hartford City.
What is the Ratio of Females per 100 Males in Hartford City?
There are 91.50 Females per 100 Males in Hartford City.
What is the Median Population Age in Hartford City?
Median Population Age in Hartford City is 46.8 Years.
What is the Average Family Size in Hartford City
Average Family Size in Hartford City is 2.9 People.
What is the Average Household Size in Hartford City
Average Household Size in Hartford City is 2.4 People.
What is Per Capita Income in Hartford City?
Per Capita income in Hartford City is $23,727.
What is the Median Family Income in Hartford City?
Median Family Income in Hartford City is $55,526.
What is the Median Household income in Hartford City?
Median Household Income in Hartford City is $50,114.
What is Inequality or Gini Index in Hartford City?
Inequality or Gini Index in Hartford City is 0.37.
How Large is the Labor Force in Hartford City?
There are 234 People in the Labor Forcein in Hartford City.
What is the Percentage of People in the Labor Force in Hartford City?
50.0% of People are in the Labor Force in Hartford City.
What is the Unemployment Rate in Hartford City?
Unemployment Rate in Hartford City is 2.6%.