Wyoming County, WV
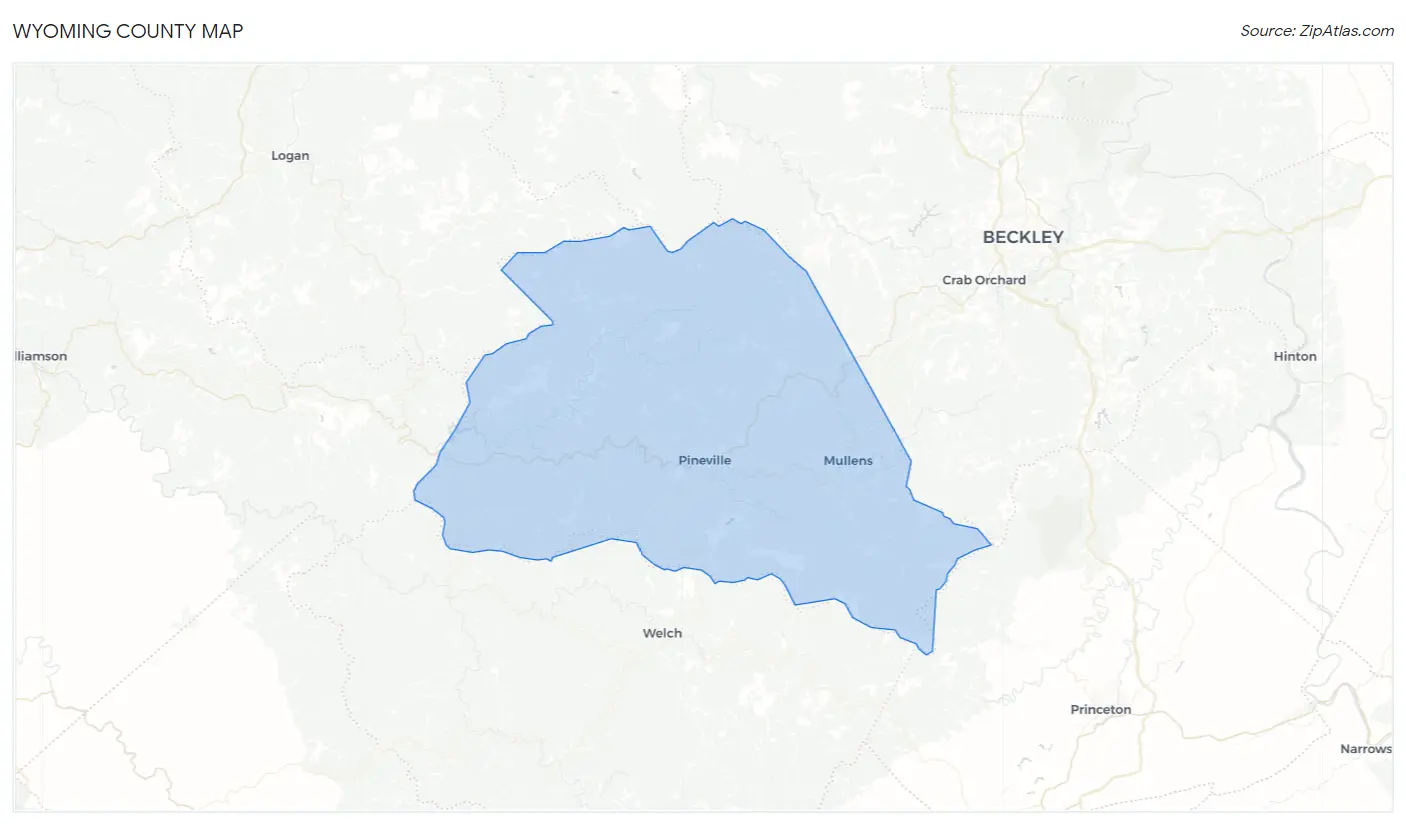
Wyoming County Map
Wyoming County Overview
21,237
TOTAL POPULATION
10,650
MALE POPULATION
10,587
FEMALE POPULATION
100.60
MALES / 100 FEMALES
99.41
FEMALES / 100 MALES
45.4
MEDIAN AGE
3.2
AVG FAMILY SIZE
2.7
AVG HOUSEHOLD SIZE
$22,818
PER CAPITA INCOME
$51,001
AVG FAMILY INCOME
$44,510
AVG HOUSEHOLD INCOME
28.1%
WAGE / INCOME GAP [ % ]
71.9¢/ $1
WAGE / INCOME GAP [ $ ]
$8,729
FAMILY INCOME DEFICIT
0.46
INEQUALITY / GINI INDEX
6,560
LABOR FORCE [ PEOPLE ]
37.3%
PERCENT IN LABOR FORCE
6.4%
UNEMPLOYMENT RATE
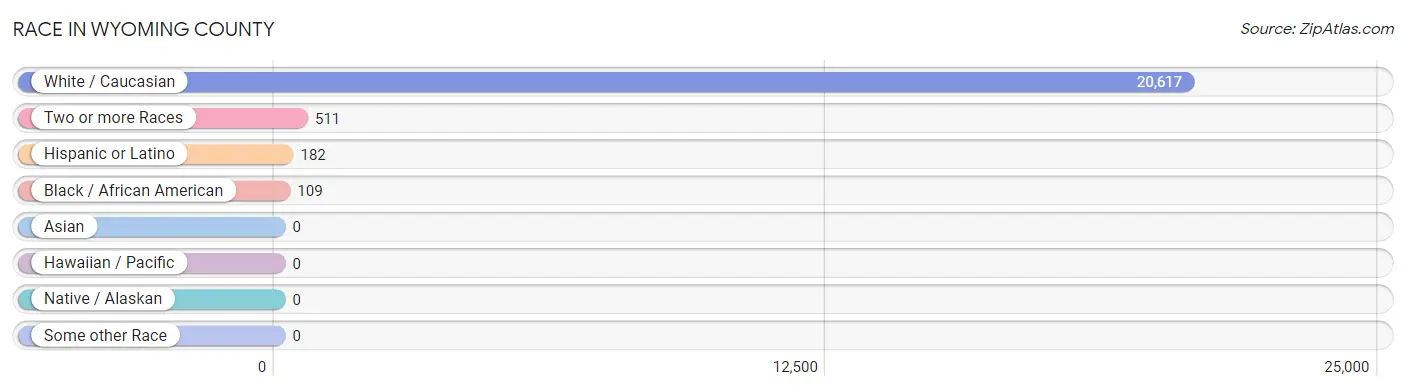
Race in Wyoming County
The most populous races in Wyoming County are White / Caucasian (20,617 | 97.1%), Two or more Races (511 | 2.4%), and Hispanic or Latino (182 | 0.9%).
| Race | # Population | % Population |
| Asian | 0 | 0.0% |
| Black / African American | 109 | 0.5% |
| Hawaiian / Pacific | 0 | 0.0% |
| Hispanic or Latino | 182 | 0.9% |
| Native / Alaskan | 0 | 0.0% |
| White / Caucasian | 20,617 | 97.1% |
| Two or more Races | 511 | 2.4% |
| Some other Race | 0 | 0.0% |
| Total | 21,237 | 100.0% |
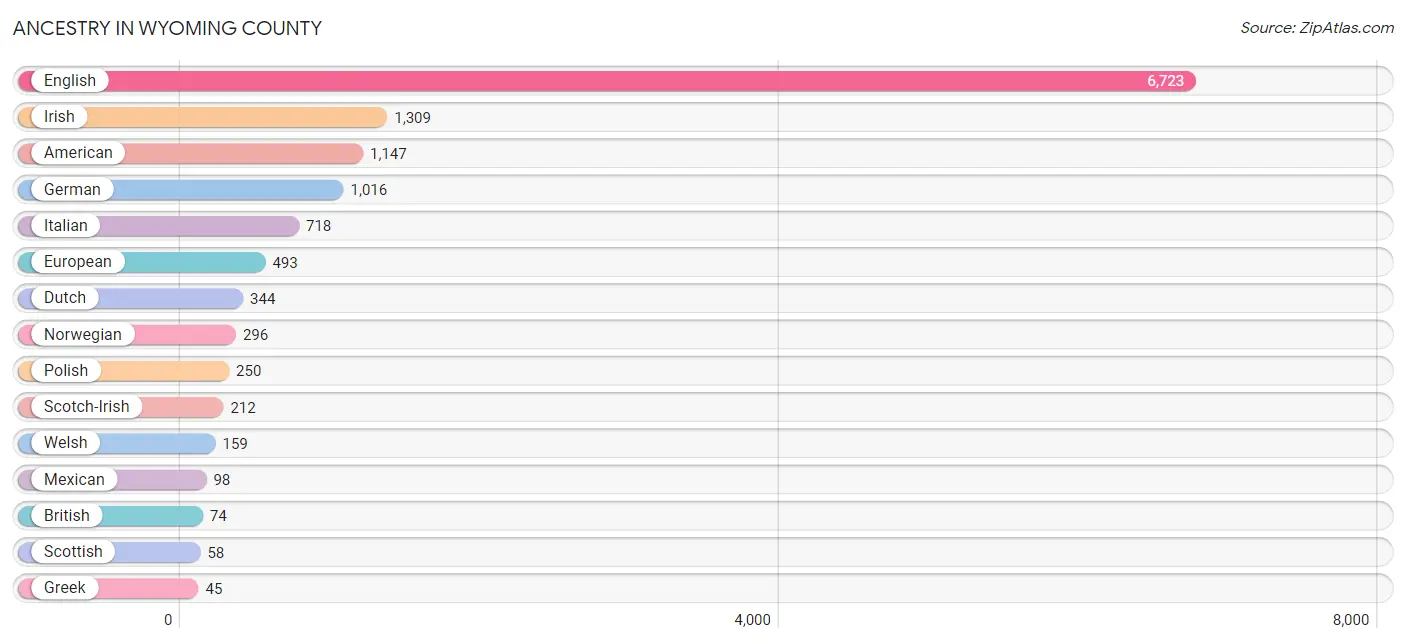
Ancestry in Wyoming County
The most populous ancestries reported in Wyoming County are English (6,723 | 31.7%), Irish (1,309 | 6.2%), American (1,147 | 5.4%), German (1,016 | 4.8%), and Italian (718 | 3.4%), together accounting for 51.4% of all Wyoming County residents.
| Ancestry | # Population | % Population |
| American | 1,147 | 5.4% |
| Blackfeet | 42 | 0.2% |
| British | 74 | 0.4% |
| Cajun | 32 | 0.2% |
| Croatian | 2 | 0.0% |
| Czech | 2 | 0.0% |
| Dominican | 44 | 0.2% |
| Dutch | 344 | 1.6% |
| Eastern European | 4 | 0.0% |
| English | 6,723 | 31.7% |
| European | 493 | 2.3% |
| French | 23 | 0.1% |
| German | 1,016 | 4.8% |
| Greek | 45 | 0.2% |
| Irish | 1,309 | 6.2% |
| Italian | 718 | 3.4% |
| Mexican | 98 | 0.5% |
| Norwegian | 296 | 1.4% |
| Polish | 250 | 1.2% |
| Russian | 11 | 0.1% |
| Scotch-Irish | 212 | 1.0% |
| Scottish | 58 | 0.3% |
| Spaniard | 40 | 0.2% |
| Swedish | 6 | 0.0% |
| Swiss | 22 | 0.1% |
| Welsh | 159 | 0.7% | View All 26 Rows |
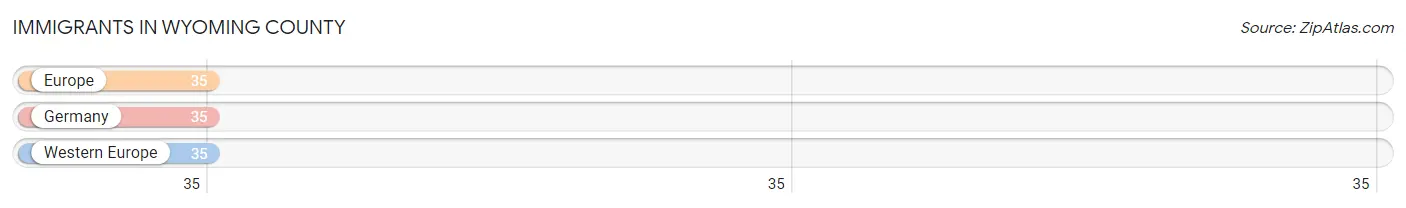
Immigrants in Wyoming County
The most numerous immigrant groups reported in Wyoming County came from Europe (35 | 0.2%), Germany (35 | 0.2%), and Western Europe (35 | 0.2%), together accounting for 0.5% of all Wyoming County residents.
| Immigration Origin | # Population | % Population |
| Europe | 35 | 0.2% |
| Germany | 35 | 0.2% |
| Western Europe | 35 | 0.2% | View All 3 Rows |
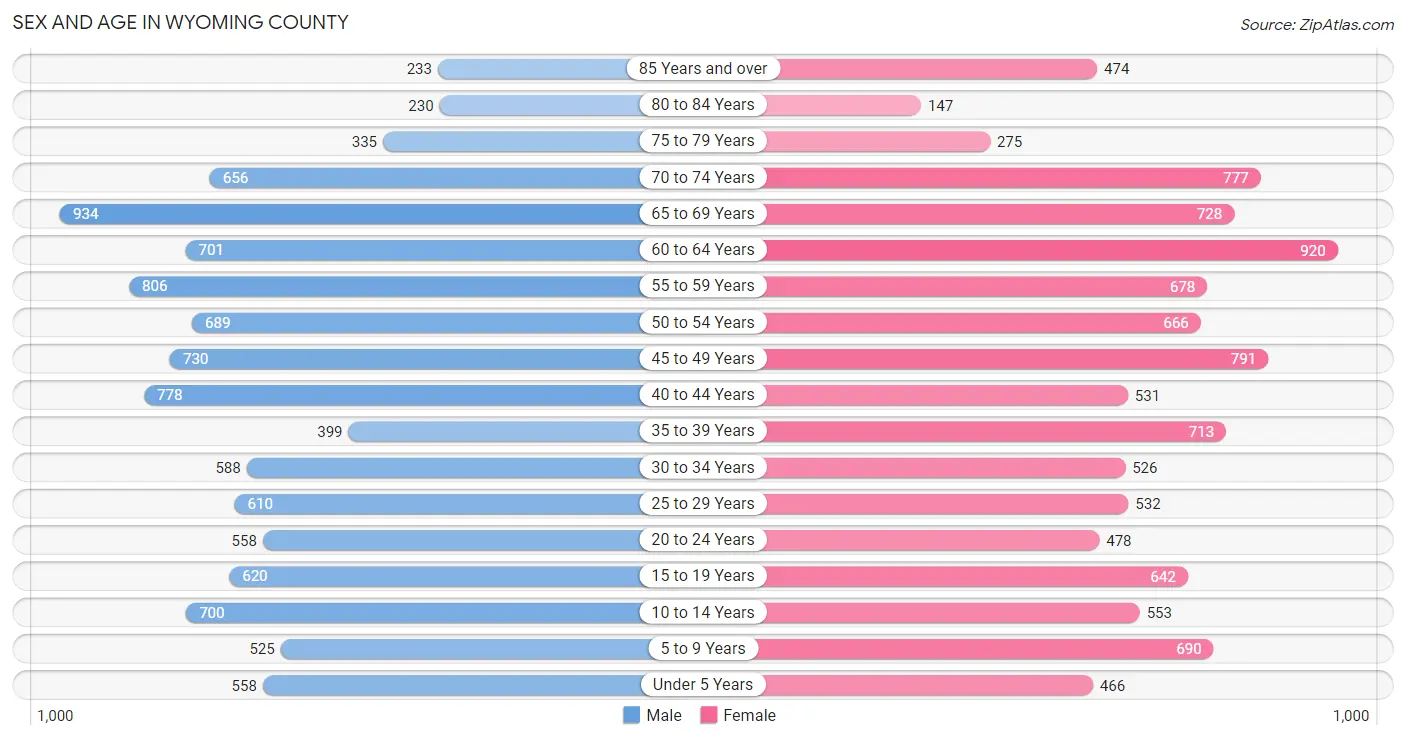
Sex and Age in Wyoming County
Sex and Age in Wyoming County
The most populous age groups in Wyoming County are 65 to 69 Years (934 | 8.8%) for men and 60 to 64 Years (920 | 8.7%) for women.
| Age Bracket | Male | Female |
| Under 5 Years | 558 (5.2%) | 466 (4.4%) |
| 5 to 9 Years | 525 (4.9%) | 690 (6.5%) |
| 10 to 14 Years | 700 (6.6%) | 553 (5.2%) |
| 15 to 19 Years | 620 (5.8%) | 642 (6.1%) |
| 20 to 24 Years | 558 (5.2%) | 478 (4.5%) |
| 25 to 29 Years | 610 (5.7%) | 532 (5.0%) |
| 30 to 34 Years | 588 (5.5%) | 526 (5.0%) |
| 35 to 39 Years | 399 (3.7%) | 713 (6.7%) |
| 40 to 44 Years | 778 (7.3%) | 531 (5.0%) |
| 45 to 49 Years | 730 (6.9%) | 791 (7.5%) |
| 50 to 54 Years | 689 (6.5%) | 666 (6.3%) |
| 55 to 59 Years | 806 (7.6%) | 678 (6.4%) |
| 60 to 64 Years | 701 (6.6%) | 920 (8.7%) |
| 65 to 69 Years | 934 (8.8%) | 728 (6.9%) |
| 70 to 74 Years | 656 (6.2%) | 777 (7.3%) |
| 75 to 79 Years | 335 (3.2%) | 275 (2.6%) |
| 80 to 84 Years | 230 (2.2%) | 147 (1.4%) |
| 85 Years and over | 233 (2.2%) | 474 (4.5%) |
| Total | 10,650 (100.0%) | 10,587 (100.0%) |
Families and Households in Wyoming County
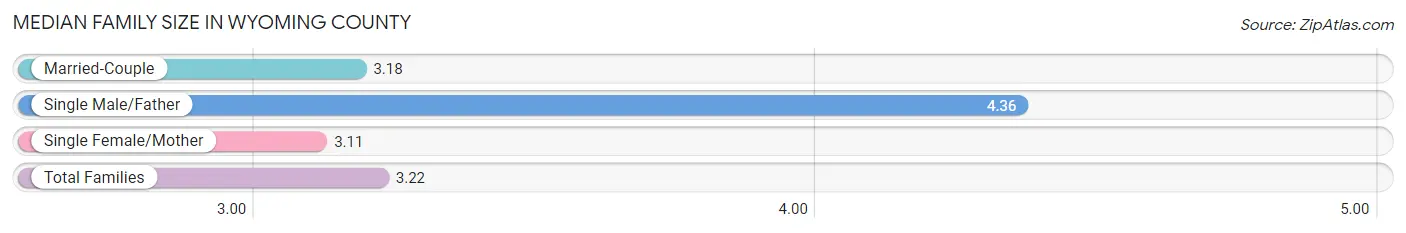
Median Family Size in Wyoming County
The median family size in Wyoming County is 3.22 persons per family, with single male/father families (276 | 4.9%) accounting for the largest median family size of 4.36 persons per family. On the other hand, single female/mother families (1,101 | 19.6%) represent the smallest median family size with 3.11 persons per family.
| Family Type | # Families | Family Size |
| Married-Couple | 4,247 (75.5%) | 3.18 |
| Single Male/Father | 276 (4.9%) | 4.36 |
| Single Female/Mother | 1,101 (19.6%) | 3.11 |
| Total Families | 5,624 (100.0%) | 3.22 |
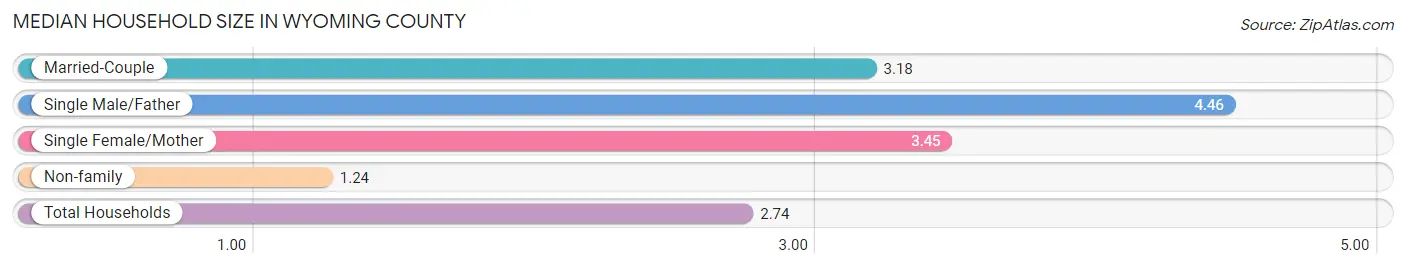
Median Household Size in Wyoming County
The median household size in Wyoming County is 2.74 persons per household, with single male/father households (276 | 3.6%) accounting for the largest median household size of 4.46 persons per household. non-family households (2,100 | 27.2%) represent the smallest median household size with 1.24 persons per household.
| Household Type | # Households | Household Size |
| Married-Couple | 4,247 (55.0%) | 3.18 |
| Single Male/Father | 276 (3.6%) | 4.46 |
| Single Female/Mother | 1,101 (14.2%) | 3.45 |
| Non-family | 2,100 (27.2%) | 1.24 |
| Total Households | 7,724 (100.0%) | 2.74 |
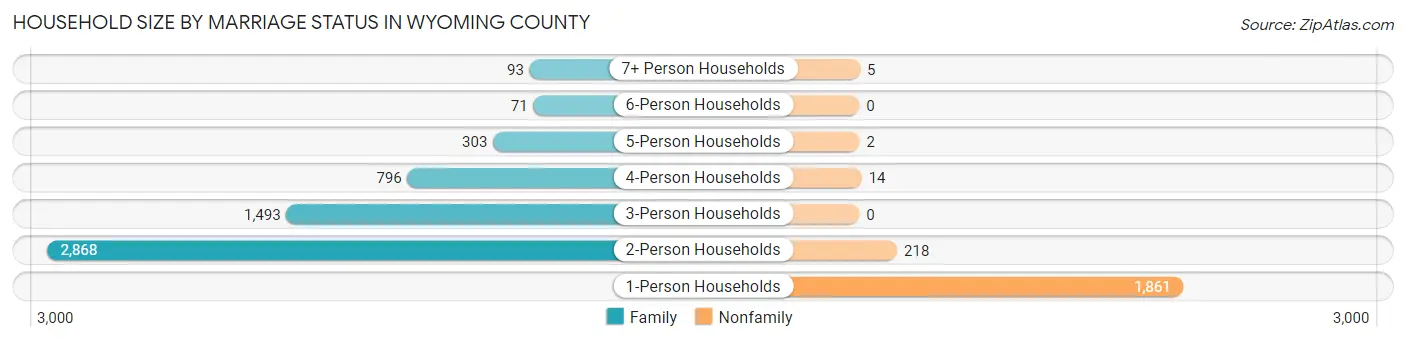
Household Size by Marriage Status in Wyoming County
Out of a total of 7,724 households in Wyoming County, 5,624 (72.8%) are family households, while 2,100 (27.2%) are nonfamily households. The most numerous type of family households are 2-person households, comprising 2,868, and the most common type of nonfamily households are 1-person households, comprising 1,861.
| Household Size | Family Households | Nonfamily Households |
| 1-Person Households | - | 1,861 (24.1%) |
| 2-Person Households | 2,868 (37.1%) | 218 (2.8%) |
| 3-Person Households | 1,493 (19.3%) | 0 (0.0%) |
| 4-Person Households | 796 (10.3%) | 14 (0.2%) |
| 5-Person Households | 303 (3.9%) | 2 (0.0%) |
| 6-Person Households | 71 (0.9%) | 0 (0.0%) |
| 7+ Person Households | 93 (1.2%) | 5 (0.1%) |
| Total | 5,624 (72.8%) | 2,100 (27.2%) |
Female Fertility in Wyoming County
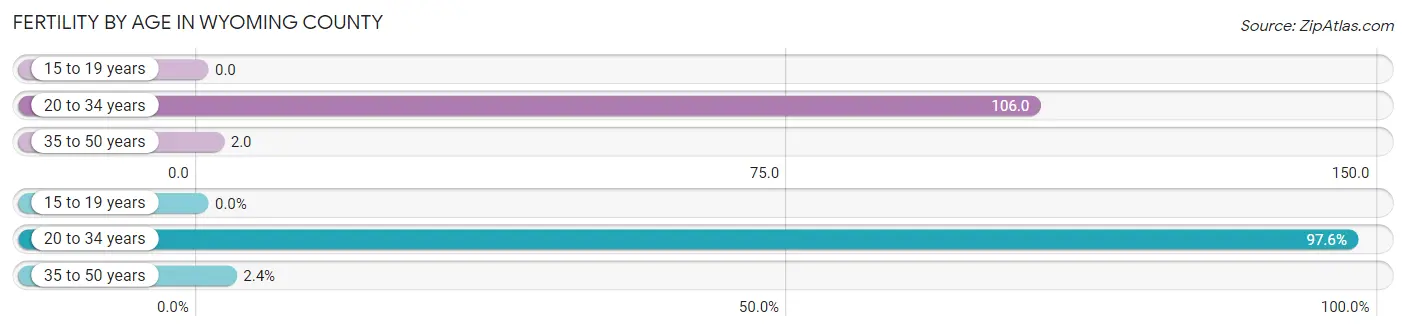
Fertility by Age in Wyoming County
Average fertility rate in Wyoming County is 38.0 births per 1,000 women. Women in the age bracket of 20 to 34 years have the highest fertility rate with 106.0 births per 1,000 women. Women in the age bracket of 20 to 34 years acount for 97.6% of all women with births.
| Age Bracket | Women with Births | Births / 1,000 Women |
| 15 to 19 years | 0 (0.0%) | 0.0 |
| 20 to 34 years | 163 (97.6%) | 106.0 |
| 35 to 50 years | 4 (2.4%) | 2.0 |
| Total | 167 (100.0%) | 38.0 |
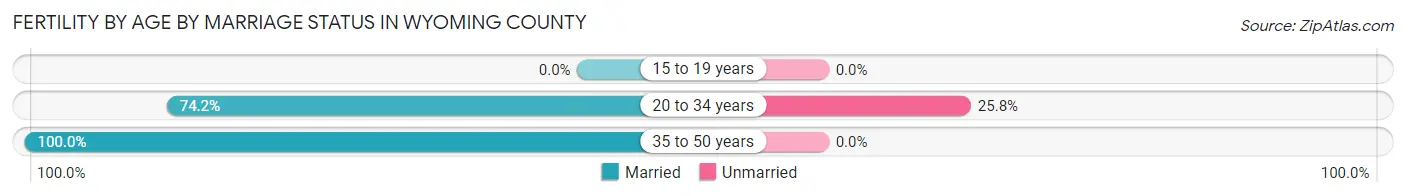
Fertility by Age by Marriage Status in Wyoming County
74.9% of women with births (167) in Wyoming County are married. The highest percentage of unmarried women with births falls into 20 to 34 years age bracket with 25.8% of them unmarried at the time of birth, while the lowest percentage of unmarried women with births belong to 35 to 50 years age bracket with 0.0% of them unmarried.
| Age Bracket | Married | Unmarried |
| 15 to 19 years | 0 (0.0%) | 0 (0.0%) |
| 20 to 34 years | 121 (74.2%) | 42 (25.8%) |
| 35 to 50 years | 4 (100.0%) | 0 (0.0%) |
| Total | 125 (74.9%) | 42 (25.2%) |
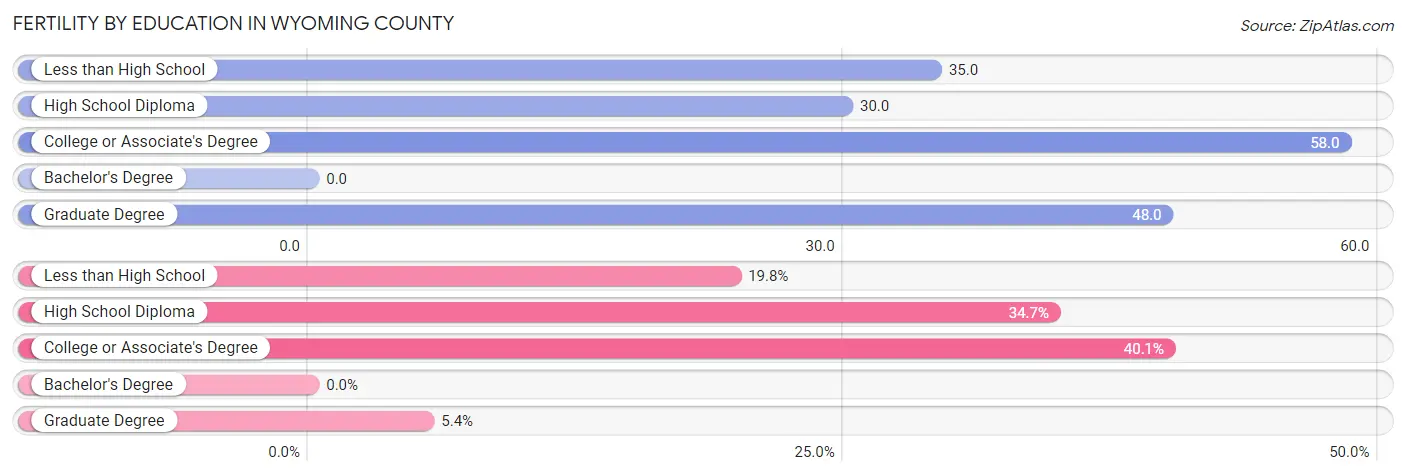
Fertility by Education in Wyoming County
| Educational Attainment | Women with Births | Births / 1,000 Women |
| Less than High School | 33 (19.8%) | 35.0 |
| High School Diploma | 58 (34.7%) | 30.0 |
| College or Associate's Degree | 67 (40.1%) | 58.0 |
| Bachelor's Degree | 0 (0.0%) | 0.0 |
| Graduate Degree | 9 (5.4%) | 48.0 |
| Total | 167 (100.0%) | 38.0 |
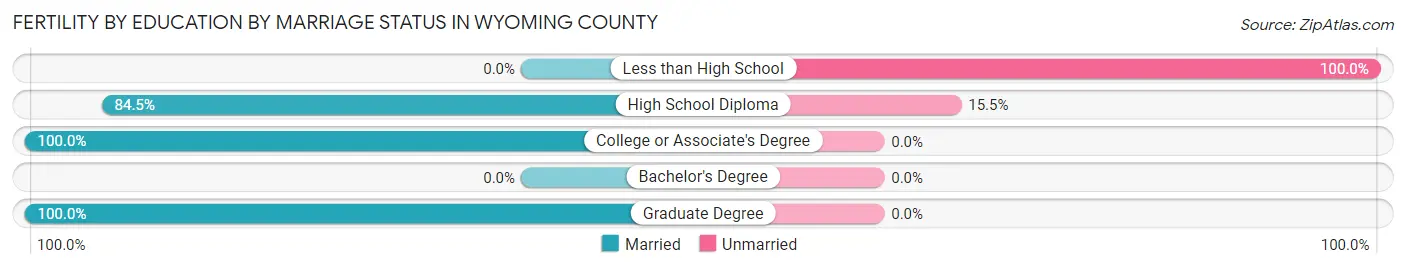
Fertility by Education by Marriage Status in Wyoming County
25.2% of women with births in Wyoming County are unmarried. Women with the educational attainment of college or associate's degree are most likely to be married with 100.0% of them married at childbirth, while women with the educational attainment of less than high school are least likely to be married with 100.0% of them unmarried at childbirth.
| Educational Attainment | Married | Unmarried |
| Less than High School | 0 (0.0%) | 33 (100.0%) |
| High School Diploma | 49 (84.5%) | 9 (15.5%) |
| College or Associate's Degree | 67 (100.0%) | 0 (0.0%) |
| Bachelor's Degree | 0 (0.0%) | 0 (0.0%) |
| Graduate Degree | 9 (100.0%) | 0 (0.0%) |
| Total | 125 (74.9%) | 42 (25.2%) |
Income in Wyoming County
Income Overview in Wyoming County
Per Capita Income in Wyoming County is $22,818, while median incomes of families and households are $51,001 and $44,510 respectively.
| Characteristic | Number | Measure |
| Per Capita Income | 21,237 | $22,818 |
| Median Family Income | 5,624 | $51,001 |
| Mean Family Income | 5,624 | $60,790 |
| Median Household Income | 7,724 | $44,510 |
| Mean Household Income | 7,724 | $57,403 |
| Income Deficit | 5,624 | $8,729 |
| Wage / Income Gap (%) | 21,237 | 28.09% |
| Wage / Income Gap ($) | 21,237 | 71.91¢ per $1 |
| Gini / Inequality Index | 21,237 | 0.46 |
Earnings by Sex in Wyoming County
Average Earnings in Wyoming County are $33,183, $42,500 for men and $30,563 for women, a difference of 28.1%.
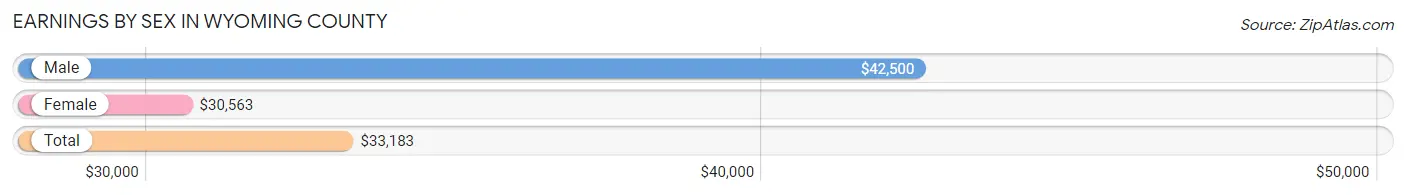
| Sex | Number | Average Earnings |
| Male | 3,704 (57.9%) | $42,500 |
| Female | 2,697 (42.1%) | $30,563 |
| Total | 6,401 (100.0%) | $33,183 |
Earnings by Sex by Income Bracket in Wyoming County
The most common earnings brackets in Wyoming County are $75,000 to $99,999 for men (565 | 15.2%) and $25,000 to $29,999 for women (326 | 12.1%).
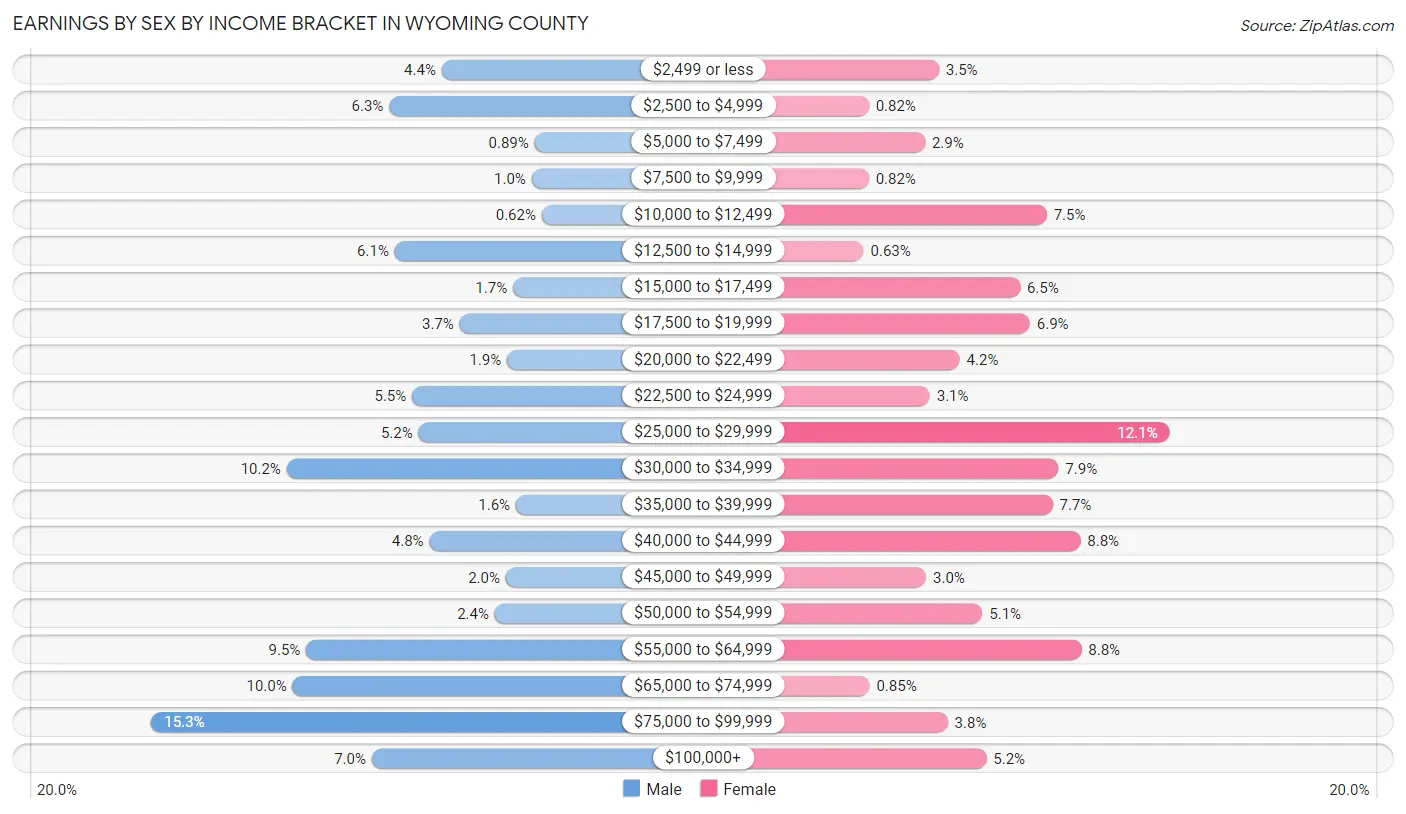
| Income | Male | Female |
| $2,499 or less | 162 (4.4%) | 93 (3.5%) |
| $2,500 to $4,999 | 235 (6.3%) | 22 (0.8%) |
| $5,000 to $7,499 | 33 (0.9%) | 79 (2.9%) |
| $7,500 to $9,999 | 37 (1.0%) | 22 (0.8%) |
| $10,000 to $12,499 | 23 (0.6%) | 202 (7.5%) |
| $12,500 to $14,999 | 227 (6.1%) | 17 (0.6%) |
| $15,000 to $17,499 | 63 (1.7%) | 175 (6.5%) |
| $17,500 to $19,999 | 137 (3.7%) | 185 (6.9%) |
| $20,000 to $22,499 | 71 (1.9%) | 114 (4.2%) |
| $22,500 to $24,999 | 203 (5.5%) | 84 (3.1%) |
| $25,000 to $29,999 | 194 (5.2%) | 326 (12.1%) |
| $30,000 to $34,999 | 377 (10.2%) | 214 (7.9%) |
| $35,000 to $39,999 | 59 (1.6%) | 208 (7.7%) |
| $40,000 to $44,999 | 179 (4.8%) | 236 (8.7%) |
| $45,000 to $49,999 | 73 (2.0%) | 80 (3.0%) |
| $50,000 to $54,999 | 88 (2.4%) | 137 (5.1%) |
| $55,000 to $64,999 | 350 (9.5%) | 237 (8.8%) |
| $65,000 to $74,999 | 369 (10.0%) | 23 (0.9%) |
| $75,000 to $99,999 | 565 (15.2%) | 102 (3.8%) |
| $100,000+ | 259 (7.0%) | 141 (5.2%) |
| Total | 3,704 (100.0%) | 2,697 (100.0%) |
Earnings by Sex by Educational Attainment in Wyoming County
Average earnings in Wyoming County are $44,476 for men and $32,347 for women, a difference of 27.3%. Men with an educational attainment of graduate degree enjoy the highest average annual earnings of $86,250, while those with high school diploma education earn the least with $43,500. Women with an educational attainment of bachelor's degree earn the most with the average annual earnings of $50,688, while those with high school diploma education have the smallest earnings of $27,568.
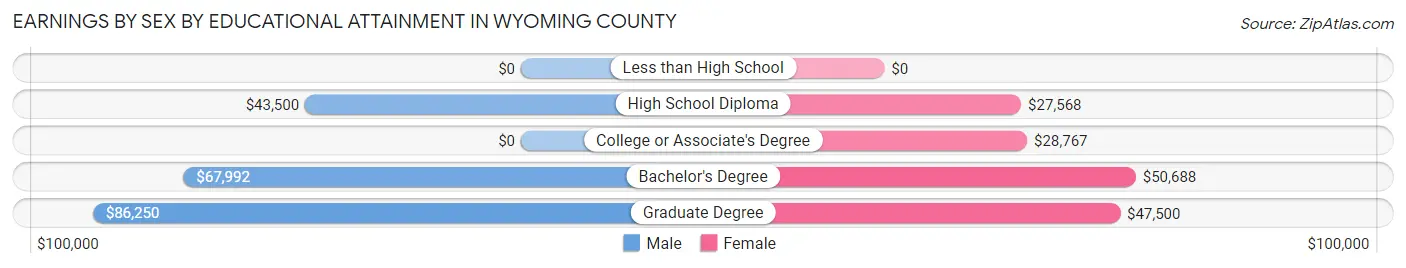
| Educational Attainment | Male Income | Female Income |
| Less than High School | - | - |
| High School Diploma | $43,500 | $27,568 |
| College or Associate's Degree | - | - |
| Bachelor's Degree | $67,992 | $50,688 |
| Graduate Degree | $86,250 | $47,500 |
| Total | $44,476 | $32,347 |
Family Income in Wyoming County
Family Income Brackets in Wyoming County
According to the Wyoming County family income data, there are 1,249 families falling into the $50,000 to $74,999 income range, which is the most common income bracket and makes up 22.2% of all families. Conversely, the $200,000+ income bracket is the least frequent group with only 51 families (0.9%) belonging to this category.
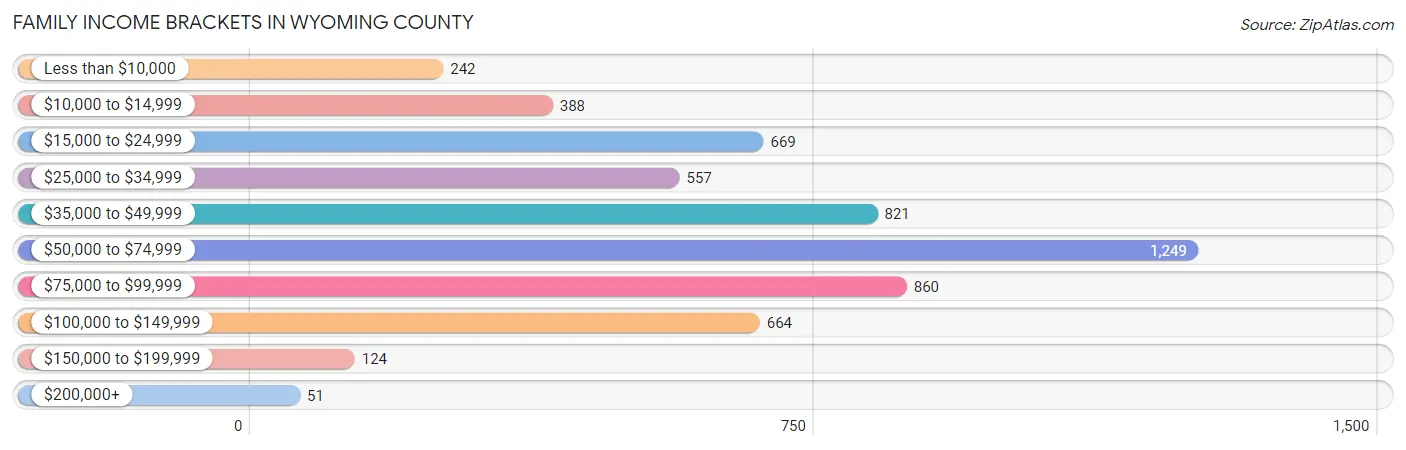
| Income Bracket | # Families | % Families |
| Less than $10,000 | 242 | 4.3% |
| $10,000 to $14,999 | 388 | 6.9% |
| $15,000 to $24,999 | 669 | 11.9% |
| $25,000 to $34,999 | 557 | 9.9% |
| $35,000 to $49,999 | 821 | 14.6% |
| $50,000 to $74,999 | 1,249 | 22.2% |
| $75,000 to $99,999 | 860 | 15.3% |
| $100,000 to $149,999 | 664 | 11.8% |
| $150,000 to $199,999 | 124 | 2.2% |
| $200,000+ | 51 | 0.9% |
Family Income by Famaliy Size in Wyoming County
6-person families (68 | 1.2%) account for the highest median family income in Wyoming County with $75,833 per family, while 3-person families (1,368 | 24.3%) have the highest median income of $20,998 per family member.
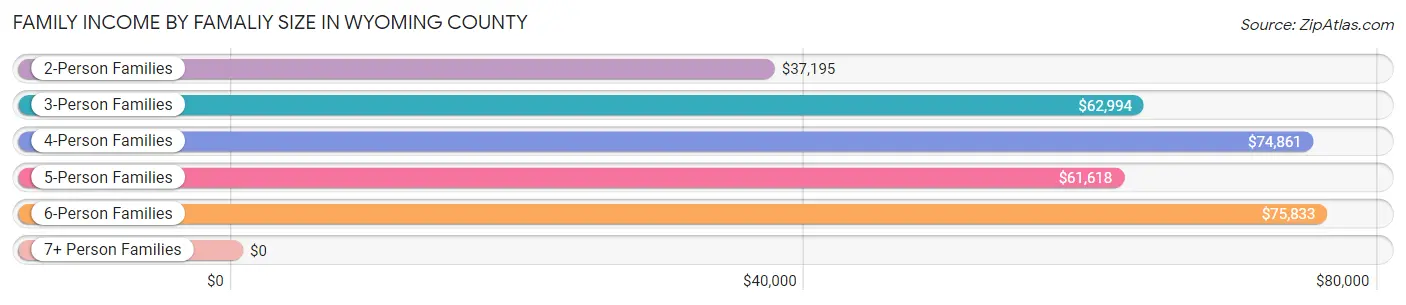
| Income Bracket | # Families | Median Income |
| 2-Person Families | 3,166 (56.3%) | $37,195 |
| 3-Person Families | 1,368 (24.3%) | $62,994 |
| 4-Person Families | 650 (11.6%) | $74,861 |
| 5-Person Families | 305 (5.4%) | $61,618 |
| 6-Person Families | 68 (1.2%) | $75,833 |
| 7+ Person Families | 67 (1.2%) | $0 |
| Total | 5,624 (100.0%) | $51,001 |
Family Income by Number of Earners in Wyoming County
The median family income in Wyoming County is $51,001, with families comprising 3+ earners (57) having the highest median family income of $128,750, while families with no earners (2,309) have the lowest median family income of $26,717, accounting for 1.0% and 41.1% of families, respectively.
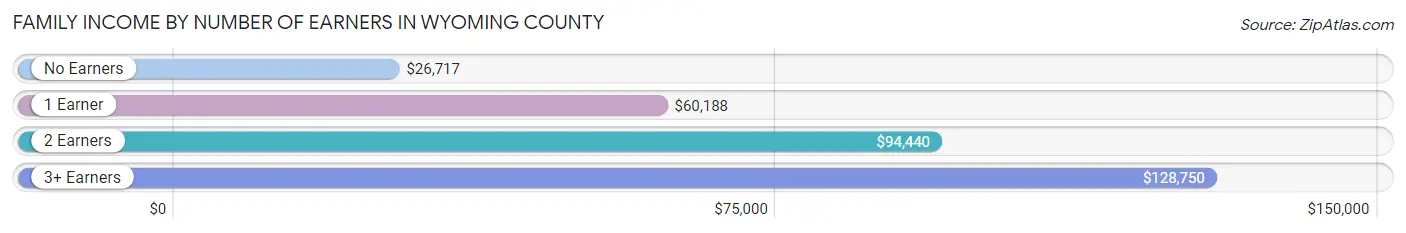
| Number of Earners | # Families | Median Income |
| No Earners | 2,309 (41.1%) | $26,717 |
| 1 Earner | 2,017 (35.9%) | $60,188 |
| 2 Earners | 1,241 (22.1%) | $94,440 |
| 3+ Earners | 57 (1.0%) | $128,750 |
| Total | 5,624 (100.0%) | $51,001 |
Household Income in Wyoming County
Household Income Brackets in Wyoming County
With 1,522 households falling in the category, the $50,000 to $74,999 income range is the most frequent in Wyoming County, accounting for 19.7% of all households. In contrast, only 108 households (1.4%) fall into the $200,000+ income bracket, making it the least populous group.
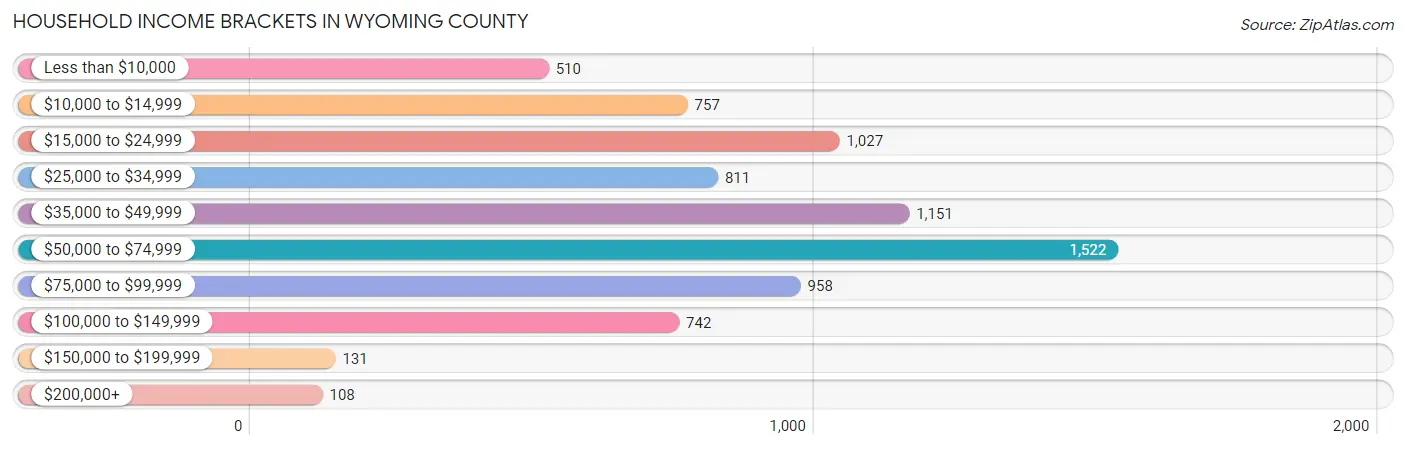
| Income Bracket | # Households | % Households |
| Less than $10,000 | 510 | 6.6% |
| $10,000 to $14,999 | 757 | 9.8% |
| $15,000 to $24,999 | 1,027 | 13.3% |
| $25,000 to $34,999 | 811 | 10.5% |
| $35,000 to $49,999 | 1,151 | 14.9% |
| $50,000 to $74,999 | 1,522 | 19.7% |
| $75,000 to $99,999 | 958 | 12.4% |
| $100,000 to $149,999 | 742 | 9.6% |
| $150,000 to $199,999 | 131 | 1.7% |
| $200,000+ | 108 | 1.4% |
Household Income by Householder Age in Wyoming County
The median household income in Wyoming County is $44,510, with the highest median household income of $61,021 found in the 25 to 44 years age bracket for the primary householder. A total of 1,751 households (22.7%) fall into this category. Meanwhile, the 65+ years age bracket for the primary householder has the lowest median household income of $35,736, with 2,648 households (34.3%) in this group.
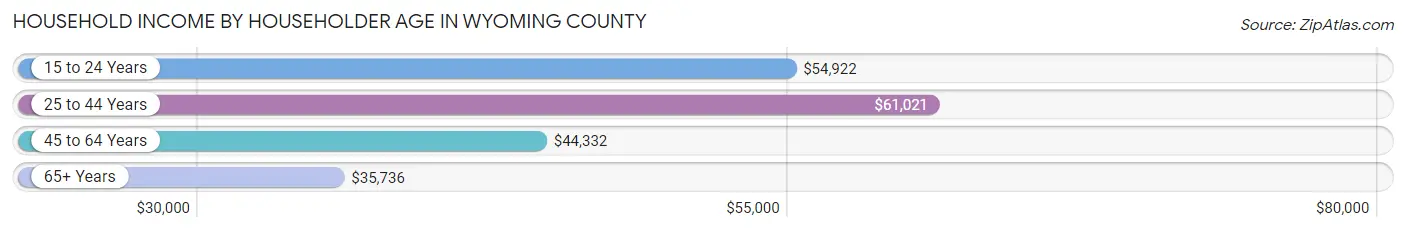
| Income Bracket | # Households | Median Income |
| 15 to 24 Years | 97 (1.3%) | $54,922 |
| 25 to 44 Years | 1,751 (22.7%) | $61,021 |
| 45 to 64 Years | 3,228 (41.8%) | $44,332 |
| 65+ Years | 2,648 (34.3%) | $35,736 |
| Total | 7,724 (100.0%) | $44,510 |
Poverty in Wyoming County
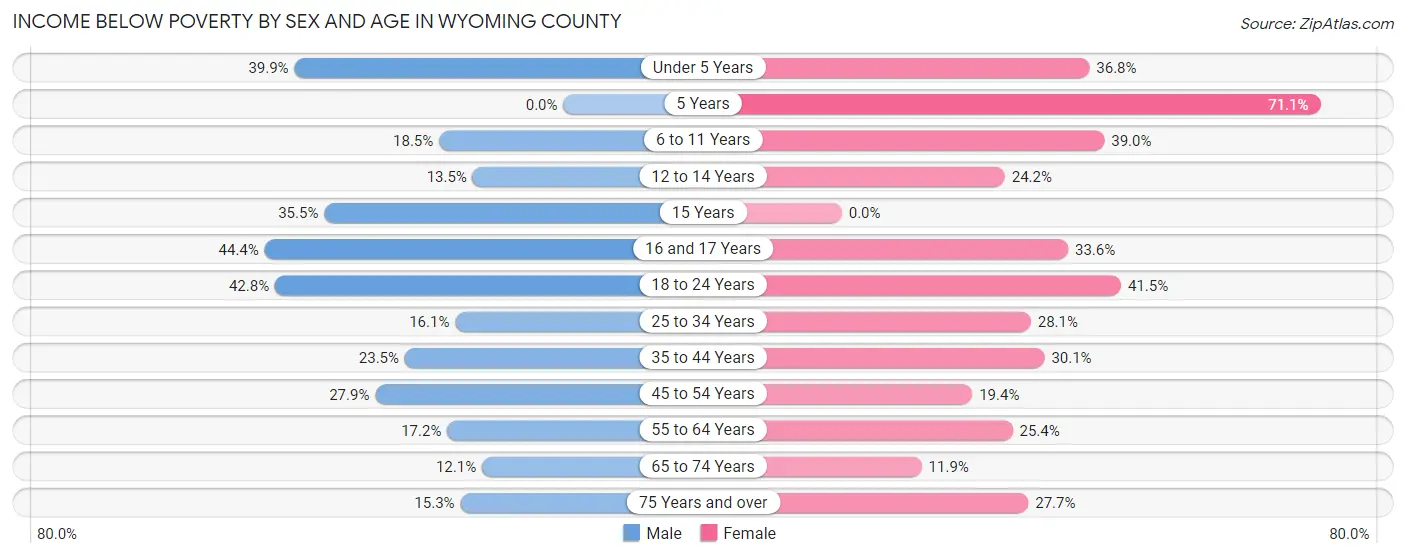
Income Below Poverty by Sex and Age in Wyoming County
With 22.2% poverty level for males and 26.8% for females among the residents of Wyoming County, 16 and 17 year old males and 5 year old females are the most vulnerable to poverty, with 118 males (44.4%) and 27 females (71.1%) in their respective age groups living below the poverty level.
| Age Bracket | Male | Female |
| Under 5 Years | 214 (39.9%) | 143 (36.8%) |
| 5 Years | 0 (0.0%) | 27 (71.1%) |
| 6 to 11 Years | 150 (18.4%) | 359 (39.0%) |
| 12 to 14 Years | 51 (13.5%) | 61 (24.2%) |
| 15 Years | 49 (35.5%) | 0 (0.0%) |
| 16 and 17 Years | 118 (44.4%) | 127 (33.6%) |
| 18 to 24 Years | 331 (42.8%) | 299 (41.5%) |
| 25 to 34 Years | 192 (16.1%) | 297 (28.1%) |
| 35 to 44 Years | 276 (23.5%) | 374 (30.1%) |
| 45 to 54 Years | 396 (27.9%) | 282 (19.4%) |
| 55 to 64 Years | 259 (17.2%) | 404 (25.4%) |
| 65 to 74 Years | 192 (12.1%) | 177 (11.9%) |
| 75 Years and over | 122 (15.3%) | 237 (27.7%) |
| Total | 2,350 (22.2%) | 2,787 (26.8%) |
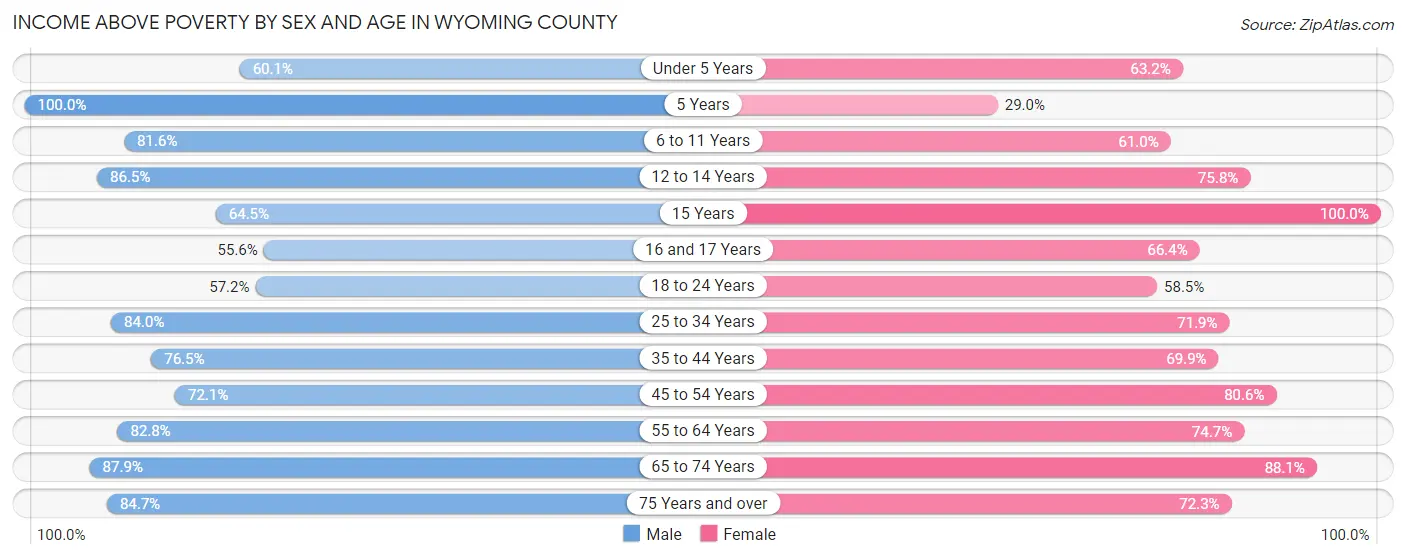
Income Above Poverty by Sex and Age in Wyoming County
According to the poverty statistics in Wyoming County, males aged 5 years and females aged 15 years are the age groups that are most secure financially, with 100.0% of males and 100.0% of females in these age groups living above the poverty line.
| Age Bracket | Male | Female |
| Under 5 Years | 322 (60.1%) | 246 (63.2%) |
| 5 Years | 21 (100.0%) | 11 (28.9%) |
| 6 to 11 Years | 663 (81.6%) | 562 (61.0%) |
| 12 to 14 Years | 328 (86.5%) | 191 (75.8%) |
| 15 Years | 89 (64.5%) | 21 (100.0%) |
| 16 and 17 Years | 148 (55.6%) | 251 (66.4%) |
| 18 to 24 Years | 442 (57.2%) | 422 (58.5%) |
| 25 to 34 Years | 1,004 (84.0%) | 761 (71.9%) |
| 35 to 44 Years | 897 (76.5%) | 869 (69.9%) |
| 45 to 54 Years | 1,022 (72.1%) | 1,174 (80.6%) |
| 55 to 64 Years | 1,243 (82.8%) | 1,190 (74.7%) |
| 65 to 74 Years | 1,398 (87.9%) | 1,316 (88.1%) |
| 75 Years and over | 676 (84.7%) | 619 (72.3%) |
| Total | 8,253 (77.8%) | 7,633 (73.3%) |
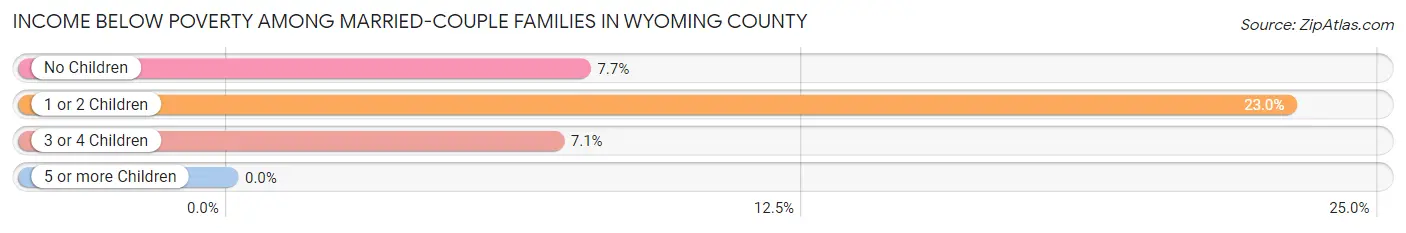
Income Below Poverty Among Married-Couple Families in Wyoming County
The poverty statistics for married-couple families in Wyoming County show that 11.5% or 490 of the total 4,247 families live below the poverty line. Families with 1 or 2 children have the highest poverty rate of 23.0%, comprising of 252 families. On the other hand, families with 5 or more children have the lowest poverty rate of 0.0%, which includes 0 families.
| Children | Above Poverty | Below Poverty |
| No Children | 2,625 (92.3%) | 218 (7.7%) |
| 1 or 2 Children | 842 (77.0%) | 252 (23.0%) |
| 3 or 4 Children | 262 (92.9%) | 20 (7.1%) |
| 5 or more Children | 28 (100.0%) | 0 (0.0%) |
| Total | 3,757 (88.5%) | 490 (11.5%) |
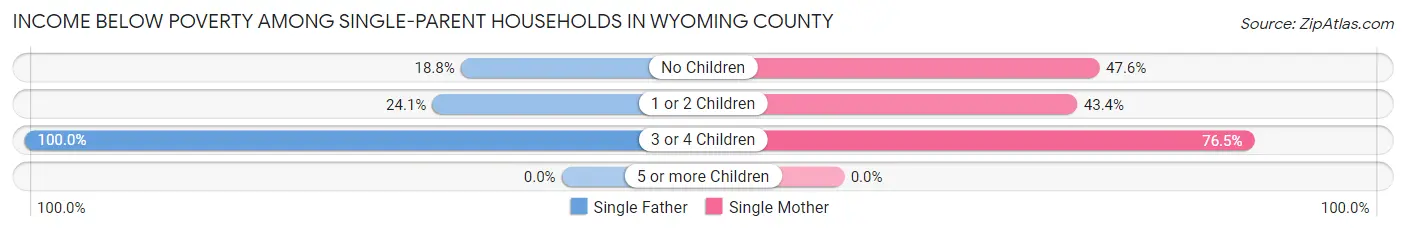
Income Below Poverty Among Single-Parent Households in Wyoming County
According to the poverty data in Wyoming County, 21.0% or 58 single-father households and 47.1% or 519 single-mother households are living below the poverty line. Among single-father households, those with 3 or 4 children have the highest poverty rate, with 3 households (100.0%) experiencing poverty. Likewise, among single-mother households, those with 3 or 4 children have the highest poverty rate, with 39 households (76.5%) falling below the poverty line.
| Children | Single Father | Single Mother |
| No Children | 22 (18.8%) | 275 (47.6%) |
| 1 or 2 Children | 33 (24.1%) | 205 (43.4%) |
| 3 or 4 Children | 3 (100.0%) | 39 (76.5%) |
| 5 or more Children | 0 (0.0%) | 0 (0.0%) |
| Total | 58 (21.0%) | 519 (47.1%) |
Income Below Poverty Among Married-Couple vs Single-Parent Households in Wyoming County
The poverty data for Wyoming County shows that 490 of the married-couple family households (11.5%) and 577 of the single-parent households (41.9%) are living below the poverty level. Within the married-couple family households, those with 1 or 2 children have the highest poverty rate, with 252 households (23.0%) falling below the poverty line. Among the single-parent households, those with 3 or 4 children have the highest poverty rate, with 42 household (77.8%) living below poverty.
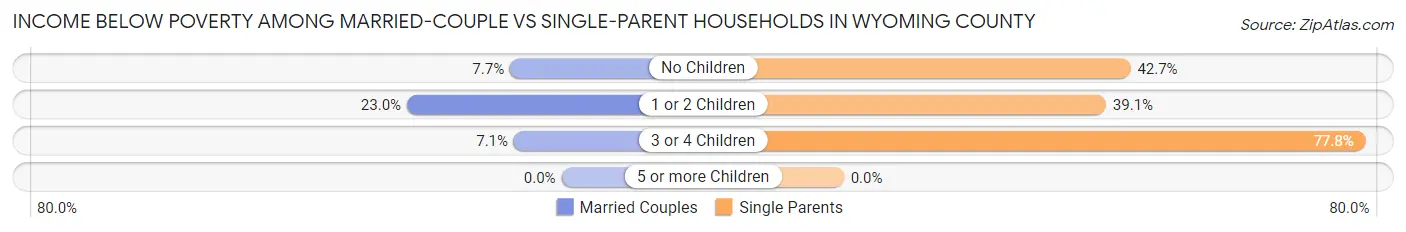
| Children | Married-Couple Families | Single-Parent Households |
| No Children | 218 (7.7%) | 297 (42.7%) |
| 1 or 2 Children | 252 (23.0%) | 238 (39.1%) |
| 3 or 4 Children | 20 (7.1%) | 42 (77.8%) |
| 5 or more Children | 0 (0.0%) | 0 (0.0%) |
| Total | 490 (11.5%) | 577 (41.9%) |
Employment Characteristics in Wyoming County
Employment by Class of Employer in Wyoming County
Among the 5,972 employed individuals in Wyoming County, private company employees (3,859 | 64.6%), state government employees (836 | 14.0%), and local government employees (636 | 10.6%) make up the most common classes of employment.
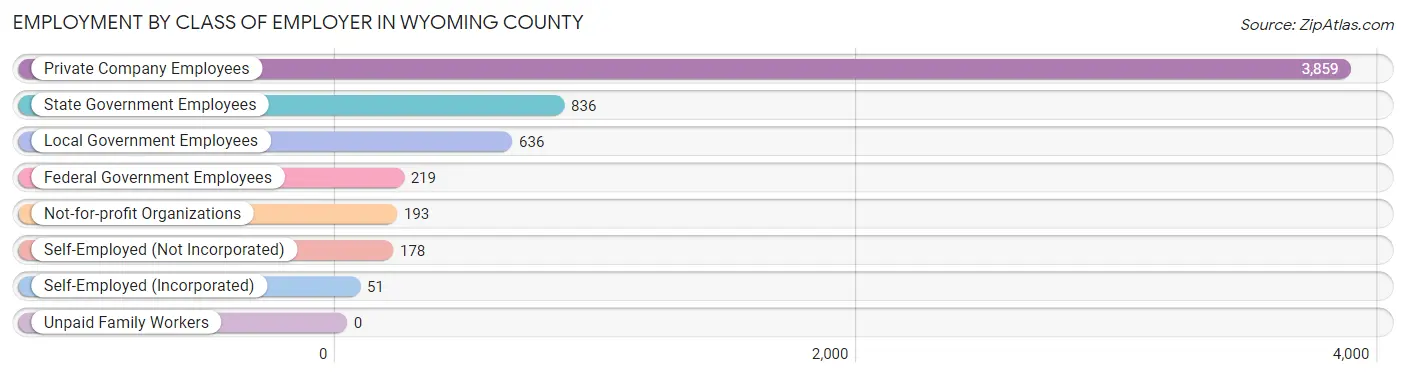
| Employer Class | # Employees | % Employees |
| Private Company Employees | 3,859 | 64.6% |
| Self-Employed (Incorporated) | 51 | 0.9% |
| Self-Employed (Not Incorporated) | 178 | 3.0% |
| Not-for-profit Organizations | 193 | 3.2% |
| Local Government Employees | 636 | 10.6% |
| State Government Employees | 836 | 14.0% |
| Federal Government Employees | 219 | 3.7% |
| Unpaid Family Workers | 0 | 0.0% |
| Total | 5,972 | 100.0% |
Employment Status by Age in Wyoming County
According to the labor force statistics for Wyoming County, out of the total population over 16 years of age (17,586), 37.3% or 6,560 individuals are in the labor force, with 6.4% or 420 of them unemployed. The age group with the highest labor force participation rate is 25 to 29 years, with 78.3% or 894 individuals in the labor force. Within the labor force, the 20 to 24 years age range has the highest percentage of unemployed individuals, with 26.2% or 163 of them being unemployed.
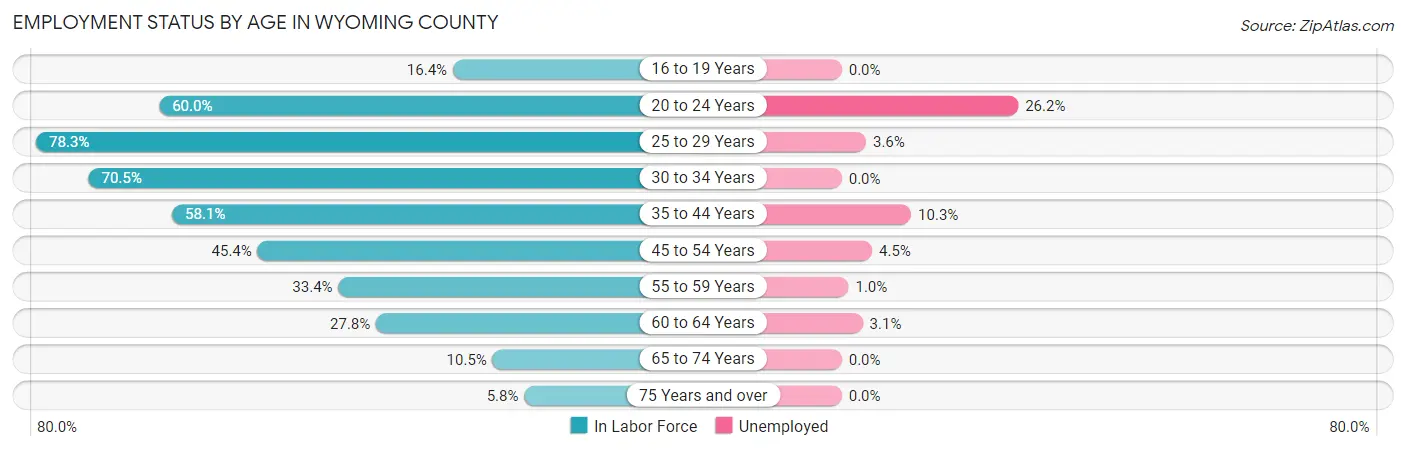
| Age Bracket | In Labor Force | Unemployed |
| 16 to 19 Years | 181 (16.4%) | 0 (0.0%) |
| 20 to 24 Years | 622 (60.0%) | 163 (26.2%) |
| 25 to 29 Years | 894 (78.3%) | 32 (3.6%) |
| 30 to 34 Years | 785 (70.5%) | 0 (0.0%) |
| 35 to 44 Years | 1,407 (58.1%) | 145 (10.3%) |
| 45 to 54 Years | 1,306 (45.4%) | 59 (4.5%) |
| 55 to 59 Years | 496 (33.4%) | 5 (1.0%) |
| 60 to 64 Years | 451 (27.8%) | 14 (3.1%) |
| 65 to 74 Years | 325 (10.5%) | 0 (0.0%) |
| 75 Years and over | 98 (5.8%) | 0 (0.0%) |
| Total | 6,560 (37.3%) | 420 (6.4%) |
Employment Status by Educational Attainment in Wyoming County
According to labor force statistics for Wyoming County, 50.1% of individuals (5,340) out of the total population between 25 and 64 years of age (10,658) are in the labor force, with 4.8% or 256 of them being unemployed. The group with the highest labor force participation rate are those with the educational attainment of bachelor's degree or higher, with 82.6% or 971 individuals in the labor force. Within the labor force, individuals with college / associate degree education have the highest percentage of unemployment, with 6.2% or 74 of them being unemployed.
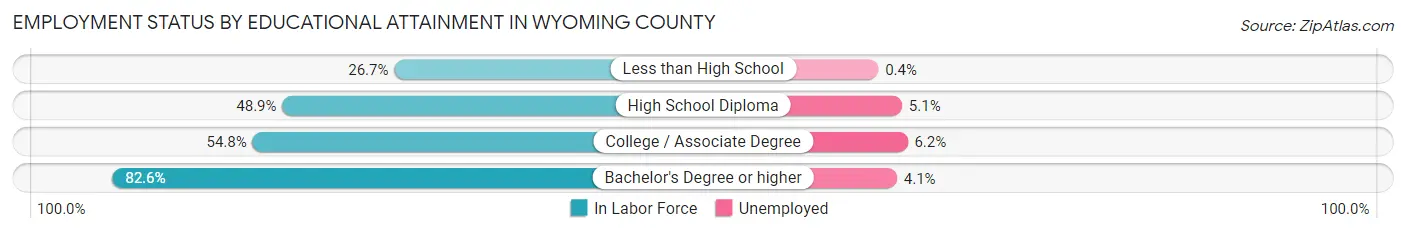
| Educational Attainment | In Labor Force | Unemployed |
| Less than High School | 483 (26.7%) | 7 (0.4%) |
| High School Diploma | 2,680 (48.9%) | 279 (5.1%) |
| College / Associate Degree | 1,201 (54.8%) | 136 (6.2%) |
| Bachelor's Degree or higher | 971 (82.6%) | 48 (4.1%) |
| Total | 5,340 (50.1%) | 512 (4.8%) |
Employment Occupations by Sex in Wyoming County
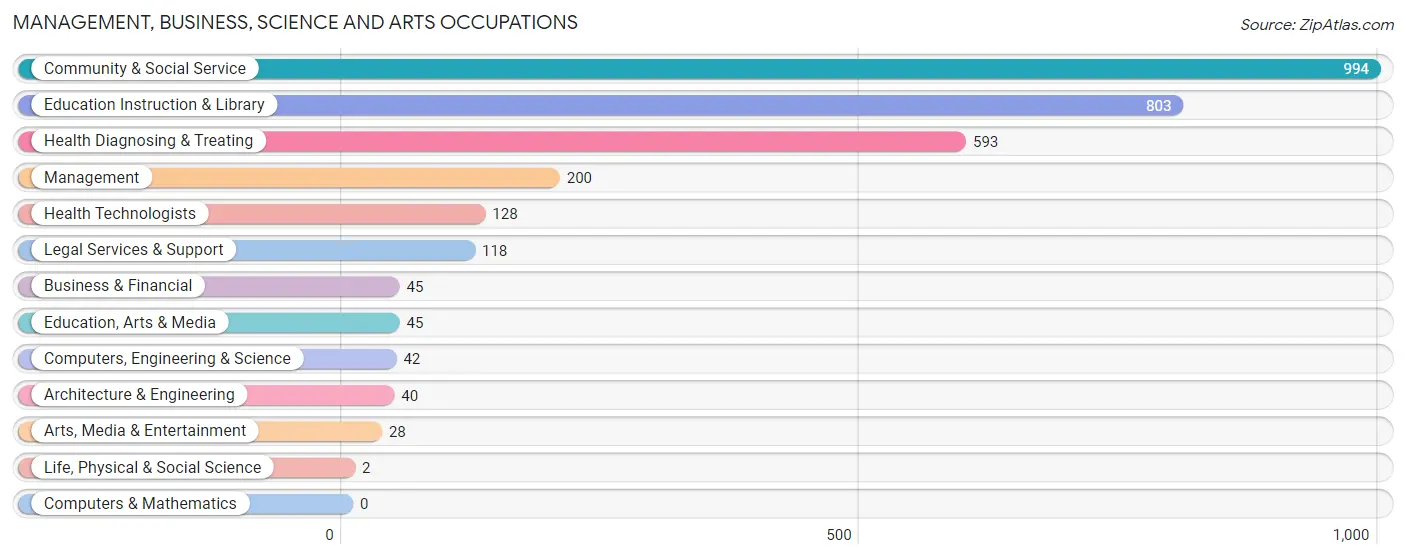
Management, Business, Science and Arts Occupations
The most common Management, Business, Science and Arts occupations in Wyoming County are Community & Social Service (994 | 16.2%), Education Instruction & Library (803 | 13.1%), Health Diagnosing & Treating (593 | 9.7%), Management (200 | 3.3%), and Health Technologists (128 | 2.1%).
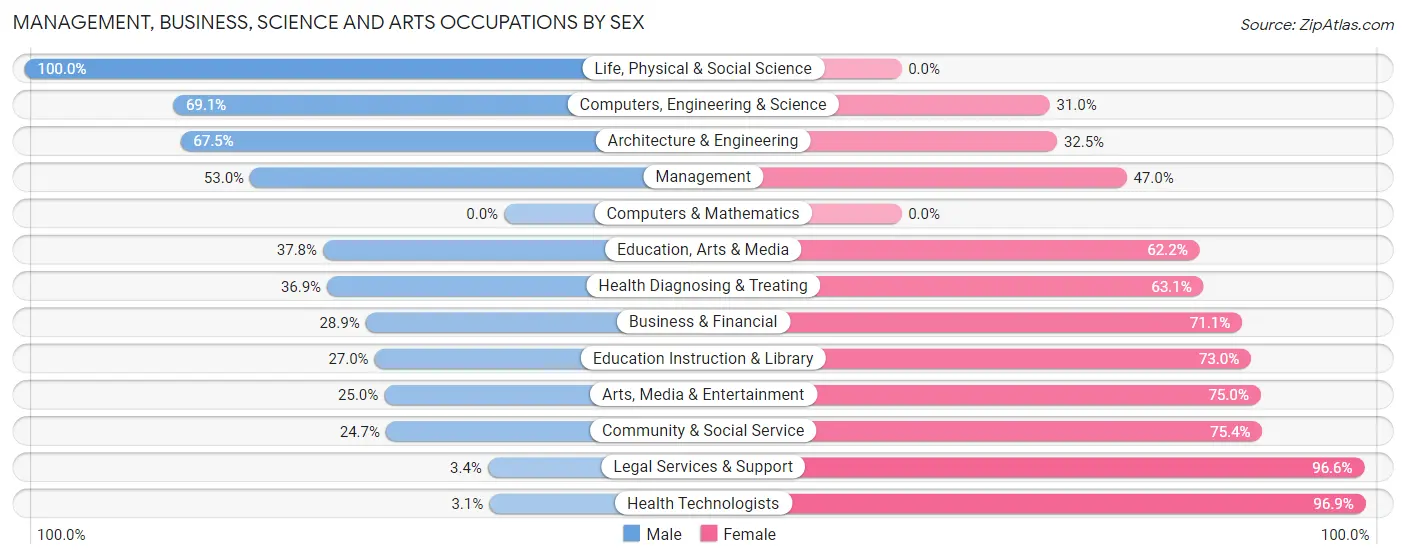
Management, Business, Science and Arts Occupations by Sex
Within the Management, Business, Science and Arts occupations in Wyoming County, the most male-oriented occupations are Life, Physical & Social Science (100.0%), Computers, Engineering & Science (69.1%), and Architecture & Engineering (67.5%), while the most female-oriented occupations are Health Technologists (96.9%), Legal Services & Support (96.6%), and Community & Social Service (75.3%).
| Occupation | Male | Female |
| Management | 106 (53.0%) | 94 (47.0%) |
| Business & Financial | 13 (28.9%) | 32 (71.1%) |
| Computers, Engineering & Science | 29 (69.1%) | 13 (30.9%) |
| Computers & Mathematics | 0 (0.0%) | 0 (0.0%) |
| Architecture & Engineering | 27 (67.5%) | 13 (32.5%) |
| Life, Physical & Social Science | 2 (100.0%) | 0 (0.0%) |
| Community & Social Service | 245 (24.6%) | 749 (75.3%) |
| Education, Arts & Media | 17 (37.8%) | 28 (62.2%) |
| Legal Services & Support | 4 (3.4%) | 114 (96.6%) |
| Education Instruction & Library | 217 (27.0%) | 586 (73.0%) |
| Arts, Media & Entertainment | 7 (25.0%) | 21 (75.0%) |
| Health Diagnosing & Treating | 219 (36.9%) | 374 (63.1%) |
| Health Technologists | 4 (3.1%) | 124 (96.9%) |
| Total (Category) | 612 (32.7%) | 1,262 (67.3%) |
| Total (Overall) | 3,537 (57.6%) | 2,606 (42.4%) |
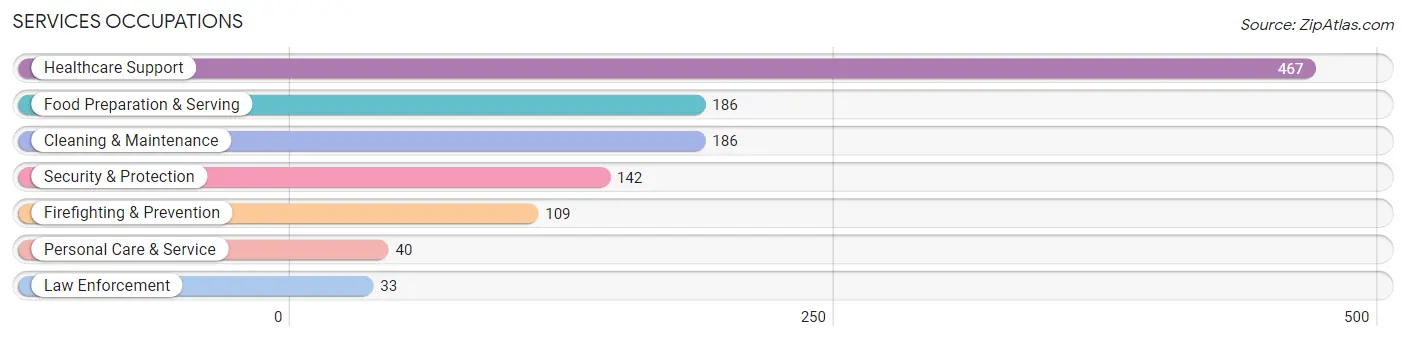
Services Occupations
The most common Services occupations in Wyoming County are Healthcare Support (467 | 7.6%), Food Preparation & Serving (186 | 3.0%), Cleaning & Maintenance (186 | 3.0%), Security & Protection (142 | 2.3%), and Firefighting & Prevention (109 | 1.8%).
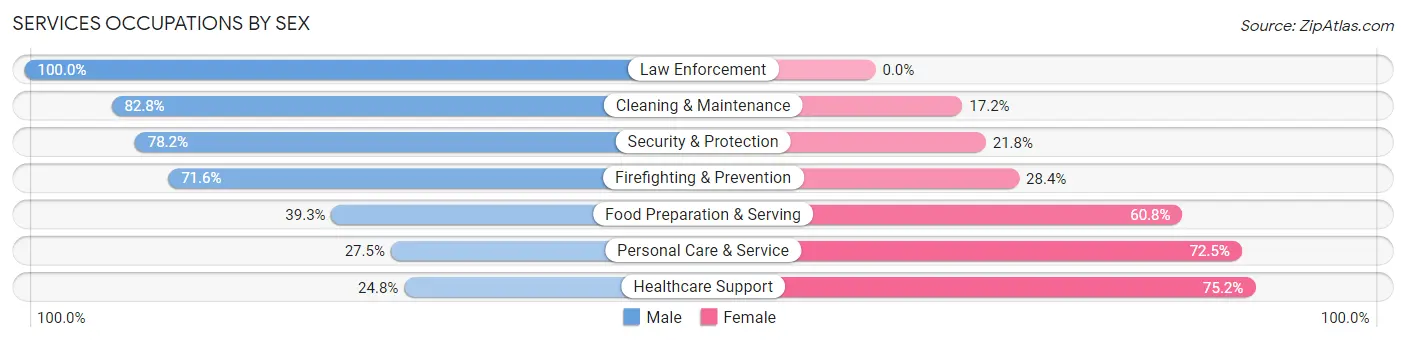
Services Occupations by Sex
Within the Services occupations in Wyoming County, the most male-oriented occupations are Law Enforcement (100.0%), Cleaning & Maintenance (82.8%), and Security & Protection (78.2%), while the most female-oriented occupations are Healthcare Support (75.2%), Personal Care & Service (72.5%), and Food Preparation & Serving (60.8%).
| Occupation | Male | Female |
| Healthcare Support | 116 (24.8%) | 351 (75.2%) |
| Security & Protection | 111 (78.2%) | 31 (21.8%) |
| Firefighting & Prevention | 78 (71.6%) | 31 (28.4%) |
| Law Enforcement | 33 (100.0%) | 0 (0.0%) |
| Food Preparation & Serving | 73 (39.3%) | 113 (60.8%) |
| Cleaning & Maintenance | 154 (82.8%) | 32 (17.2%) |
| Personal Care & Service | 11 (27.5%) | 29 (72.5%) |
| Total (Category) | 465 (45.5%) | 556 (54.5%) |
| Total (Overall) | 3,537 (57.6%) | 2,606 (42.4%) |
Sales and Office Occupations
The most common Sales and Office occupations in Wyoming County are Office & Administration (521 | 8.5%), and Sales & Related (458 | 7.5%).

Sales and Office Occupations by Sex
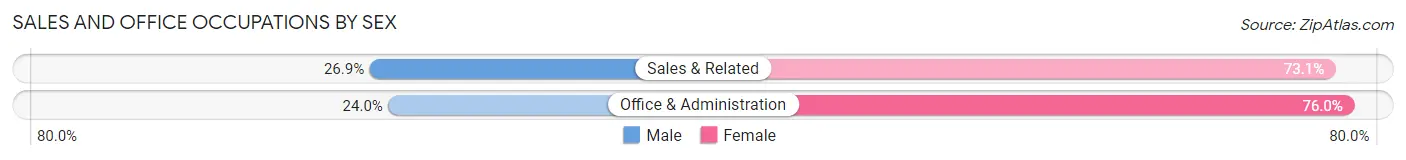
| Occupation | Male | Female |
| Sales & Related | 123 (26.9%) | 335 (73.1%) |
| Office & Administration | 125 (24.0%) | 396 (76.0%) |
| Total (Category) | 248 (25.3%) | 731 (74.7%) |
| Total (Overall) | 3,537 (57.6%) | 2,606 (42.4%) |
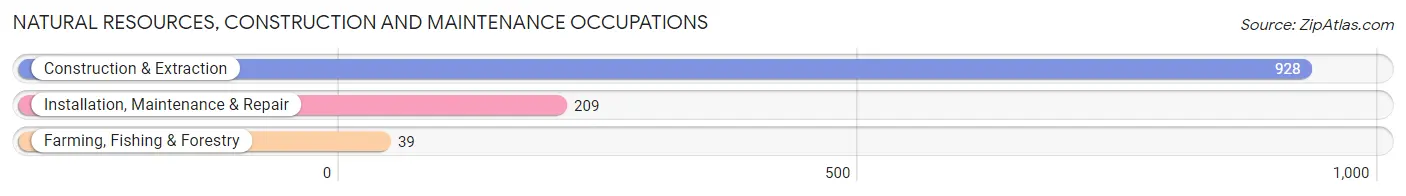
Natural Resources, Construction and Maintenance Occupations
The most common Natural Resources, Construction and Maintenance occupations in Wyoming County are Construction & Extraction (928 | 15.1%), Installation, Maintenance & Repair (209 | 3.4%), and Farming, Fishing & Forestry (39 | 0.6%).
Natural Resources, Construction and Maintenance Occupations by Sex
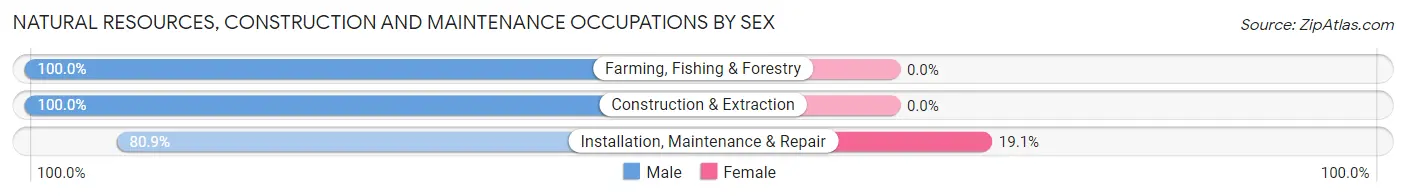
| Occupation | Male | Female |
| Farming, Fishing & Forestry | 39 (100.0%) | 0 (0.0%) |
| Construction & Extraction | 928 (100.0%) | 0 (0.0%) |
| Installation, Maintenance & Repair | 169 (80.9%) | 40 (19.1%) |
| Total (Category) | 1,136 (96.6%) | 40 (3.4%) |
| Total (Overall) | 3,537 (57.6%) | 2,606 (42.4%) |
Production, Transportation and Moving Occupations
The most common Production, Transportation and Moving occupations in Wyoming County are Transportation (442 | 7.2%), Production (344 | 5.6%), and Material Moving (307 | 5.0%).
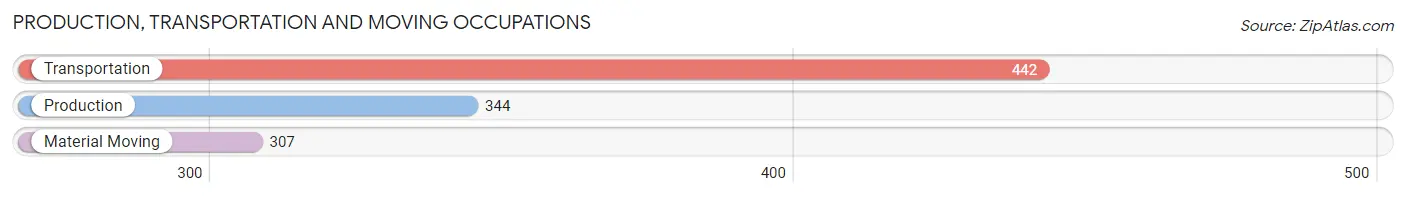
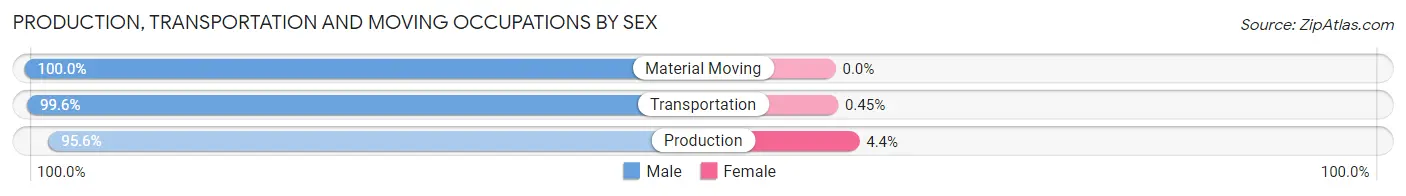
Production, Transportation and Moving Occupations by Sex
| Occupation | Male | Female |
| Production | 329 (95.6%) | 15 (4.4%) |
| Transportation | 440 (99.6%) | 2 (0.4%) |
| Material Moving | 307 (100.0%) | 0 (0.0%) |
| Total (Category) | 1,076 (98.4%) | 17 (1.6%) |
| Total (Overall) | 3,537 (57.6%) | 2,606 (42.4%) |
Employment Industries by Sex in Wyoming County
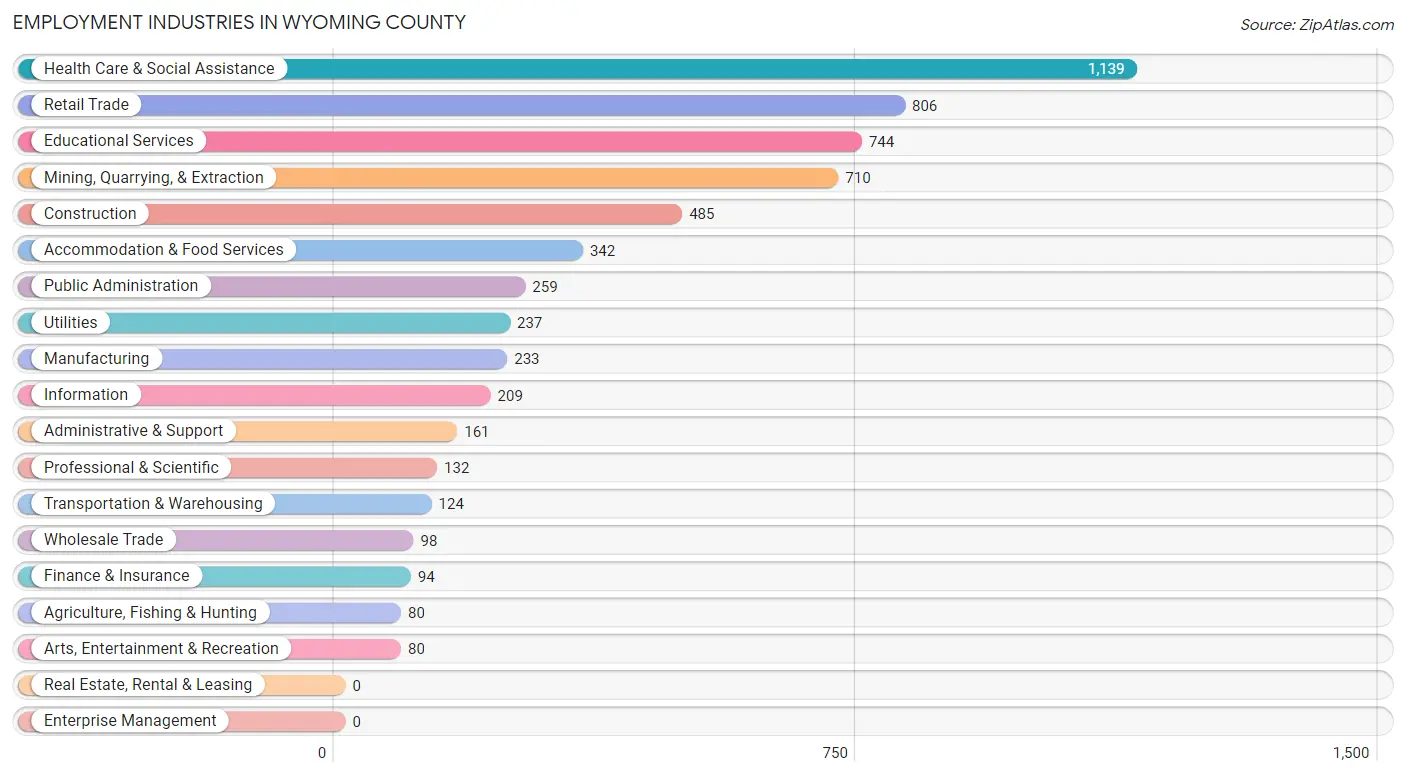
Employment Industries in Wyoming County
The major employment industries in Wyoming County include Health Care & Social Assistance (1,139 | 18.5%), Retail Trade (806 | 13.1%), Educational Services (744 | 12.1%), Mining, Quarrying, & Extraction (710 | 11.6%), and Construction (485 | 7.9%).
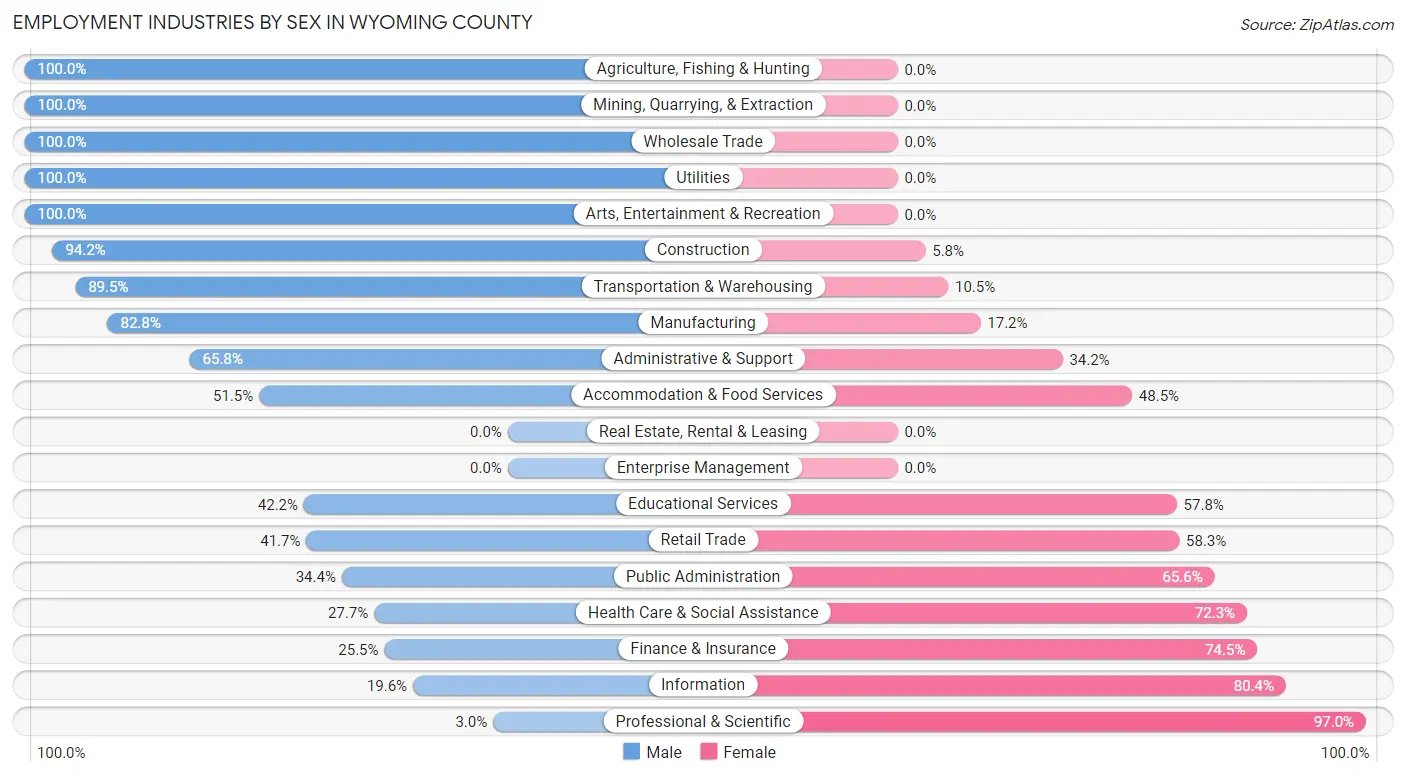
Employment Industries by Sex in Wyoming County
The Wyoming County industries that see more men than women are Agriculture, Fishing & Hunting (100.0%), Mining, Quarrying, & Extraction (100.0%), and Wholesale Trade (100.0%), whereas the industries that tend to have a higher number of women are Professional & Scientific (97.0%), Information (80.4%), and Finance & Insurance (74.5%).
| Industry | Male | Female |
| Agriculture, Fishing & Hunting | 80 (100.0%) | 0 (0.0%) |
| Mining, Quarrying, & Extraction | 710 (100.0%) | 0 (0.0%) |
| Construction | 457 (94.2%) | 28 (5.8%) |
| Manufacturing | 193 (82.8%) | 40 (17.2%) |
| Wholesale Trade | 98 (100.0%) | 0 (0.0%) |
| Retail Trade | 336 (41.7%) | 470 (58.3%) |
| Transportation & Warehousing | 111 (89.5%) | 13 (10.5%) |
| Utilities | 237 (100.0%) | 0 (0.0%) |
| Information | 41 (19.6%) | 168 (80.4%) |
| Finance & Insurance | 24 (25.5%) | 70 (74.5%) |
| Real Estate, Rental & Leasing | 0 (0.0%) | 0 (0.0%) |
| Professional & Scientific | 4 (3.0%) | 128 (97.0%) |
| Enterprise Management | 0 (0.0%) | 0 (0.0%) |
| Administrative & Support | 106 (65.8%) | 55 (34.2%) |
| Educational Services | 314 (42.2%) | 430 (57.8%) |
| Health Care & Social Assistance | 315 (27.7%) | 824 (72.3%) |
| Arts, Entertainment & Recreation | 80 (100.0%) | 0 (0.0%) |
| Accommodation & Food Services | 176 (51.5%) | 166 (48.5%) |
| Public Administration | 89 (34.4%) | 170 (65.6%) |
| Total | 3,537 (57.6%) | 2,606 (42.4%) |
Education in Wyoming County
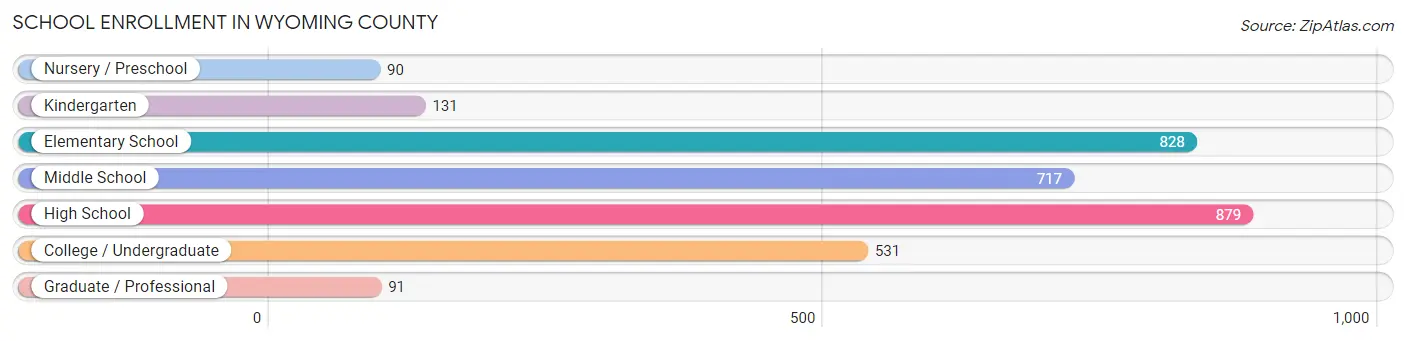
School Enrollment in Wyoming County
The most common levels of schooling among the 3,267 students in Wyoming County are high school (879 | 26.9%), elementary school (828 | 25.3%), and middle school (717 | 22.0%).
| School Level | # Students | % Students |
| Nursery / Preschool | 90 | 2.8% |
| Kindergarten | 131 | 4.0% |
| Elementary School | 828 | 25.3% |
| Middle School | 717 | 22.0% |
| High School | 879 | 26.9% |
| College / Undergraduate | 531 | 16.3% |
| Graduate / Professional | 91 | 2.8% |
| Total | 3,267 | 100.0% |
School Enrollment by Age by Funding Source in Wyoming County
Out of a total of 3,267 students who are enrolled in schools in Wyoming County, 114 (3.5%) attend a private institution, while the remaining 3,153 (96.5%) are enrolled in public schools. The age group of 35 years and over has the highest likelihood of being enrolled in private schools, with 13 (13.4% in the age bracket) enrolled. Conversely, the age group of 3 to 4 year olds has the lowest likelihood of being enrolled in a private school, with 84 (100.0% in the age bracket) attending a public institution.
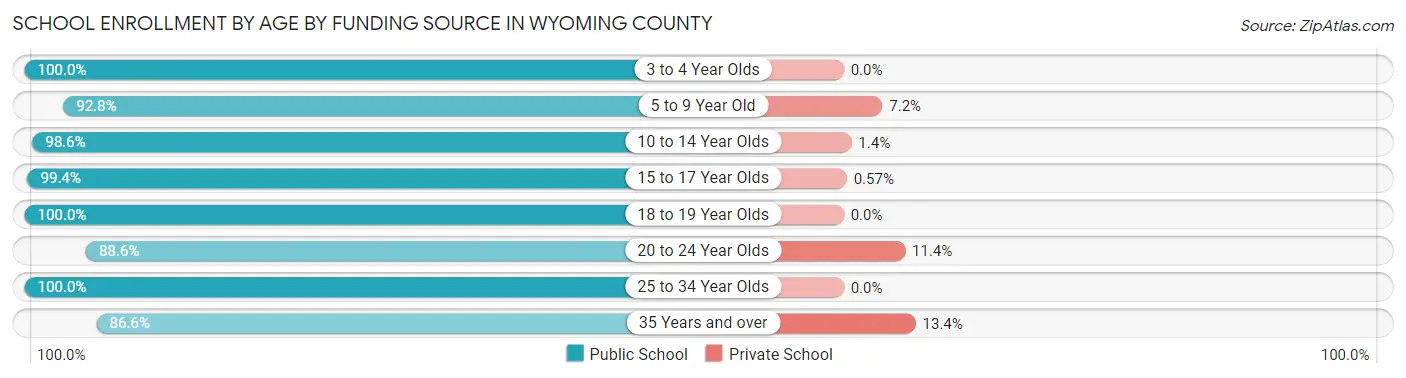
| Age Bracket | Public School | Private School |
| 3 to 4 Year Olds | 84 (100.0%) | 0 (0.0%) |
| 5 to 9 Year Old | 682 (92.8%) | 53 (7.2%) |
| 10 to 14 Year Olds | 955 (98.6%) | 14 (1.4%) |
| 15 to 17 Year Olds | 692 (99.4%) | 4 (0.6%) |
| 18 to 19 Year Olds | 299 (100.0%) | 0 (0.0%) |
| 20 to 24 Year Olds | 240 (88.6%) | 31 (11.4%) |
| 25 to 34 Year Olds | 116 (100.0%) | 0 (0.0%) |
| 35 Years and over | 84 (86.6%) | 13 (13.4%) |
| Total | 3,153 (96.5%) | 114 (3.5%) |
Educational Attainment by Field of Study in Wyoming County
Education (835 | 46.0%), business (285 | 15.7%), science & technology (187 | 10.3%), bio, nature & agricultural (103 | 5.7%), and liberal arts & history (95 | 5.2%) are the most common fields of study among 1,814 individuals in Wyoming County who have obtained a bachelor's degree or higher.
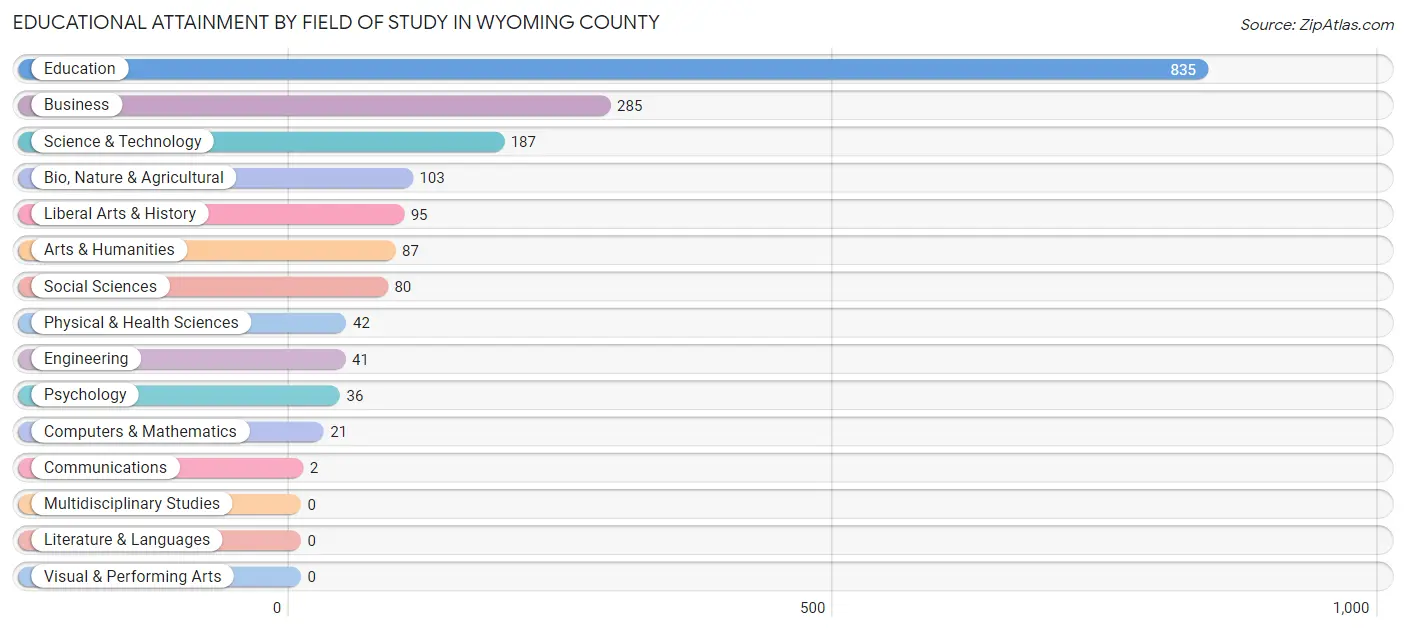
| Field of Study | # Graduates | % Graduates |
| Computers & Mathematics | 21 | 1.2% |
| Bio, Nature & Agricultural | 103 | 5.7% |
| Physical & Health Sciences | 42 | 2.3% |
| Psychology | 36 | 2.0% |
| Social Sciences | 80 | 4.4% |
| Engineering | 41 | 2.3% |
| Multidisciplinary Studies | 0 | 0.0% |
| Science & Technology | 187 | 10.3% |
| Business | 285 | 15.7% |
| Education | 835 | 46.0% |
| Literature & Languages | 0 | 0.0% |
| Liberal Arts & History | 95 | 5.2% |
| Visual & Performing Arts | 0 | 0.0% |
| Communications | 2 | 0.1% |
| Arts & Humanities | 87 | 4.8% |
| Total | 1,814 | 100.0% |
Transportation & Commute in Wyoming County
Vehicle Availability by Sex in Wyoming County
The most prevalent vehicle ownership categories in Wyoming County are males with 2 vehicles (1,340, accounting for 39.1%) and females with 2 vehicles (1,039, making up 52.7%).
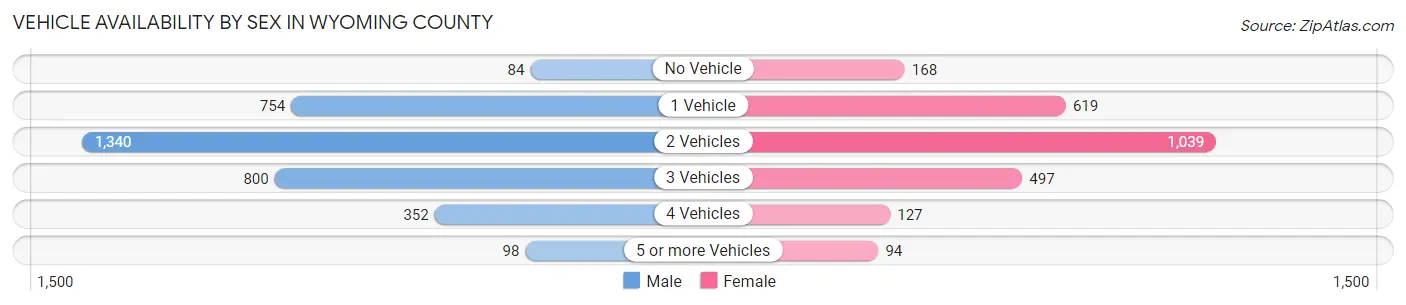
| Vehicles Available | Male | Female |
| No Vehicle | 84 (2.5%) | 168 (6.6%) |
| 1 Vehicle | 754 (22.0%) | 619 (24.3%) |
| 2 Vehicles | 1,340 (39.1%) | 1,039 (40.8%) |
| 3 Vehicles | 800 (23.3%) | 497 (19.5%) |
| 4 Vehicles | 352 (10.3%) | 127 (5.0%) |
| 5 or more Vehicles | 98 (2.9%) | 94 (3.7%) |
| Total | 3,428 (100.0%) | 2,544 (100.0%) |
Commute Time in Wyoming County
The most frequently occuring commute durations in Wyoming County are 15 to 19 minutes (813 commuters, 13.9%), 30 to 34 minutes (741 commuters, 12.7%), and 60 to 89 minutes (693 commuters, 11.8%).
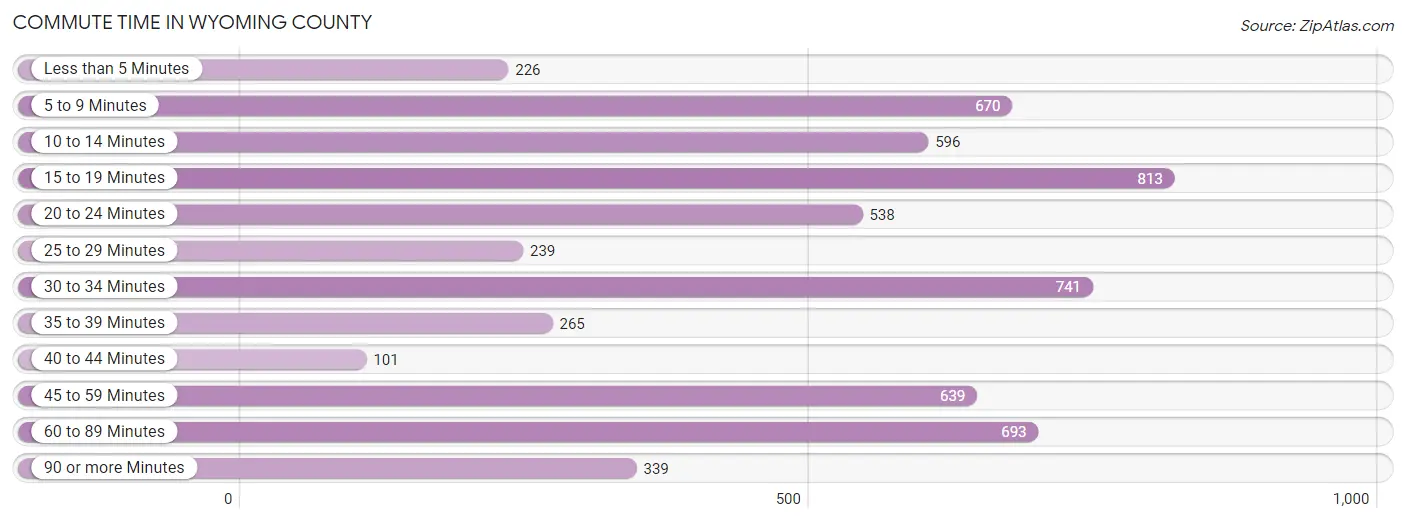
| Commute Time | # Commuters | % Commuters |
| Less than 5 Minutes | 226 | 3.9% |
| 5 to 9 Minutes | 670 | 11.4% |
| 10 to 14 Minutes | 596 | 10.2% |
| 15 to 19 Minutes | 813 | 13.9% |
| 20 to 24 Minutes | 538 | 9.2% |
| 25 to 29 Minutes | 239 | 4.1% |
| 30 to 34 Minutes | 741 | 12.7% |
| 35 to 39 Minutes | 265 | 4.5% |
| 40 to 44 Minutes | 101 | 1.7% |
| 45 to 59 Minutes | 639 | 10.9% |
| 60 to 89 Minutes | 693 | 11.8% |
| 90 or more Minutes | 339 | 5.8% |
Commute Time by Sex in Wyoming County
The most common commute times in Wyoming County are 60 to 89 minutes (576 commuters, 17.2%) for males and 15 to 19 minutes (568 commuters, 22.6%) for females.
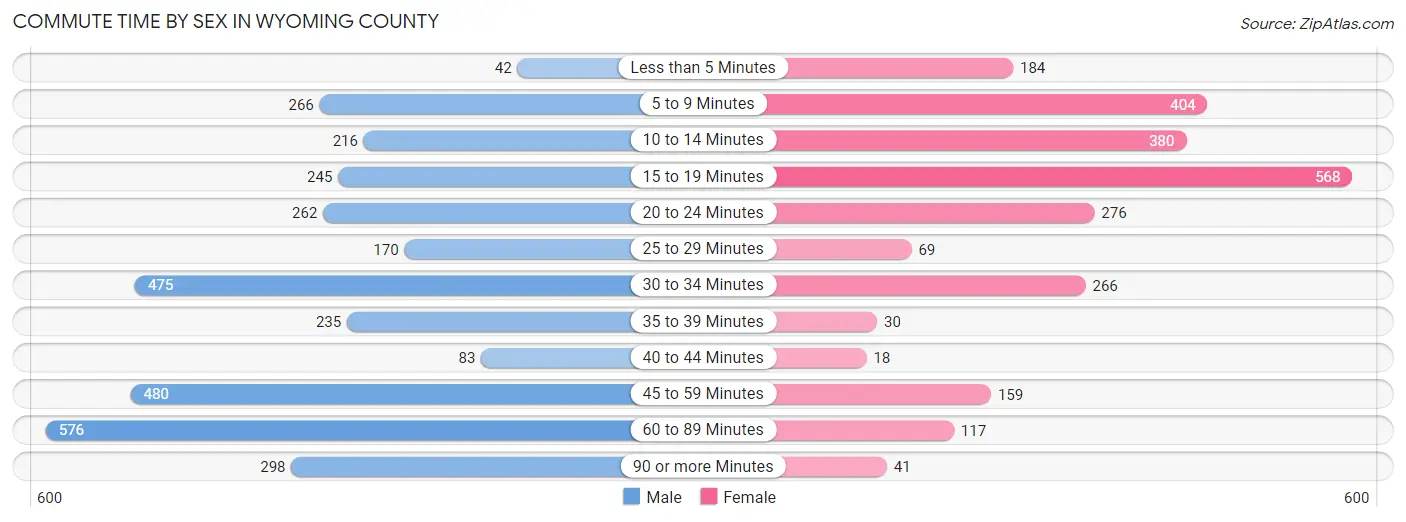
| Commute Time | Male | Female |
| Less than 5 Minutes | 42 (1.3%) | 184 (7.3%) |
| 5 to 9 Minutes | 266 (8.0%) | 404 (16.1%) |
| 10 to 14 Minutes | 216 (6.5%) | 380 (15.1%) |
| 15 to 19 Minutes | 245 (7.3%) | 568 (22.6%) |
| 20 to 24 Minutes | 262 (7.8%) | 276 (11.0%) |
| 25 to 29 Minutes | 170 (5.1%) | 69 (2.8%) |
| 30 to 34 Minutes | 475 (14.2%) | 266 (10.6%) |
| 35 to 39 Minutes | 235 (7.0%) | 30 (1.2%) |
| 40 to 44 Minutes | 83 (2.5%) | 18 (0.7%) |
| 45 to 59 Minutes | 480 (14.3%) | 159 (6.3%) |
| 60 to 89 Minutes | 576 (17.2%) | 117 (4.7%) |
| 90 or more Minutes | 298 (8.9%) | 41 (1.6%) |
Time of Departure to Work by Sex in Wyoming County
The most frequent times of departure to work in Wyoming County are 6:00 AM to 6:29 AM (551, 16.5%) for males and 8:00 AM to 8:29 AM (796, 31.7%) for females.
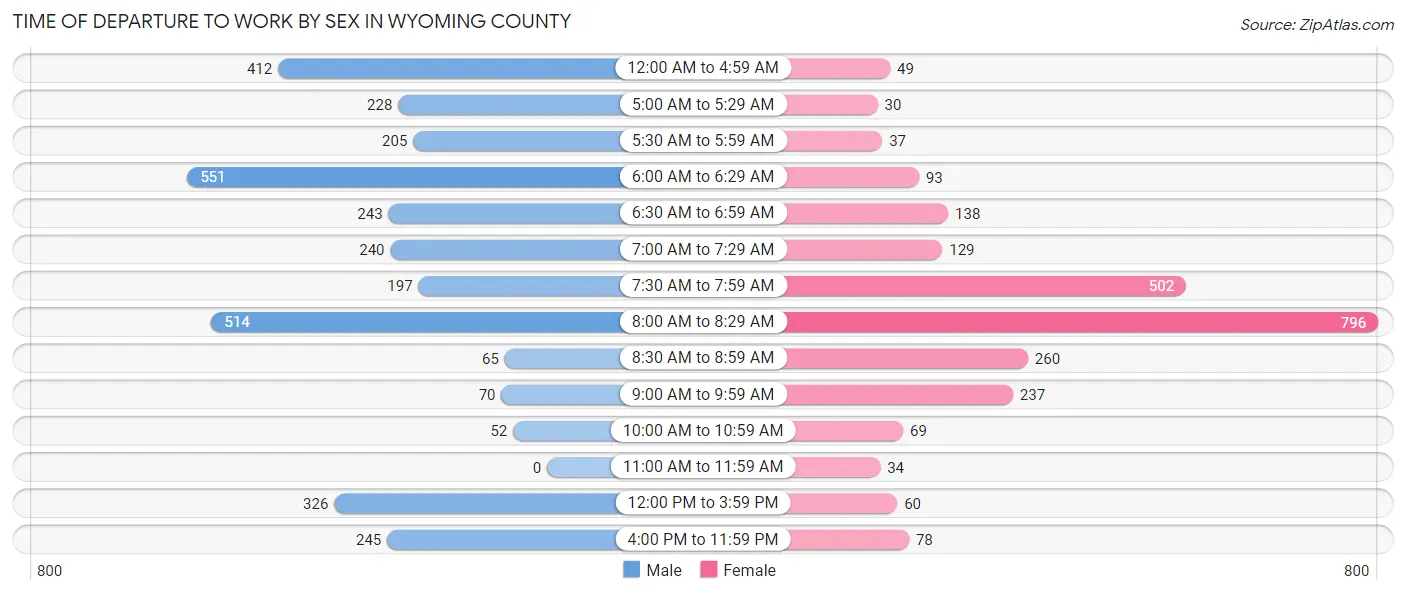
| Time of Departure | Male | Female |
| 12:00 AM to 4:59 AM | 412 (12.3%) | 49 (1.9%) |
| 5:00 AM to 5:29 AM | 228 (6.8%) | 30 (1.2%) |
| 5:30 AM to 5:59 AM | 205 (6.1%) | 37 (1.5%) |
| 6:00 AM to 6:29 AM | 551 (16.5%) | 93 (3.7%) |
| 6:30 AM to 6:59 AM | 243 (7.3%) | 138 (5.5%) |
| 7:00 AM to 7:29 AM | 240 (7.2%) | 129 (5.1%) |
| 7:30 AM to 7:59 AM | 197 (5.9%) | 502 (20.0%) |
| 8:00 AM to 8:29 AM | 514 (15.3%) | 796 (31.7%) |
| 8:30 AM to 8:59 AM | 65 (1.9%) | 260 (10.3%) |
| 9:00 AM to 9:59 AM | 70 (2.1%) | 237 (9.4%) |
| 10:00 AM to 10:59 AM | 52 (1.5%) | 69 (2.8%) |
| 11:00 AM to 11:59 AM | 0 (0.0%) | 34 (1.3%) |
| 12:00 PM to 3:59 PM | 326 (9.7%) | 60 (2.4%) |
| 4:00 PM to 11:59 PM | 245 (7.3%) | 78 (3.1%) |
| Total | 3,348 (100.0%) | 2,512 (100.0%) |
Housing Occupancy in Wyoming County
Occupancy by Ownership in Wyoming County
Of the total 7,724 dwellings in Wyoming County, owner-occupied units account for 6,209 (80.4%), while renter-occupied units make up 1,515 (19.6%).
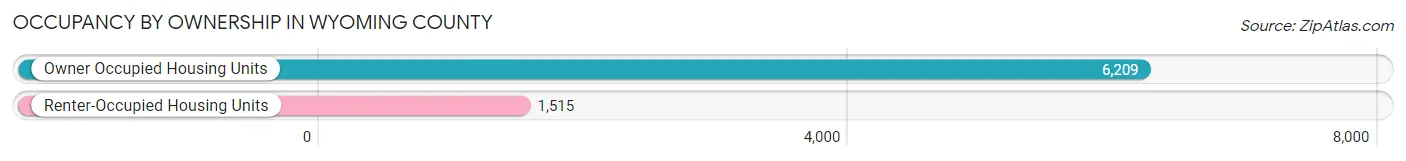
| Occupancy | # Housing Units | % Housing Units |
| Owner Occupied Housing Units | 6,209 | 80.4% |
| Renter-Occupied Housing Units | 1,515 | 19.6% |
| Total Occupied Housing Units | 7,724 | 100.0% |
Occupancy by Household Size in Wyoming County
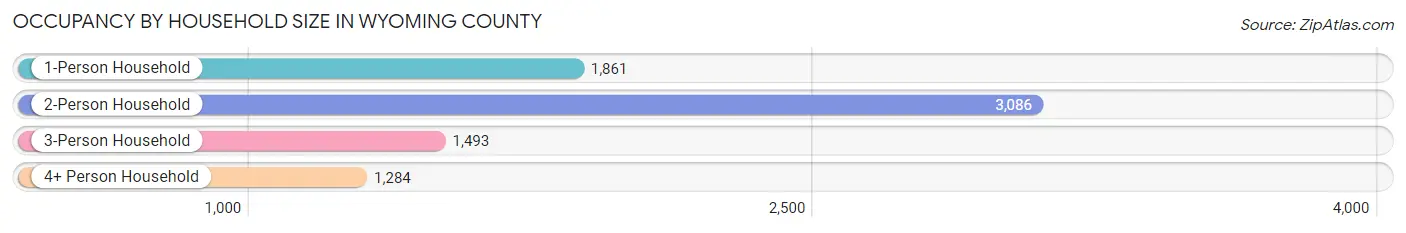
| Household Size | # Housing Units | % Housing Units |
| 1-Person Household | 1,861 | 24.1% |
| 2-Person Household | 3,086 | 40.0% |
| 3-Person Household | 1,493 | 19.3% |
| 4+ Person Household | 1,284 | 16.6% |
| Total Housing Units | 7,724 | 100.0% |
Occupancy by Ownership by Household Size in Wyoming County
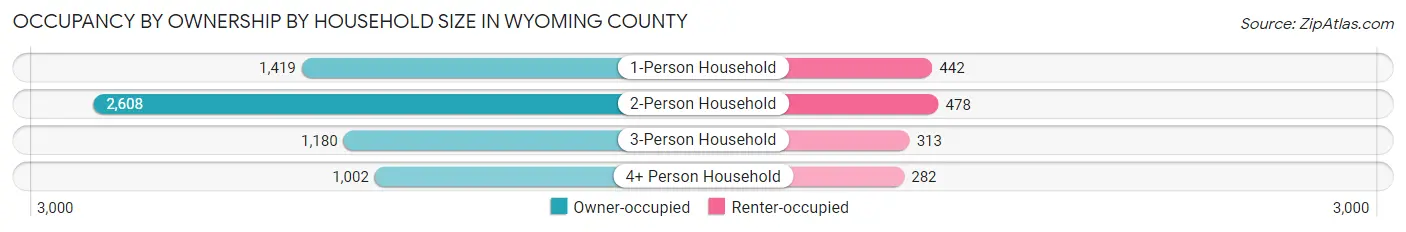
| Household Size | Owner-occupied | Renter-occupied |
| 1-Person Household | 1,419 (76.2%) | 442 (23.7%) |
| 2-Person Household | 2,608 (84.5%) | 478 (15.5%) |
| 3-Person Household | 1,180 (79.0%) | 313 (21.0%) |
| 4+ Person Household | 1,002 (78.0%) | 282 (22.0%) |
| Total Housing Units | 6,209 (80.4%) | 1,515 (19.6%) |
Occupancy by Educational Attainment in Wyoming County
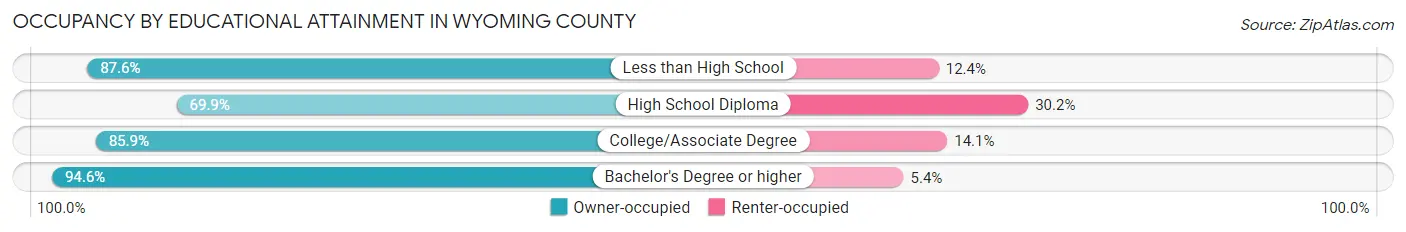
| Household Size | Owner-occupied | Renter-occupied |
| Less than High School | 1,559 (87.6%) | 221 (12.4%) |
| High School Diploma | 2,393 (69.9%) | 1,033 (30.1%) |
| College/Associate Degree | 1,230 (85.9%) | 202 (14.1%) |
| Bachelor's Degree or higher | 1,027 (94.6%) | 59 (5.4%) |
Occupancy by Age of Householder in Wyoming County
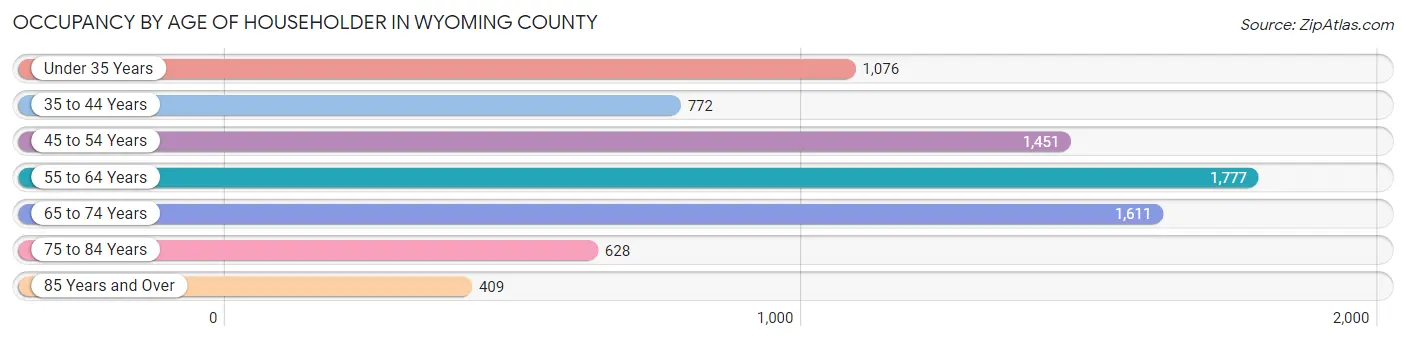
| Age Bracket | # Households | % Households |
| Under 35 Years | 1,076 | 13.9% |
| 35 to 44 Years | 772 | 10.0% |
| 45 to 54 Years | 1,451 | 18.8% |
| 55 to 64 Years | 1,777 | 23.0% |
| 65 to 74 Years | 1,611 | 20.9% |
| 75 to 84 Years | 628 | 8.1% |
| 85 Years and Over | 409 | 5.3% |
| Total | 7,724 | 100.0% |
Housing Finances in Wyoming County
Median Income by Occupancy in Wyoming County
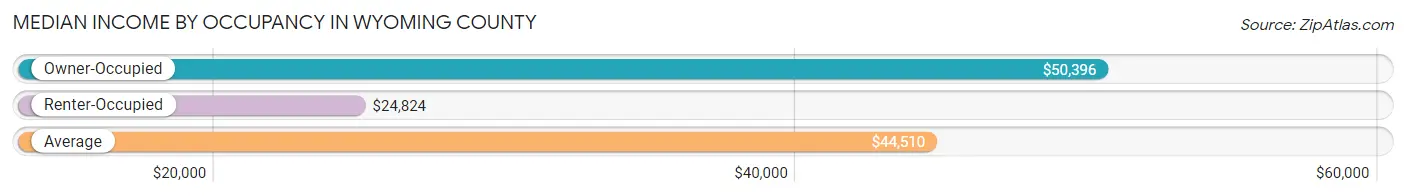
| Occupancy Type | # Households | Median Income |
| Owner-Occupied | 6,209 (80.4%) | $50,396 |
| Renter-Occupied | 1,515 (19.6%) | $24,824 |
| Average | 7,724 (100.0%) | $44,510 |
Occupancy by Householder Income Bracket in Wyoming County
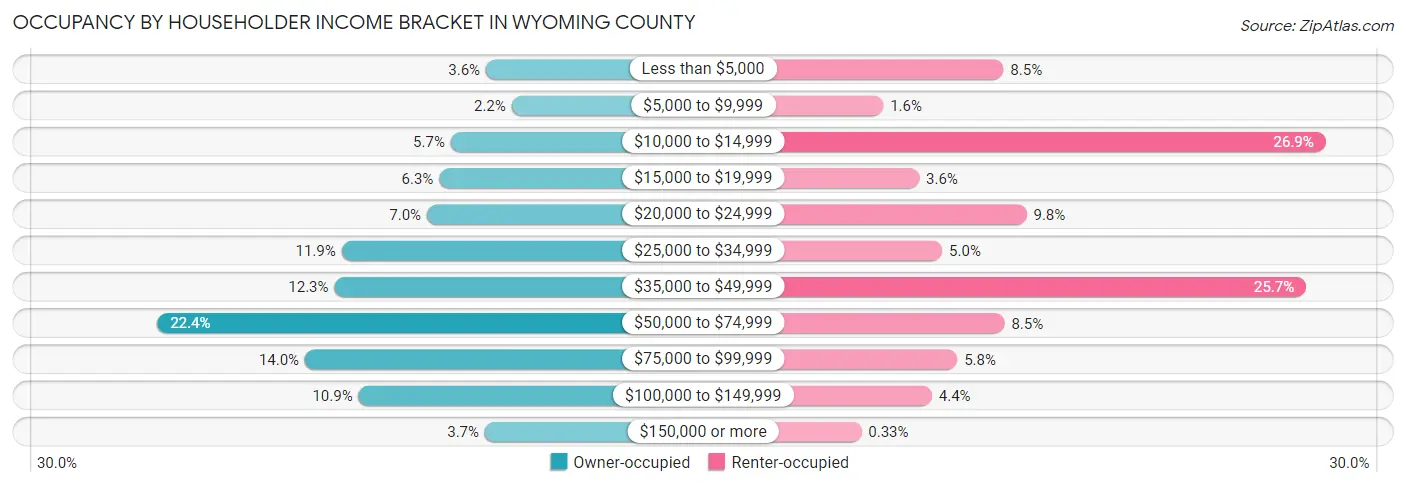
| Income Bracket | Owner-occupied | Renter-occupied |
| Less than $5,000 | 226 (3.6%) | 128 (8.5%) |
| $5,000 to $9,999 | 135 (2.2%) | 24 (1.6%) |
| $10,000 to $14,999 | 351 (5.7%) | 407 (26.9%) |
| $15,000 to $19,999 | 392 (6.3%) | 55 (3.6%) |
| $20,000 to $24,999 | 435 (7.0%) | 148 (9.8%) |
| $25,000 to $34,999 | 738 (11.9%) | 75 (5.0%) |
| $35,000 to $49,999 | 764 (12.3%) | 390 (25.7%) |
| $50,000 to $74,999 | 1,392 (22.4%) | 129 (8.5%) |
| $75,000 to $99,999 | 868 (14.0%) | 88 (5.8%) |
| $100,000 to $149,999 | 678 (10.9%) | 66 (4.4%) |
| $150,000 or more | 230 (3.7%) | 5 (0.3%) |
| Total | 6,209 (100.0%) | 1,515 (100.0%) |
Monthly Housing Cost Tiers in Wyoming County
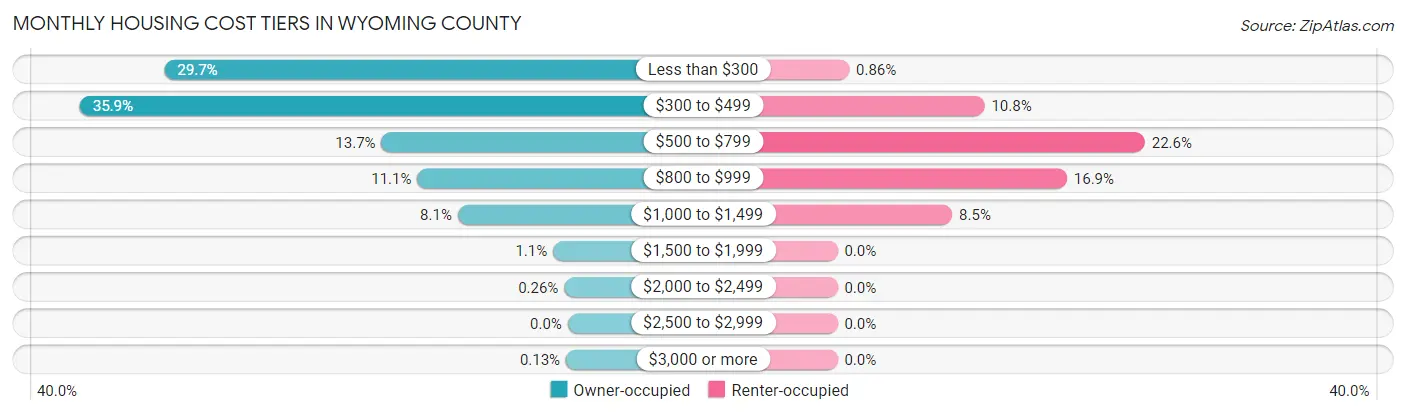
| Monthly Cost | Owner-occupied | Renter-occupied |
| Less than $300 | 1,844 (29.7%) | 13 (0.9%) |
| $300 to $499 | 2,231 (35.9%) | 164 (10.8%) |
| $500 to $799 | 852 (13.7%) | 343 (22.6%) |
| $800 to $999 | 688 (11.1%) | 256 (16.9%) |
| $1,000 to $1,499 | 503 (8.1%) | 128 (8.5%) |
| $1,500 to $1,999 | 67 (1.1%) | 0 (0.0%) |
| $2,000 to $2,499 | 16 (0.3%) | 0 (0.0%) |
| $2,500 to $2,999 | 0 (0.0%) | 0 (0.0%) |
| $3,000 or more | 8 (0.1%) | 0 (0.0%) |
| Total | 6,209 (100.0%) | 1,515 (100.0%) |
Physical Housing Characteristics in Wyoming County
Housing Structures in Wyoming County
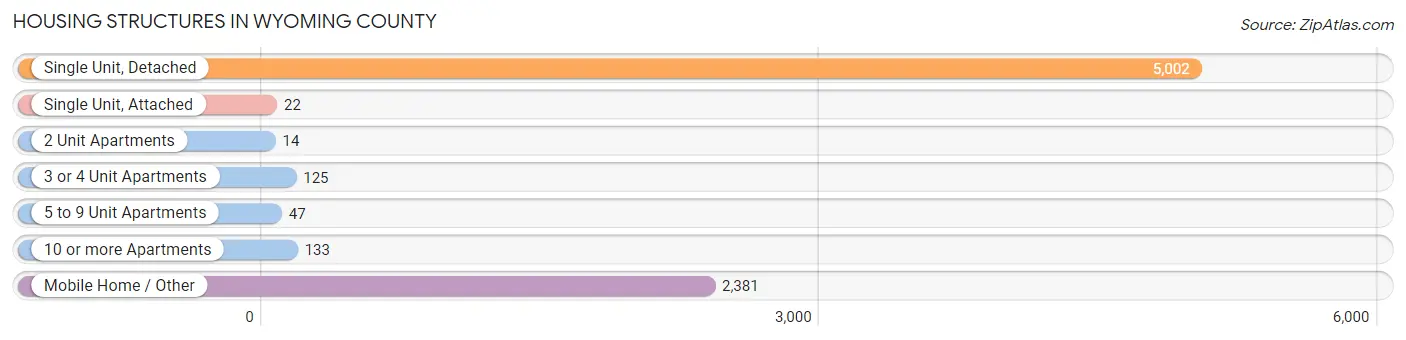
| Structure Type | # Housing Units | % Housing Units |
| Single Unit, Detached | 5,002 | 64.8% |
| Single Unit, Attached | 22 | 0.3% |
| 2 Unit Apartments | 14 | 0.2% |
| 3 or 4 Unit Apartments | 125 | 1.6% |
| 5 to 9 Unit Apartments | 47 | 0.6% |
| 10 or more Apartments | 133 | 1.7% |
| Mobile Home / Other | 2,381 | 30.8% |
| Total | 7,724 | 100.0% |
Housing Structures by Occupancy in Wyoming County
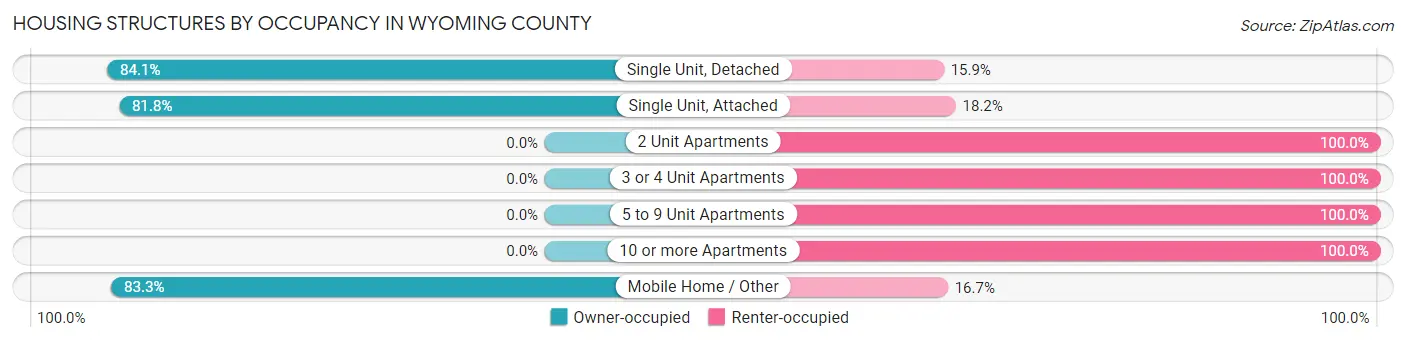
| Structure Type | Owner-occupied | Renter-occupied |
| Single Unit, Detached | 4,207 (84.1%) | 795 (15.9%) |
| Single Unit, Attached | 18 (81.8%) | 4 (18.2%) |
| 2 Unit Apartments | 0 (0.0%) | 14 (100.0%) |
| 3 or 4 Unit Apartments | 0 (0.0%) | 125 (100.0%) |
| 5 to 9 Unit Apartments | 0 (0.0%) | 47 (100.0%) |
| 10 or more Apartments | 0 (0.0%) | 133 (100.0%) |
| Mobile Home / Other | 1,984 (83.3%) | 397 (16.7%) |
| Total | 6,209 (80.4%) | 1,515 (19.6%) |
Housing Structures by Number of Rooms in Wyoming County
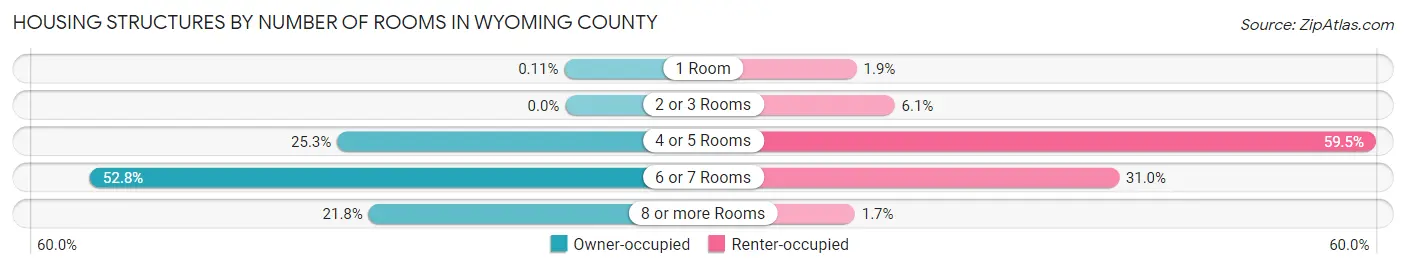
| Number of Rooms | Owner-occupied | Renter-occupied |
| 1 Room | 7 (0.1%) | 28 (1.8%) |
| 2 or 3 Rooms | 0 (0.0%) | 92 (6.1%) |
| 4 or 5 Rooms | 1,572 (25.3%) | 901 (59.5%) |
| 6 or 7 Rooms | 3,275 (52.7%) | 469 (31.0%) |
| 8 or more Rooms | 1,355 (21.8%) | 25 (1.7%) |
| Total | 6,209 (100.0%) | 1,515 (100.0%) |
Housing Structure by Heating Type in Wyoming County
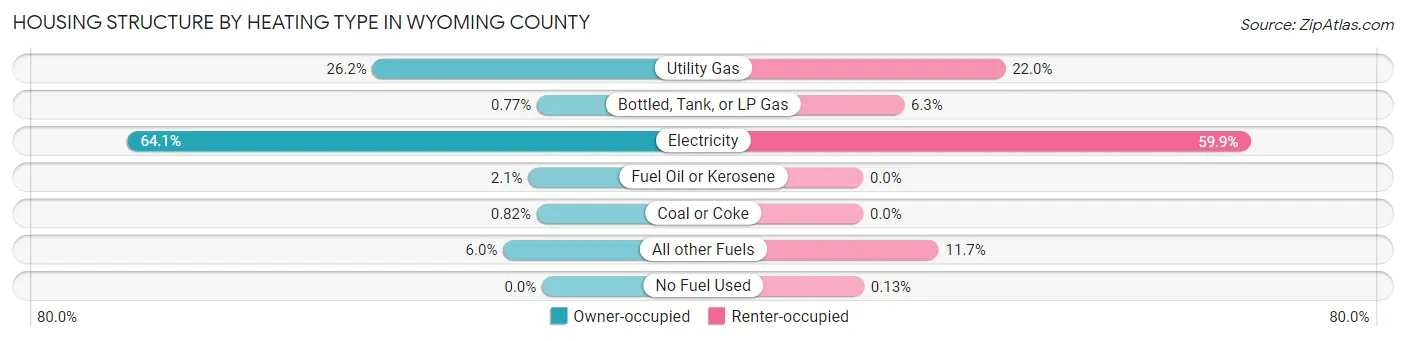
| Heating Type | Owner-occupied | Renter-occupied |
| Utility Gas | 1,627 (26.2%) | 333 (22.0%) |
| Bottled, Tank, or LP Gas | 48 (0.8%) | 96 (6.3%) |
| Electricity | 3,979 (64.1%) | 907 (59.9%) |
| Fuel Oil or Kerosene | 131 (2.1%) | 0 (0.0%) |
| Coal or Coke | 51 (0.8%) | 0 (0.0%) |
| All other Fuels | 373 (6.0%) | 177 (11.7%) |
| No Fuel Used | 0 (0.0%) | 2 (0.1%) |
| Total | 6,209 (100.0%) | 1,515 (100.0%) |
Household Vehicle Usage in Wyoming County
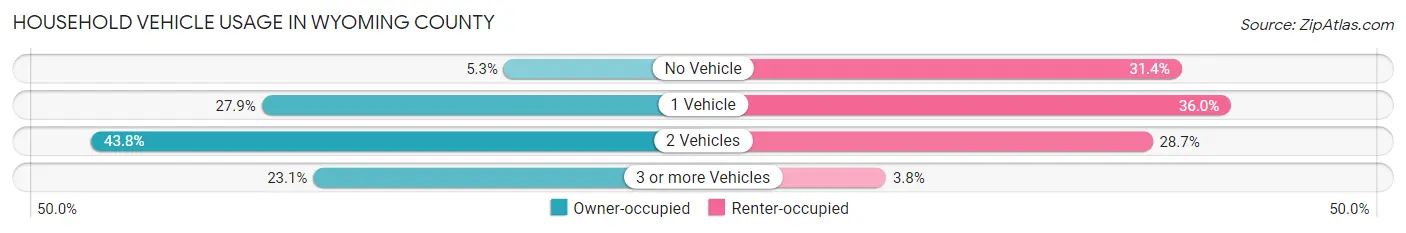
| Vehicles per Household | Owner-occupied | Renter-occupied |
| No Vehicle | 327 (5.3%) | 476 (31.4%) |
| 1 Vehicle | 1,731 (27.9%) | 546 (36.0%) |
| 2 Vehicles | 2,719 (43.8%) | 435 (28.7%) |
| 3 or more Vehicles | 1,432 (23.1%) | 58 (3.8%) |
| Total | 6,209 (100.0%) | 1,515 (100.0%) |
Real Estate & Mortgages in Wyoming County
Real Estate and Mortgage Overview in Wyoming County
| Characteristic | Without Mortgage | With Mortgage |
| Housing Units | 4,701 | 1,508 |
| Median Property Value | $58,700 | $94,000 |
| Median Household Income | $47,608 | $110 |
| Monthly Housing Costs | $349 | $8 |
| Real Estate Taxes | $333 | $189 |
Property Value by Mortgage Status in Wyoming County
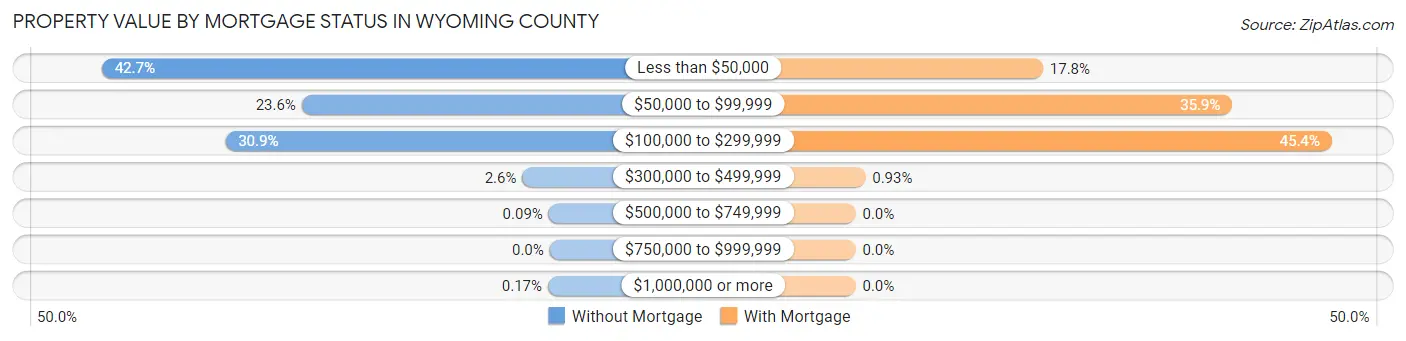
| Property Value | Without Mortgage | With Mortgage |
| Less than $50,000 | 2,005 (42.6%) | 269 (17.8%) |
| $50,000 to $99,999 | 1,110 (23.6%) | 541 (35.9%) |
| $100,000 to $299,999 | 1,452 (30.9%) | 684 (45.4%) |
| $300,000 to $499,999 | 122 (2.6%) | 14 (0.9%) |
| $500,000 to $749,999 | 4 (0.1%) | 0 (0.0%) |
| $750,000 to $999,999 | 0 (0.0%) | 0 (0.0%) |
| $1,000,000 or more | 8 (0.2%) | 0 (0.0%) |
| Total | 4,701 (100.0%) | 1,508 (100.0%) |
Household Income by Mortgage Status in Wyoming County
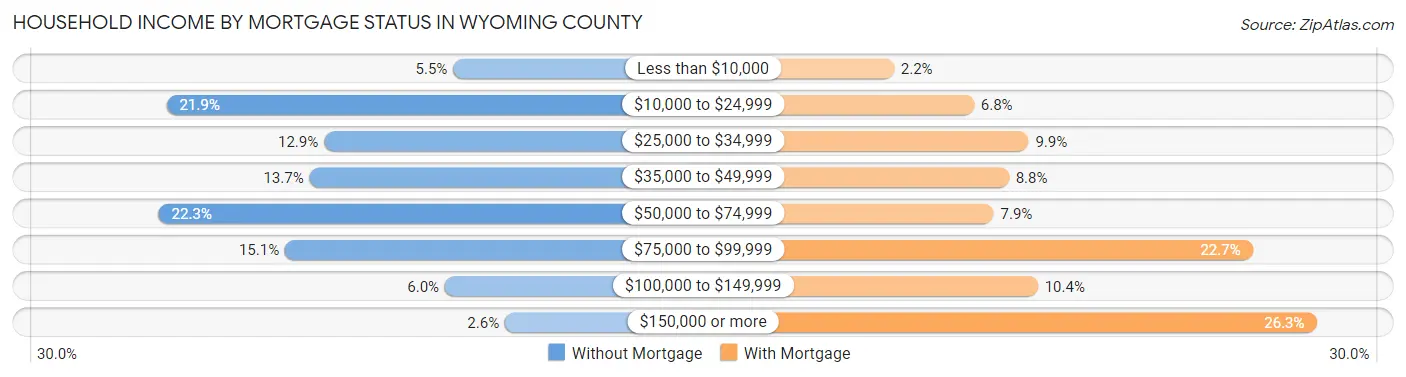
| Household Income | Without Mortgage | With Mortgage |
| Less than $10,000 | 259 (5.5%) | 33 (2.2%) |
| $10,000 to $24,999 | 1,029 (21.9%) | 102 (6.8%) |
| $25,000 to $34,999 | 606 (12.9%) | 149 (9.9%) |
| $35,000 to $49,999 | 645 (13.7%) | 132 (8.7%) |
| $50,000 to $74,999 | 1,050 (22.3%) | 119 (7.9%) |
| $75,000 to $99,999 | 711 (15.1%) | 342 (22.7%) |
| $100,000 to $149,999 | 281 (6.0%) | 157 (10.4%) |
| $150,000 or more | 120 (2.5%) | 397 (26.3%) |
| Total | 4,701 (100.0%) | 1,508 (100.0%) |
Property Value to Household Income Ratio in Wyoming County
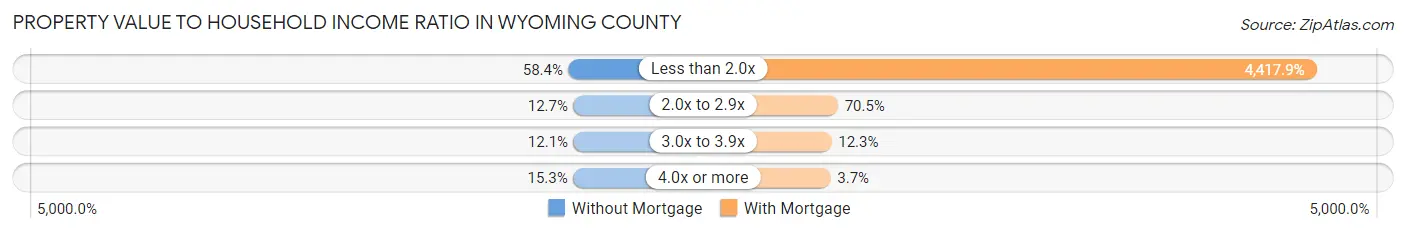
| Value-to-Income Ratio | Without Mortgage | With Mortgage |
| Less than 2.0x | 2,746 (58.4%) | 66,622 (4,417.9%) |
| 2.0x to 2.9x | 595 (12.7%) | 1,063 (70.5%) |
| 3.0x to 3.9x | 569 (12.1%) | 185 (12.3%) |
| 4.0x or more | 721 (15.3%) | 56 (3.7%) |
| Total | 4,701 (100.0%) | 1,508 (100.0%) |
Real Estate Taxes by Mortgage Status in Wyoming County
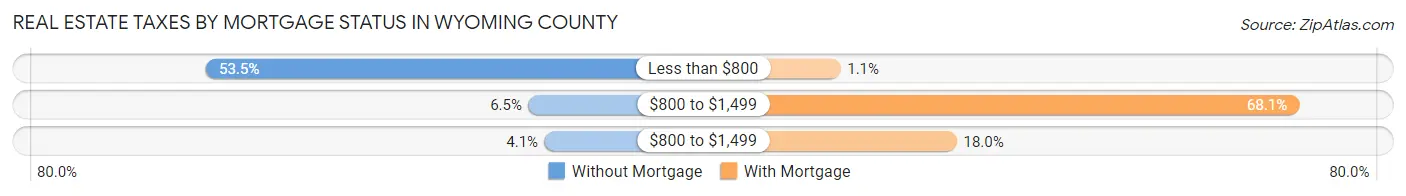
| Property Taxes | Without Mortgage | With Mortgage |
| Less than $800 | 2,514 (53.5%) | 16 (1.1%) |
| $800 to $1,499 | 304 (6.5%) | 1,027 (68.1%) |
| $800 to $1,499 | 193 (4.1%) | 272 (18.0%) |
| Total | 4,701 (100.0%) | 1,508 (100.0%) |
Health & Disability in Wyoming County
Health Insurance Coverage by Age in Wyoming County
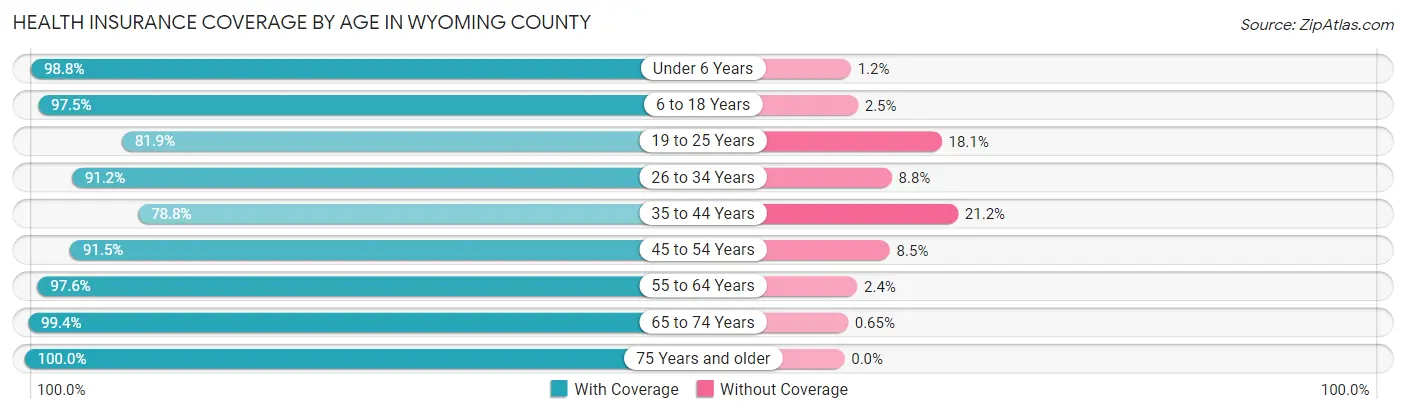
| Age Bracket | With Coverage | Without Coverage |
| Under 6 Years | 1,070 (98.8%) | 13 (1.2%) |
| 6 to 18 Years | 3,448 (97.5%) | 89 (2.5%) |
| 19 to 25 Years | 1,101 (81.9%) | 244 (18.1%) |
| 26 to 34 Years | 1,892 (91.2%) | 183 (8.8%) |
| 35 to 44 Years | 1,904 (78.8%) | 512 (21.2%) |
| 45 to 54 Years | 2,631 (91.5%) | 243 (8.5%) |
| 55 to 64 Years | 3,022 (97.6%) | 74 (2.4%) |
| 65 to 74 Years | 3,063 (99.4%) | 20 (0.6%) |
| 75 Years and older | 1,654 (100.0%) | 0 (0.0%) |
| Total | 19,785 (93.5%) | 1,378 (6.5%) |
Health Insurance Coverage by Citizenship Status in Wyoming County
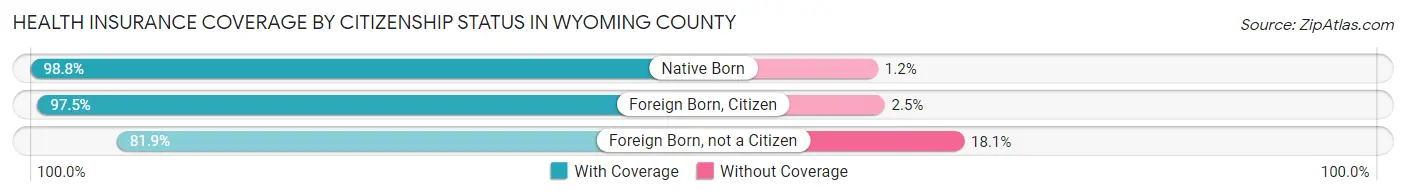
| Citizenship Status | With Coverage | Without Coverage |
| Native Born | 1,070 (98.8%) | 13 (1.2%) |
| Foreign Born, Citizen | 3,448 (97.5%) | 89 (2.5%) |
| Foreign Born, not a Citizen | 1,101 (81.9%) | 244 (18.1%) |
Health Insurance Coverage by Household Income in Wyoming County
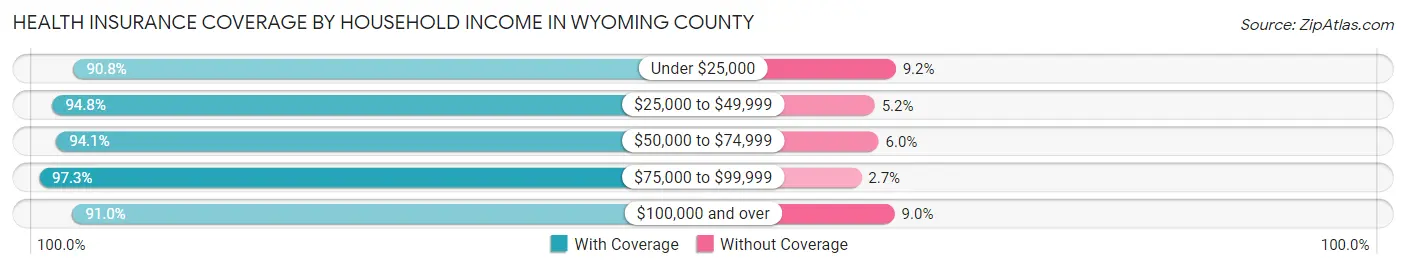
| Household Income | With Coverage | Without Coverage |
| Under $25,000 | 4,533 (90.8%) | 457 (9.2%) |
| $25,000 to $49,999 | 4,788 (94.8%) | 264 (5.2%) |
| $50,000 to $74,999 | 4,667 (94.1%) | 295 (5.9%) |
| $75,000 to $99,999 | 2,937 (97.3%) | 82 (2.7%) |
| $100,000 and over | 2,842 (91.0%) | 280 (9.0%) |
Public vs Private Health Insurance Coverage by Age in Wyoming County
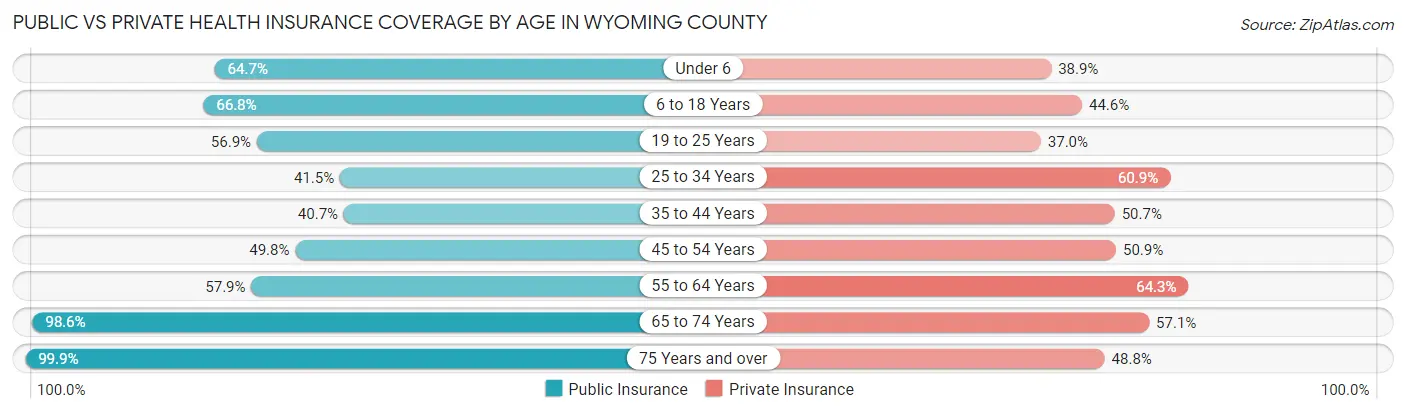
| Age Bracket | Public Insurance | Private Insurance |
| Under 6 | 701 (64.7%) | 421 (38.9%) |
| 6 to 18 Years | 2,363 (66.8%) | 1,577 (44.6%) |
| 19 to 25 Years | 765 (56.9%) | 497 (36.9%) |
| 25 to 34 Years | 860 (41.4%) | 1,264 (60.9%) |
| 35 to 44 Years | 984 (40.7%) | 1,224 (50.7%) |
| 45 to 54 Years | 1,430 (49.8%) | 1,463 (50.9%) |
| 55 to 64 Years | 1,793 (57.9%) | 1,991 (64.3%) |
| 65 to 74 Years | 3,039 (98.6%) | 1,759 (57.1%) |
| 75 Years and over | 1,652 (99.9%) | 807 (48.8%) |
| Total | 13,587 (64.2%) | 11,003 (52.0%) |
Disability Status by Sex by Age in Wyoming County
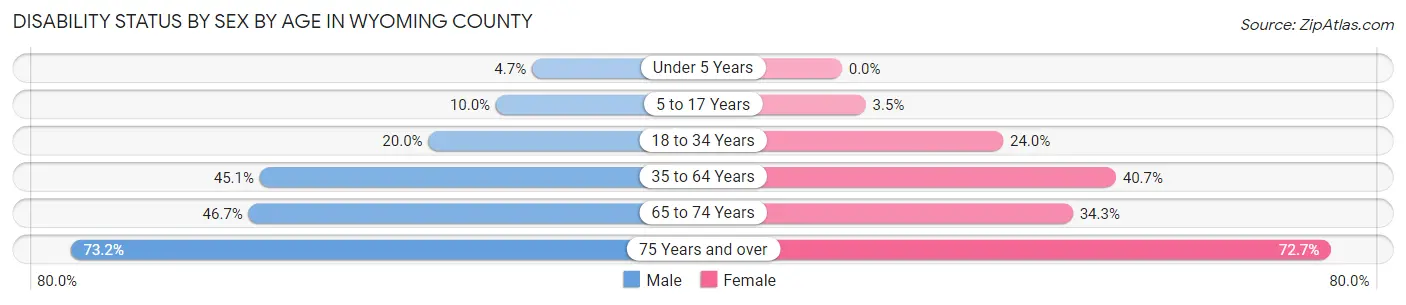
| Age Bracket | Male | Female |
| Under 5 Years | 26 (4.7%) | 0 (0.0%) |
| 5 to 17 Years | 163 (10.0%) | 58 (3.5%) |
| 18 to 34 Years | 394 (20.0%) | 426 (23.9%) |
| 35 to 64 Years | 1,845 (45.1%) | 1,747 (40.7%) |
| 65 to 74 Years | 743 (46.7%) | 512 (34.3%) |
| 75 Years and over | 584 (73.2%) | 622 (72.7%) |
Disability Class by Sex by Age in Wyoming County
Disability Class: Hearing Difficulty
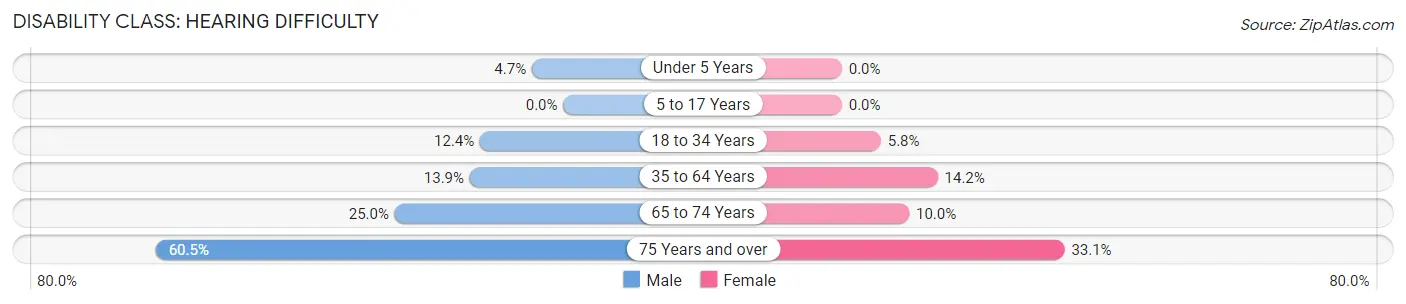
| Age Bracket | Male | Female |
| Under 5 Years | 26 (4.7%) | 0 (0.0%) |
| 5 to 17 Years | 0 (0.0%) | 0 (0.0%) |
| 18 to 34 Years | 243 (12.4%) | 103 (5.8%) |
| 35 to 64 Years | 568 (13.9%) | 611 (14.2%) |
| 65 to 74 Years | 398 (25.0%) | 149 (10.0%) |
| 75 Years and over | 483 (60.5%) | 283 (33.1%) |
Disability Class: Vision Difficulty
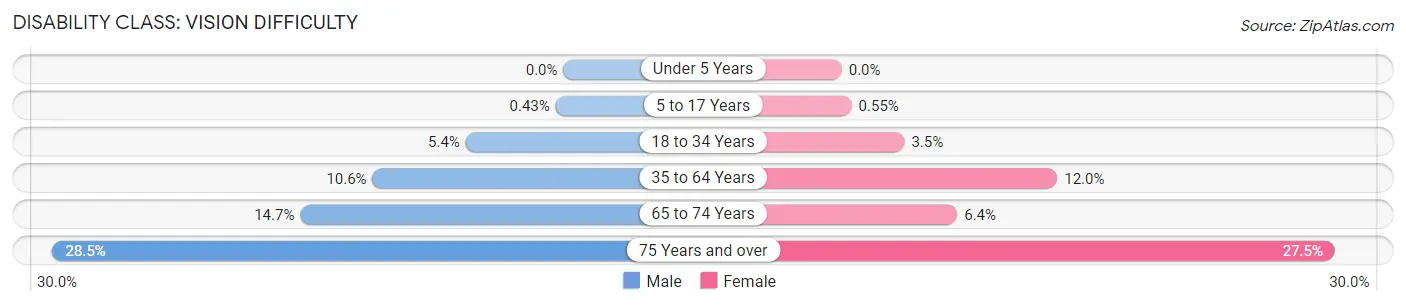
| Age Bracket | Male | Female |
| Under 5 Years | 0 (0.0%) | 0 (0.0%) |
| 5 to 17 Years | 7 (0.4%) | 9 (0.5%) |
| 18 to 34 Years | 107 (5.4%) | 62 (3.5%) |
| 35 to 64 Years | 435 (10.6%) | 515 (12.0%) |
| 65 to 74 Years | 233 (14.6%) | 96 (6.4%) |
| 75 Years and over | 227 (28.4%) | 235 (27.5%) |
Disability Class: Cognitive Difficulty
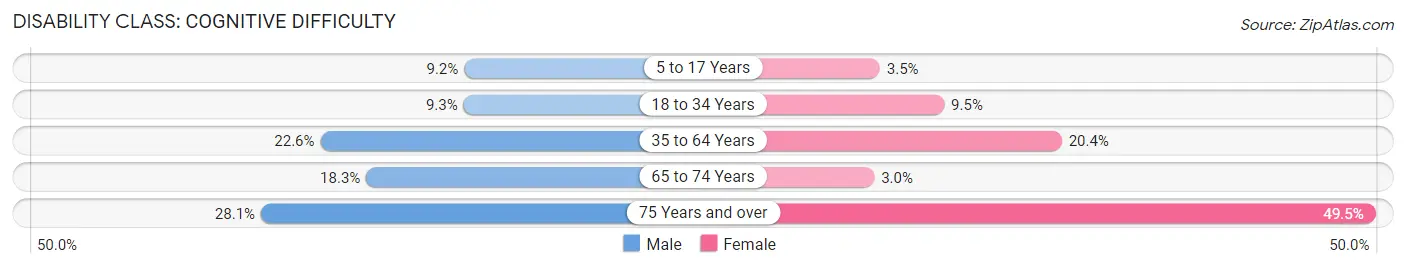
| Age Bracket | Male | Female |
| 5 to 17 Years | 150 (9.2%) | 58 (3.5%) |
| 18 to 34 Years | 182 (9.3%) | 169 (9.5%) |
| 35 to 64 Years | 923 (22.6%) | 876 (20.4%) |
| 65 to 74 Years | 291 (18.3%) | 45 (3.0%) |
| 75 Years and over | 224 (28.1%) | 424 (49.5%) |
Disability Class: Ambulatory Difficulty
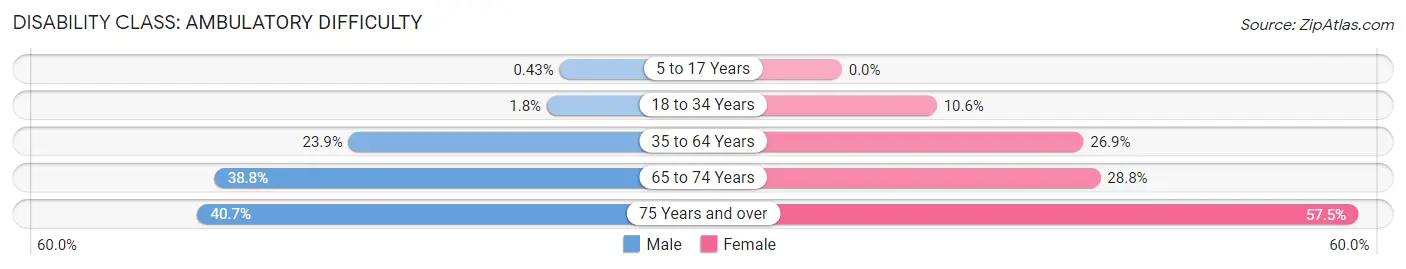
| Age Bracket | Male | Female |
| 5 to 17 Years | 7 (0.4%) | 0 (0.0%) |
| 18 to 34 Years | 36 (1.8%) | 188 (10.6%) |
| 35 to 64 Years | 979 (23.9%) | 1,155 (26.9%) |
| 65 to 74 Years | 617 (38.8%) | 430 (28.8%) |
| 75 Years and over | 325 (40.7%) | 492 (57.5%) |
Disability Class: Self-Care Difficulty
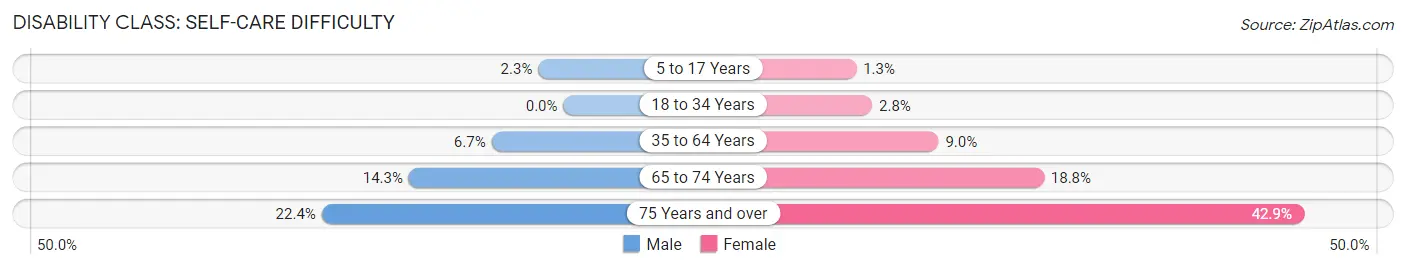
| Age Bracket | Male | Female |
| 5 to 17 Years | 38 (2.3%) | 22 (1.3%) |
| 18 to 34 Years | 0 (0.0%) | 50 (2.8%) |
| 35 to 64 Years | 273 (6.7%) | 385 (9.0%) |
| 65 to 74 Years | 228 (14.3%) | 280 (18.8%) |
| 75 Years and over | 179 (22.4%) | 367 (42.9%) |
Technology Access in Wyoming County
Computing Device Access in Wyoming County
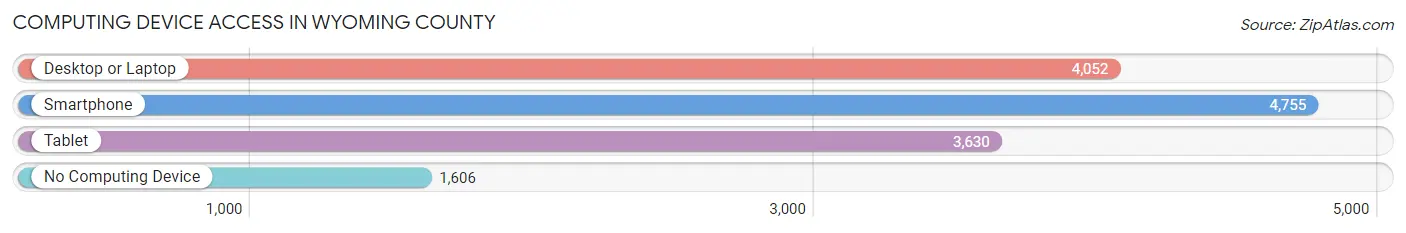
| Device Type | # Households | % Households |
| Desktop or Laptop | 4,052 | 52.5% |
| Smartphone | 4,755 | 61.6% |
| Tablet | 3,630 | 47.0% |
| No Computing Device | 1,606 | 20.8% |
| Total | 7,724 | 100.0% |
Internet Access in Wyoming County
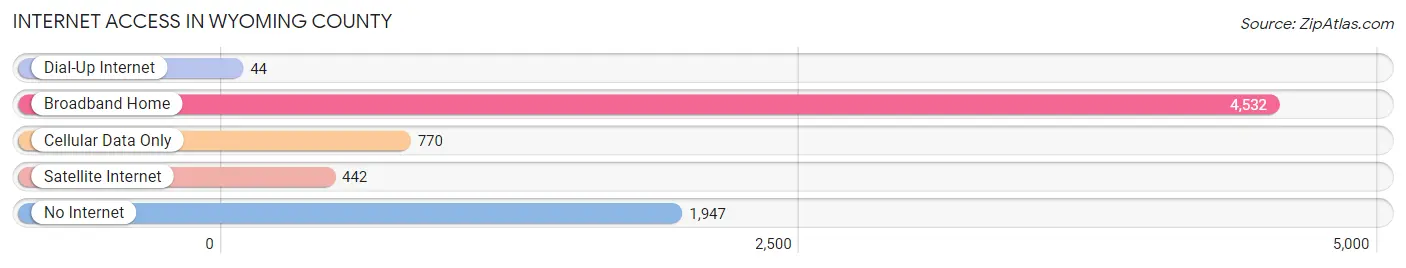
| Internet Type | # Households | % Households |
| Dial-Up Internet | 44 | 0.6% |
| Broadband Home | 4,532 | 58.7% |
| Cellular Data Only | 770 | 10.0% |
| Satellite Internet | 442 | 5.7% |
| No Internet | 1,947 | 25.2% |
| Total | 7,724 | 100.0% |
Wyoming County Summary
Wyoming County is located in the southwestern part of West Virginia, and is part of the Appalachian region. It is bordered by McDowell County to the north, Mercer County to the east, Raleigh County to the south, and Mingo County to the west. The county seat is Pineville, and the county was created in 1850 from parts of Logan and Raleigh counties.
Geography
Wyoming County is located in the Appalachian Mountains, and is part of the Allegheny Plateau. The county is mostly mountainous, with elevations ranging from 1,000 to 4,000 feet. The highest point in the county is Big Coal Mountain, at 4,039 feet. The county is drained by the Guyandotte River, which flows through the county from north to south. The county is also home to several state parks, including Bluestone State Park, Little Beaver State Park, and Twin Falls State Park.
Demographics
As of the 2010 census, Wyoming County had a population of 23,796. The population was 97.2% white, 1.2% black or African American, 0.2% Native American, 0.2% Asian, 0.1% Pacific Islander, 0.3% from other races, and 0.9% from two or more races. Hispanic or Latino of any race were 0.7% of the population.
The median income for a household in the county was $25,945, and the median income for a family was $32,917. The per capita income for the county was $14,945. About 17.2% of families and 22.2% of the population were below the poverty line, including 28.2% of those under age 18 and 16.2% of those age 65 or over.
Economy
Wyoming County is largely rural, and the economy is based on agriculture and natural resources. The county is home to several coal mines, and coal mining is a major industry in the county. Other industries include timber, natural gas, and tourism. The county is also home to several small businesses, including restaurants, retail stores, and service providers.
The county is served by the Wyoming County Board of Education, which operates seven public schools. The county is also home to several higher education institutions, including Southern West Virginia Community and Technical College, West Virginia University Institute of Technology, and the University of Charleston.
Conclusion
Wyoming County is a rural county located in the Appalachian Mountains of West Virginia. The county is home to 23,796 people, and the economy is based on agriculture, natural resources, and tourism. The county is served by the Wyoming County Board of Education, and is home to several higher education institutions.
Common Questions
What is the Total Population of Wyoming County?
Total Population of Wyoming County is 21,237.
What is the Total Male Population of Wyoming County?
Total Male Population of Wyoming County is 10,650.
What is the Total Female Population of Wyoming County?
Total Female Population of Wyoming County is 10,587.
What is the Ratio of Males per 100 Females in Wyoming County?
There are 100.60 Males per 100 Females in Wyoming County.
What is the Ratio of Females per 100 Males in Wyoming County?
There are 99.41 Females per 100 Males in Wyoming County.
What is the Median Population Age in Wyoming County?
Median Population Age in Wyoming County is 45.4 Years.
What is the Average Family Size in Wyoming County
Average Family Size in Wyoming County is 3.2 People.
What is the Average Household Size in Wyoming County
Average Household Size in Wyoming County is 2.7 People.
What is Per Capita Income in Wyoming County?
Per Capita income in Wyoming County is $22,818.
What is the Median Family Income in Wyoming County?
Median Family Income in Wyoming County is $51,001.
What is the Median Household income in Wyoming County?
Median Household Income in Wyoming County is $44,510.
What is Income or Wage Gap in Wyoming County?
Income or Wage Gap in Wyoming County is 28.1%.
Women in Wyoming County earn 71.9 cents for every dollar earned by a man.
What is Family Income Deficit in Wyoming County?
Family Income Deficit in Wyoming County is $8,729.
Families that are below poverty line in Wyoming County earn $8,729 less on average than the poverty threshold level.
What is Inequality or Gini Index in Wyoming County?
Inequality or Gini Index in Wyoming County is 0.46.
How Large is the Labor Force in Wyoming County?
There are 6,560 People in the Labor Forcein in Wyoming County.
What is the Percentage of People in the Labor Force in Wyoming County?
37.3% of People are in the Labor Force in Wyoming County.
What is the Unemployment Rate in Wyoming County?
Unemployment Rate in Wyoming County is 6.4%.