Wirt County, WV
Wirt County Map

Wirt County Overview
5,202
TOTAL POPULATION
2,560
MALE POPULATION
2,642
FEMALE POPULATION
96.90
MALES / 100 FEMALES
103.20
FEMALES / 100 MALES
46.6
MEDIAN AGE
2.8
AVG FAMILY SIZE
2.4
AVG HOUSEHOLD SIZE
$26,966
PER CAPITA INCOME
$61,745
AVG FAMILY INCOME
$52,776
AVG HOUSEHOLD INCOME
35.0%
WAGE / INCOME GAP [ % ]
65.0¢/ $1
WAGE / INCOME GAP [ $ ]
0.42
INEQUALITY / GINI INDEX
2,067
LABOR FORCE [ PEOPLE ]
48.4%
PERCENT IN LABOR FORCE
2.6%
UNEMPLOYMENT RATE
Race in Wirt County
The most populous races in Wirt County are White / Caucasian (5,016 | 96.4%), Two or more Races (115 | 2.2%), and Black / African American (62 | 1.2%).

| Race | # Population | % Population |
| Asian | 9 | 0.2% |
| Black / African American | 62 | 1.2% |
| Hawaiian / Pacific | 0 | 0.0% |
| Hispanic or Latino | 0 | 0.0% |
| Native / Alaskan | 0 | 0.0% |
| White / Caucasian | 5,016 | 96.4% |
| Two or more Races | 115 | 2.2% |
| Some other Race | 0 | 0.0% |
| Total | 5,202 | 100.0% |
Ancestry in Wirt County
The most populous ancestries reported in Wirt County are German (914 | 17.6%), American (887 | 17.1%), English (498 | 9.6%), Irish (480 | 9.2%), and Scotch-Irish (187 | 3.6%), together accounting for 57.0% of all Wirt County residents.

| Ancestry | # Population | % Population |
| American | 887 | 17.1% |
| British | 16 | 0.3% |
| Burmese | 9 | 0.2% |
| Czech | 23 | 0.4% |
| Dutch | 60 | 1.1% |
| English | 498 | 9.6% |
| European | 18 | 0.4% |
| French | 46 | 0.9% |
| French Canadian | 12 | 0.2% |
| German | 914 | 17.6% |
| Irish | 480 | 9.2% |
| Italian | 58 | 1.1% |
| Scotch-Irish | 187 | 3.6% |
| Scottish | 88 | 1.7% |
| Swiss | 8 | 0.2% |
| Welsh | 21 | 0.4% | View All 16 Rows |
Immigrants in Wirt County
The most numerous immigrant groups reported in Wirt County came from Asia (9 | 0.2%), Eastern Asia (9 | 0.2%), Korea (9 | 0.2%), Europe (1 | 0.0%), and Germany (1 | 0.0%), together accounting for 0.5% of all Wirt County residents.

| Immigration Origin | # Population | % Population |
| Asia | 9 | 0.2% |
| Eastern Asia | 9 | 0.2% |
| Europe | 1 | 0.0% |
| Germany | 1 | 0.0% |
| Korea | 9 | 0.2% |
| Western Europe | 1 | 0.0% | View All 6 Rows |
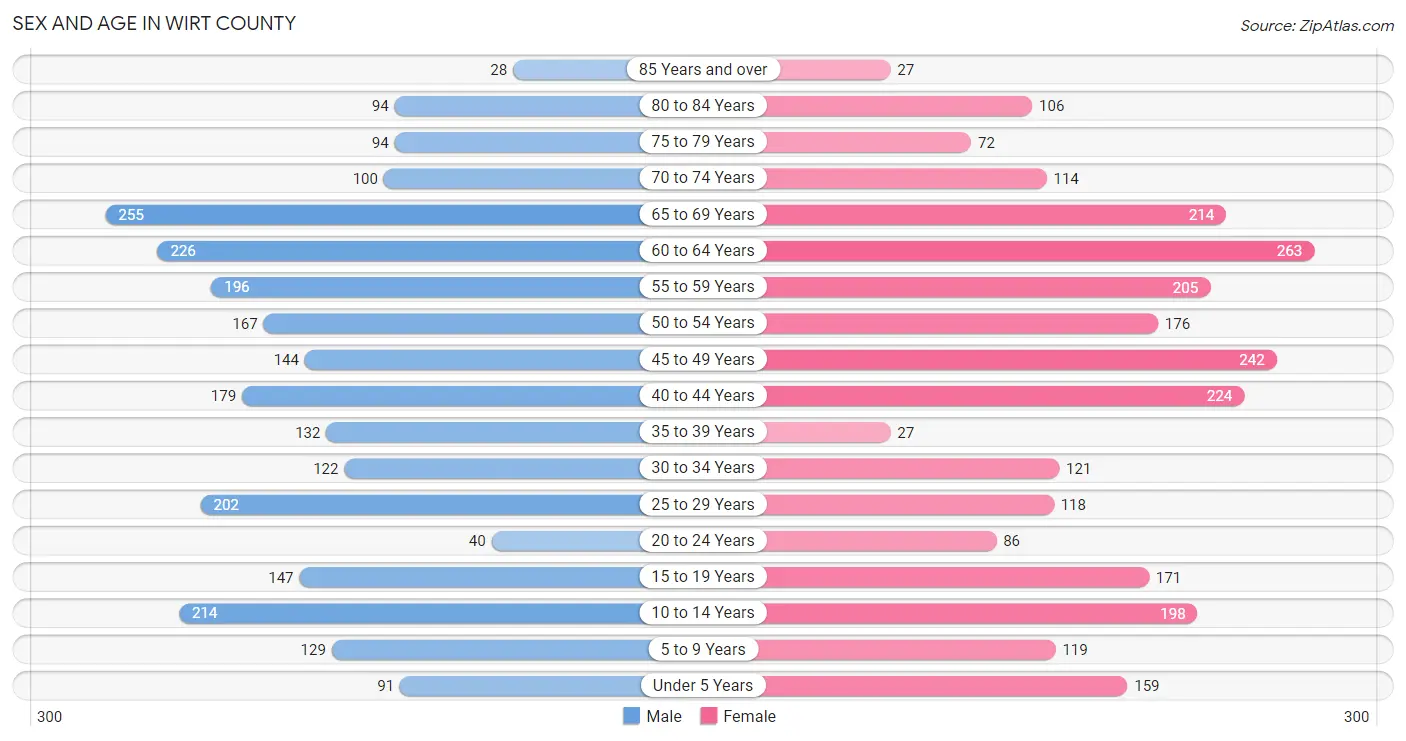
Sex and Age in Wirt County
Sex and Age in Wirt County
The most populous age groups in Wirt County are 65 to 69 Years (255 | 10.0%) for men and 60 to 64 Years (263 | 10.0%) for women.
| Age Bracket | Male | Female |
| Under 5 Years | 91 (3.5%) | 159 (6.0%) |
| 5 to 9 Years | 129 (5.0%) | 119 (4.5%) |
| 10 to 14 Years | 214 (8.4%) | 198 (7.5%) |
| 15 to 19 Years | 147 (5.7%) | 171 (6.5%) |
| 20 to 24 Years | 40 (1.6%) | 86 (3.3%) |
| 25 to 29 Years | 202 (7.9%) | 118 (4.5%) |
| 30 to 34 Years | 122 (4.8%) | 121 (4.6%) |
| 35 to 39 Years | 132 (5.2%) | 27 (1.0%) |
| 40 to 44 Years | 179 (7.0%) | 224 (8.5%) |
| 45 to 49 Years | 144 (5.6%) | 242 (9.2%) |
| 50 to 54 Years | 167 (6.5%) | 176 (6.7%) |
| 55 to 59 Years | 196 (7.7%) | 205 (7.8%) |
| 60 to 64 Years | 226 (8.8%) | 263 (10.0%) |
| 65 to 69 Years | 255 (10.0%) | 214 (8.1%) |
| 70 to 74 Years | 100 (3.9%) | 114 (4.3%) |
| 75 to 79 Years | 94 (3.7%) | 72 (2.7%) |
| 80 to 84 Years | 94 (3.7%) | 106 (4.0%) |
| 85 Years and over | 28 (1.1%) | 27 (1.0%) |
| Total | 2,560 (100.0%) | 2,642 (100.0%) |
Families and Households in Wirt County
Median Family Size in Wirt County
The median family size in Wirt County is 2.81 persons per family, with married-couple families (1,283 | 80.5%) accounting for the largest median family size of 2.85 persons per family. On the other hand, single male/father families (103 | 6.5%) represent the smallest median family size with 2.40 persons per family.

| Family Type | # Families | Family Size |
| Married-Couple | 1,283 (80.5%) | 2.85 |
| Single Male/Father | 103 (6.5%) | 2.40 |
| Single Female/Mother | 207 (13.0%) | 2.73 |
| Total Families | 1,593 (100.0%) | 2.81 |
Median Household Size in Wirt County
The median household size in Wirt County is 2.42 persons per household, with single female/mother households (207 | 9.6%) accounting for the largest median household size of 3 persons per household. non-family households (556 | 25.9%) represent the smallest median household size with 1.12 persons per household.

| Household Type | # Households | Household Size |
| Married-Couple | 1,283 (59.7%) | 2.89 |
| Single Male/Father | 103 (4.8%) | 2.46 |
| Single Female/Mother | 207 (9.6%) | 3.00 |
| Non-family | 556 (25.9%) | 1.12 |
| Total Households | 2,149 (100.0%) | 2.42 |
Household Size by Marriage Status in Wirt County
Out of a total of 2,149 households in Wirt County, 1,593 (74.1%) are family households, while 556 (25.9%) are nonfamily households. The most numerous type of family households are 2-person households, comprising 910, and the most common type of nonfamily households are 1-person households, comprising 495.

| Household Size | Family Households | Nonfamily Households |
| 1-Person Households | - | 495 (23.0%) |
| 2-Person Households | 910 (42.3%) | 46 (2.1%) |
| 3-Person Households | 294 (13.7%) | 15 (0.7%) |
| 4-Person Households | 248 (11.5%) | 0 (0.0%) |
| 5-Person Households | 43 (2.0%) | 0 (0.0%) |
| 6-Person Households | 49 (2.3%) | 0 (0.0%) |
| 7+ Person Households | 49 (2.3%) | 0 (0.0%) |
| Total | 1,593 (74.1%) | 556 (25.9%) |
Female Fertility in Wirt County
Fertility by Age in Wirt County
Average fertility rate in Wirt County is 6.0 births per 1,000 women. Women in the age bracket of 20 to 34 years have the highest fertility rate with 18.0 births per 1,000 women. Women in the age bracket of 20 to 34 years acount for 100.0% of all women with births.

| Age Bracket | Women with Births | Births / 1,000 Women |
| 15 to 19 years | 0 (0.0%) | 0.0 |
| 20 to 34 years | 6 (100.0%) | 18.0 |
| 35 to 50 years | 0 (0.0%) | 0.0 |
| Total | 6 (100.0%) | 6.0 |
Fertility by Age by Marriage Status in Wirt County

| Age Bracket | Married | Unmarried |
| 15 to 19 years | 0 (0.0%) | 0 (0.0%) |
| 20 to 34 years | 0 (0.0%) | 6 (100.0%) |
| 35 to 50 years | 0 (0.0%) | 0 (0.0%) |
| Total | 0 (0.0%) | 6 (100.0%) |
Fertility by Education in Wirt County

| Educational Attainment | Women with Births | Births / 1,000 Women |
| Less than High School | 0 (0.0%) | 0.0 |
| High School Diploma | 0 (0.0%) | 0.0 |
| College or Associate's Degree | 6 (100.0%) | 19.0 |
| Bachelor's Degree | 0 (0.0%) | 0.0 |
| Graduate Degree | 0 (0.0%) | 0.0 |
| Total | 6 (100.0%) | 6.0 |
Fertility by Education by Marriage Status in Wirt County

| Educational Attainment | Married | Unmarried |
| Less than High School | 0 (0.0%) | 0 (0.0%) |
| High School Diploma | 0 (0.0%) | 0 (0.0%) |
| College or Associate's Degree | 0 (0.0%) | 6 (100.0%) |
| Bachelor's Degree | 0 (0.0%) | 0 (0.0%) |
| Graduate Degree | 0 (0.0%) | 0 (0.0%) |
| Total | 0 (0.0%) | 6 (100.0%) |
Income in Wirt County
Income Overview in Wirt County
Per Capita Income in Wirt County is $26,966, while median incomes of families and households are $61,745 and $52,776 respectively.
| Characteristic | Number | Measure |
| Per Capita Income | 5,202 | $26,966 |
| Median Family Income | 1,593 | $61,745 |
| Mean Family Income | 1,593 | $72,895 |
| Median Household Income | 2,149 | $52,776 |
| Mean Household Income | 2,149 | $65,551 |
| Income Deficit | 1,593 | $0 |
| Wage / Income Gap (%) | 5,202 | 35.04% |
| Wage / Income Gap ($) | 5,202 | 64.96¢ per $1 |
| Gini / Inequality Index | 5,202 | 0.42 |
Earnings by Sex in Wirt County
Average Earnings in Wirt County are $34,677, $43,036 for men and $27,958 for women, a difference of 35.0%.

| Sex | Number | Average Earnings |
| Male | 1,011 (46.0%) | $43,036 |
| Female | 1,185 (54.0%) | $27,958 |
| Total | 2,196 (100.0%) | $34,677 |
Earnings by Sex by Income Bracket in Wirt County
The most common earnings brackets in Wirt County are $75,000 to $99,999 for men (162 | 16.0%) and $75,000 to $99,999 for women (123 | 10.4%).

| Income | Male | Female |
| $2,499 or less | 37 (3.7%) | 43 (3.6%) |
| $2,500 to $4,999 | 44 (4.3%) | 94 (7.9%) |
| $5,000 to $7,499 | 29 (2.9%) | 68 (5.7%) |
| $7,500 to $9,999 | 12 (1.2%) | 43 (3.6%) |
| $10,000 to $12,499 | 0 (0.0%) | 40 (3.4%) |
| $12,500 to $14,999 | 36 (3.6%) | 52 (4.4%) |
| $15,000 to $17,499 | 11 (1.1%) | 59 (5.0%) |
| $17,500 to $19,999 | 15 (1.5%) | 40 (3.4%) |
| $20,000 to $22,499 | 3 (0.3%) | 77 (6.5%) |
| $22,500 to $24,999 | 27 (2.7%) | 52 (4.4%) |
| $25,000 to $29,999 | 89 (8.8%) | 116 (9.8%) |
| $30,000 to $34,999 | 66 (6.5%) | 53 (4.5%) |
| $35,000 to $39,999 | 114 (11.3%) | 32 (2.7%) |
| $40,000 to $44,999 | 39 (3.9%) | 42 (3.5%) |
| $45,000 to $49,999 | 61 (6.0%) | 79 (6.7%) |
| $50,000 to $54,999 | 33 (3.3%) | 30 (2.5%) |
| $55,000 to $64,999 | 118 (11.7%) | 64 (5.4%) |
| $65,000 to $74,999 | 72 (7.1%) | 59 (5.0%) |
| $75,000 to $99,999 | 162 (16.0%) | 123 (10.4%) |
| $100,000+ | 43 (4.3%) | 19 (1.6%) |
| Total | 1,011 (100.0%) | 1,185 (100.0%) |
Earnings by Sex by Educational Attainment in Wirt County
Average earnings in Wirt County are $45,536 for men and $28,705 for women, a difference of 37.0%. Men with an educational attainment of bachelor's degree enjoy the highest average annual earnings of $88,534, while those with less than high school education earn the least with $24,706. Women with an educational attainment of graduate degree earn the most with the average annual earnings of $57,188, while those with high school diploma education have the smallest earnings of $22,027.

| Educational Attainment | Male Income | Female Income |
| Less than High School | $24,706 | $0 |
| High School Diploma | $37,455 | $22,027 |
| College or Associate's Degree | $60,221 | $23,678 |
| Bachelor's Degree | $88,534 | $49,803 |
| Graduate Degree | - | - |
| Total | $45,536 | $28,705 |
Family Income in Wirt County
Family Income Brackets in Wirt County
According to the Wirt County family income data, there are 371 families falling into the $50,000 to $74,999 income range, which is the most common income bracket and makes up 23.3% of all families. Conversely, the less than $10,000 income bracket is the least frequent group with only 33 families (2.1%) belonging to this category.

| Income Bracket | # Families | % Families |
| Less than $10,000 | 33 | 2.1% |
| $10,000 to $14,999 | 56 | 3.5% |
| $15,000 to $24,999 | 137 | 8.6% |
| $25,000 to $34,999 | 155 | 9.7% |
| $35,000 to $49,999 | 213 | 13.4% |
| $50,000 to $74,999 | 371 | 23.3% |
| $75,000 to $99,999 | 256 | 16.1% |
| $100,000 to $149,999 | 261 | 16.4% |
| $150,000 to $199,999 | 61 | 3.8% |
| $200,000+ | 48 | 3.0% |
Family Income by Famaliy Size in Wirt County
4-person families (254 | 15.9%) account for the highest median family income in Wirt County with $98,625 per family, while 2-person families (937 | 58.8%) have the highest median income of $26,958 per family member.

| Income Bracket | # Families | Median Income |
| 2-Person Families | 937 (58.8%) | $53,915 |
| 3-Person Families | 276 (17.3%) | $68,611 |
| 4-Person Families | 254 (15.9%) | $98,625 |
| 5-Person Families | 68 (4.3%) | $0 |
| 6-Person Families | 26 (1.6%) | $0 |
| 7+ Person Families | 32 (2.0%) | $0 |
| Total | 1,593 (100.0%) | $61,745 |
Family Income by Number of Earners in Wirt County
The median family income in Wirt County is $61,745, with families comprising 3+ earners (89) having the highest median family income of $106,960, while families with no earners (426) have the lowest median family income of $33,462, accounting for 5.6% and 26.7% of families, respectively.

| Number of Earners | # Families | Median Income |
| No Earners | 426 (26.7%) | $33,462 |
| 1 Earner | 610 (38.3%) | $53,571 |
| 2 Earners | 468 (29.4%) | $92,870 |
| 3+ Earners | 89 (5.6%) | $106,960 |
| Total | 1,593 (100.0%) | $61,745 |
Household Income in Wirt County
Household Income Brackets in Wirt County
With 404 households falling in the category, the $50,000 to $74,999 income range is the most frequent in Wirt County, accounting for 18.8% of all households. In contrast, only 60 households (2.8%) fall into the $200,000+ income bracket, making it the least populous group.

| Income Bracket | # Households | % Households |
| Less than $10,000 | 101 | 4.7% |
| $10,000 to $14,999 | 138 | 6.4% |
| $15,000 to $24,999 | 249 | 11.6% |
| $25,000 to $34,999 | 189 | 8.8% |
| $35,000 to $49,999 | 346 | 16.1% |
| $50,000 to $74,999 | 404 | 18.8% |
| $75,000 to $99,999 | 284 | 13.2% |
| $100,000 to $149,999 | 307 | 14.3% |
| $150,000 to $199,999 | 69 | 3.2% |
| $200,000+ | 60 | 2.8% |
Household Income by Householder Age in Wirt County
The median household income in Wirt County is $52,776, with the highest median household income of $74,643 found in the 15 to 24 years age bracket for the primary householder. A total of 34 households (1.6%) fall into this category. Meanwhile, the 45 to 64 years age bracket for the primary householder has the lowest median household income of $43,796, with 868 households (40.4%) in this group.

| Income Bracket | # Households | Median Income |
| 15 to 24 Years | 34 (1.6%) | $74,643 |
| 25 to 44 Years | 487 (22.7%) | $62,212 |
| 45 to 64 Years | 868 (40.4%) | $43,796 |
| 65+ Years | 760 (35.4%) | $53,506 |
| Total | 2,149 (100.0%) | $52,776 |
Poverty in Wirt County
Income Below Poverty by Sex and Age in Wirt County
With 18.0% poverty level for males and 22.4% for females among the residents of Wirt County, 5 year old males and 12 to 14 year old females are the most vulnerable to poverty, with 11 males (100.0%) and 69 females (46.9%) in their respective age groups living below the poverty level.

| Age Bracket | Male | Female |
| Under 5 Years | 3 (5.3%) | 52 (35.4%) |
| 5 Years | 11 (100.0%) | 0 (0.0%) |
| 6 to 11 Years | 28 (15.2%) | 65 (38.2%) |
| 12 to 14 Years | 79 (53.4%) | 69 (46.9%) |
| 15 Years | 13 (61.9%) | 0 (0.0%) |
| 16 and 17 Years | 14 (20.0%) | 18 (16.8%) |
| 18 to 24 Years | 0 (0.0%) | 29 (19.3%) |
| 25 to 34 Years | 52 (16.1%) | 65 (27.2%) |
| 35 to 44 Years | 89 (28.6%) | 79 (31.5%) |
| 45 to 54 Years | 40 (12.9%) | 59 (14.1%) |
| 55 to 64 Years | 65 (15.4%) | 91 (19.4%) |
| 65 to 74 Years | 32 (9.0%) | 38 (11.6%) |
| 75 Years and over | 30 (13.9%) | 25 (12.2%) |
| Total | 456 (18.0%) | 590 (22.4%) |
Income Above Poverty by Sex and Age in Wirt County
According to the poverty statistics in Wirt County, males aged 18 to 24 years and females aged 65 to 74 years are the age groups that are most secure financially, with 100.0% of males and 88.4% of females in these age groups living above the poverty line.

| Age Bracket | Male | Female |
| Under 5 Years | 54 (94.7%) | 95 (64.6%) |
| 5 Years | 0 (0.0%) | 0 (0.0%) |
| 6 to 11 Years | 156 (84.8%) | 105 (61.8%) |
| 12 to 14 Years | 69 (46.6%) | 78 (53.1%) |
| 15 Years | 8 (38.1%) | 0 (0.0%) |
| 16 and 17 Years | 56 (80.0%) | 89 (83.2%) |
| 18 to 24 Years | 96 (100.0%) | 121 (80.7%) |
| 25 to 34 Years | 272 (84.0%) | 174 (72.8%) |
| 35 to 44 Years | 222 (71.4%) | 172 (68.5%) |
| 45 to 54 Years | 271 (87.1%) | 359 (85.9%) |
| 55 to 64 Years | 357 (84.6%) | 377 (80.6%) |
| 65 to 74 Years | 323 (91.0%) | 290 (88.4%) |
| 75 Years and over | 186 (86.1%) | 180 (87.8%) |
| Total | 2,070 (82.0%) | 2,040 (77.6%) |
Income Below Poverty Among Married-Couple Families in Wirt County
The poverty statistics for married-couple families in Wirt County show that 12.2% or 156 of the total 1,283 families live below the poverty line. Families with 3 or 4 children have the highest poverty rate of 59.0%, comprising of 59 families. On the other hand, families with no children have the lowest poverty rate of 6.3%, which includes 54 families.

| Children | Above Poverty | Below Poverty |
| No Children | 807 (93.7%) | 54 (6.3%) |
| 1 or 2 Children | 279 (86.7%) | 43 (13.4%) |
| 3 or 4 Children | 41 (41.0%) | 59 (59.0%) |
| 5 or more Children | 0 (0.0%) | 0 (0.0%) |
| Total | 1,127 (87.8%) | 156 (12.2%) |
Income Below Poverty Among Single-Parent Households in Wirt County
According to the poverty data in Wirt County, 11.7% or 12 single-father households and 43.0% or 89 single-mother households are living below the poverty line. Among single-father households, those with 1 or 2 children have the highest poverty rate, with 12 households (37.5%) experiencing poverty. Likewise, among single-mother households, those with 1 or 2 children have the highest poverty rate, with 50 households (69.4%) falling below the poverty line.

| Children | Single Father | Single Mother |
| No Children | 0 (0.0%) | 39 (35.4%) |
| 1 or 2 Children | 12 (37.5%) | 50 (69.4%) |
| 3 or 4 Children | 0 (0.0%) | 0 (0.0%) |
| 5 or more Children | 0 (0.0%) | 0 (0.0%) |
| Total | 12 (11.7%) | 89 (43.0%) |
Income Below Poverty Among Married-Couple vs Single-Parent Households in Wirt County
The poverty data for Wirt County shows that 156 of the married-couple family households (12.2%) and 101 of the single-parent households (32.6%) are living below the poverty level. Within the married-couple family households, those with 3 or 4 children have the highest poverty rate, with 59 households (59.0%) falling below the poverty line. Among the single-parent households, those with 1 or 2 children have the highest poverty rate, with 62 household (59.6%) living below poverty.

| Children | Married-Couple Families | Single-Parent Households |
| No Children | 54 (6.3%) | 39 (21.5%) |
| 1 or 2 Children | 43 (13.4%) | 62 (59.6%) |
| 3 or 4 Children | 59 (59.0%) | 0 (0.0%) |
| 5 or more Children | 0 (0.0%) | 0 (0.0%) |
| Total | 156 (12.2%) | 101 (32.6%) |
Employment Characteristics in Wirt County
Employment by Class of Employer in Wirt County
Among the 1,949 employed individuals in Wirt County, private company employees (1,319 | 67.7%), not-for-profit organizations (164 | 8.4%), and state government employees (128 | 6.6%) make up the most common classes of employment.

| Employer Class | # Employees | % Employees |
| Private Company Employees | 1,319 | 67.7% |
| Self-Employed (Incorporated) | 31 | 1.6% |
| Self-Employed (Not Incorporated) | 90 | 4.6% |
| Not-for-profit Organizations | 164 | 8.4% |
| Local Government Employees | 115 | 5.9% |
| State Government Employees | 128 | 6.6% |
| Federal Government Employees | 102 | 5.2% |
| Unpaid Family Workers | 0 | 0.0% |
| Total | 1,949 | 100.0% |
Employment Status by Age in Wirt County
According to the labor force statistics for Wirt County, out of the total population over 16 years of age (4,271), 48.4% or 2,067 individuals are in the labor force, with 2.6% or 54 of them unemployed. The age group with the highest labor force participation rate is 20 to 24 years, with 100.0% or 126 individuals in the labor force. Within the labor force, the 30 to 34 years age range has the highest percentage of unemployed individuals, with 15.9% or 28 of them being unemployed.

| Age Bracket | In Labor Force | Unemployed |
| 16 to 19 Years | 86 (29.0%) | 3 (3.5%) |
| 20 to 24 Years | 126 (100.0%) | 0 (0.0%) |
| 25 to 29 Years | 296 (92.5%) | 0 (0.0%) |
| 30 to 34 Years | 176 (72.4%) | 28 (15.9%) |
| 35 to 44 Years | 325 (57.8%) | 0 (0.0%) |
| 45 to 54 Years | 513 (70.4%) | 23 (4.5%) |
| 55 to 59 Years | 180 (44.9%) | 0 (0.0%) |
| 60 to 64 Years | 217 (44.4%) | 0 (0.0%) |
| 65 to 74 Years | 124 (18.2%) | 0 (0.0%) |
| 75 Years and over | 23 (5.5%) | 0 (0.0%) |
| Total | 2,067 (48.4%) | 54 (2.6%) |
Employment Status by Educational Attainment in Wirt County
According to labor force statistics for Wirt County, 62.2% of individuals (1,707) out of the total population between 25 and 64 years of age (2,744) are in the labor force, with 3.0% or 51 of them being unemployed. The group with the highest labor force participation rate are those with the educational attainment of bachelor's degree or higher, with 75.8% or 339 individuals in the labor force. Within the labor force, individuals with less than high school education have the highest percentage of unemployment, with 46.5% or 40 of them being unemployed.

| Educational Attainment | In Labor Force | Unemployed |
| Less than High School | 86 (21.9%) | 183 (46.5%) |
| High School Diploma | 686 (62.9%) | 0 (0.0%) |
| College / Associate Degree | 596 (73.2%) | 15 (1.8%) |
| Bachelor's Degree or higher | 339 (75.8%) | 0 (0.0%) |
| Total | 1,707 (62.2%) | 82 (3.0%) |
Employment Occupations by Sex in Wirt County
Management, Business, Science and Arts Occupations
The most common Management, Business, Science and Arts occupations in Wirt County are Community & Social Service (198 | 9.8%), Management (159 | 7.9%), Education Instruction & Library (139 | 6.9%), Health Diagnosing & Treating (108 | 5.4%), and Health Technologists (80 | 4.0%).

Management, Business, Science and Arts Occupations by Sex
Within the Management, Business, Science and Arts occupations in Wirt County, the most male-oriented occupations are Architecture & Engineering (100.0%), Computers, Engineering & Science (72.6%), and Computers & Mathematics (45.2%), while the most female-oriented occupations are Education, Arts & Media (100.0%), Legal Services & Support (100.0%), and Arts, Media & Entertainment (100.0%).

| Occupation | Male | Female |
| Management | 28 (17.6%) | 131 (82.4%) |
| Business & Financial | 16 (24.2%) | 50 (75.8%) |
| Computers, Engineering & Science | 45 (72.6%) | 17 (27.4%) |
| Computers & Mathematics | 14 (45.2%) | 17 (54.8%) |
| Architecture & Engineering | 31 (100.0%) | 0 (0.0%) |
| Life, Physical & Social Science | 0 (0.0%) | 0 (0.0%) |
| Community & Social Service | 6 (3.0%) | 192 (97.0%) |
| Education, Arts & Media | 0 (0.0%) | 10 (100.0%) |
| Legal Services & Support | 0 (0.0%) | 9 (100.0%) |
| Education Instruction & Library | 6 (4.3%) | 133 (95.7%) |
| Arts, Media & Entertainment | 0 (0.0%) | 40 (100.0%) |
| Health Diagnosing & Treating | 0 (0.0%) | 108 (100.0%) |
| Health Technologists | 0 (0.0%) | 80 (100.0%) |
| Total (Category) | 95 (16.0%) | 498 (84.0%) |
| Total (Overall) | 906 (45.0%) | 1,106 (55.0%) |
Services Occupations
The most common Services occupations in Wirt County are Healthcare Support (104 | 5.2%), Food Preparation & Serving (75 | 3.7%), Security & Protection (49 | 2.4%), Cleaning & Maintenance (41 | 2.0%), and Law Enforcement (36 | 1.8%).

Services Occupations by Sex
Within the Services occupations in Wirt County, the most male-oriented occupations are Law Enforcement (100.0%), Security & Protection (73.5%), and Cleaning & Maintenance (17.1%), while the most female-oriented occupations are Healthcare Support (100.0%), Firefighting & Prevention (100.0%), and Personal Care & Service (100.0%).

| Occupation | Male | Female |
| Healthcare Support | 0 (0.0%) | 104 (100.0%) |
| Security & Protection | 36 (73.5%) | 13 (26.5%) |
| Firefighting & Prevention | 0 (0.0%) | 13 (100.0%) |
| Law Enforcement | 36 (100.0%) | 0 (0.0%) |
| Food Preparation & Serving | 8 (10.7%) | 67 (89.3%) |
| Cleaning & Maintenance | 7 (17.1%) | 34 (82.9%) |
| Personal Care & Service | 0 (0.0%) | 26 (100.0%) |
| Total (Category) | 51 (17.3%) | 244 (82.7%) |
| Total (Overall) | 906 (45.0%) | 1,106 (55.0%) |
Sales and Office Occupations
The most common Sales and Office occupations in Wirt County are Sales & Related (258 | 12.8%), and Office & Administration (173 | 8.6%).

Sales and Office Occupations by Sex

| Occupation | Male | Female |
| Sales & Related | 62 (24.0%) | 196 (76.0%) |
| Office & Administration | 34 (19.7%) | 139 (80.3%) |
| Total (Category) | 96 (22.3%) | 335 (77.7%) |
| Total (Overall) | 906 (45.0%) | 1,106 (55.0%) |
Natural Resources, Construction and Maintenance Occupations
The most common Natural Resources, Construction and Maintenance occupations in Wirt County are Construction & Extraction (158 | 7.9%), and Installation, Maintenance & Repair (105 | 5.2%).

Natural Resources, Construction and Maintenance Occupations by Sex

| Occupation | Male | Female |
| Farming, Fishing & Forestry | 0 (0.0%) | 0 (0.0%) |
| Construction & Extraction | 158 (100.0%) | 0 (0.0%) |
| Installation, Maintenance & Repair | 105 (100.0%) | 0 (0.0%) |
| Total (Category) | 263 (100.0%) | 0 (0.0%) |
| Total (Overall) | 906 (45.0%) | 1,106 (55.0%) |
Production, Transportation and Moving Occupations
The most common Production, Transportation and Moving occupations in Wirt County are Production (270 | 13.4%), Material Moving (84 | 4.2%), and Transportation (76 | 3.8%).

Production, Transportation and Moving Occupations by Sex

| Occupation | Male | Female |
| Production | 251 (93.0%) | 19 (7.0%) |
| Transportation | 76 (100.0%) | 0 (0.0%) |
| Material Moving | 74 (88.1%) | 10 (11.9%) |
| Total (Category) | 401 (93.3%) | 29 (6.7%) |
| Total (Overall) | 906 (45.0%) | 1,106 (55.0%) |
Employment Industries by Sex in Wirt County
Employment Industries in Wirt County
The major employment industries in Wirt County include Health Care & Social Assistance (353 | 17.5%), Manufacturing (303 | 15.1%), Retail Trade (265 | 13.2%), Construction (192 | 9.5%), and Educational Services (183 | 9.1%).

Employment Industries by Sex in Wirt County
The Wirt County industries that see more men than women are Agriculture, Fishing & Hunting (100.0%), Mining, Quarrying, & Extraction (100.0%), and Construction (100.0%), whereas the industries that tend to have a higher number of women are Information (100.0%), Finance & Insurance (100.0%), and Accommodation & Food Services (97.0%).

| Industry | Male | Female |
| Agriculture, Fishing & Hunting | 8 (100.0%) | 0 (0.0%) |
| Mining, Quarrying, & Extraction | 18 (100.0%) | 0 (0.0%) |
| Construction | 192 (100.0%) | 0 (0.0%) |
| Manufacturing | 240 (79.2%) | 63 (20.8%) |
| Wholesale Trade | 97 (100.0%) | 0 (0.0%) |
| Retail Trade | 63 (23.8%) | 202 (76.2%) |
| Transportation & Warehousing | 65 (100.0%) | 0 (0.0%) |
| Utilities | 9 (100.0%) | 0 (0.0%) |
| Information | 0 (0.0%) | 25 (100.0%) |
| Finance & Insurance | 0 (0.0%) | 51 (100.0%) |
| Real Estate, Rental & Leasing | 37 (100.0%) | 0 (0.0%) |
| Professional & Scientific | 26 (37.1%) | 44 (62.9%) |
| Enterprise Management | 0 (0.0%) | 0 (0.0%) |
| Administrative & Support | 33 (67.3%) | 16 (32.7%) |
| Educational Services | 21 (11.5%) | 162 (88.5%) |
| Health Care & Social Assistance | 12 (3.4%) | 341 (96.6%) |
| Arts, Entertainment & Recreation | 6 (100.0%) | 0 (0.0%) |
| Accommodation & Food Services | 3 (3.0%) | 97 (97.0%) |
| Public Administration | 70 (50.4%) | 69 (49.6%) |
| Total | 906 (45.0%) | 1,106 (55.0%) |
Education in Wirt County
School Enrollment in Wirt County
The most common levels of schooling among the 1,023 students in Wirt County are middle school (333 | 32.6%), high school (241 | 23.6%), and elementary school (187 | 18.3%).

| School Level | # Students | % Students |
| Nursery / Preschool | 37 | 3.6% |
| Kindergarten | 73 | 7.1% |
| Elementary School | 187 | 18.3% |
| Middle School | 333 | 32.6% |
| High School | 241 | 23.6% |
| College / Undergraduate | 136 | 13.3% |
| Graduate / Professional | 16 | 1.6% |
| Total | 1,023 | 100.0% |
School Enrollment by Age by Funding Source in Wirt County
Out of a total of 1,023 students who are enrolled in schools in Wirt County, 56 (5.5%) attend a private institution, while the remaining 967 (94.5%) are enrolled in public schools. The age group of 10 to 14 year olds has the highest likelihood of being enrolled in private schools, with 56 (13.6% in the age bracket) enrolled. Conversely, the age group of 3 to 4 year olds has the lowest likelihood of being enrolled in a private school, with 26 (100.0% in the age bracket) attending a public institution.

| Age Bracket | Public School | Private School |
| 3 to 4 Year Olds | 26 (100.0%) | 0 (0.0%) |
| 5 to 9 Year Old | 207 (100.0%) | 0 (0.0%) |
| 10 to 14 Year Olds | 355 (86.4%) | 56 (13.6%) |
| 15 to 17 Year Olds | 198 (100.0%) | 0 (0.0%) |
| 18 to 19 Year Olds | 73 (100.0%) | 0 (0.0%) |
| 20 to 24 Year Olds | 51 (100.0%) | 0 (0.0%) |
| 25 to 34 Year Olds | 16 (100.0%) | 0 (0.0%) |
| 35 Years and over | 41 (100.0%) | 0 (0.0%) |
| Total | 967 (94.5%) | 56 (5.5%) |
Educational Attainment by Field of Study in Wirt County
Education (237 | 39.7%), business (169 | 28.3%), science & technology (108 | 18.1%), arts & humanities (27 | 4.5%), and bio, nature & agricultural (21 | 3.5%) are the most common fields of study among 597 individuals in Wirt County who have obtained a bachelor's degree or higher.

| Field of Study | # Graduates | % Graduates |
| Computers & Mathematics | 14 | 2.4% |
| Bio, Nature & Agricultural | 21 | 3.5% |
| Physical & Health Sciences | 0 | 0.0% |
| Psychology | 0 | 0.0% |
| Social Sciences | 8 | 1.3% |
| Engineering | 0 | 0.0% |
| Multidisciplinary Studies | 5 | 0.8% |
| Science & Technology | 108 | 18.1% |
| Business | 169 | 28.3% |
| Education | 237 | 39.7% |
| Literature & Languages | 0 | 0.0% |
| Liberal Arts & History | 0 | 0.0% |
| Visual & Performing Arts | 1 | 0.2% |
| Communications | 7 | 1.2% |
| Arts & Humanities | 27 | 4.5% |
| Total | 597 | 100.0% |
Transportation & Commute in Wirt County
Vehicle Availability by Sex in Wirt County
The most prevalent vehicle ownership categories in Wirt County are males with 2 vehicles (331, accounting for 36.9%) and females with 2 vehicles (325, making up 31.5%).

| Vehicles Available | Male | Female |
| No Vehicle | 0 (0.0%) | 13 (1.2%) |
| 1 Vehicle | 121 (13.5%) | 236 (22.4%) |
| 2 Vehicles | 331 (36.9%) | 325 (30.9%) |
| 3 Vehicles | 238 (26.5%) | 211 (20.1%) |
| 4 Vehicles | 170 (19.0%) | 227 (21.6%) |
| 5 or more Vehicles | 37 (4.1%) | 40 (3.8%) |
| Total | 897 (100.0%) | 1,052 (100.0%) |
Commute Time in Wirt County
The most frequently occuring commute durations in Wirt County are 30 to 34 minutes (464 commuters, 26.7%), 45 to 59 minutes (287 commuters, 16.5%), and 60 to 89 minutes (185 commuters, 10.7%).

| Commute Time | # Commuters | % Commuters |
| Less than 5 Minutes | 87 | 5.0% |
| 5 to 9 Minutes | 58 | 3.3% |
| 10 to 14 Minutes | 95 | 5.5% |
| 15 to 19 Minutes | 104 | 6.0% |
| 20 to 24 Minutes | 124 | 7.1% |
| 25 to 29 Minutes | 110 | 6.3% |
| 30 to 34 Minutes | 464 | 26.7% |
| 35 to 39 Minutes | 85 | 4.9% |
| 40 to 44 Minutes | 79 | 4.5% |
| 45 to 59 Minutes | 287 | 16.5% |
| 60 to 89 Minutes | 185 | 10.7% |
| 90 or more Minutes | 57 | 3.3% |
Commute Time by Sex in Wirt County
The most common commute times in Wirt County are 30 to 34 minutes (195 commuters, 23.9%) for males and 30 to 34 minutes (269 commuters, 29.3%) for females.

| Commute Time | Male | Female |
| Less than 5 Minutes | 37 (4.5%) | 50 (5.4%) |
| 5 to 9 Minutes | 5 (0.6%) | 53 (5.8%) |
| 10 to 14 Minutes | 54 (6.6%) | 41 (4.5%) |
| 15 to 19 Minutes | 24 (2.9%) | 80 (8.7%) |
| 20 to 24 Minutes | 60 (7.3%) | 64 (7.0%) |
| 25 to 29 Minutes | 62 (7.6%) | 48 (5.2%) |
| 30 to 34 Minutes | 195 (23.9%) | 269 (29.3%) |
| 35 to 39 Minutes | 33 (4.0%) | 52 (5.7%) |
| 40 to 44 Minutes | 33 (4.0%) | 46 (5.0%) |
| 45 to 59 Minutes | 72 (8.8%) | 215 (23.4%) |
| 60 to 89 Minutes | 185 (22.6%) | 0 (0.0%) |
| 90 or more Minutes | 57 (7.0%) | 0 (0.0%) |
Time of Departure to Work by Sex in Wirt County
The most frequent times of departure to work in Wirt County are 12:00 AM to 4:59 AM (268, 32.8%) for males and 7:00 AM to 7:29 AM (222, 24.2%) for females.

| Time of Departure | Male | Female |
| 12:00 AM to 4:59 AM | 268 (32.8%) | 6 (0.6%) |
| 5:00 AM to 5:29 AM | 58 (7.1%) | 0 (0.0%) |
| 5:30 AM to 5:59 AM | 100 (12.2%) | 69 (7.5%) |
| 6:00 AM to 6:29 AM | 107 (13.1%) | 56 (6.1%) |
| 6:30 AM to 6:59 AM | 50 (6.1%) | 109 (11.9%) |
| 7:00 AM to 7:29 AM | 34 (4.2%) | 222 (24.2%) |
| 7:30 AM to 7:59 AM | 61 (7.5%) | 157 (17.1%) |
| 8:00 AM to 8:29 AM | 17 (2.1%) | 38 (4.1%) |
| 8:30 AM to 8:59 AM | 0 (0.0%) | 29 (3.2%) |
| 9:00 AM to 9:59 AM | 16 (2.0%) | 60 (6.5%) |
| 10:00 AM to 10:59 AM | 0 (0.0%) | 5 (0.5%) |
| 11:00 AM to 11:59 AM | 0 (0.0%) | 42 (4.6%) |
| 12:00 PM to 3:59 PM | 16 (2.0%) | 70 (7.6%) |
| 4:00 PM to 11:59 PM | 90 (11.0%) | 55 (6.0%) |
| Total | 817 (100.0%) | 918 (100.0%) |
Housing Occupancy in Wirt County
Occupancy by Ownership in Wirt County
Of the total 2,149 dwellings in Wirt County, owner-occupied units account for 1,817 (84.6%), while renter-occupied units make up 332 (15.4%).

| Occupancy | # Housing Units | % Housing Units |
| Owner Occupied Housing Units | 1,817 | 84.6% |
| Renter-Occupied Housing Units | 332 | 15.4% |
| Total Occupied Housing Units | 2,149 | 100.0% |
Occupancy by Household Size in Wirt County

| Household Size | # Housing Units | % Housing Units |
| 1-Person Household | 495 | 23.0% |
| 2-Person Household | 956 | 44.5% |
| 3-Person Household | 309 | 14.4% |
| 4+ Person Household | 389 | 18.1% |
| Total Housing Units | 2,149 | 100.0% |
Occupancy by Ownership by Household Size in Wirt County

| Household Size | Owner-occupied | Renter-occupied |
| 1-Person Household | 372 (75.1%) | 123 (24.8%) |
| 2-Person Household | 877 (91.7%) | 79 (8.3%) |
| 3-Person Household | 226 (73.1%) | 83 (26.9%) |
| 4+ Person Household | 342 (87.9%) | 47 (12.1%) |
| Total Housing Units | 1,817 (84.6%) | 332 (15.4%) |
Occupancy by Educational Attainment in Wirt County

| Household Size | Owner-occupied | Renter-occupied |
| Less than High School | 250 (74.6%) | 85 (25.4%) |
| High School Diploma | 774 (87.1%) | 115 (12.9%) |
| College/Associate Degree | 503 (79.2%) | 132 (20.8%) |
| Bachelor's Degree or higher | 290 (100.0%) | 0 (0.0%) |
Occupancy by Age of Householder in Wirt County

| Age Bracket | # Households | % Households |
| Under 35 Years | 290 | 13.5% |
| 35 to 44 Years | 231 | 10.7% |
| 45 to 54 Years | 375 | 17.4% |
| 55 to 64 Years | 493 | 22.9% |
| 65 to 74 Years | 437 | 20.3% |
| 75 to 84 Years | 271 | 12.6% |
| 85 Years and Over | 52 | 2.4% |
| Total | 2,149 | 100.0% |
Housing Finances in Wirt County
Median Income by Occupancy in Wirt County

| Occupancy Type | # Households | Median Income |
| Owner-Occupied | 1,817 (84.6%) | $58,821 |
| Renter-Occupied | 332 (15.4%) | $19,038 |
| Average | 2,149 (100.0%) | $52,776 |
Occupancy by Householder Income Bracket in Wirt County

| Income Bracket | Owner-occupied | Renter-occupied |
| Less than $5,000 | 34 (1.9%) | 3 (0.9%) |
| $5,000 to $9,999 | 10 (0.5%) | 54 (16.3%) |
| $10,000 to $14,999 | 58 (3.2%) | 80 (24.1%) |
| $15,000 to $19,999 | 134 (7.4%) | 39 (11.7%) |
| $20,000 to $24,999 | 77 (4.2%) | 0 (0.0%) |
| $25,000 to $34,999 | 147 (8.1%) | 43 (13.0%) |
| $35,000 to $49,999 | 305 (16.8%) | 40 (12.0%) |
| $50,000 to $74,999 | 389 (21.4%) | 16 (4.8%) |
| $75,000 to $99,999 | 271 (14.9%) | 12 (3.6%) |
| $100,000 to $149,999 | 263 (14.5%) | 45 (13.6%) |
| $150,000 or more | 129 (7.1%) | 0 (0.0%) |
| Total | 1,817 (100.0%) | 332 (100.0%) |
Monthly Housing Cost Tiers in Wirt County

| Monthly Cost | Owner-occupied | Renter-occupied |
| Less than $300 | 605 (33.3%) | 57 (17.2%) |
| $300 to $499 | 432 (23.8%) | 80 (24.1%) |
| $500 to $799 | 355 (19.5%) | 53 (16.0%) |
| $800 to $999 | 195 (10.7%) | 29 (8.7%) |
| $1,000 to $1,499 | 112 (6.2%) | 34 (10.2%) |
| $1,500 to $1,999 | 88 (4.8%) | 0 (0.0%) |
| $2,000 to $2,499 | 3 (0.2%) | 0 (0.0%) |
| $2,500 to $2,999 | 0 (0.0%) | 0 (0.0%) |
| $3,000 or more | 27 (1.5%) | 0 (0.0%) |
| Total | 1,817 (100.0%) | 332 (100.0%) |
Physical Housing Characteristics in Wirt County
Housing Structures in Wirt County

| Structure Type | # Housing Units | % Housing Units |
| Single Unit, Detached | 1,444 | 67.2% |
| Single Unit, Attached | 6 | 0.3% |
| 2 Unit Apartments | 9 | 0.4% |
| 3 or 4 Unit Apartments | 72 | 3.4% |
| 5 to 9 Unit Apartments | 0 | 0.0% |
| 10 or more Apartments | 35 | 1.6% |
| Mobile Home / Other | 583 | 27.1% |
| Total | 2,149 | 100.0% |
Housing Structures by Occupancy in Wirt County

| Structure Type | Owner-occupied | Renter-occupied |
| Single Unit, Detached | 1,341 (92.9%) | 103 (7.1%) |
| Single Unit, Attached | 0 (0.0%) | 6 (100.0%) |
| 2 Unit Apartments | 0 (0.0%) | 9 (100.0%) |
| 3 or 4 Unit Apartments | 0 (0.0%) | 72 (100.0%) |
| 5 to 9 Unit Apartments | 0 (0.0%) | 0 (0.0%) |
| 10 or more Apartments | 0 (0.0%) | 35 (100.0%) |
| Mobile Home / Other | 476 (81.7%) | 107 (18.3%) |
| Total | 1,817 (84.6%) | 332 (15.4%) |
Housing Structures by Number of Rooms in Wirt County

| Number of Rooms | Owner-occupied | Renter-occupied |
| 1 Room | 12 (0.7%) | 15 (4.5%) |
| 2 or 3 Rooms | 37 (2.0%) | 66 (19.9%) |
| 4 or 5 Rooms | 558 (30.7%) | 187 (56.3%) |
| 6 or 7 Rooms | 848 (46.7%) | 40 (12.0%) |
| 8 or more Rooms | 362 (19.9%) | 24 (7.2%) |
| Total | 1,817 (100.0%) | 332 (100.0%) |
Housing Structure by Heating Type in Wirt County

| Heating Type | Owner-occupied | Renter-occupied |
| Utility Gas | 1,161 (63.9%) | 137 (41.3%) |
| Bottled, Tank, or LP Gas | 57 (3.1%) | 33 (9.9%) |
| Electricity | 453 (24.9%) | 162 (48.8%) |
| Fuel Oil or Kerosene | 0 (0.0%) | 0 (0.0%) |
| Coal or Coke | 0 (0.0%) | 0 (0.0%) |
| All other Fuels | 146 (8.0%) | 0 (0.0%) |
| No Fuel Used | 0 (0.0%) | 0 (0.0%) |
| Total | 1,817 (100.0%) | 332 (100.0%) |
Household Vehicle Usage in Wirt County

| Vehicles per Household | Owner-occupied | Renter-occupied |
| No Vehicle | 82 (4.5%) | 113 (34.0%) |
| 1 Vehicle | 524 (28.8%) | 131 (39.5%) |
| 2 Vehicles | 652 (35.9%) | 72 (21.7%) |
| 3 or more Vehicles | 559 (30.8%) | 16 (4.8%) |
| Total | 1,817 (100.0%) | 332 (100.0%) |
Real Estate & Mortgages in Wirt County
Real Estate and Mortgage Overview in Wirt County
| Characteristic | Without Mortgage | With Mortgage |
| Housing Units | 1,162 | 655 |
| Median Property Value | $102,200 | $125,200 |
| Median Household Income | $53,860 | $68 |
| Monthly Housing Costs | $294 | $20 |
| Real Estate Taxes | $525 | $76 |
Property Value by Mortgage Status in Wirt County

| Property Value | Without Mortgage | With Mortgage |
| Less than $50,000 | 343 (29.5%) | 59 (9.0%) |
| $50,000 to $99,999 | 223 (19.2%) | 193 (29.5%) |
| $100,000 to $299,999 | 504 (43.4%) | 318 (48.5%) |
| $300,000 to $499,999 | 89 (7.7%) | 85 (13.0%) |
| $500,000 to $749,999 | 3 (0.3%) | 0 (0.0%) |
| $750,000 to $999,999 | 0 (0.0%) | 0 (0.0%) |
| $1,000,000 or more | 0 (0.0%) | 0 (0.0%) |
| Total | 1,162 (100.0%) | 655 (100.0%) |
Household Income by Mortgage Status in Wirt County

| Household Income | Without Mortgage | With Mortgage |
| Less than $10,000 | 31 (2.7%) | 31 (4.7%) |
| $10,000 to $24,999 | 152 (13.1%) | 13 (2.0%) |
| $25,000 to $34,999 | 83 (7.1%) | 117 (17.9%) |
| $35,000 to $49,999 | 269 (23.2%) | 64 (9.8%) |
| $50,000 to $74,999 | 239 (20.6%) | 36 (5.5%) |
| $75,000 to $99,999 | 158 (13.6%) | 150 (22.9%) |
| $100,000 to $149,999 | 169 (14.5%) | 113 (17.2%) |
| $150,000 or more | 61 (5.2%) | 94 (14.3%) |
| Total | 1,162 (100.0%) | 655 (100.0%) |
Property Value to Household Income Ratio in Wirt County

| Value-to-Income Ratio | Without Mortgage | With Mortgage |
| Less than 2.0x | 635 (54.6%) | 64,313 (9,818.8%) |
| 2.0x to 2.9x | 240 (20.6%) | 353 (53.9%) |
| 3.0x to 3.9x | 103 (8.9%) | 53 (8.1%) |
| 4.0x or more | 175 (15.1%) | 104 (15.9%) |
| Total | 1,162 (100.0%) | 655 (100.0%) |
Real Estate Taxes by Mortgage Status in Wirt County

| Property Taxes | Without Mortgage | With Mortgage |
| Less than $800 | 665 (57.2%) | 0 (0.0%) |
| $800 to $1,499 | 279 (24.0%) | 304 (46.4%) |
| $800 to $1,499 | 65 (5.6%) | 197 (30.1%) |
| Total | 1,162 (100.0%) | 655 (100.0%) |
Health & Disability in Wirt County
Health Insurance Coverage by Age in Wirt County

| Age Bracket | With Coverage | Without Coverage |
| Under 6 Years | 261 (100.0%) | 0 (0.0%) |
| 6 to 18 Years | 884 (98.1%) | 17 (1.9%) |
| 19 to 25 Years | 196 (91.6%) | 18 (8.4%) |
| 26 to 34 Years | 473 (87.4%) | 68 (12.6%) |
| 35 to 44 Years | 537 (95.6%) | 25 (4.4%) |
| 45 to 54 Years | 707 (97.0%) | 22 (3.0%) |
| 55 to 64 Years | 856 (96.2%) | 34 (3.8%) |
| 65 to 74 Years | 675 (98.8%) | 8 (1.2%) |
| 75 Years and older | 421 (100.0%) | 0 (0.0%) |
| Total | 5,010 (96.3%) | 192 (3.7%) |
Health Insurance Coverage by Citizenship Status in Wirt County

| Citizenship Status | With Coverage | Without Coverage |
| Native Born | 261 (100.0%) | 0 (0.0%) |
| Foreign Born, Citizen | 884 (98.1%) | 17 (1.9%) |
| Foreign Born, not a Citizen | 196 (91.6%) | 18 (8.4%) |
Health Insurance Coverage by Household Income in Wirt County

| Household Income | With Coverage | Without Coverage |
| Under $25,000 | 851 (97.6%) | 21 (2.4%) |
| $25,000 to $49,999 | 1,151 (97.8%) | 26 (2.2%) |
| $50,000 to $74,999 | 1,158 (96.4%) | 43 (3.6%) |
| $75,000 to $99,999 | 609 (99.0%) | 6 (1.0%) |
| $100,000 and over | 1,241 (92.8%) | 96 (7.2%) |
Public vs Private Health Insurance Coverage by Age in Wirt County

| Age Bracket | Public Insurance | Private Insurance |
| Under 6 | 129 (49.4%) | 132 (50.6%) |
| 6 to 18 Years | 603 (66.9%) | 355 (39.4%) |
| 19 to 25 Years | 23 (10.7%) | 173 (80.8%) |
| 25 to 34 Years | 131 (24.2%) | 356 (65.8%) |
| 35 to 44 Years | 277 (49.3%) | 356 (63.3%) |
| 45 to 54 Years | 226 (31.0%) | 573 (78.6%) |
| 55 to 64 Years | 323 (36.3%) | 556 (62.5%) |
| 65 to 74 Years | 675 (98.8%) | 258 (37.8%) |
| 75 Years and over | 421 (100.0%) | 318 (75.5%) |
| Total | 2,808 (54.0%) | 3,077 (59.2%) |
Disability Status by Sex by Age in Wirt County

| Age Bracket | Male | Female |
| Under 5 Years | 0 (0.0%) | 0 (0.0%) |
| 5 to 17 Years | 149 (34.3%) | 62 (14.6%) |
| 18 to 34 Years | 20 (4.8%) | 24 (6.2%) |
| 35 to 64 Years | 306 (29.3%) | 286 (25.2%) |
| 65 to 74 Years | 91 (25.6%) | 91 (27.7%) |
| 75 Years and over | 142 (65.7%) | 98 (47.8%) |
Disability Class by Sex by Age in Wirt County
Disability Class: Hearing Difficulty

| Age Bracket | Male | Female |
| Under 5 Years | 0 (0.0%) | 0 (0.0%) |
| 5 to 17 Years | 0 (0.0%) | 62 (14.6%) |
| 18 to 34 Years | 5 (1.2%) | 0 (0.0%) |
| 35 to 64 Years | 113 (10.8%) | 20 (1.8%) |
| 65 to 74 Years | 47 (13.2%) | 9 (2.7%) |
| 75 Years and over | 112 (51.8%) | 65 (31.7%) |
Disability Class: Vision Difficulty

| Age Bracket | Male | Female |
| Under 5 Years | 0 (0.0%) | 0 (0.0%) |
| 5 to 17 Years | 0 (0.0%) | 0 (0.0%) |
| 18 to 34 Years | 0 (0.0%) | 13 (3.3%) |
| 35 to 64 Years | 83 (8.0%) | 133 (11.7%) |
| 65 to 74 Years | 16 (4.5%) | 27 (8.2%) |
| 75 Years and over | 15 (6.9%) | 19 (9.3%) |
Disability Class: Cognitive Difficulty

| Age Bracket | Male | Female |
| 5 to 17 Years | 149 (34.3%) | 0 (0.0%) |
| 18 to 34 Years | 15 (3.6%) | 0 (0.0%) |
| 35 to 64 Years | 96 (9.2%) | 172 (15.1%) |
| 65 to 74 Years | 5 (1.4%) | 20 (6.1%) |
| 75 Years and over | 29 (13.4%) | 10 (4.9%) |
Disability Class: Ambulatory Difficulty

| Age Bracket | Male | Female |
| 5 to 17 Years | 0 (0.0%) | 0 (0.0%) |
| 18 to 34 Years | 0 (0.0%) | 11 (2.8%) |
| 35 to 64 Years | 176 (16.9%) | 191 (16.8%) |
| 65 to 74 Years | 65 (18.3%) | 72 (22.0%) |
| 75 Years and over | 83 (38.4%) | 57 (27.8%) |
Disability Class: Self-Care Difficulty

| Age Bracket | Male | Female |
| 5 to 17 Years | 0 (0.0%) | 0 (0.0%) |
| 18 to 34 Years | 0 (0.0%) | 0 (0.0%) |
| 35 to 64 Years | 37 (3.5%) | 55 (4.8%) |
| 65 to 74 Years | 29 (8.2%) | 20 (6.1%) |
| 75 Years and over | 25 (11.6%) | 36 (17.6%) |
Technology Access in Wirt County
Computing Device Access in Wirt County

| Device Type | # Households | % Households |
| Desktop or Laptop | 1,445 | 67.2% |
| Smartphone | 1,488 | 69.2% |
| Tablet | 1,104 | 51.4% |
| No Computing Device | 338 | 15.7% |
| Total | 2,149 | 100.0% |
Internet Access in Wirt County

| Internet Type | # Households | % Households |
| Dial-Up Internet | 12 | 0.6% |
| Broadband Home | 1,228 | 57.1% |
| Cellular Data Only | 251 | 11.7% |
| Satellite Internet | 216 | 10.1% |
| No Internet | 455 | 21.2% |
| Total | 2,149 | 100.0% |
Wirt County Summary
Wirt County, West Virginia is located in the Mid-Ohio Valley region of the state and is bordered by Wood, Jackson, Roane, and Calhoun counties. The county seat is Elizabeth, and the county was named for Revolutionary War hero and Virginia statesman, William Wirt. The county has a total area of 246 square miles, of which 245 square miles is land and 1 square mile is water.
Geography
Wirt County is located in the Mid-Ohio Valley region of West Virginia. The county is bordered by Wood, Jackson, Roane, and Calhoun counties. The county is located in the Appalachian Plateau physiographic province and is characterized by rolling hills and valleys. The highest point in the county is located at the summit of Big Tyler Mountain, which has an elevation of 1,890 feet. The county is drained by the Little Kanawha River, which flows through the county from north to south.
Economy
The economy of Wirt County is largely based on agriculture and natural resources. The county is home to several large farms, which produce a variety of crops, including corn, soybeans, wheat, hay, and tobacco. The county also has a large timber industry, with several sawmills and wood-processing plants located in the area. The county is also home to several oil and gas wells, which provide jobs and revenue for the county.
Demographics
As of the 2010 census, Wirt County had a population of 5,873. The population was spread out with a median age of 41.7 years. The racial makeup of the county was 97.2% White, 0.7% African American, 0.2% Native American, 0.2% Asian, 0.1% Pacific Islander, 0.3% from other races, and 1.3% from two or more races. Hispanic or Latino of any race were 0.7% of the population.
The median income for a household in the county was $30,938, and the median income for a family was $37,917. The per capita income for the county was $16,845. About 16.2% of families and 19.7% of the population were below the poverty line, including 25.2% of those under age 18 and 16.2% of those age 65 or over.
Conclusion
Wirt County, West Virginia is located in the Mid-Ohio Valley region of the state and is bordered by Wood, Jackson, Roane, and Calhoun counties. The county has a total area of 246 square miles, of which 245 square miles is land and 1 square mile is water. The economy of Wirt County is largely based on agriculture and natural resources, with several large farms, timber industry, and oil and gas wells located in the area. As of the 2010 census, Wirt County had a population of 5,873, with a median age of 41.7 years. The median income for a household in the county was $30,938, and the median income for a family was $37,917. The per capita income for the county was $16,845.
Common Questions
What is the Total Population of Wirt County?
Total Population of Wirt County is 5,202.
What is the Total Male Population of Wirt County?
Total Male Population of Wirt County is 2,560.
What is the Total Female Population of Wirt County?
Total Female Population of Wirt County is 2,642.
What is the Ratio of Males per 100 Females in Wirt County?
There are 96.90 Males per 100 Females in Wirt County.
What is the Ratio of Females per 100 Males in Wirt County?
There are 103.20 Females per 100 Males in Wirt County.
What is the Median Population Age in Wirt County?
Median Population Age in Wirt County is 46.6 Years.
What is the Average Family Size in Wirt County
Average Family Size in Wirt County is 2.8 People.
What is the Average Household Size in Wirt County
Average Household Size in Wirt County is 2.4 People.
What is Per Capita Income in Wirt County?
Per Capita income in Wirt County is $26,966.
What is the Median Family Income in Wirt County?
Median Family Income in Wirt County is $61,745.
What is the Median Household income in Wirt County?
Median Household Income in Wirt County is $52,776.
What is Income or Wage Gap in Wirt County?
Income or Wage Gap in Wirt County is 35.0%.
Women in Wirt County earn 65.0 cents for every dollar earned by a man.
What is Inequality or Gini Index in Wirt County?
Inequality or Gini Index in Wirt County is 0.42.
How Large is the Labor Force in Wirt County?
There are 2,067 People in the Labor Forcein in Wirt County.
What is the Percentage of People in the Labor Force in Wirt County?
48.4% of People are in the Labor Force in Wirt County.
What is the Unemployment Rate in Wirt County?
Unemployment Rate in Wirt County is 2.6%.