Webster County, WV
Webster County Map

Webster County Overview
8,362
TOTAL POPULATION
4,168
MALE POPULATION
4,194
FEMALE POPULATION
99.38
MALES / 100 FEMALES
100.62
FEMALES / 100 MALES
47.8
MEDIAN AGE
3.5
AVG FAMILY SIZE
2.8
AVG HOUSEHOLD SIZE
$23,494
PER CAPITA INCOME
$55,534
AVG FAMILY INCOME
$43,409
AVG HOUSEHOLD INCOME
33.8%
WAGE / INCOME GAP [ % ]
66.2¢/ $1
WAGE / INCOME GAP [ $ ]
$13,724
FAMILY INCOME DEFICIT
0.46
INEQUALITY / GINI INDEX
3,000
LABOR FORCE [ PEOPLE ]
43.3%
PERCENT IN LABOR FORCE
11.1%
UNEMPLOYMENT RATE
Race in Webster County
The most populous races in Webster County are White / Caucasian (7,779 | 93.0%), Two or more Races (511 | 6.1%), and Hispanic or Latino (53 | 0.6%).

| Race | # Population | % Population |
| Asian | 0 | 0.0% |
| Black / African American | 22 | 0.3% |
| Hawaiian / Pacific | 0 | 0.0% |
| Hispanic or Latino | 53 | 0.6% |
| Native / Alaskan | 0 | 0.0% |
| White / Caucasian | 7,779 | 93.0% |
| Two or more Races | 511 | 6.1% |
| Some other Race | 50 | 0.6% |
| Total | 8,362 | 100.0% |
Ancestry in Webster County
The most populous ancestries reported in Webster County are German (1,494 | 17.9%), Irish (1,063 | 12.7%), English (1,000 | 12.0%), American (732 | 8.7%), and Scottish (271 | 3.2%), together accounting for 54.5% of all Webster County residents.

| Ancestry | # Population | % Population |
| African | 6 | 0.1% |
| American | 732 | 8.7% |
| Austrian | 16 | 0.2% |
| Blackfeet | 11 | 0.1% |
| Cherokee | 44 | 0.5% |
| Cuban | 3 | 0.0% |
| Dutch | 115 | 1.4% |
| Eastern European | 11 | 0.1% |
| English | 1,000 | 12.0% |
| European | 43 | 0.5% |
| French | 68 | 0.8% |
| French Canadian | 10 | 0.1% |
| German | 1,494 | 17.9% |
| Indian (Asian) | 7 | 0.1% |
| Irish | 1,063 | 12.7% |
| Italian | 211 | 2.5% |
| Polish | 49 | 0.6% |
| Puerto Rican | 50 | 0.6% |
| Scotch-Irish | 199 | 2.4% |
| Scottish | 271 | 3.2% |
| Subsaharan African | 6 | 0.1% |
| Swedish | 7 | 0.1% |
| Welsh | 9 | 0.1% | View All 23 Rows |
Immigrants in Webster County
The most numerous immigrant groups reported in Webster County came from Austria (2 | 0.0%), Europe (2 | 0.0%), and Western Europe (2 | 0.0%), together accounting for 0.1% of all Webster County residents.

| Immigration Origin | # Population | % Population |
| Austria | 2 | 0.0% |
| Europe | 2 | 0.0% |
| Western Europe | 2 | 0.0% | View All 3 Rows |
Sex and Age in Webster County
Sex and Age in Webster County
The most populous age groups in Webster County are 10 to 14 Years (392 | 9.4%) for men and 60 to 64 Years (373 | 8.9%) for women.

| Age Bracket | Male | Female |
| Under 5 Years | 110 (2.6%) | 267 (6.4%) |
| 5 to 9 Years | 112 (2.7%) | 248 (5.9%) |
| 10 to 14 Years | 392 (9.4%) | 222 (5.3%) |
| 15 to 19 Years | 287 (6.9%) | 171 (4.1%) |
| 20 to 24 Years | 158 (3.8%) | 214 (5.1%) |
| 25 to 29 Years | 207 (5.0%) | 207 (4.9%) |
| 30 to 34 Years | 211 (5.1%) | 185 (4.4%) |
| 35 to 39 Years | 162 (3.9%) | 133 (3.2%) |
| 40 to 44 Years | 274 (6.6%) | 295 (7.0%) |
| 45 to 49 Years | 297 (7.1%) | 266 (6.3%) |
| 50 to 54 Years | 344 (8.3%) | 274 (6.5%) |
| 55 to 59 Years | 315 (7.6%) | 275 (6.6%) |
| 60 to 64 Years | 359 (8.6%) | 373 (8.9%) |
| 65 to 69 Years | 362 (8.7%) | 325 (7.7%) |
| 70 to 74 Years | 227 (5.4%) | 310 (7.4%) |
| 75 to 79 Years | 161 (3.9%) | 209 (5.0%) |
| 80 to 84 Years | 104 (2.5%) | 95 (2.3%) |
| 85 Years and over | 86 (2.1%) | 125 (3.0%) |
| Total | 4,168 (100.0%) | 4,194 (100.0%) |
Families and Households in Webster County
Median Family Size in Webster County
The median family size in Webster County is 3.50 persons per family, with single female/mother families (266 | 13.4%) accounting for the largest median family size of 4.39 persons per family. On the other hand, married-couple families (1,554 | 78.0%) represent the smallest median family size with 3.30 persons per family.

| Family Type | # Families | Family Size |
| Married-Couple | 1,554 (78.0%) | 3.30 |
| Single Male/Father | 173 (8.7%) | 3.97 |
| Single Female/Mother | 266 (13.4%) | 4.39 |
| Total Families | 1,993 (100.0%) | 3.50 |
Median Household Size in Webster County
The median household size in Webster County is 2.76 persons per household, with single female/mother households (266 | 8.8%) accounting for the largest median household size of 4.55 persons per household. non-family households (1,017 | 33.8%) represent the smallest median household size with 1.22 persons per household.

| Household Type | # Households | Household Size |
| Married-Couple | 1,554 (51.6%) | 3.30 |
| Single Male/Father | 173 (5.8%) | 4.13 |
| Single Female/Mother | 266 (8.8%) | 4.55 |
| Non-family | 1,017 (33.8%) | 1.22 |
| Total Households | 3,010 (100.0%) | 2.76 |
Household Size by Marriage Status in Webster County
Out of a total of 3,010 households in Webster County, 1,993 (66.2%) are family households, while 1,017 (33.8%) are nonfamily households. The most numerous type of family households are 2-person households, comprising 1,029, and the most common type of nonfamily households are 1-person households, comprising 893.

| Household Size | Family Households | Nonfamily Households |
| 1-Person Households | - | 893 (29.7%) |
| 2-Person Households | 1,029 (34.2%) | 119 (4.0%) |
| 3-Person Households | 625 (20.8%) | 5 (0.2%) |
| 4-Person Households | 189 (6.3%) | 0 (0.0%) |
| 5-Person Households | 55 (1.8%) | 0 (0.0%) |
| 6-Person Households | 26 (0.9%) | 0 (0.0%) |
| 7+ Person Households | 69 (2.3%) | 0 (0.0%) |
| Total | 1,993 (66.2%) | 1,017 (33.8%) |
Female Fertility in Webster County
Fertility by Age in Webster County
Average fertility rate in Webster County is 85.0 births per 1,000 women. Women in the age bracket of 20 to 34 years have the highest fertility rate with 155.0 births per 1,000 women. Women in the age bracket of 20 to 34 years acount for 72.3% of all women with births.

| Age Bracket | Women with Births | Births / 1,000 Women |
| 15 to 19 years | 0 (0.0%) | 0.0 |
| 20 to 34 years | 94 (72.3%) | 155.0 |
| 35 to 50 years | 36 (27.7%) | 48.0 |
| Total | 130 (100.0%) | 85.0 |
Fertility by Age by Marriage Status in Webster County
47.7% of women with births (130) in Webster County are married. The highest percentage of unmarried women with births falls into 20 to 34 years age bracket with 67.0% of them unmarried at the time of birth, while the lowest percentage of unmarried women with births belong to 35 to 50 years age bracket with 13.9% of them unmarried.

| Age Bracket | Married | Unmarried |
| 15 to 19 years | 0 (0.0%) | 0 (0.0%) |
| 20 to 34 years | 31 (33.0%) | 63 (67.0%) |
| 35 to 50 years | 31 (86.1%) | 5 (13.9%) |
| Total | 62 (47.7%) | 68 (52.3%) |
Fertility by Education in Webster County

| Educational Attainment | Women with Births | Births / 1,000 Women |
| Less than High School | 0 (0.0%) | 0.0 |
| High School Diploma | 99 (76.1%) | 182.0 |
| College or Associate's Degree | 29 (22.3%) | 73.0 |
| Bachelor's Degree | 0 (0.0%) | 0.0 |
| Graduate Degree | 2 (1.5%) | 44.0 |
| Total | 130 (100.0%) | 85.0 |
Fertility by Education by Marriage Status in Webster County
52.3% of women with births in Webster County are unmarried. Women with the educational attainment of college or associate's degree are most likely to be married with 100.0% of them married at childbirth, while women with the educational attainment of high school diploma are least likely to be married with 68.7% of them unmarried at childbirth.

| Educational Attainment | Married | Unmarried |
| Less than High School | 0 (0.0%) | 0 (0.0%) |
| High School Diploma | 31 (31.3%) | 68 (68.7%) |
| College or Associate's Degree | 29 (100.0%) | 0 (0.0%) |
| Bachelor's Degree | 0 (0.0%) | 0 (0.0%) |
| Graduate Degree | 2 (100.0%) | 0 (0.0%) |
| Total | 62 (47.7%) | 68 (52.3%) |
Income in Webster County
Income Overview in Webster County
Per Capita Income in Webster County is $23,494, while median incomes of families and households are $55,534 and $43,409 respectively.
| Characteristic | Number | Measure |
| Per Capita Income | 8,362 | $23,494 |
| Median Family Income | 1,993 | $55,534 |
| Mean Family Income | 1,993 | $65,485 |
| Median Household Income | 3,010 | $43,409 |
| Mean Household Income | 3,010 | $57,479 |
| Income Deficit | 1,993 | $13,724 |
| Wage / Income Gap (%) | 8,362 | 33.81% |
| Wage / Income Gap ($) | 8,362 | 66.19¢ per $1 |
| Gini / Inequality Index | 8,362 | 0.46 |
Earnings by Sex in Webster County
Average Earnings in Webster County are $31,953, $38,684 for men and $25,605 for women, a difference of 33.8%.

| Sex | Number | Average Earnings |
| Male | 1,852 (62.5%) | $38,684 |
| Female | 1,110 (37.5%) | $25,605 |
| Total | 2,962 (100.0%) | $31,953 |
Earnings by Sex by Income Bracket in Webster County
The most common earnings brackets in Webster County are $75,000 to $99,999 for men (233 | 12.6%) and $25,000 to $29,999 for women (186 | 16.8%).
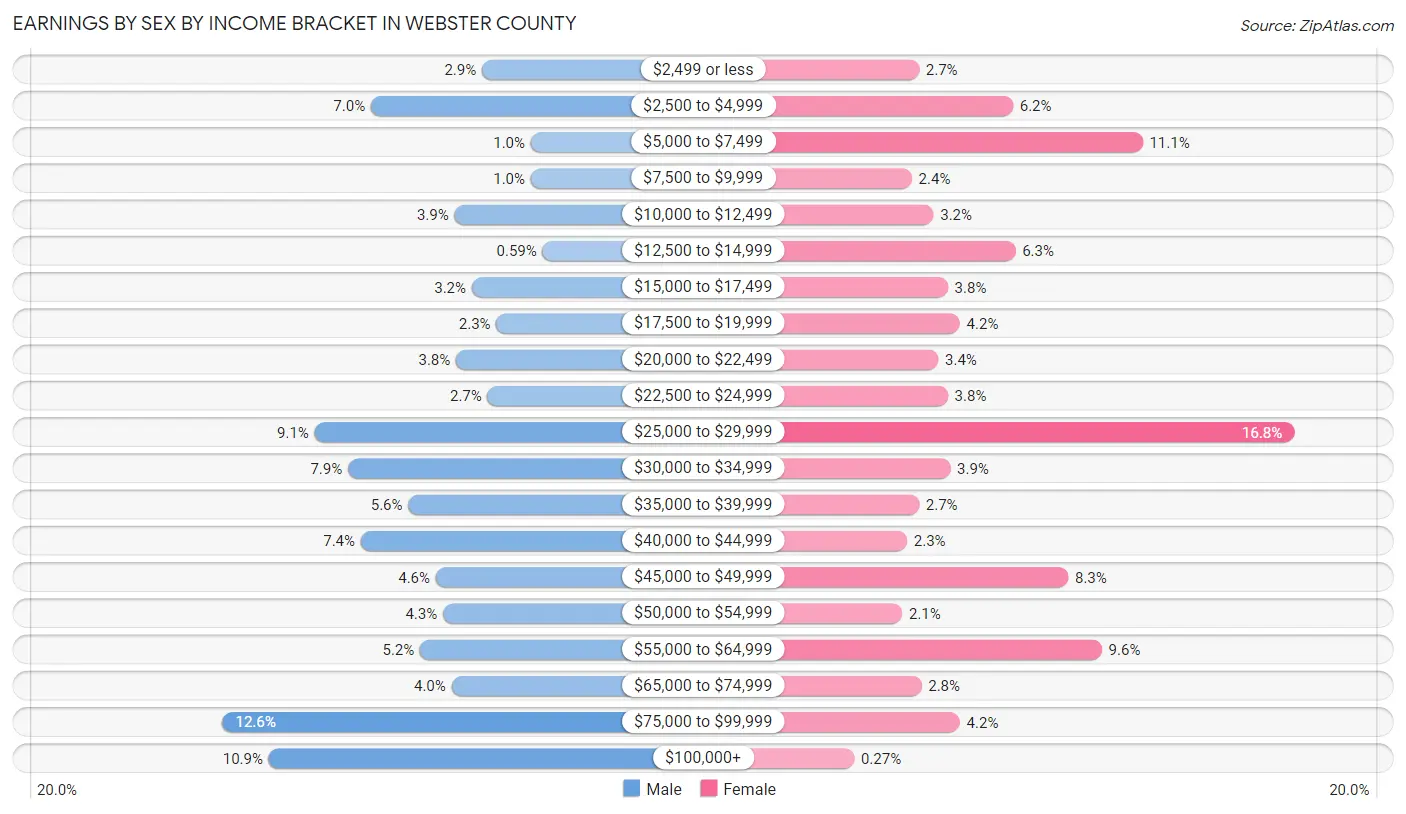
| Income | Male | Female |
| $2,499 or less | 53 (2.9%) | 30 (2.7%) |
| $2,500 to $4,999 | 130 (7.0%) | 69 (6.2%) |
| $5,000 to $7,499 | 19 (1.0%) | 123 (11.1%) |
| $7,500 to $9,999 | 19 (1.0%) | 27 (2.4%) |
| $10,000 to $12,499 | 72 (3.9%) | 36 (3.2%) |
| $12,500 to $14,999 | 11 (0.6%) | 70 (6.3%) |
| $15,000 to $17,499 | 60 (3.2%) | 42 (3.8%) |
| $17,500 to $19,999 | 43 (2.3%) | 47 (4.2%) |
| $20,000 to $22,499 | 71 (3.8%) | 38 (3.4%) |
| $22,500 to $24,999 | 49 (2.6%) | 42 (3.8%) |
| $25,000 to $29,999 | 169 (9.1%) | 186 (16.8%) |
| $30,000 to $34,999 | 146 (7.9%) | 43 (3.9%) |
| $35,000 to $39,999 | 104 (5.6%) | 30 (2.7%) |
| $40,000 to $44,999 | 137 (7.4%) | 25 (2.2%) |
| $45,000 to $49,999 | 85 (4.6%) | 92 (8.3%) |
| $50,000 to $54,999 | 80 (4.3%) | 23 (2.1%) |
| $55,000 to $64,999 | 96 (5.2%) | 106 (9.6%) |
| $65,000 to $74,999 | 74 (4.0%) | 31 (2.8%) |
| $75,000 to $99,999 | 233 (12.6%) | 47 (4.2%) |
| $100,000+ | 201 (10.8%) | 3 (0.3%) |
| Total | 1,852 (100.0%) | 1,110 (100.0%) |
Earnings by Sex by Educational Attainment in Webster County
Average earnings in Webster County are $40,904 for men and $26,230 for women, a difference of 35.9%. Men with an educational attainment of graduate degree enjoy the highest average annual earnings of $103,750, while those with high school diploma education earn the least with $35,855. Women with an educational attainment of graduate degree earn the most with the average annual earnings of $48,125, while those with less than high school education have the smallest earnings of $14,211.

| Educational Attainment | Male Income | Female Income |
| Less than High School | $49,455 | $14,211 |
| High School Diploma | $35,855 | $22,500 |
| College or Associate's Degree | $51,105 | $24,074 |
| Bachelor's Degree | $36,780 | $0 |
| Graduate Degree | $103,750 | $48,125 |
| Total | $40,904 | $26,230 |
Family Income in Webster County
Family Income Brackets in Webster County
According to the Webster County family income data, there are 397 families falling into the $50,000 to $74,999 income range, which is the most common income bracket and makes up 19.9% of all families. Conversely, the $200,000+ income bracket is the least frequent group with only 22 families (1.1%) belonging to this category.

| Income Bracket | # Families | % Families |
| Less than $10,000 | 118 | 5.9% |
| $10,000 to $14,999 | 68 | 3.4% |
| $15,000 to $24,999 | 205 | 10.3% |
| $25,000 to $34,999 | 157 | 7.9% |
| $35,000 to $49,999 | 377 | 18.9% |
| $50,000 to $74,999 | 397 | 19.9% |
| $75,000 to $99,999 | 217 | 10.9% |
| $100,000 to $149,999 | 369 | 18.5% |
| $150,000 to $199,999 | 66 | 3.3% |
| $200,000+ | 22 | 1.1% |
Family Income by Famaliy Size in Webster County
5-person families (50 | 2.5%) account for the highest median family income in Webster County with $93,478 per family, while 3-person families (629 | 31.6%) have the highest median income of $23,407 per family member.

| Income Bracket | # Families | Median Income |
| 2-Person Families | 1,051 (52.7%) | $42,099 |
| 3-Person Families | 629 (31.6%) | $70,221 |
| 4-Person Families | 168 (8.4%) | $56,944 |
| 5-Person Families | 50 (2.5%) | $93,478 |
| 6-Person Families | 26 (1.3%) | $0 |
| 7+ Person Families | 69 (3.5%) | $9,335 |
| Total | 1,993 (100.0%) | $55,534 |
Family Income by Number of Earners in Webster County
The median family income in Webster County is $55,534, with families comprising 2 earners (522) having the highest median family income of $104,722, while families with no earners (686) have the lowest median family income of $29,545, accounting for 26.2% and 34.4% of families, respectively.

| Number of Earners | # Families | Median Income |
| No Earners | 686 (34.4%) | $29,545 |
| 1 Earner | 726 (36.4%) | $54,722 |
| 2 Earners | 522 (26.2%) | $104,722 |
| 3+ Earners | 59 (3.0%) | $81,250 |
| Total | 1,993 (100.0%) | $55,534 |
Household Income in Webster County
Household Income Brackets in Webster County
With 551 households falling in the category, the $50,000 to $74,999 income range is the most frequent in Webster County, accounting for 18.3% of all households. In contrast, only 39 households (1.3%) fall into the $200,000+ income bracket, making it the least populous group.

| Income Bracket | # Households | % Households |
| Less than $10,000 | 271 | 9.0% |
| $10,000 to $14,999 | 295 | 9.8% |
| $15,000 to $24,999 | 382 | 12.7% |
| $25,000 to $34,999 | 232 | 7.7% |
| $35,000 to $49,999 | 527 | 17.5% |
| $50,000 to $74,999 | 551 | 18.3% |
| $75,000 to $99,999 | 250 | 8.3% |
| $100,000 to $149,999 | 397 | 13.2% |
| $150,000 to $199,999 | 66 | 2.2% |
| $200,000+ | 39 | 1.3% |
Household Income by Householder Age in Webster County
The median household income in Webster County is $43,409, with the highest median household income of $65,938 found in the 25 to 44 years age bracket for the primary householder. A total of 479 households (15.9%) fall into this category. Meanwhile, the 65+ years age bracket for the primary householder has the lowest median household income of $35,906, with 1,173 households (39.0%) in this group.

| Income Bracket | # Households | Median Income |
| 15 to 24 Years | 29 (1.0%) | $63,472 |
| 25 to 44 Years | 479 (15.9%) | $65,938 |
| 45 to 64 Years | 1,329 (44.2%) | $46,838 |
| 65+ Years | 1,173 (39.0%) | $35,906 |
| Total | 3,010 (100.0%) | $43,409 |
Poverty in Webster County
Income Below Poverty by Sex and Age in Webster County
With 18.3% poverty level for males and 17.4% for females among the residents of Webster County, 15 year old males and 15 year old females are the most vulnerable to poverty, with 37 males (80.4%) and 18 females (48.6%) in their respective age groups living below the poverty level.

| Age Bracket | Male | Female |
| Under 5 Years | 9 (8.2%) | 30 (11.7%) |
| 5 Years | 4 (66.7%) | 0 (0.0%) |
| 6 to 11 Years | 39 (16.5%) | 90 (26.3%) |
| 12 to 14 Years | 113 (44.5%) | 8 (9.0%) |
| 15 Years | 37 (80.4%) | 18 (48.6%) |
| 16 and 17 Years | 22 (18.0%) | 51 (44.4%) |
| 18 to 24 Years | 73 (26.4%) | 26 (11.2%) |
| 25 to 34 Years | 23 (5.5%) | 82 (20.9%) |
| 35 to 44 Years | 81 (18.6%) | 19 (4.4%) |
| 45 to 54 Years | 134 (20.9%) | 134 (24.8%) |
| 55 to 64 Years | 126 (18.8%) | 83 (12.8%) |
| 65 to 74 Years | 73 (12.5%) | 127 (20.2%) |
| 75 Years and over | 23 (6.9%) | 52 (13.1%) |
| Total | 757 (18.3%) | 720 (17.4%) |
Income Above Poverty by Sex and Age in Webster County
According to the poverty statistics in Webster County, males aged 25 to 34 years and females aged 5 years are the age groups that are most secure financially, with 94.5% of males and 100.0% of females in these age groups living above the poverty line.

| Age Bracket | Male | Female |
| Under 5 Years | 101 (91.8%) | 227 (88.3%) |
| 5 Years | 2 (33.3%) | 39 (100.0%) |
| 6 to 11 Years | 197 (83.5%) | 252 (73.7%) |
| 12 to 14 Years | 141 (55.5%) | 81 (91.0%) |
| 15 Years | 9 (19.6%) | 19 (51.3%) |
| 16 and 17 Years | 100 (82.0%) | 64 (55.6%) |
| 18 to 24 Years | 204 (73.7%) | 207 (88.8%) |
| 25 to 34 Years | 395 (94.5%) | 310 (79.1%) |
| 35 to 44 Years | 355 (81.4%) | 409 (95.6%) |
| 45 to 54 Years | 507 (79.1%) | 406 (75.2%) |
| 55 to 64 Years | 544 (81.2%) | 565 (87.2%) |
| 65 to 74 Years | 512 (87.5%) | 503 (79.8%) |
| 75 Years and over | 311 (93.1%) | 344 (86.9%) |
| Total | 3,378 (81.7%) | 3,426 (82.6%) |
Income Below Poverty Among Married-Couple Families in Webster County
The poverty statistics for married-couple families in Webster County show that 8.3% or 129 of the total 1,554 families live below the poverty line. Families with 3 or 4 children have the highest poverty rate of 45.2%, comprising of 47 families. On the other hand, families with 5 or more children have the lowest poverty rate of 0.0%, which includes 0 families.

| Children | Above Poverty | Below Poverty |
| No Children | 985 (93.4%) | 69 (6.6%) |
| 1 or 2 Children | 373 (96.6%) | 13 (3.4%) |
| 3 or 4 Children | 57 (54.8%) | 47 (45.2%) |
| 5 or more Children | 10 (100.0%) | 0 (0.0%) |
| Total | 1,425 (91.7%) | 129 (8.3%) |
Income Below Poverty Among Single-Parent Households in Webster County
According to the poverty data in Webster County, 35.3% or 61 single-father households and 37.2% or 99 single-mother households are living below the poverty line. Among single-father households, those with 3 or 4 children have the highest poverty rate, with 4 households (57.1%) experiencing poverty. Likewise, among single-mother households, those with 3 or 4 children have the highest poverty rate, with 5 households (100.0%) falling below the poverty line.

| Children | Single Father | Single Mother |
| No Children | 12 (13.8%) | 17 (11.8%) |
| 1 or 2 Children | 45 (57.0%) | 77 (69.4%) |
| 3 or 4 Children | 4 (57.1%) | 5 (100.0%) |
| 5 or more Children | 0 (0.0%) | 0 (0.0%) |
| Total | 61 (35.3%) | 99 (37.2%) |
Income Below Poverty Among Married-Couple vs Single-Parent Households in Webster County
The poverty data for Webster County shows that 129 of the married-couple family households (8.3%) and 160 of the single-parent households (36.4%) are living below the poverty level. Within the married-couple family households, those with 3 or 4 children have the highest poverty rate, with 47 households (45.2%) falling below the poverty line. Among the single-parent households, those with 3 or 4 children have the highest poverty rate, with 9 household (75.0%) living below poverty.
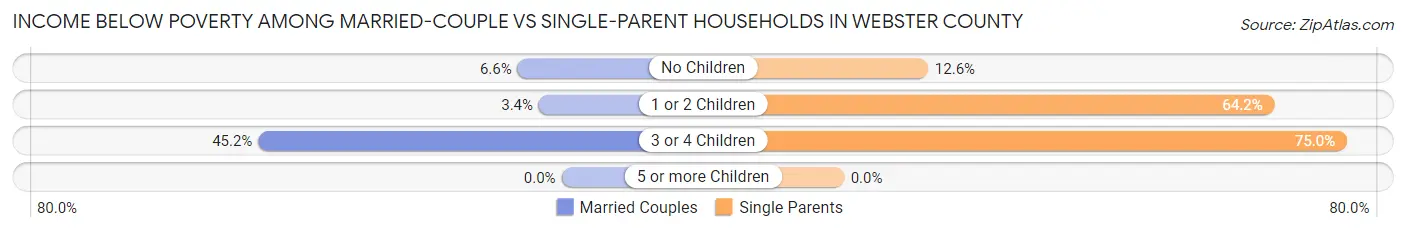
| Children | Married-Couple Families | Single-Parent Households |
| No Children | 69 (6.6%) | 29 (12.6%) |
| 1 or 2 Children | 13 (3.4%) | 122 (64.2%) |
| 3 or 4 Children | 47 (45.2%) | 9 (75.0%) |
| 5 or more Children | 0 (0.0%) | 0 (0.0%) |
| Total | 129 (8.3%) | 160 (36.4%) |
Employment Characteristics in Webster County
Employment by Class of Employer in Webster County
Among the 2,578 employed individuals in Webster County, private company employees (1,730 | 67.1%), local government employees (283 | 11.0%), and not-for-profit organizations (175 | 6.8%) make up the most common classes of employment.

| Employer Class | # Employees | % Employees |
| Private Company Employees | 1,730 | 67.1% |
| Self-Employed (Incorporated) | 27 | 1.1% |
| Self-Employed (Not Incorporated) | 72 | 2.8% |
| Not-for-profit Organizations | 175 | 6.8% |
| Local Government Employees | 283 | 11.0% |
| State Government Employees | 171 | 6.6% |
| Federal Government Employees | 120 | 4.6% |
| Unpaid Family Workers | 0 | 0.0% |
| Total | 2,578 | 100.0% |
Employment Status by Age in Webster County
According to the labor force statistics for Webster County, out of the total population over 16 years of age (6,928), 43.3% or 3,000 individuals are in the labor force, with 11.1% or 333 of them unemployed. The age group with the highest labor force participation rate is 25 to 29 years, with 77.3% or 320 individuals in the labor force. Within the labor force, the 16 to 19 years age range has the highest percentage of unemployed individuals, with 59.1% or 26 of them being unemployed.

| Age Bracket | In Labor Force | Unemployed |
| 16 to 19 Years | 44 (11.7%) | 26 (59.1%) |
| 20 to 24 Years | 187 (50.3%) | 34 (18.2%) |
| 25 to 29 Years | 320 (77.3%) | 35 (10.9%) |
| 30 to 34 Years | 253 (63.9%) | 12 (4.7%) |
| 35 to 44 Years | 530 (61.3%) | 60 (11.3%) |
| 45 to 54 Years | 898 (76.0%) | 164 (18.3%) |
| 55 to 59 Years | 308 (52.2%) | 3 (1.0%) |
| 60 to 64 Years | 254 (34.7%) | 0 (0.0%) |
| 65 to 74 Years | 162 (13.2%) | 0 (0.0%) |
| 75 Years and over | 48 (6.2%) | 0 (0.0%) |
| Total | 3,000 (43.3%) | 333 (11.1%) |
Employment Status by Educational Attainment in Webster County
According to labor force statistics for Webster County, 61.4% of individuals (2,565) out of the total population between 25 and 64 years of age (4,177) are in the labor force, with 10.7% or 274 of them being unemployed. The group with the highest labor force participation rate are those with the educational attainment of bachelor's degree or higher, with 77.6% or 448 individuals in the labor force. Within the labor force, individuals with less than high school education have the highest percentage of unemployment, with 31.1% or 55 of them being unemployed.

| Educational Attainment | In Labor Force | Unemployed |
| Less than High School | 177 (30.3%) | 182 (31.1%) |
| High School Diploma | 1,203 (59.0%) | 226 (11.1%) |
| College / Associate Degree | 735 (75.2%) | 65 (6.7%) |
| Bachelor's Degree or higher | 448 (77.6%) | 48 (8.3%) |
| Total | 2,565 (61.4%) | 447 (10.7%) |
Employment Occupations by Sex in Webster County
Management, Business, Science and Arts Occupations
The most common Management, Business, Science and Arts occupations in Webster County are Community & Social Service (215 | 8.1%), Health Diagnosing & Treating (210 | 7.9%), Management (183 | 6.9%), Education Instruction & Library (138 | 5.2%), and Health Technologists (126 | 4.7%).

Management, Business, Science and Arts Occupations by Sex
Within the Management, Business, Science and Arts occupations in Webster County, the most male-oriented occupations are Computers, Engineering & Science (100.0%), Architecture & Engineering (100.0%), and Management (63.4%), while the most female-oriented occupations are Legal Services & Support (100.0%), Education Instruction & Library (100.0%), and Community & Social Service (94.4%).

| Occupation | Male | Female |
| Management | 116 (63.4%) | 67 (36.6%) |
| Business & Financial | 5 (41.7%) | 7 (58.3%) |
| Computers, Engineering & Science | 7 (100.0%) | 0 (0.0%) |
| Computers & Mathematics | 0 (0.0%) | 0 (0.0%) |
| Architecture & Engineering | 7 (100.0%) | 0 (0.0%) |
| Life, Physical & Social Science | 0 (0.0%) | 0 (0.0%) |
| Community & Social Service | 12 (5.6%) | 203 (94.4%) |
| Education, Arts & Media | 9 (34.6%) | 17 (65.4%) |
| Legal Services & Support | 0 (0.0%) | 8 (100.0%) |
| Education Instruction & Library | 0 (0.0%) | 138 (100.0%) |
| Arts, Media & Entertainment | 3 (7.0%) | 40 (93.0%) |
| Health Diagnosing & Treating | 48 (22.9%) | 162 (77.1%) |
| Health Technologists | 11 (8.7%) | 115 (91.3%) |
| Total (Category) | 188 (30.0%) | 439 (70.0%) |
| Total (Overall) | 1,659 (62.2%) | 1,010 (37.8%) |
Services Occupations
The most common Services occupations in Webster County are Healthcare Support (151 | 5.7%), Security & Protection (137 | 5.1%), Cleaning & Maintenance (137 | 5.1%), Food Preparation & Serving (96 | 3.6%), and Firefighting & Prevention (76 | 2.9%).

Services Occupations by Sex
Within the Services occupations in Webster County, the most male-oriented occupations are Law Enforcement (100.0%), Cleaning & Maintenance (97.8%), and Security & Protection (89.8%), while the most female-oriented occupations are Food Preparation & Serving (92.7%), Personal Care & Service (81.9%), and Healthcare Support (74.2%).

| Occupation | Male | Female |
| Healthcare Support | 39 (25.8%) | 112 (74.2%) |
| Security & Protection | 123 (89.8%) | 14 (10.2%) |
| Firefighting & Prevention | 62 (81.6%) | 14 (18.4%) |
| Law Enforcement | 61 (100.0%) | 0 (0.0%) |
| Food Preparation & Serving | 7 (7.3%) | 89 (92.7%) |
| Cleaning & Maintenance | 134 (97.8%) | 3 (2.2%) |
| Personal Care & Service | 13 (18.1%) | 59 (81.9%) |
| Total (Category) | 316 (53.3%) | 277 (46.7%) |
| Total (Overall) | 1,659 (62.2%) | 1,010 (37.8%) |
Sales and Office Occupations
The most common Sales and Office occupations in Webster County are Sales & Related (171 | 6.4%), and Office & Administration (157 | 5.9%).

Sales and Office Occupations by Sex

| Occupation | Male | Female |
| Sales & Related | 55 (32.2%) | 116 (67.8%) |
| Office & Administration | 36 (22.9%) | 121 (77.1%) |
| Total (Category) | 91 (27.7%) | 237 (72.3%) |
| Total (Overall) | 1,659 (62.2%) | 1,010 (37.8%) |
Natural Resources, Construction and Maintenance Occupations
The most common Natural Resources, Construction and Maintenance occupations in Webster County are Construction & Extraction (316 | 11.8%), Installation, Maintenance & Repair (148 | 5.6%), and Farming, Fishing & Forestry (81 | 3.0%).

Natural Resources, Construction and Maintenance Occupations by Sex

| Occupation | Male | Female |
| Farming, Fishing & Forestry | 81 (100.0%) | 0 (0.0%) |
| Construction & Extraction | 316 (100.0%) | 0 (0.0%) |
| Installation, Maintenance & Repair | 148 (100.0%) | 0 (0.0%) |
| Total (Category) | 545 (100.0%) | 0 (0.0%) |
| Total (Overall) | 1,659 (62.2%) | 1,010 (37.8%) |
Production, Transportation and Moving Occupations
The most common Production, Transportation and Moving occupations in Webster County are Production (254 | 9.5%), Material Moving (171 | 6.4%), and Transportation (151 | 5.7%).

Production, Transportation and Moving Occupations by Sex

| Occupation | Male | Female |
| Production | 249 (98.0%) | 5 (2.0%) |
| Transportation | 115 (76.2%) | 36 (23.8%) |
| Material Moving | 155 (90.6%) | 16 (9.4%) |
| Total (Category) | 519 (90.1%) | 57 (9.9%) |
| Total (Overall) | 1,659 (62.2%) | 1,010 (37.8%) |
Employment Industries by Sex in Webster County
Employment Industries in Webster County
The major employment industries in Webster County include Health Care & Social Assistance (553 | 20.7%), Agriculture, Fishing & Hunting (302 | 11.3%), Manufacturing (264 | 9.9%), Mining, Quarrying, & Extraction (250 | 9.4%), and Retail Trade (235 | 8.8%).

Employment Industries by Sex in Webster County
The Webster County industries that see more men than women are Construction (100.0%), Wholesale Trade (100.0%), and Professional & Scientific (100.0%), whereas the industries that tend to have a higher number of women are Administrative & Support (100.0%), Educational Services (83.0%), and Health Care & Social Assistance (78.1%).
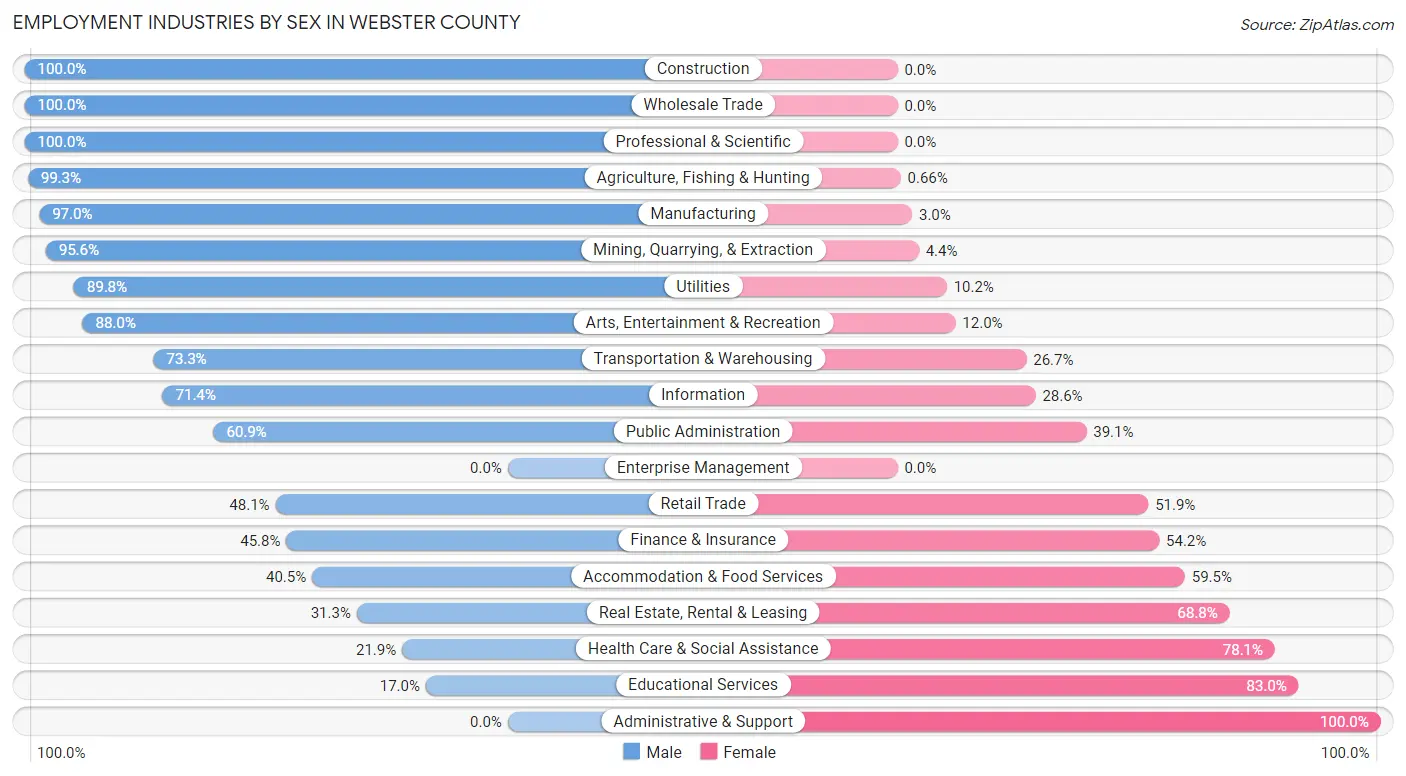
| Industry | Male | Female |
| Agriculture, Fishing & Hunting | 300 (99.3%) | 2 (0.7%) |
| Mining, Quarrying, & Extraction | 239 (95.6%) | 11 (4.4%) |
| Construction | 168 (100.0%) | 0 (0.0%) |
| Manufacturing | 256 (97.0%) | 8 (3.0%) |
| Wholesale Trade | 35 (100.0%) | 0 (0.0%) |
| Retail Trade | 113 (48.1%) | 122 (51.9%) |
| Transportation & Warehousing | 66 (73.3%) | 24 (26.7%) |
| Utilities | 88 (89.8%) | 10 (10.2%) |
| Information | 20 (71.4%) | 8 (28.6%) |
| Finance & Insurance | 33 (45.8%) | 39 (54.2%) |
| Real Estate, Rental & Leasing | 5 (31.2%) | 11 (68.8%) |
| Professional & Scientific | 16 (100.0%) | 0 (0.0%) |
| Enterprise Management | 0 (0.0%) | 0 (0.0%) |
| Administrative & Support | 0 (0.0%) | 28 (100.0%) |
| Educational Services | 39 (17.0%) | 191 (83.0%) |
| Health Care & Social Assistance | 121 (21.9%) | 432 (78.1%) |
| Arts, Entertainment & Recreation | 22 (88.0%) | 3 (12.0%) |
| Accommodation & Food Services | 32 (40.5%) | 47 (59.5%) |
| Public Administration | 81 (60.9%) | 52 (39.1%) |
| Total | 1,659 (62.2%) | 1,010 (37.8%) |
Education in Webster County
School Enrollment in Webster County
The most common levels of schooling among the 1,546 students in Webster County are high school (483 | 31.2%), middle school (466 | 30.1%), and elementary school (354 | 22.9%).

| School Level | # Students | % Students |
| Nursery / Preschool | 44 | 2.9% |
| Kindergarten | 35 | 2.3% |
| Elementary School | 354 | 22.9% |
| Middle School | 466 | 30.1% |
| High School | 483 | 31.2% |
| College / Undergraduate | 100 | 6.5% |
| Graduate / Professional | 64 | 4.1% |
| Total | 1,546 | 100.0% |
School Enrollment by Age by Funding Source in Webster County
Out of a total of 1,546 students who are enrolled in schools in Webster County, 169 (10.9%) attend a private institution, while the remaining 1,377 (89.1%) are enrolled in public schools. The age group of 25 to 34 year olds has the highest likelihood of being enrolled in private schools, with 33 (67.3% in the age bracket) enrolled. Conversely, the age group of 3 to 4 year olds has the lowest likelihood of being enrolled in a private school, with 42 (100.0% in the age bracket) attending a public institution.

| Age Bracket | Public School | Private School |
| 3 to 4 Year Olds | 42 (100.0%) | 0 (0.0%) |
| 5 to 9 Year Old | 249 (75.9%) | 79 (24.1%) |
| 10 to 14 Year Olds | 580 (97.0%) | 18 (3.0%) |
| 15 to 17 Year Olds | 308 (100.0%) | 0 (0.0%) |
| 18 to 19 Year Olds | 62 (88.6%) | 8 (11.4%) |
| 20 to 24 Year Olds | 87 (92.5%) | 7 (7.4%) |
| 25 to 34 Year Olds | 16 (32.7%) | 33 (67.3%) |
| 35 Years and over | 34 (59.7%) | 23 (40.4%) |
| Total | 1,377 (89.1%) | 169 (10.9%) |
Educational Attainment by Field of Study in Webster County
Education (237 | 33.1%), science & technology (180 | 25.1%), visual & performing arts (55 | 7.7%), business (54 | 7.5%), and arts & humanities (53 | 7.4%) are the most common fields of study among 717 individuals in Webster County who have obtained a bachelor's degree or higher.

| Field of Study | # Graduates | % Graduates |
| Computers & Mathematics | 2 | 0.3% |
| Bio, Nature & Agricultural | 10 | 1.4% |
| Physical & Health Sciences | 13 | 1.8% |
| Psychology | 25 | 3.5% |
| Social Sciences | 8 | 1.1% |
| Engineering | 7 | 1.0% |
| Multidisciplinary Studies | 4 | 0.6% |
| Science & Technology | 180 | 25.1% |
| Business | 54 | 7.5% |
| Education | 237 | 33.1% |
| Literature & Languages | 5 | 0.7% |
| Liberal Arts & History | 43 | 6.0% |
| Visual & Performing Arts | 55 | 7.7% |
| Communications | 21 | 2.9% |
| Arts & Humanities | 53 | 7.4% |
| Total | 717 | 100.0% |
Transportation & Commute in Webster County
Vehicle Availability by Sex in Webster County
The most prevalent vehicle ownership categories in Webster County are males with 2 vehicles (574, accounting for 35.5%) and females with 2 vehicles (299, making up 59.7%).

| Vehicles Available | Male | Female |
| No Vehicle | 36 (2.2%) | 14 (1.5%) |
| 1 Vehicle | 234 (14.5%) | 205 (21.3%) |
| 2 Vehicles | 574 (35.5%) | 299 (31.1%) |
| 3 Vehicles | 275 (17.0%) | 210 (21.8%) |
| 4 Vehicles | 344 (21.3%) | 147 (15.3%) |
| 5 or more Vehicles | 153 (9.5%) | 87 (9.0%) |
| Total | 1,616 (100.0%) | 962 (100.0%) |
Commute Time in Webster County
The most frequently occuring commute durations in Webster County are 5 to 9 minutes (544 commuters, 21.9%), 45 to 59 minutes (304 commuters, 12.3%), and 30 to 34 minutes (301 commuters, 12.1%).

| Commute Time | # Commuters | % Commuters |
| Less than 5 Minutes | 150 | 6.0% |
| 5 to 9 Minutes | 544 | 21.9% |
| 10 to 14 Minutes | 211 | 8.5% |
| 15 to 19 Minutes | 203 | 8.2% |
| 20 to 24 Minutes | 64 | 2.6% |
| 25 to 29 Minutes | 116 | 4.7% |
| 30 to 34 Minutes | 301 | 12.1% |
| 35 to 39 Minutes | 29 | 1.2% |
| 40 to 44 Minutes | 141 | 5.7% |
| 45 to 59 Minutes | 304 | 12.3% |
| 60 to 89 Minutes | 265 | 10.7% |
| 90 or more Minutes | 152 | 6.1% |
Commute Time by Sex in Webster County
The most common commute times in Webster County are 5 to 9 minutes (350 commuters, 22.4%) for males and 5 to 9 minutes (194 commuters, 21.2%) for females.

| Commute Time | Male | Female |
| Less than 5 Minutes | 83 (5.3%) | 67 (7.3%) |
| 5 to 9 Minutes | 350 (22.4%) | 194 (21.2%) |
| 10 to 14 Minutes | 103 (6.6%) | 108 (11.8%) |
| 15 to 19 Minutes | 50 (3.2%) | 153 (16.7%) |
| 20 to 24 Minutes | 37 (2.4%) | 27 (2.9%) |
| 25 to 29 Minutes | 59 (3.8%) | 57 (6.2%) |
| 30 to 34 Minutes | 254 (16.2%) | 47 (5.1%) |
| 35 to 39 Minutes | 11 (0.7%) | 18 (2.0%) |
| 40 to 44 Minutes | 68 (4.3%) | 73 (8.0%) |
| 45 to 59 Minutes | 263 (16.8%) | 41 (4.5%) |
| 60 to 89 Minutes | 134 (8.6%) | 131 (14.3%) |
| 90 or more Minutes | 152 (9.7%) | 0 (0.0%) |
Time of Departure to Work by Sex in Webster County
The most frequent times of departure to work in Webster County are 4:00 PM to 11:59 PM (284, 18.2%) for males and 7:30 AM to 7:59 AM (160, 17.5%) for females.

| Time of Departure | Male | Female |
| 12:00 AM to 4:59 AM | 79 (5.1%) | 52 (5.7%) |
| 5:00 AM to 5:29 AM | 264 (16.9%) | 11 (1.2%) |
| 5:30 AM to 5:59 AM | 264 (16.9%) | 118 (12.9%) |
| 6:00 AM to 6:29 AM | 217 (13.9%) | 77 (8.4%) |
| 6:30 AM to 6:59 AM | 45 (2.9%) | 66 (7.2%) |
| 7:00 AM to 7:29 AM | 83 (5.3%) | 155 (16.9%) |
| 7:30 AM to 7:59 AM | 80 (5.1%) | 160 (17.5%) |
| 8:00 AM to 8:29 AM | 37 (2.4%) | 99 (10.8%) |
| 8:30 AM to 8:59 AM | 115 (7.3%) | 39 (4.3%) |
| 9:00 AM to 9:59 AM | 44 (2.8%) | 38 (4.2%) |
| 10:00 AM to 10:59 AM | 7 (0.4%) | 26 (2.8%) |
| 11:00 AM to 11:59 AM | 0 (0.0%) | 0 (0.0%) |
| 12:00 PM to 3:59 PM | 45 (2.9%) | 67 (7.3%) |
| 4:00 PM to 11:59 PM | 284 (18.2%) | 8 (0.9%) |
| Total | 1,564 (100.0%) | 916 (100.0%) |
Housing Occupancy in Webster County
Occupancy by Ownership in Webster County
Of the total 3,010 dwellings in Webster County, owner-occupied units account for 2,360 (78.4%), while renter-occupied units make up 650 (21.6%).

| Occupancy | # Housing Units | % Housing Units |
| Owner Occupied Housing Units | 2,360 | 78.4% |
| Renter-Occupied Housing Units | 650 | 21.6% |
| Total Occupied Housing Units | 3,010 | 100.0% |
Occupancy by Household Size in Webster County

| Household Size | # Housing Units | % Housing Units |
| 1-Person Household | 893 | 29.7% |
| 2-Person Household | 1,148 | 38.1% |
| 3-Person Household | 630 | 20.9% |
| 4+ Person Household | 339 | 11.3% |
| Total Housing Units | 3,010 | 100.0% |
Occupancy by Ownership by Household Size in Webster County

| Household Size | Owner-occupied | Renter-occupied |
| 1-Person Household | 594 (66.5%) | 299 (33.5%) |
| 2-Person Household | 1,035 (90.2%) | 113 (9.8%) |
| 3-Person Household | 533 (84.6%) | 97 (15.4%) |
| 4+ Person Household | 198 (58.4%) | 141 (41.6%) |
| Total Housing Units | 2,360 (78.4%) | 650 (21.6%) |
Occupancy by Educational Attainment in Webster County

| Household Size | Owner-occupied | Renter-occupied |
| Less than High School | 475 (67.4%) | 230 (32.6%) |
| High School Diploma | 1,048 (80.1%) | 261 (19.9%) |
| College/Associate Degree | 502 (79.7%) | 128 (20.3%) |
| Bachelor's Degree or higher | 335 (91.5%) | 31 (8.5%) |
Occupancy by Age of Householder in Webster County

| Age Bracket | # Households | % Households |
| Under 35 Years | 228 | 7.6% |
| 35 to 44 Years | 280 | 9.3% |
| 45 to 54 Years | 500 | 16.6% |
| 55 to 64 Years | 829 | 27.5% |
| 65 to 74 Years | 762 | 25.3% |
| 75 to 84 Years | 274 | 9.1% |
| 85 Years and Over | 137 | 4.5% |
| Total | 3,010 | 100.0% |
Housing Finances in Webster County
Median Income by Occupancy in Webster County

| Occupancy Type | # Households | Median Income |
| Owner-Occupied | 2,360 (78.4%) | $50,417 |
| Renter-Occupied | 650 (21.6%) | $14,519 |
| Average | 3,010 (100.0%) | $43,409 |
Occupancy by Householder Income Bracket in Webster County

| Income Bracket | Owner-occupied | Renter-occupied |
| Less than $5,000 | 65 (2.8%) | 58 (8.9%) |
| $5,000 to $9,999 | 82 (3.5%) | 66 (10.2%) |
| $10,000 to $14,999 | 90 (3.8%) | 206 (31.7%) |
| $15,000 to $19,999 | 142 (6.0%) | 8 (1.2%) |
| $20,000 to $24,999 | 189 (8.0%) | 42 (6.5%) |
| $25,000 to $34,999 | 194 (8.2%) | 39 (6.0%) |
| $35,000 to $49,999 | 415 (17.6%) | 113 (17.4%) |
| $50,000 to $74,999 | 496 (21.0%) | 55 (8.5%) |
| $75,000 to $99,999 | 202 (8.6%) | 48 (7.4%) |
| $100,000 to $149,999 | 381 (16.1%) | 15 (2.3%) |
| $150,000 or more | 104 (4.4%) | 0 (0.0%) |
| Total | 2,360 (100.0%) | 650 (100.0%) |
Monthly Housing Cost Tiers in Webster County

| Monthly Cost | Owner-occupied | Renter-occupied |
| Less than $300 | 793 (33.6%) | 54 (8.3%) |
| $300 to $499 | 580 (24.6%) | 61 (9.4%) |
| $500 to $799 | 473 (20.0%) | 228 (35.1%) |
| $800 to $999 | 241 (10.2%) | 78 (12.0%) |
| $1,000 to $1,499 | 187 (7.9%) | 31 (4.8%) |
| $1,500 to $1,999 | 67 (2.8%) | 0 (0.0%) |
| $2,000 to $2,499 | 9 (0.4%) | 0 (0.0%) |
| $2,500 to $2,999 | 0 (0.0%) | 0 (0.0%) |
| $3,000 or more | 10 (0.4%) | 0 (0.0%) |
| Total | 2,360 (100.0%) | 650 (100.0%) |
Physical Housing Characteristics in Webster County
Housing Structures in Webster County

| Structure Type | # Housing Units | % Housing Units |
| Single Unit, Detached | 2,184 | 72.6% |
| Single Unit, Attached | 6 | 0.2% |
| 2 Unit Apartments | 8 | 0.3% |
| 3 or 4 Unit Apartments | 22 | 0.7% |
| 5 to 9 Unit Apartments | 72 | 2.4% |
| 10 or more Apartments | 70 | 2.3% |
| Mobile Home / Other | 648 | 21.5% |
| Total | 3,010 | 100.0% |
Housing Structures by Occupancy in Webster County

| Structure Type | Owner-occupied | Renter-occupied |
| Single Unit, Detached | 1,881 (86.1%) | 303 (13.9%) |
| Single Unit, Attached | 6 (100.0%) | 0 (0.0%) |
| 2 Unit Apartments | 0 (0.0%) | 8 (100.0%) |
| 3 or 4 Unit Apartments | 1 (4.5%) | 21 (95.5%) |
| 5 to 9 Unit Apartments | 0 (0.0%) | 72 (100.0%) |
| 10 or more Apartments | 0 (0.0%) | 70 (100.0%) |
| Mobile Home / Other | 472 (72.8%) | 176 (27.2%) |
| Total | 2,360 (78.4%) | 650 (21.6%) |
Housing Structures by Number of Rooms in Webster County

| Number of Rooms | Owner-occupied | Renter-occupied |
| 1 Room | 28 (1.2%) | 7 (1.1%) |
| 2 or 3 Rooms | 53 (2.2%) | 101 (15.5%) |
| 4 or 5 Rooms | 622 (26.4%) | 345 (53.1%) |
| 6 or 7 Rooms | 944 (40.0%) | 89 (13.7%) |
| 8 or more Rooms | 713 (30.2%) | 108 (16.6%) |
| Total | 2,360 (100.0%) | 650 (100.0%) |
Housing Structure by Heating Type in Webster County

| Heating Type | Owner-occupied | Renter-occupied |
| Utility Gas | 48 (2.0%) | 17 (2.6%) |
| Bottled, Tank, or LP Gas | 654 (27.7%) | 153 (23.5%) |
| Electricity | 921 (39.0%) | 360 (55.4%) |
| Fuel Oil or Kerosene | 80 (3.4%) | 16 (2.5%) |
| Coal or Coke | 8 (0.3%) | 17 (2.6%) |
| All other Fuels | 649 (27.5%) | 87 (13.4%) |
| No Fuel Used | 0 (0.0%) | 0 (0.0%) |
| Total | 2,360 (100.0%) | 650 (100.0%) |
Household Vehicle Usage in Webster County

| Vehicles per Household | Owner-occupied | Renter-occupied |
| No Vehicle | 114 (4.8%) | 279 (42.9%) |
| 1 Vehicle | 684 (29.0%) | 165 (25.4%) |
| 2 Vehicles | 848 (35.9%) | 183 (28.1%) |
| 3 or more Vehicles | 714 (30.2%) | 23 (3.5%) |
| Total | 2,360 (100.0%) | 650 (100.0%) |
Real Estate & Mortgages in Webster County
Real Estate and Mortgage Overview in Webster County
| Characteristic | Without Mortgage | With Mortgage |
| Housing Units | 1,666 | 694 |
| Median Property Value | $70,900 | $97,900 |
| Median Household Income | $45,449 | $11 |
| Monthly Housing Costs | $311 | $0 |
| Real Estate Taxes | $282 | $44 |
Property Value by Mortgage Status in Webster County

| Property Value | Without Mortgage | With Mortgage |
| Less than $50,000 | 581 (34.9%) | 79 (11.4%) |
| $50,000 to $99,999 | 540 (32.4%) | 292 (42.1%) |
| $100,000 to $299,999 | 512 (30.7%) | 297 (42.8%) |
| $300,000 to $499,999 | 13 (0.8%) | 21 (3.0%) |
| $500,000 to $749,999 | 10 (0.6%) | 5 (0.7%) |
| $750,000 to $999,999 | 5 (0.3%) | 0 (0.0%) |
| $1,000,000 or more | 5 (0.3%) | 0 (0.0%) |
| Total | 1,666 (100.0%) | 694 (100.0%) |
Household Income by Mortgage Status in Webster County

| Household Income | Without Mortgage | With Mortgage |
| Less than $10,000 | 126 (7.6%) | 12 (1.7%) |
| $10,000 to $24,999 | 344 (20.6%) | 21 (3.0%) |
| $25,000 to $34,999 | 137 (8.2%) | 77 (11.1%) |
| $35,000 to $49,999 | 348 (20.9%) | 57 (8.2%) |
| $50,000 to $74,999 | 340 (20.4%) | 67 (9.7%) |
| $75,000 to $99,999 | 93 (5.6%) | 156 (22.5%) |
| $100,000 to $149,999 | 185 (11.1%) | 109 (15.7%) |
| $150,000 or more | 93 (5.6%) | 196 (28.2%) |
| Total | 1,666 (100.0%) | 694 (100.0%) |
Property Value to Household Income Ratio in Webster County

| Value-to-Income Ratio | Without Mortgage | With Mortgage |
| Less than 2.0x | 1,008 (60.5%) | 70,375 (10,140.5%) |
| 2.0x to 2.9x | 221 (13.3%) | 437 (63.0%) |
| 3.0x to 3.9x | 94 (5.6%) | 131 (18.9%) |
| 4.0x or more | 315 (18.9%) | 45 (6.5%) |
| Total | 1,666 (100.0%) | 694 (100.0%) |
Real Estate Taxes by Mortgage Status in Webster County

| Property Taxes | Without Mortgage | With Mortgage |
| Less than $800 | 1,226 (73.6%) | 0 (0.0%) |
| $800 to $1,499 | 92 (5.5%) | 618 (89.0%) |
| $800 to $1,499 | 7 (0.4%) | 27 (3.9%) |
| Total | 1,666 (100.0%) | 694 (100.0%) |
Health & Disability in Webster County
Health Insurance Coverage by Age in Webster County

| Age Bracket | With Coverage | Without Coverage |
| Under 6 Years | 422 (100.0%) | 0 (0.0%) |
| 6 to 18 Years | 1,221 (91.4%) | 115 (8.6%) |
| 19 to 25 Years | 493 (86.3%) | 78 (13.7%) |
| 26 to 34 Years | 620 (93.7%) | 42 (6.3%) |
| 35 to 44 Years | 832 (96.3%) | 32 (3.7%) |
| 45 to 54 Years | 1,137 (96.3%) | 44 (3.7%) |
| 55 to 64 Years | 1,280 (97.1%) | 38 (2.9%) |
| 65 to 74 Years | 1,215 (100.0%) | 0 (0.0%) |
| 75 Years and older | 730 (100.0%) | 0 (0.0%) |
| Total | 7,950 (95.8%) | 349 (4.2%) |
Health Insurance Coverage by Citizenship Status in Webster County

| Citizenship Status | With Coverage | Without Coverage |
| Native Born | 422 (100.0%) | 0 (0.0%) |
| Foreign Born, Citizen | 1,221 (91.4%) | 115 (8.6%) |
| Foreign Born, not a Citizen | 493 (86.3%) | 78 (13.7%) |
Health Insurance Coverage by Household Income in Webster County

| Household Income | With Coverage | Without Coverage |
| Under $25,000 | 1,684 (96.7%) | 58 (3.3%) |
| $25,000 to $49,999 | 1,933 (98.3%) | 33 (1.7%) |
| $50,000 to $74,999 | 1,831 (93.7%) | 124 (6.3%) |
| $75,000 to $99,999 | 732 (88.4%) | 96 (11.6%) |
| $100,000 and over | 1,770 (97.9%) | 38 (2.1%) |
Public vs Private Health Insurance Coverage by Age in Webster County

| Age Bracket | Public Insurance | Private Insurance |
| Under 6 | 323 (76.5%) | 103 (24.4%) |
| 6 to 18 Years | 770 (57.6%) | 477 (35.7%) |
| 19 to 25 Years | 304 (53.2%) | 270 (47.3%) |
| 25 to 34 Years | 364 (55.0%) | 307 (46.4%) |
| 35 to 44 Years | 348 (40.3%) | 555 (64.2%) |
| 45 to 54 Years | 564 (47.8%) | 596 (50.5%) |
| 55 to 64 Years | 671 (50.9%) | 722 (54.8%) |
| 65 to 74 Years | 1,215 (100.0%) | 555 (45.7%) |
| 75 Years and over | 730 (100.0%) | 420 (57.5%) |
| Total | 5,289 (63.7%) | 4,005 (48.3%) |
Disability Status by Sex by Age in Webster County

| Age Bracket | Male | Female |
| Under 5 Years | 0 (0.0%) | 0 (0.0%) |
| 5 to 17 Years | 22 (3.3%) | 72 (11.6%) |
| 18 to 34 Years | 115 (16.6%) | 75 (12.0%) |
| 35 to 64 Years | 394 (22.6%) | 315 (19.5%) |
| 65 to 74 Years | 284 (48.5%) | 241 (38.3%) |
| 75 Years and over | 225 (67.4%) | 266 (67.2%) |
Disability Class by Sex by Age in Webster County
Disability Class: Hearing Difficulty

| Age Bracket | Male | Female |
| Under 5 Years | 0 (0.0%) | 0 (0.0%) |
| 5 to 17 Years | 0 (0.0%) | 0 (0.0%) |
| 18 to 34 Years | 21 (3.0%) | 7 (1.1%) |
| 35 to 64 Years | 99 (5.7%) | 9 (0.6%) |
| 65 to 74 Years | 130 (22.2%) | 27 (4.3%) |
| 75 Years and over | 145 (43.4%) | 101 (25.5%) |
Disability Class: Vision Difficulty

| Age Bracket | Male | Female |
| Under 5 Years | 0 (0.0%) | 0 (0.0%) |
| 5 to 17 Years | 0 (0.0%) | 55 (8.8%) |
| 18 to 34 Years | 70 (10.1%) | 0 (0.0%) |
| 35 to 64 Years | 50 (2.9%) | 62 (3.8%) |
| 65 to 74 Years | 74 (12.7%) | 84 (13.3%) |
| 75 Years and over | 40 (12.0%) | 89 (22.5%) |
Disability Class: Cognitive Difficulty

| Age Bracket | Male | Female |
| 5 to 17 Years | 22 (3.3%) | 7 (1.1%) |
| 18 to 34 Years | 45 (6.5%) | 63 (10.1%) |
| 35 to 64 Years | 186 (10.6%) | 90 (5.6%) |
| 65 to 74 Years | 59 (10.1%) | 94 (14.9%) |
| 75 Years and over | 101 (30.2%) | 94 (23.7%) |
Disability Class: Ambulatory Difficulty

| Age Bracket | Male | Female |
| 5 to 17 Years | 0 (0.0%) | 15 (2.4%) |
| 18 to 34 Years | 0 (0.0%) | 16 (2.6%) |
| 35 to 64 Years | 152 (8.7%) | 197 (12.2%) |
| 65 to 74 Years | 134 (22.9%) | 168 (26.7%) |
| 75 Years and over | 157 (47.0%) | 234 (59.1%) |
Disability Class: Self-Care Difficulty

| Age Bracket | Male | Female |
| 5 to 17 Years | 0 (0.0%) | 2 (0.3%) |
| 18 to 34 Years | 0 (0.0%) | 0 (0.0%) |
| 35 to 64 Years | 95 (5.4%) | 66 (4.1%) |
| 65 to 74 Years | 116 (19.8%) | 39 (6.2%) |
| 75 Years and over | 61 (18.3%) | 66 (16.7%) |
Technology Access in Webster County
Computing Device Access in Webster County

| Device Type | # Households | % Households |
| Desktop or Laptop | 1,752 | 58.2% |
| Smartphone | 2,153 | 71.5% |
| Tablet | 1,372 | 45.6% |
| No Computing Device | 443 | 14.7% |
| Total | 3,010 | 100.0% |
Internet Access in Webster County

| Internet Type | # Households | % Households |
| Dial-Up Internet | 10 | 0.3% |
| Broadband Home | 1,802 | 59.9% |
| Cellular Data Only | 285 | 9.5% |
| Satellite Internet | 266 | 8.8% |
| No Internet | 705 | 23.4% |
| Total | 3,010 | 100.0% |
Webster County Summary
Webster County, West Virginia is located in the Appalachian Mountains of the United States. It is bordered by Braxton County to the north, Nicholas County to the east, Greenbrier County to the south, and Pocahontas County to the west. The county seat is Webster Springs. The county was created in 1860 from parts of Braxton, Nicholas, and Randolph counties.
History
The area that is now Webster County was originally inhabited by Native Americans, including the Moneton, Shawnee, and Cherokee tribes. The first European settlers arrived in the area in the late 1700s. The county was named for Daniel Webster, a prominent American statesman.
Webster County was officially established in 1860. During the Civil War, the county was divided between Union and Confederate sympathizers. After the war, the county experienced a period of economic growth, with the development of coal mining, timber, and other industries.
In the early 1900s, the county was hit hard by the Great Depression. Many of the county’s residents were forced to leave in search of work elsewhere. The county’s population declined significantly during this time.
In the 1950s, the county experienced a resurgence in economic activity, with the development of the tourism industry. The county is now home to several popular tourist attractions, including the Webster County Historical Museum and the Webster County Wildlife Management Area.
Geography
Webster County is located in the Appalachian Mountains of West Virginia. The county is mostly mountainous, with elevations ranging from 1,000 to 3,000 feet. The highest point in the county is Bald Knob, which has an elevation of 3,000 feet.
The county is drained by the Elk River and its tributaries. The Elk River is a major tributary of the Gauley River. The county is also home to several small lakes, including Lake Webster and Lake Maud.
The county has a total area of 517 square miles, of which 514 square miles is land and 3 square miles is water.
Economy
The economy of Webster County is largely based on tourism and natural resources. The county is home to several popular tourist attractions, including the Webster County Historical Museum and the Webster County Wildlife Management Area.
The county is also home to several large coal mines, which provide employment for many of the county’s residents. Other industries in the county include timber, manufacturing, and agriculture.
Demographics
As of the 2010 census, the population of Webster County was 9,154. The population has declined significantly since the 1950s, when the county had a population of over 12,000.
The racial makeup of the county is 97.3% White, 0.7% African American, 0.2% Native American, 0.2% Asian, 0.1% Pacific Islander, 0.3% from other races, and 1.2% from two or more races. The median household income in the county is $30,945. The per capita income is $17,845.
The largest employers in the county are the Webster County Board of Education, the Webster County Coal Company, and the Webster County Health Department. The county is served by the Webster County School System, which includes four elementary schools, one middle school, and one high school.
Common Questions
What is the Total Population of Webster County?
Total Population of Webster County is 8,362.
What is the Total Male Population of Webster County?
Total Male Population of Webster County is 4,168.
What is the Total Female Population of Webster County?
Total Female Population of Webster County is 4,194.
What is the Ratio of Males per 100 Females in Webster County?
There are 99.38 Males per 100 Females in Webster County.
What is the Ratio of Females per 100 Males in Webster County?
There are 100.62 Females per 100 Males in Webster County.
What is the Median Population Age in Webster County?
Median Population Age in Webster County is 47.8 Years.
What is the Average Family Size in Webster County
Average Family Size in Webster County is 3.5 People.
What is the Average Household Size in Webster County
Average Household Size in Webster County is 2.8 People.
What is Per Capita Income in Webster County?
Per Capita income in Webster County is $23,494.
What is the Median Family Income in Webster County?
Median Family Income in Webster County is $55,534.
What is the Median Household income in Webster County?
Median Household Income in Webster County is $43,409.
What is Income or Wage Gap in Webster County?
Income or Wage Gap in Webster County is 33.8%.
Women in Webster County earn 66.2 cents for every dollar earned by a man.
What is Family Income Deficit in Webster County?
Family Income Deficit in Webster County is $13,724.
Families that are below poverty line in Webster County earn $13,724 less on average than the poverty threshold level.
What is Inequality or Gini Index in Webster County?
Inequality or Gini Index in Webster County is 0.46.
How Large is the Labor Force in Webster County?
There are 3,000 People in the Labor Forcein in Webster County.
What is the Percentage of People in the Labor Force in Webster County?
43.3% of People are in the Labor Force in Webster County.
What is the Unemployment Rate in Webster County?
Unemployment Rate in Webster County is 11.1%.