Wayne County, WV
Wayne County Overview
38,933
TOTAL POPULATION
19,098
MALE POPULATION
19,835
FEMALE POPULATION
96.28
MALES / 100 FEMALES
103.86
FEMALES / 100 MALES
44.5
MEDIAN AGE
3.2
AVG FAMILY SIZE
2.6
AVG HOUSEHOLD SIZE
$29,774
PER CAPITA INCOME
$67,605
AVG FAMILY INCOME
$52,694
AVG HOUSEHOLD INCOME
33.4%
WAGE / INCOME GAP [ % ]
66.6¢/ $1
WAGE / INCOME GAP [ $ ]
$9,773
FAMILY INCOME DEFICIT
0.49
INEQUALITY / GINI INDEX
15,009
LABOR FORCE [ PEOPLE ]
46.7%
PERCENT IN LABOR FORCE
5.0%
UNEMPLOYMENT RATE
Race in Wayne County
The most populous races in Wayne County are White / Caucasian (37,494 | 96.3%), Two or more Races (1,026 | 2.6%), and Black / African American (343 | 0.9%).
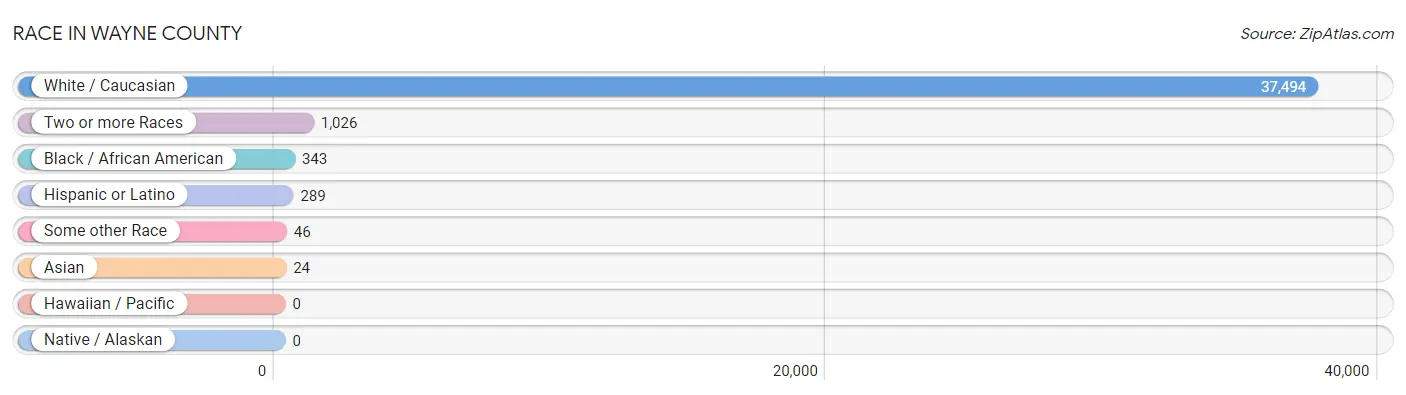
| Race | # Population | % Population |
| Asian | 24 | 0.1% |
| Black / African American | 343 | 0.9% |
| Hawaiian / Pacific | 0 | 0.0% |
| Hispanic or Latino | 289 | 0.7% |
| Native / Alaskan | 0 | 0.0% |
| White / Caucasian | 37,494 | 96.3% |
| Two or more Races | 1,026 | 2.6% |
| Some other Race | 46 | 0.1% |
| Total | 38,933 | 100.0% |
Ancestry in Wayne County
The most populous ancestries reported in Wayne County are English (9,152 | 23.5%), American (4,827 | 12.4%), Irish (3,143 | 8.1%), German (2,463 | 6.3%), and European (767 | 2.0%), together accounting for 52.3% of all Wayne County residents.
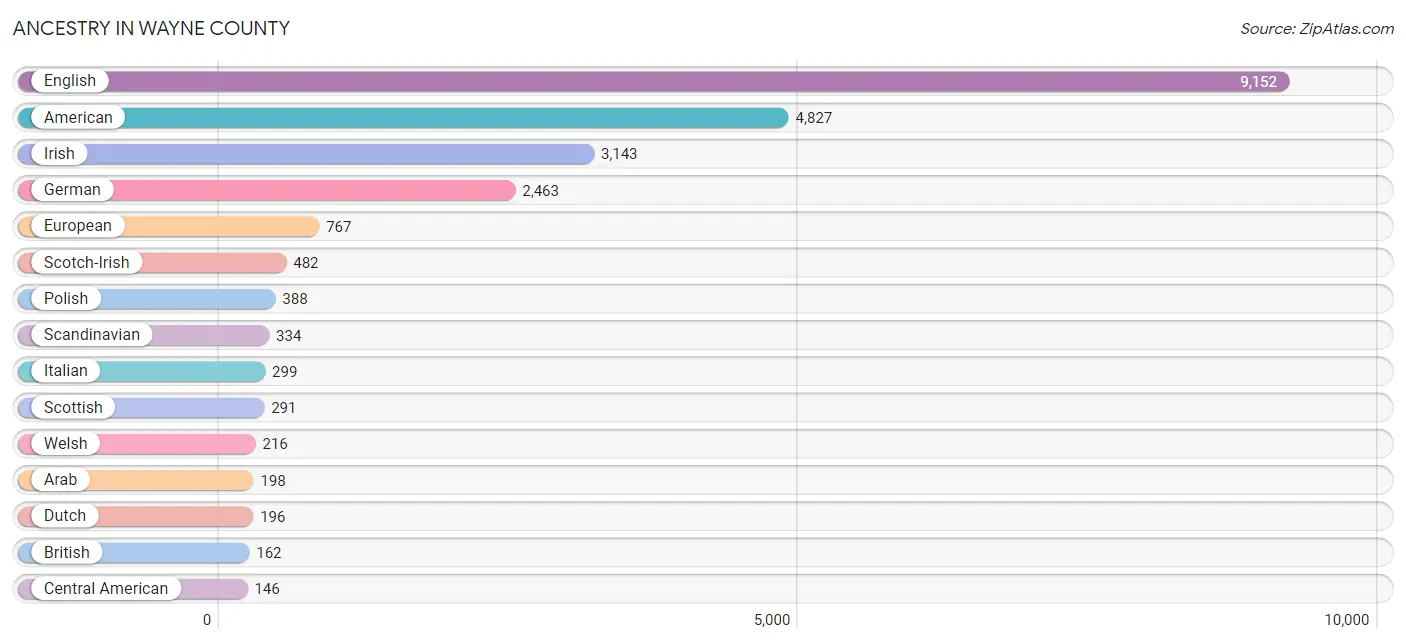
| Ancestry | # Population | % Population |
| African | 3 | 0.0% |
| American | 4,827 | 12.4% |
| Apache | 10 | 0.0% |
| Arab | 198 | 0.5% |
| Australian | 13 | 0.0% |
| Austrian | 9 | 0.0% |
| Bahamian | 104 | 0.3% |
| Bhutanese | 13 | 0.0% |
| British | 162 | 0.4% |
| Canadian | 9 | 0.0% |
| Central American | 146 | 0.4% |
| Central American Indian | 2 | 0.0% |
| Cherokee | 55 | 0.1% |
| Colombian | 11 | 0.0% |
| Czech | 102 | 0.3% |
| Czechoslovakian | 4 | 0.0% |
| Dutch | 196 | 0.5% |
| Eastern European | 61 | 0.2% |
| English | 9,152 | 23.5% |
| European | 767 | 2.0% |
| Finnish | 105 | 0.3% |
| French | 130 | 0.3% |
| French Canadian | 49 | 0.1% |
| German | 2,463 | 6.3% |
| Greek | 47 | 0.1% |
| Guatemalan | 11 | 0.0% |
| Indian (Asian) | 7 | 0.0% |
| Irish | 3,143 | 8.1% |
| Italian | 299 | 0.8% |
| Korean | 86 | 0.2% |
| Lebanese | 63 | 0.2% |
| Lumbee | 4 | 0.0% |
| Mexican | 78 | 0.2% |
| Northern European | 33 | 0.1% |
| Norwegian | 118 | 0.3% |
| Polish | 388 | 1.0% |
| Puerto Rican | 7 | 0.0% |
| Romanian | 6 | 0.0% |
| Russian | 35 | 0.1% |
| Salvadoran | 135 | 0.4% |
| Scandinavian | 334 | 0.9% |
| Scotch-Irish | 482 | 1.2% |
| Scottish | 291 | 0.7% |
| Slavic | 14 | 0.0% |
| Slovak | 29 | 0.1% |
| Slovene | 4 | 0.0% |
| South American | 11 | 0.0% |
| Spaniard | 1 | 0.0% |
| Subsaharan African | 3 | 0.0% |
| Swedish | 31 | 0.1% |
| Syrian | 3 | 0.0% |
| Thai | 5 | 0.0% |
| Welsh | 216 | 0.5% | View All 53 Rows |
Immigrants in Wayne County
The most numerous immigrant groups reported in Wayne County came from Asia (180 | 0.5%), Latin America (131 | 0.3%), Eastern Asia (107 | 0.3%), Bahamas (104 | 0.3%), and Caribbean (104 | 0.3%), together accounting for 1.6% of all Wayne County residents.
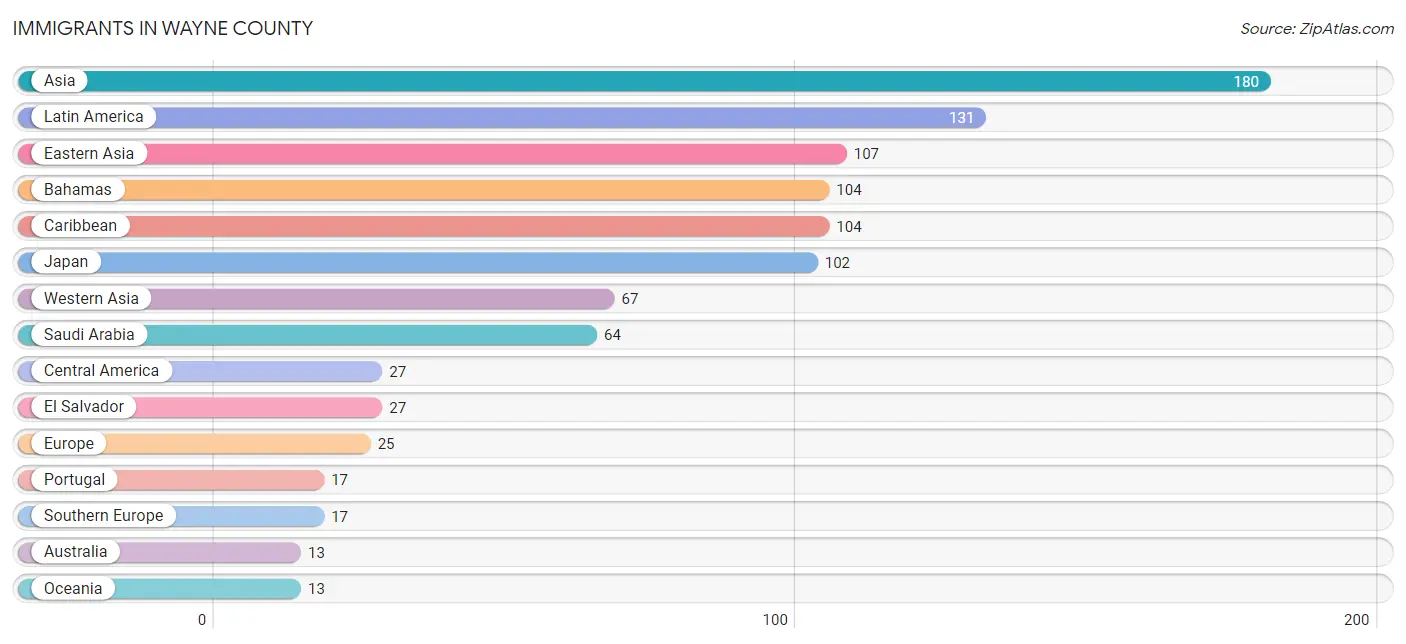
| Immigration Origin | # Population | % Population |
| Asia | 180 | 0.5% |
| Australia | 13 | 0.0% |
| Bahamas | 104 | 0.3% |
| Caribbean | 104 | 0.3% |
| Central America | 27 | 0.1% |
| China | 5 | 0.0% |
| Eastern Asia | 107 | 0.3% |
| El Salvador | 27 | 0.1% |
| Europe | 25 | 0.1% |
| Germany | 2 | 0.0% |
| Japan | 102 | 0.3% |
| Latin America | 131 | 0.3% |
| Netherlands | 6 | 0.0% |
| Oceania | 13 | 0.0% |
| Portugal | 17 | 0.0% |
| Saudi Arabia | 64 | 0.2% |
| South Eastern Asia | 6 | 0.0% |
| Southern Europe | 17 | 0.0% |
| Syria | 3 | 0.0% |
| Taiwan | 5 | 0.0% |
| Vietnam | 6 | 0.0% |
| Western Asia | 67 | 0.2% |
| Western Europe | 8 | 0.0% | View All 23 Rows |
Sex and Age in Wayne County
Sex and Age in Wayne County
The most populous age groups in Wayne County are 60 to 64 Years (1,513 | 7.9%) for men and 55 to 59 Years (1,679 | 8.5%) for women.
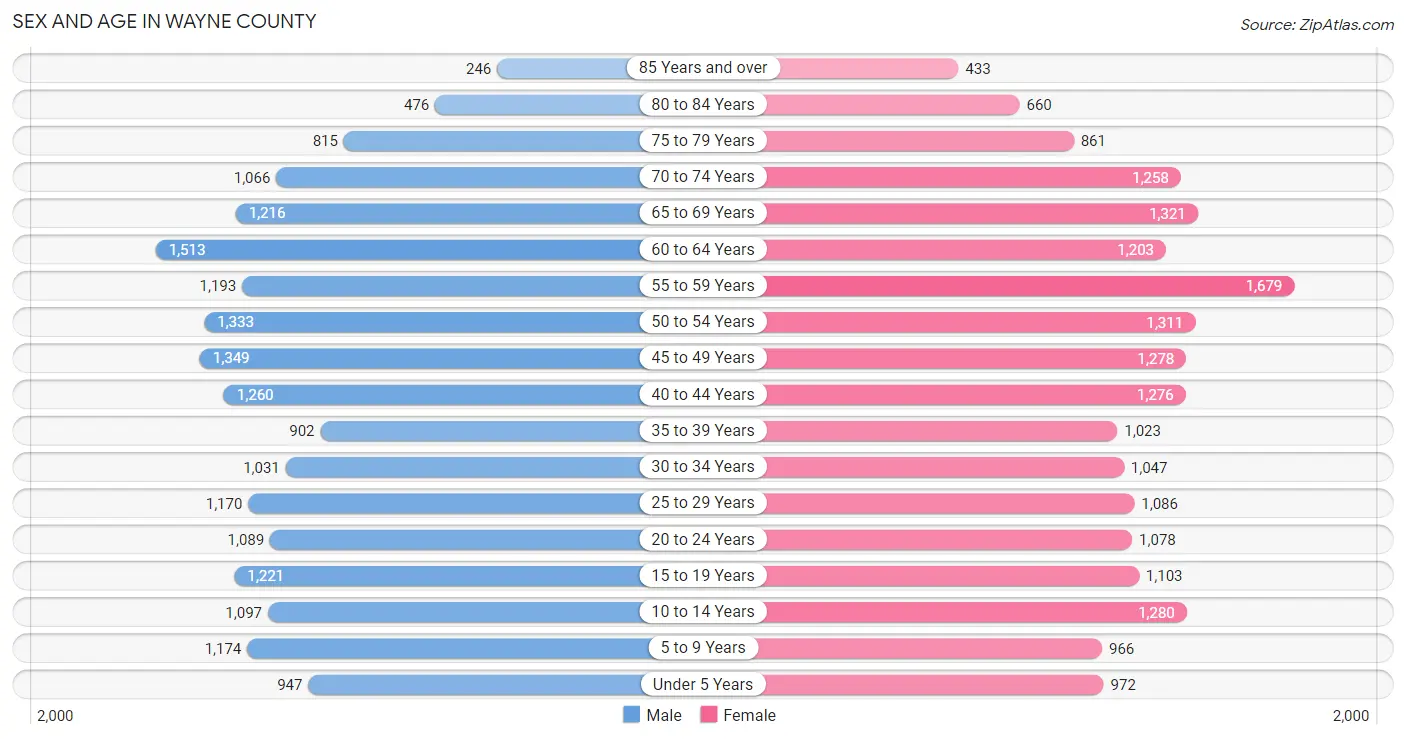
| Age Bracket | Male | Female |
| Under 5 Years | 947 (5.0%) | 972 (4.9%) |
| 5 to 9 Years | 1,174 (6.1%) | 966 (4.9%) |
| 10 to 14 Years | 1,097 (5.7%) | 1,280 (6.5%) |
| 15 to 19 Years | 1,221 (6.4%) | 1,103 (5.6%) |
| 20 to 24 Years | 1,089 (5.7%) | 1,078 (5.4%) |
| 25 to 29 Years | 1,170 (6.1%) | 1,086 (5.5%) |
| 30 to 34 Years | 1,031 (5.4%) | 1,047 (5.3%) |
| 35 to 39 Years | 902 (4.7%) | 1,023 (5.2%) |
| 40 to 44 Years | 1,260 (6.6%) | 1,276 (6.4%) |
| 45 to 49 Years | 1,349 (7.1%) | 1,278 (6.4%) |
| 50 to 54 Years | 1,333 (7.0%) | 1,311 (6.6%) |
| 55 to 59 Years | 1,193 (6.2%) | 1,679 (8.5%) |
| 60 to 64 Years | 1,513 (7.9%) | 1,203 (6.1%) |
| 65 to 69 Years | 1,216 (6.4%) | 1,321 (6.7%) |
| 70 to 74 Years | 1,066 (5.6%) | 1,258 (6.3%) |
| 75 to 79 Years | 815 (4.3%) | 861 (4.3%) |
| 80 to 84 Years | 476 (2.5%) | 660 (3.3%) |
| 85 Years and over | 246 (1.3%) | 433 (2.2%) |
| Total | 19,098 (100.0%) | 19,835 (100.0%) |
Families and Households in Wayne County
Median Family Size in Wayne County
The median family size in Wayne County is 3.24 persons per family, with single female/mother families (1,473 | 14.7%) accounting for the largest median family size of 3.35 persons per family. On the other hand, single male/father families (713 | 7.1%) represent the smallest median family size with 2.88 persons per family.
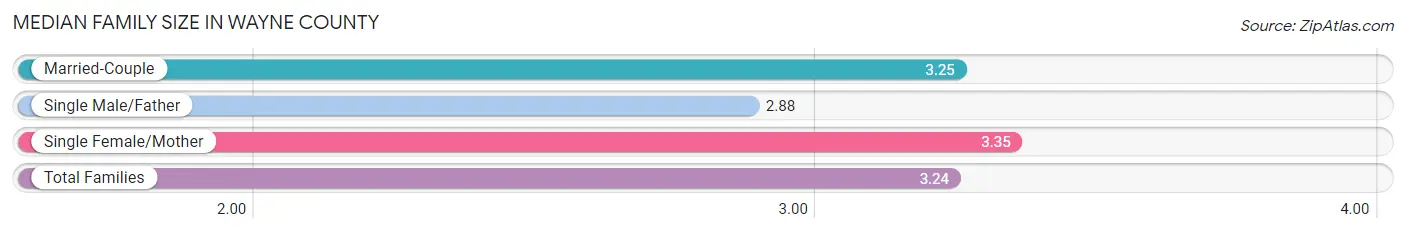
| Family Type | # Families | Family Size |
| Married-Couple | 7,843 (78.2%) | 3.25 |
| Single Male/Father | 713 (7.1%) | 2.88 |
| Single Female/Mother | 1,473 (14.7%) | 3.35 |
| Total Families | 10,029 (100.0%) | 3.24 |
Median Household Size in Wayne County
The median household size in Wayne County is 2.59 persons per household, with single male/father households (713 | 4.8%) accounting for the largest median household size of 3.6 persons per household. non-family households (4,930 | 33.0%) represent the smallest median household size with 1.10 persons per household.
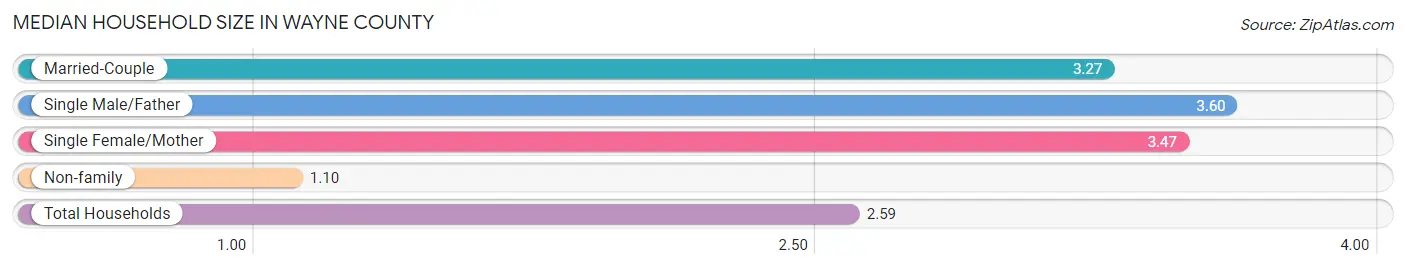
| Household Type | # Households | Household Size |
| Married-Couple | 7,843 (52.4%) | 3.27 |
| Single Male/Father | 713 (4.8%) | 3.60 |
| Single Female/Mother | 1,473 (9.9%) | 3.47 |
| Non-family | 4,930 (33.0%) | 1.10 |
| Total Households | 14,959 (100.0%) | 2.59 |
Household Size by Marriage Status in Wayne County
Out of a total of 14,959 households in Wayne County, 10,029 (67.0%) are family households, while 4,930 (33.0%) are nonfamily households. The most numerous type of family households are 2-person households, comprising 4,740, and the most common type of nonfamily households are 1-person households, comprising 4,530.
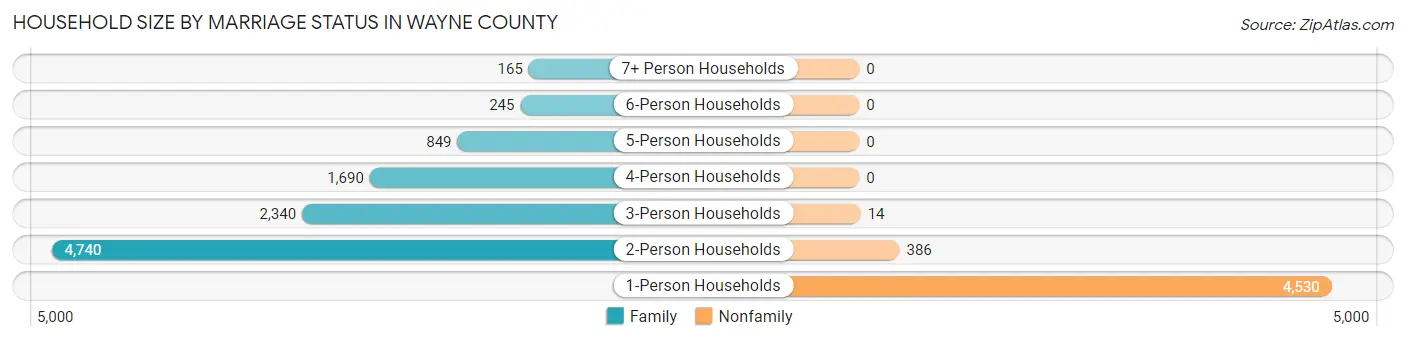
| Household Size | Family Households | Nonfamily Households |
| 1-Person Households | - | 4,530 (30.3%) |
| 2-Person Households | 4,740 (31.7%) | 386 (2.6%) |
| 3-Person Households | 2,340 (15.6%) | 14 (0.1%) |
| 4-Person Households | 1,690 (11.3%) | 0 (0.0%) |
| 5-Person Households | 849 (5.7%) | 0 (0.0%) |
| 6-Person Households | 245 (1.6%) | 0 (0.0%) |
| 7+ Person Households | 165 (1.1%) | 0 (0.0%) |
| Total | 10,029 (67.0%) | 4,930 (33.0%) |
Female Fertility in Wayne County
Fertility by Age in Wayne County
Average fertility rate in Wayne County is 46.0 births per 1,000 women. Women in the age bracket of 20 to 34 years have the highest fertility rate with 110.0 births per 1,000 women. Women in the age bracket of 20 to 34 years acount for 92.7% of all women with births.
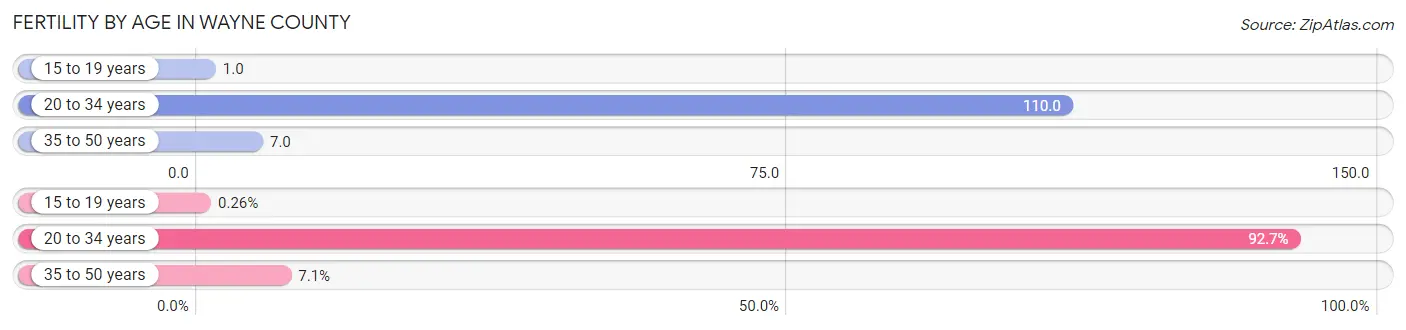
| Age Bracket | Women with Births | Births / 1,000 Women |
| 15 to 19 years | 1 (0.3%) | 1.0 |
| 20 to 34 years | 354 (92.7%) | 110.0 |
| 35 to 50 years | 27 (7.1%) | 7.0 |
| Total | 382 (100.0%) | 46.0 |
Fertility by Age by Marriage Status in Wayne County
35.9% of women with births (382) in Wayne County are married. The highest percentage of unmarried women with births falls into 15 to 19 years age bracket with 100.0% of them unmarried at the time of birth, while the lowest percentage of unmarried women with births belong to 35 to 50 years age bracket with 0.0% of them unmarried.
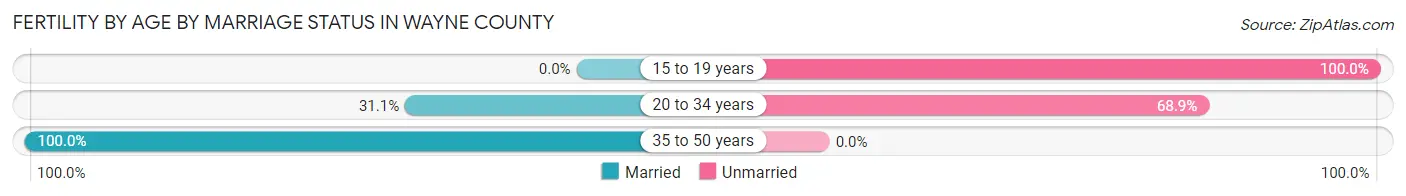
| Age Bracket | Married | Unmarried |
| 15 to 19 years | 0 (0.0%) | 1 (100.0%) |
| 20 to 34 years | 110 (31.1%) | 244 (68.9%) |
| 35 to 50 years | 27 (100.0%) | 0 (0.0%) |
| Total | 137 (35.9%) | 245 (64.1%) |
Fertility by Education in Wayne County
Average fertility rate in Wayne County is 46.0 births per 1,000 women. Women with the education attainment of high school diploma have the highest fertility rate of 82.0 births per 1,000 women, while women with the education attainment of college or associate's degree have the lowest fertility at 15.0 births per 1,000 women. Women with the education attainment of high school diploma represent 36.6% of all women with births.
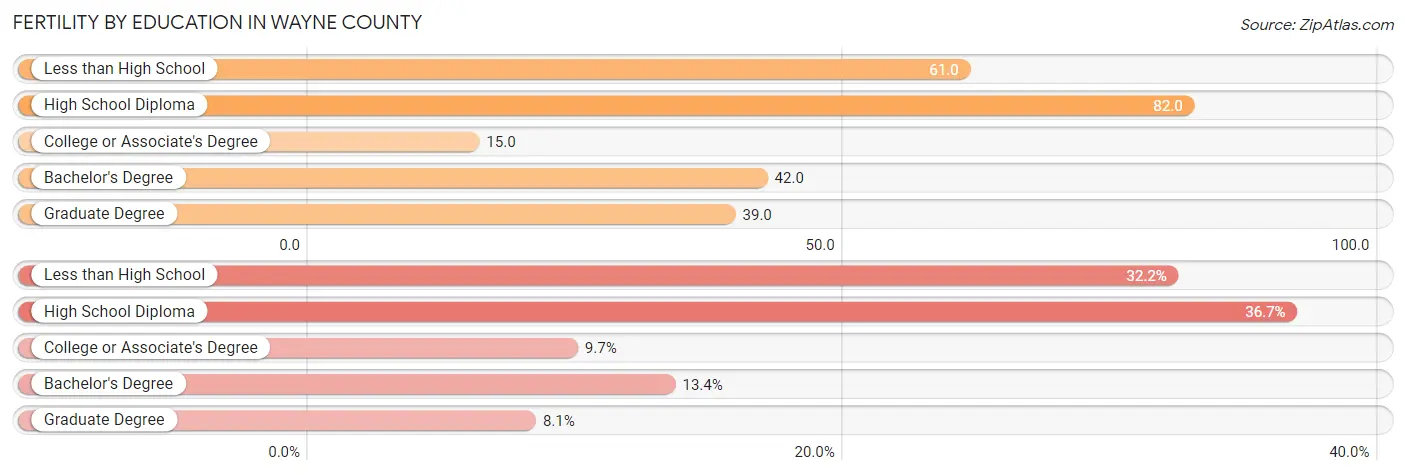
| Educational Attainment | Women with Births | Births / 1,000 Women |
| Less than High School | 123 (32.2%) | 61.0 |
| High School Diploma | 140 (36.6%) | 82.0 |
| College or Associate's Degree | 37 (9.7%) | 15.0 |
| Bachelor's Degree | 51 (13.4%) | 42.0 |
| Graduate Degree | 31 (8.1%) | 39.0 |
| Total | 382 (100.0%) | 46.0 |
Fertility by Education by Marriage Status in Wayne County
64.1% of women with births in Wayne County are unmarried. Women with the educational attainment of bachelor's degree are most likely to be married with 94.1% of them married at childbirth, while women with the educational attainment of less than high school are least likely to be married with 100.0% of them unmarried at childbirth.
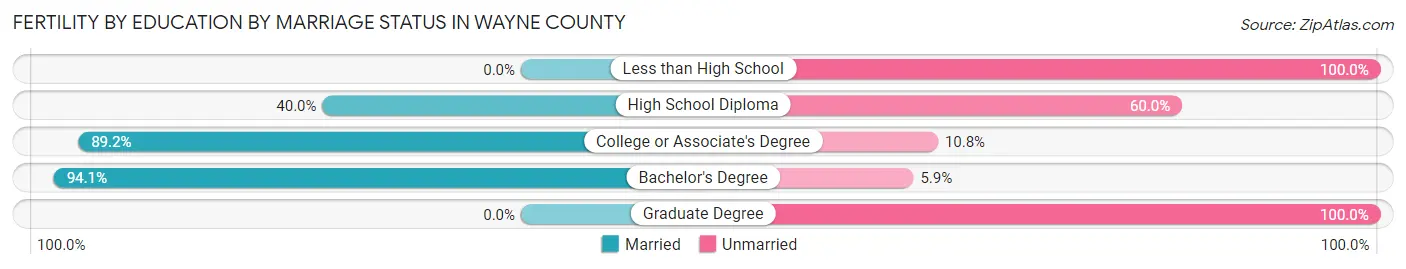
| Educational Attainment | Married | Unmarried |
| Less than High School | 0 (0.0%) | 123 (100.0%) |
| High School Diploma | 56 (40.0%) | 84 (60.0%) |
| College or Associate's Degree | 33 (89.2%) | 4 (10.8%) |
| Bachelor's Degree | 48 (94.1%) | 3 (5.9%) |
| Graduate Degree | 0 (0.0%) | 31 (100.0%) |
| Total | 137 (35.9%) | 245 (64.1%) |
Income in Wayne County
Income Overview in Wayne County
Per Capita Income in Wayne County is $29,774, while median incomes of families and households are $67,605 and $52,694 respectively.
| Characteristic | Number | Measure |
| Per Capita Income | 38,933 | $29,774 |
| Median Family Income | 10,029 | $67,605 |
| Mean Family Income | 10,029 | $88,441 |
| Median Household Income | 14,959 | $52,694 |
| Mean Household Income | 14,959 | $72,830 |
| Income Deficit | 10,029 | $9,773 |
| Wage / Income Gap (%) | 38,933 | 33.41% |
| Wage / Income Gap ($) | 38,933 | 66.59¢ per $1 |
| Gini / Inequality Index | 38,933 | 0.49 |
Earnings by Sex in Wayne County
Average Earnings in Wayne County are $36,203, $44,720 for men and $29,778 for women, a difference of 33.4%.
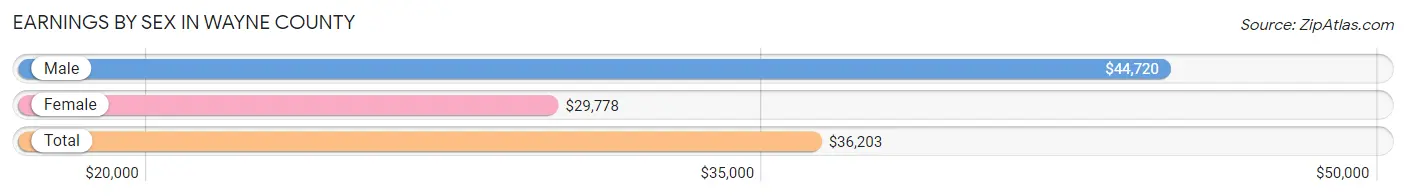
| Sex | Number | Average Earnings |
| Male | 8,020 (51.1%) | $44,720 |
| Female | 7,667 (48.9%) | $29,778 |
| Total | 15,687 (100.0%) | $36,203 |
Earnings by Sex by Income Bracket in Wayne County
The most common earnings brackets in Wayne County are $75,000 to $99,999 for men (1,004 | 12.5%) and $25,000 to $29,999 for women (641 | 8.4%).
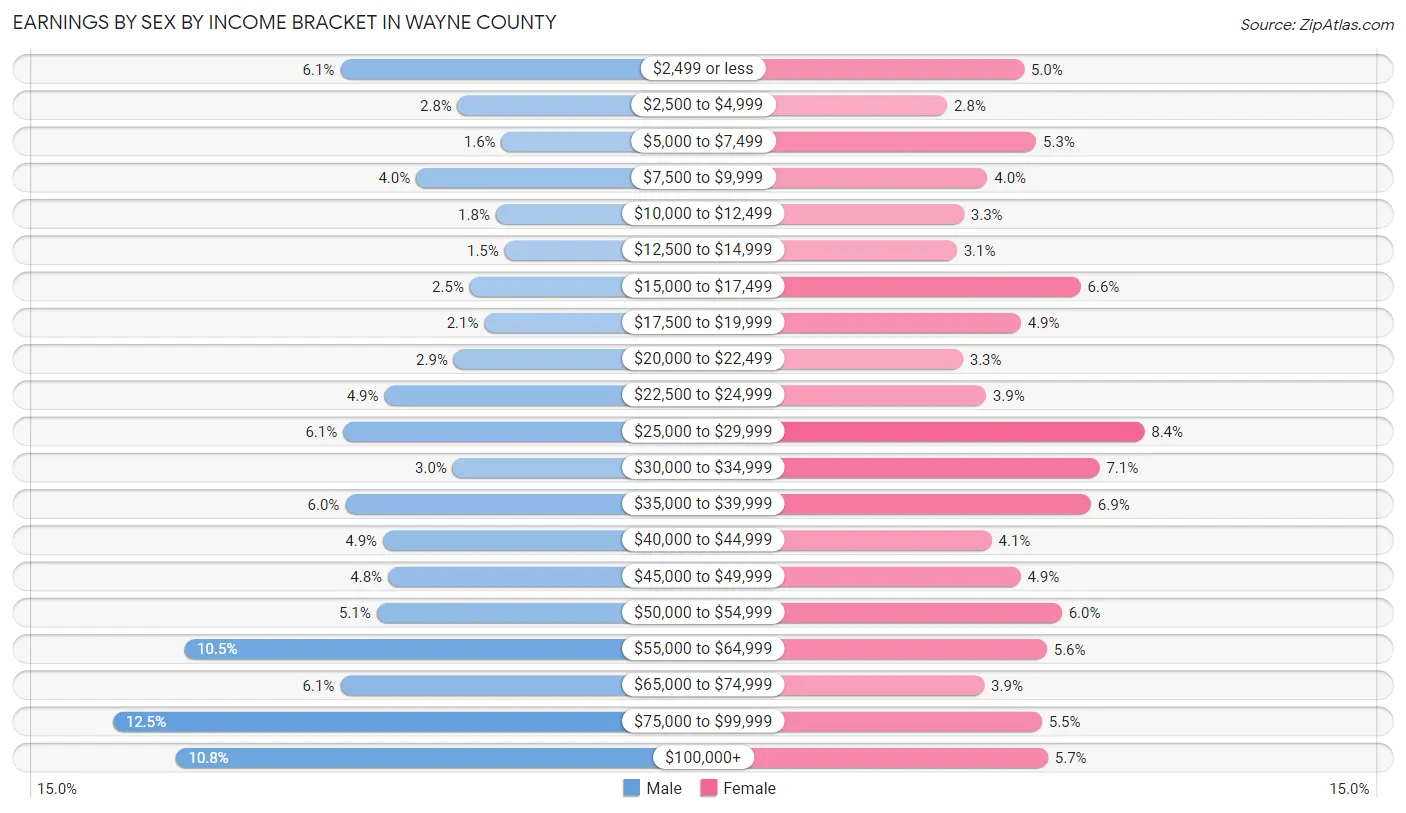
| Income | Male | Female |
| $2,499 or less | 492 (6.1%) | 382 (5.0%) |
| $2,500 to $4,999 | 227 (2.8%) | 216 (2.8%) |
| $5,000 to $7,499 | 128 (1.6%) | 408 (5.3%) |
| $7,500 to $9,999 | 321 (4.0%) | 303 (4.0%) |
| $10,000 to $12,499 | 141 (1.8%) | 252 (3.3%) |
| $12,500 to $14,999 | 121 (1.5%) | 237 (3.1%) |
| $15,000 to $17,499 | 200 (2.5%) | 504 (6.6%) |
| $17,500 to $19,999 | 167 (2.1%) | 375 (4.9%) |
| $20,000 to $22,499 | 236 (2.9%) | 250 (3.3%) |
| $22,500 to $24,999 | 392 (4.9%) | 300 (3.9%) |
| $25,000 to $29,999 | 485 (6.0%) | 641 (8.4%) |
| $30,000 to $34,999 | 238 (3.0%) | 544 (7.1%) |
| $35,000 to $39,999 | 480 (6.0%) | 526 (6.9%) |
| $40,000 to $44,999 | 395 (4.9%) | 312 (4.1%) |
| $45,000 to $49,999 | 384 (4.8%) | 374 (4.9%) |
| $50,000 to $54,999 | 410 (5.1%) | 463 (6.0%) |
| $55,000 to $64,999 | 844 (10.5%) | 431 (5.6%) |
| $65,000 to $74,999 | 492 (6.1%) | 296 (3.9%) |
| $75,000 to $99,999 | 1,004 (12.5%) | 420 (5.5%) |
| $100,000+ | 863 (10.8%) | 433 (5.7%) |
| Total | 8,020 (100.0%) | 7,667 (100.0%) |
Earnings by Sex by Educational Attainment in Wayne County
Average earnings in Wayne County are $51,181 for men and $33,753 for women, a difference of 34.1%. Men with an educational attainment of graduate degree enjoy the highest average annual earnings of $77,909, while those with less than high school education earn the least with $29,231. Women with an educational attainment of graduate degree earn the most with the average annual earnings of $54,836, while those with less than high school education have the smallest earnings of $18,474.
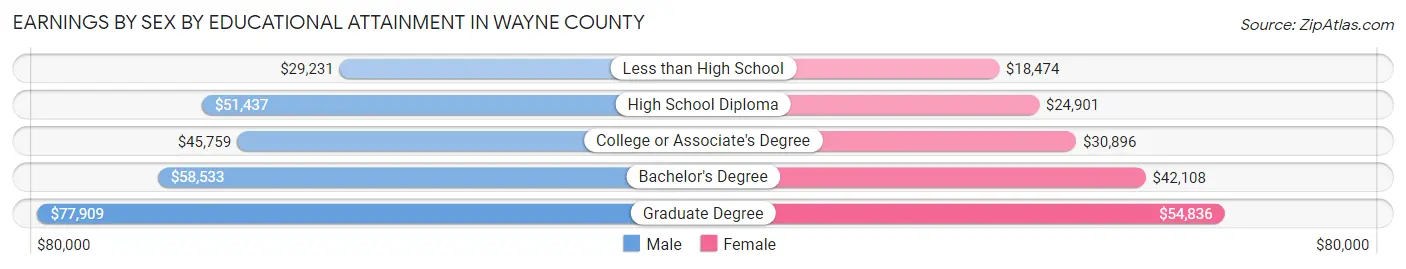
| Educational Attainment | Male Income | Female Income |
| Less than High School | $29,231 | $18,474 |
| High School Diploma | $51,437 | $24,901 |
| College or Associate's Degree | $45,759 | $30,896 |
| Bachelor's Degree | $58,533 | $42,108 |
| Graduate Degree | $77,909 | $54,836 |
| Total | $51,181 | $33,753 |
Family Income in Wayne County
Family Income Brackets in Wayne County
According to the Wayne County family income data, there are 1,966 families falling into the $50,000 to $74,999 income range, which is the most common income bracket and makes up 19.6% of all families. Conversely, the $10,000 to $14,999 income bracket is the least frequent group with only 321 families (3.2%) belonging to this category.
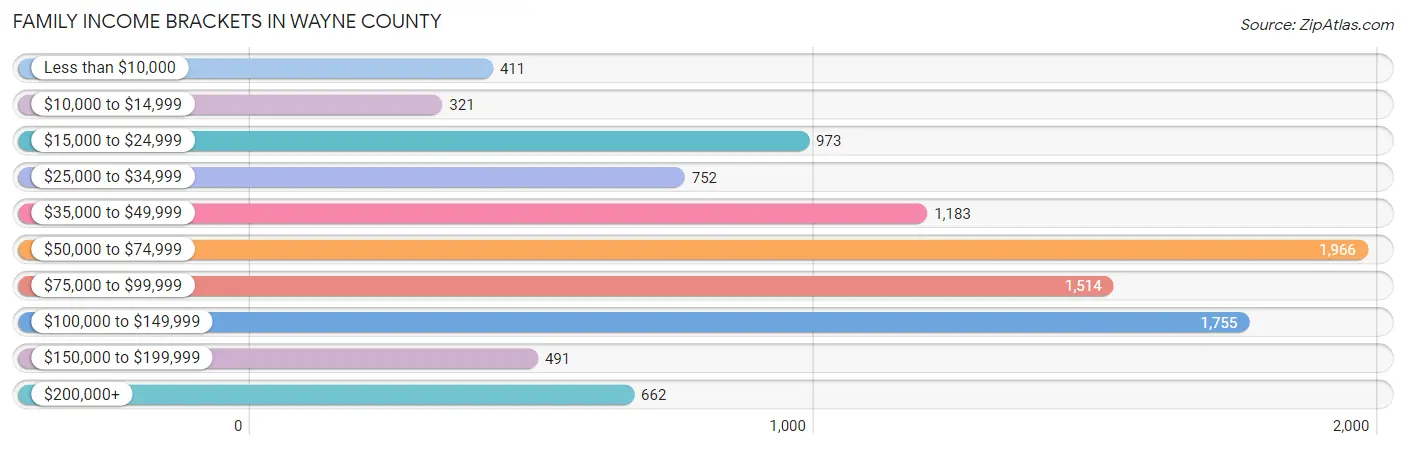
| Income Bracket | # Families | % Families |
| Less than $10,000 | 411 | 4.1% |
| $10,000 to $14,999 | 321 | 3.2% |
| $15,000 to $24,999 | 973 | 9.7% |
| $25,000 to $34,999 | 752 | 7.5% |
| $35,000 to $49,999 | 1,183 | 11.8% |
| $50,000 to $74,999 | 1,966 | 19.6% |
| $75,000 to $99,999 | 1,514 | 15.1% |
| $100,000 to $149,999 | 1,755 | 17.5% |
| $150,000 to $199,999 | 491 | 4.9% |
| $200,000+ | 662 | 6.6% |
Family Income by Famaliy Size in Wayne County
5-person families (908 | 9.0%) account for the highest median family income in Wayne County with $112,727 per family, while 2-person families (5,113 | 51.0%) have the highest median income of $29,011 per family member.
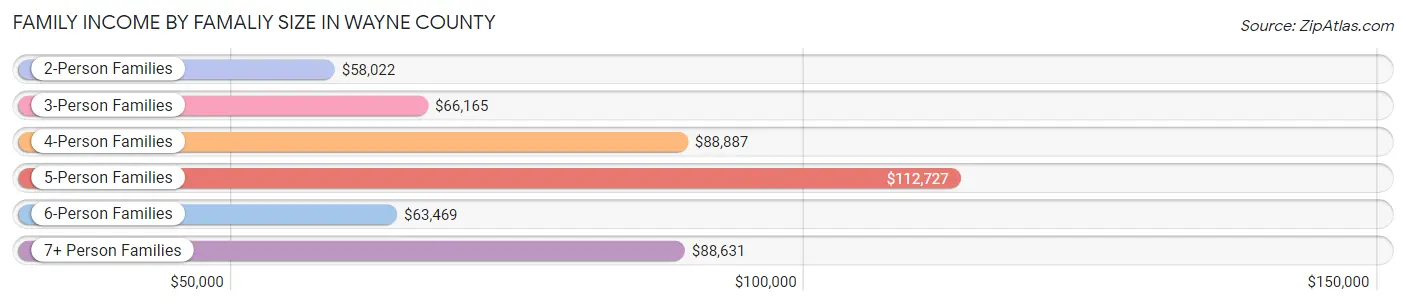
| Income Bracket | # Families | Median Income |
| 2-Person Families | 5,113 (51.0%) | $58,022 |
| 3-Person Families | 2,169 (21.6%) | $66,165 |
| 4-Person Families | 1,505 (15.0%) | $88,887 |
| 5-Person Families | 908 (9.0%) | $112,727 |
| 6-Person Families | 231 (2.3%) | $63,469 |
| 7+ Person Families | 103 (1.0%) | $88,631 |
| Total | 10,029 (100.0%) | $67,605 |
Family Income by Number of Earners in Wayne County
The median family income in Wayne County is $67,605, with families comprising 3+ earners (504) having the highest median family income of $183,258, while families with no earners (2,797) have the lowest median family income of $38,560, accounting for 5.0% and 27.9% of families, respectively.
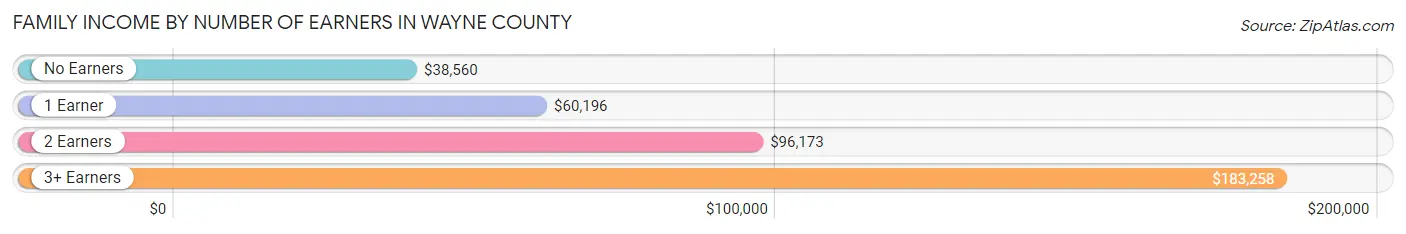
| Number of Earners | # Families | Median Income |
| No Earners | 2,797 (27.9%) | $38,560 |
| 1 Earner | 3,386 (33.8%) | $60,196 |
| 2 Earners | 3,342 (33.3%) | $96,173 |
| 3+ Earners | 504 (5.0%) | $183,258 |
| Total | 10,029 (100.0%) | $67,605 |
Household Income in Wayne County
Household Income Brackets in Wayne County
With 2,693 households falling in the category, the $50,000 to $74,999 income range is the most frequent in Wayne County, accounting for 18.0% of all households. In contrast, only 568 households (3.8%) fall into the $150,000 to $199,999 income bracket, making it the least populous group.
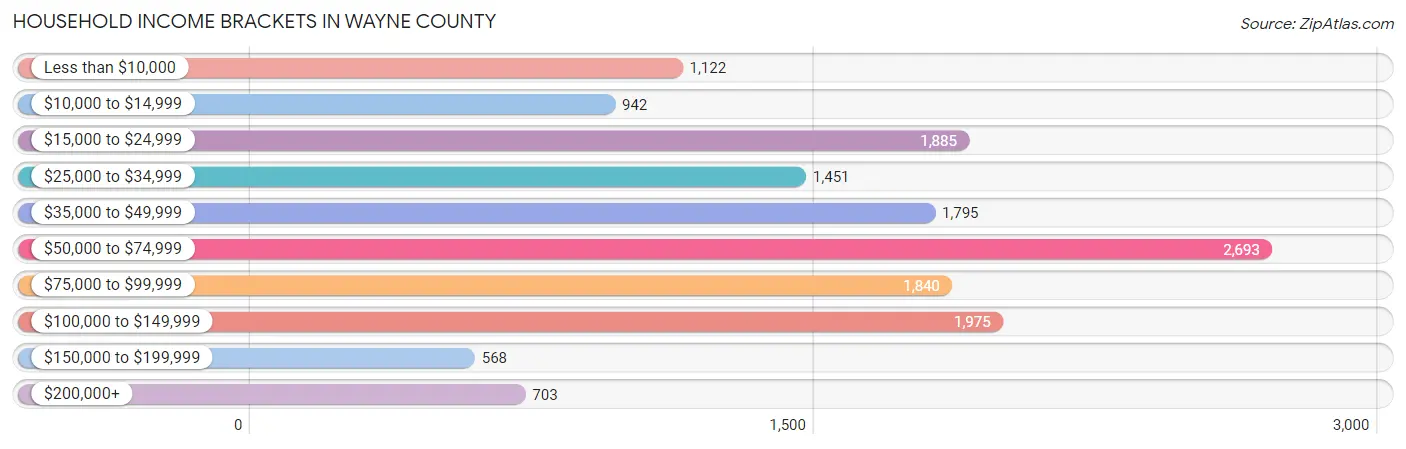
| Income Bracket | # Households | % Households |
| Less than $10,000 | 1,122 | 7.5% |
| $10,000 to $14,999 | 942 | 6.3% |
| $15,000 to $24,999 | 1,885 | 12.6% |
| $25,000 to $34,999 | 1,451 | 9.7% |
| $35,000 to $49,999 | 1,795 | 12.0% |
| $50,000 to $74,999 | 2,693 | 18.0% |
| $75,000 to $99,999 | 1,840 | 12.3% |
| $100,000 to $149,999 | 1,975 | 13.2% |
| $150,000 to $199,999 | 568 | 3.8% |
| $200,000+ | 703 | 4.7% |
Household Income by Householder Age in Wayne County
The median household income in Wayne County is $52,694, with the highest median household income of $66,823 found in the 25 to 44 years age bracket for the primary householder. A total of 3,887 households (26.0%) fall into this category. Meanwhile, the 15 to 24 years age bracket for the primary householder has the lowest median household income of $28,781, with 307 households (2.1%) in this group.
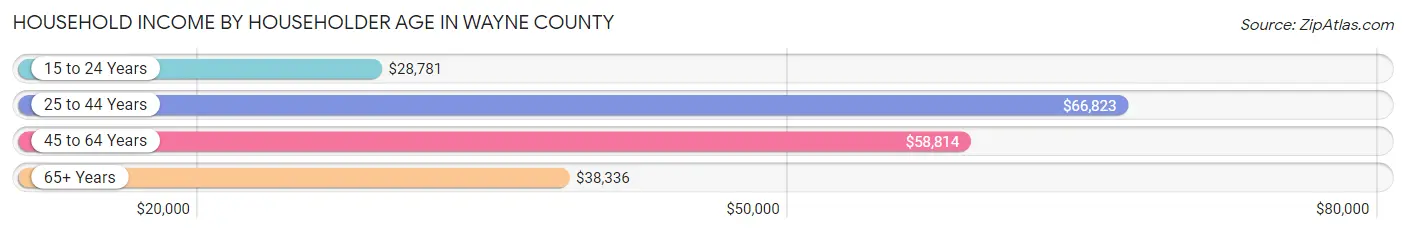
| Income Bracket | # Households | Median Income |
| 15 to 24 Years | 307 (2.1%) | $28,781 |
| 25 to 44 Years | 3,887 (26.0%) | $66,823 |
| 45 to 64 Years | 5,800 (38.8%) | $58,814 |
| 65+ Years | 4,965 (33.2%) | $38,336 |
| Total | 14,959 (100.0%) | $52,694 |
Poverty in Wayne County
Income Below Poverty by Sex and Age in Wayne County
With 14.5% poverty level for males and 18.9% for females among the residents of Wayne County, 15 year old males and 18 to 24 year old females are the most vulnerable to poverty, with 40 males (25.3%) and 427 females (28.9%) in their respective age groups living below the poverty level.
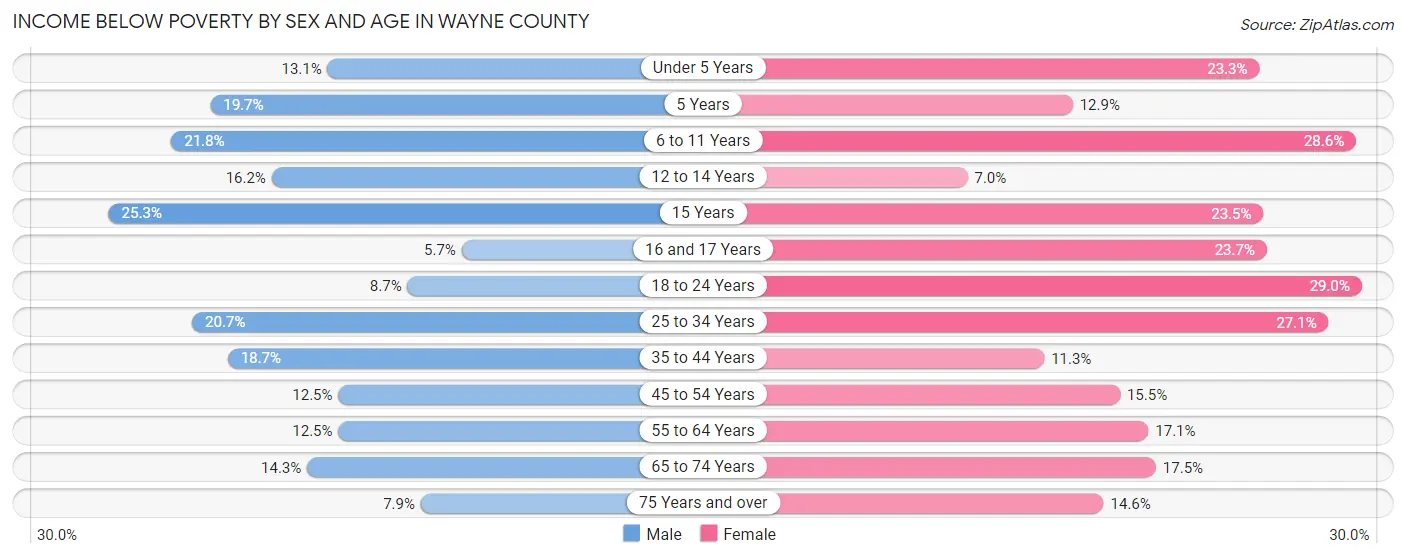
| Age Bracket | Male | Female |
| Under 5 Years | 123 (13.1%) | 226 (23.3%) |
| 5 Years | 23 (19.7%) | 18 (12.9%) |
| 6 to 11 Years | 312 (21.8%) | 388 (28.6%) |
| 12 to 14 Years | 114 (16.2%) | 50 (7.0%) |
| 15 Years | 40 (25.3%) | 46 (23.5%) |
| 16 and 17 Years | 37 (5.7%) | 119 (23.7%) |
| 18 to 24 Years | 130 (8.7%) | 427 (28.9%) |
| 25 to 34 Years | 455 (20.7%) | 578 (27.1%) |
| 35 to 44 Years | 404 (18.7%) | 259 (11.3%) |
| 45 to 54 Years | 336 (12.5%) | 401 (15.5%) |
| 55 to 64 Years | 338 (12.5%) | 491 (17.1%) |
| 65 to 74 Years | 324 (14.3%) | 451 (17.5%) |
| 75 Years and over | 120 (7.9%) | 280 (14.6%) |
| Total | 2,756 (14.5%) | 3,734 (18.9%) |
Income Above Poverty by Sex and Age in Wayne County
According to the poverty statistics in Wayne County, males aged 16 and 17 years and females aged 12 to 14 years are the age groups that are most secure financially, with 94.3% of males and 93.0% of females in these age groups living above the poverty line.
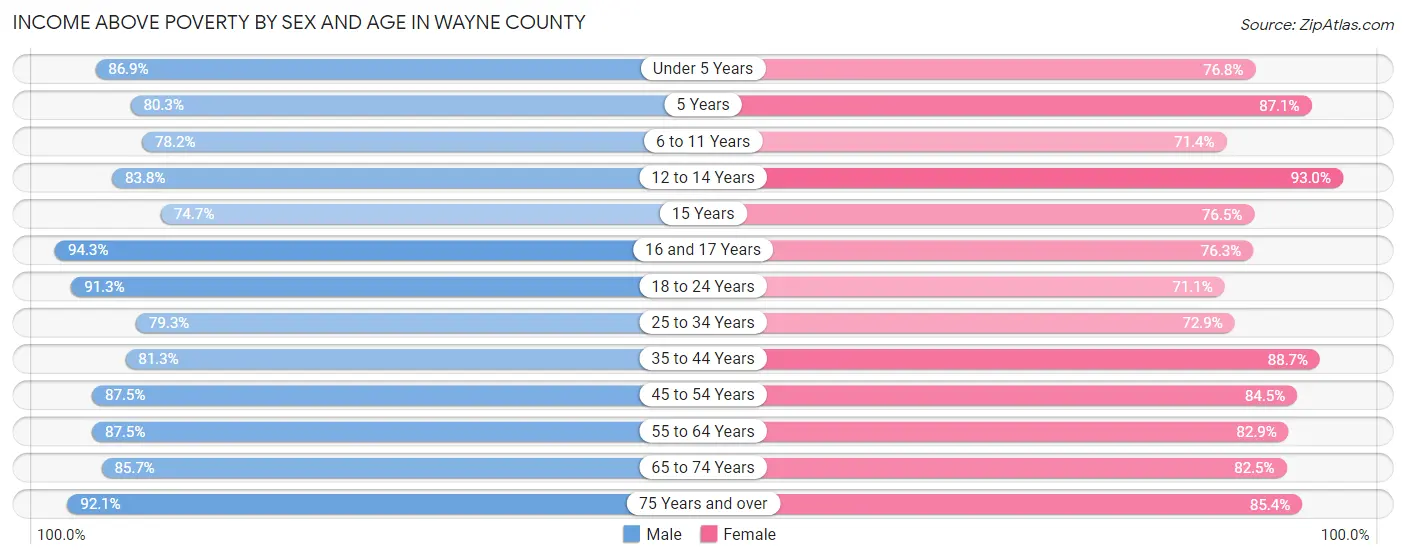
| Age Bracket | Male | Female |
| Under 5 Years | 814 (86.9%) | 746 (76.7%) |
| 5 Years | 94 (80.3%) | 122 (87.1%) |
| 6 to 11 Years | 1,117 (78.2%) | 967 (71.4%) |
| 12 to 14 Years | 588 (83.8%) | 664 (93.0%) |
| 15 Years | 118 (74.7%) | 150 (76.5%) |
| 16 and 17 Years | 617 (94.3%) | 384 (76.3%) |
| 18 to 24 Years | 1,368 (91.3%) | 1,048 (71.1%) |
| 25 to 34 Years | 1,746 (79.3%) | 1,555 (72.9%) |
| 35 to 44 Years | 1,758 (81.3%) | 2,040 (88.7%) |
| 45 to 54 Years | 2,346 (87.5%) | 2,188 (84.5%) |
| 55 to 64 Years | 2,360 (87.5%) | 2,386 (82.9%) |
| 65 to 74 Years | 1,946 (85.7%) | 2,128 (82.5%) |
| 75 Years and over | 1,391 (92.1%) | 1,640 (85.4%) |
| Total | 16,263 (85.5%) | 16,018 (81.1%) |
Income Below Poverty Among Married-Couple Families in Wayne County
The poverty statistics for married-couple families in Wayne County show that 10.2% or 800 of the total 7,843 families live below the poverty line. Families with 3 or 4 children have the highest poverty rate of 17.1%, comprising of 114 families. On the other hand, families with 5 or more children have the lowest poverty rate of 0.0%, which includes 0 families.
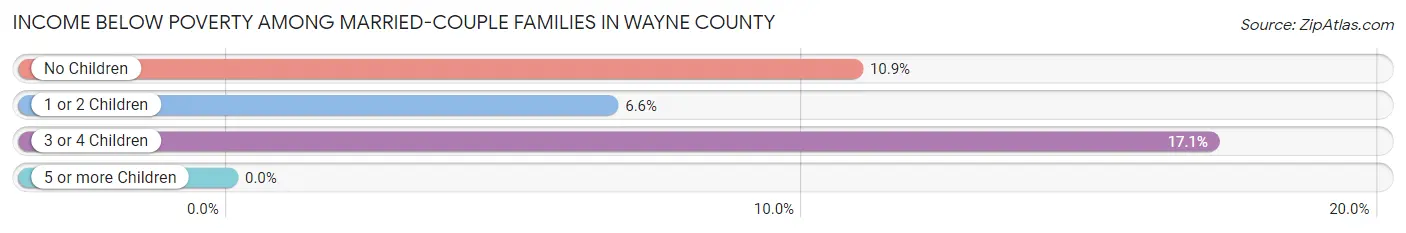
| Children | Above Poverty | Below Poverty |
| No Children | 4,447 (89.1%) | 543 (10.9%) |
| 1 or 2 Children | 2,018 (93.4%) | 143 (6.6%) |
| 3 or 4 Children | 553 (82.9%) | 114 (17.1%) |
| 5 or more Children | 25 (100.0%) | 0 (0.0%) |
| Total | 7,043 (89.8%) | 800 (10.2%) |
Income Below Poverty Among Single-Parent Households in Wayne County
According to the poverty data in Wayne County, 15.9% or 113 single-father households and 32.7% or 481 single-mother households are living below the poverty line. Among single-father households, those with 1 or 2 children have the highest poverty rate, with 89 households (21.1%) experiencing poverty. Likewise, among single-mother households, those with 3 or 4 children have the highest poverty rate, with 37 households (100.0%) falling below the poverty line.
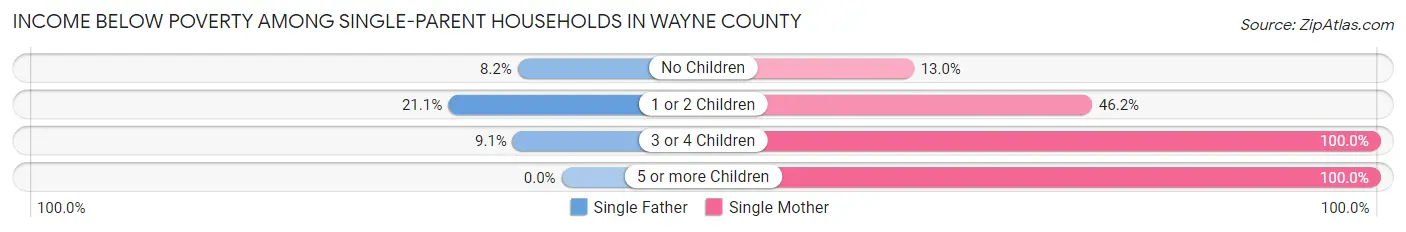
| Children | Single Father | Single Mother |
| No Children | 22 (8.2%) | 93 (13.0%) |
| 1 or 2 Children | 89 (21.1%) | 320 (46.2%) |
| 3 or 4 Children | 2 (9.1%) | 37 (100.0%) |
| 5 or more Children | 0 (0.0%) | 31 (100.0%) |
| Total | 113 (15.9%) | 481 (32.7%) |
Income Below Poverty Among Married-Couple vs Single-Parent Households in Wayne County
The poverty data for Wayne County shows that 800 of the married-couple family households (10.2%) and 594 of the single-parent households (27.2%) are living below the poverty level. Within the married-couple family households, those with 3 or 4 children have the highest poverty rate, with 114 households (17.1%) falling below the poverty line. Among the single-parent households, those with 5 or more children have the highest poverty rate, with 31 household (100.0%) living below poverty.
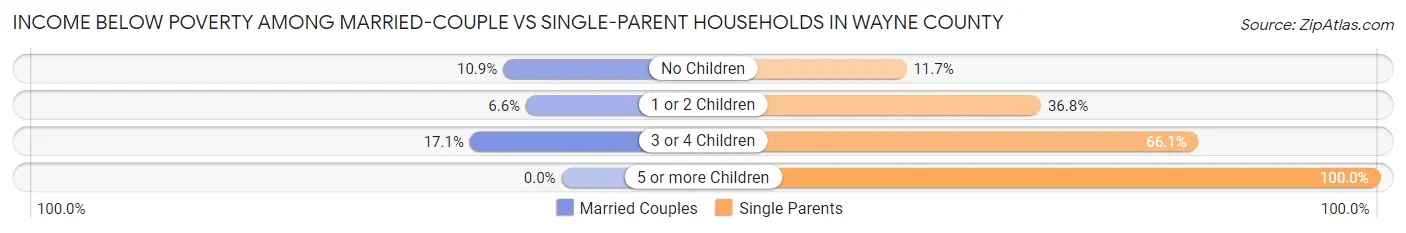
| Children | Married-Couple Families | Single-Parent Households |
| No Children | 543 (10.9%) | 115 (11.7%) |
| 1 or 2 Children | 143 (6.6%) | 409 (36.7%) |
| 3 or 4 Children | 114 (17.1%) | 39 (66.1%) |
| 5 or more Children | 0 (0.0%) | 31 (100.0%) |
| Total | 800 (10.2%) | 594 (27.2%) |
Employment Characteristics in Wayne County
Employment by Class of Employer in Wayne County
Among the 13,872 employed individuals in Wayne County, private company employees (8,540 | 61.6%), not-for-profit organizations (1,589 | 11.5%), and state government employees (1,150 | 8.3%) make up the most common classes of employment.
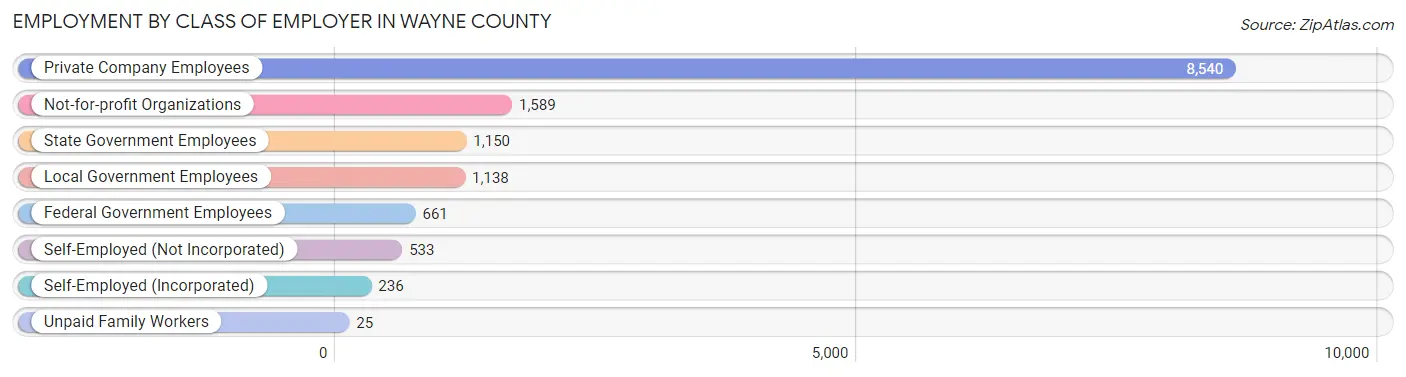
| Employer Class | # Employees | % Employees |
| Private Company Employees | 8,540 | 61.6% |
| Self-Employed (Incorporated) | 236 | 1.7% |
| Self-Employed (Not Incorporated) | 533 | 3.8% |
| Not-for-profit Organizations | 1,589 | 11.5% |
| Local Government Employees | 1,138 | 8.2% |
| State Government Employees | 1,150 | 8.3% |
| Federal Government Employees | 661 | 4.8% |
| Unpaid Family Workers | 25 | 0.2% |
| Total | 13,872 | 100.0% |
Employment Status by Age in Wayne County
According to the labor force statistics for Wayne County, out of the total population over 16 years of age (32,139), 46.7% or 15,009 individuals are in the labor force, with 5.0% or 750 of them unemployed. The age group with the highest labor force participation rate is 35 to 44 years, with 73.2% or 3,265 individuals in the labor force. Within the labor force, the 16 to 19 years age range has the highest percentage of unemployed individuals, with 26.0% or 119 of them being unemployed.
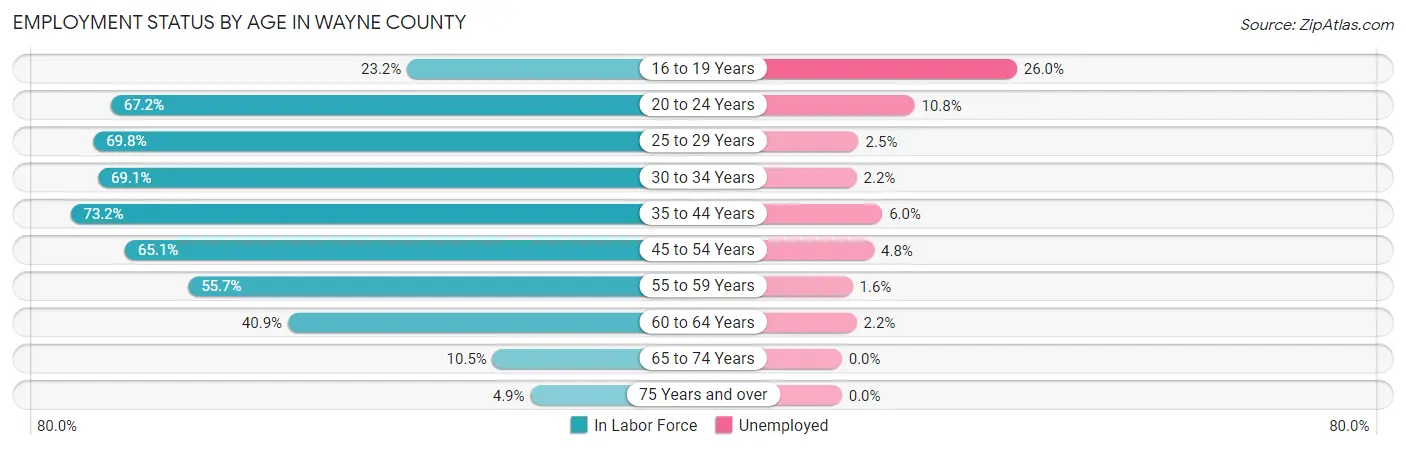
| Age Bracket | In Labor Force | Unemployed |
| 16 to 19 Years | 456 (23.2%) | 119 (26.0%) |
| 20 to 24 Years | 1,456 (67.2%) | 157 (10.8%) |
| 25 to 29 Years | 1,575 (69.8%) | 39 (2.5%) |
| 30 to 34 Years | 1,436 (69.1%) | 32 (2.2%) |
| 35 to 44 Years | 3,265 (73.2%) | 196 (6.0%) |
| 45 to 54 Years | 3,431 (65.1%) | 165 (4.8%) |
| 55 to 59 Years | 1,600 (55.7%) | 26 (1.6%) |
| 60 to 64 Years | 1,111 (40.9%) | 24 (2.2%) |
| 65 to 74 Years | 510 (10.5%) | 0 (0.0%) |
| 75 Years and over | 171 (4.9%) | 0 (0.0%) |
| Total | 15,009 (46.7%) | 750 (5.0%) |
Employment Status by Educational Attainment in Wayne County
According to labor force statistics for Wayne County, 63.2% of individuals (12,421) out of the total population between 25 and 64 years of age (19,654) are in the labor force, with 3.9% or 484 of them being unemployed. The group with the highest labor force participation rate are those with the educational attainment of bachelor's degree or higher, with 86.6% or 3,385 individuals in the labor force. Within the labor force, individuals with high school diploma education have the highest percentage of unemployment, with 9.1% or 352 of them being unemployed.
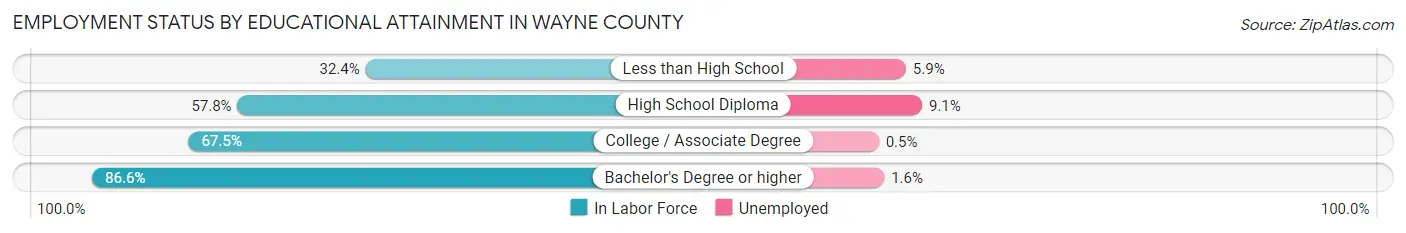
| Educational Attainment | In Labor Force | Unemployed |
| Less than High School | 876 (32.4%) | 160 (5.9%) |
| High School Diploma | 3,863 (57.8%) | 608 (9.1%) |
| College / Associate Degree | 4,292 (67.5%) | 32 (0.5%) |
| Bachelor's Degree or higher | 3,385 (86.6%) | 63 (1.6%) |
| Total | 12,421 (63.2%) | 767 (3.9%) |
Employment Occupations by Sex in Wayne County
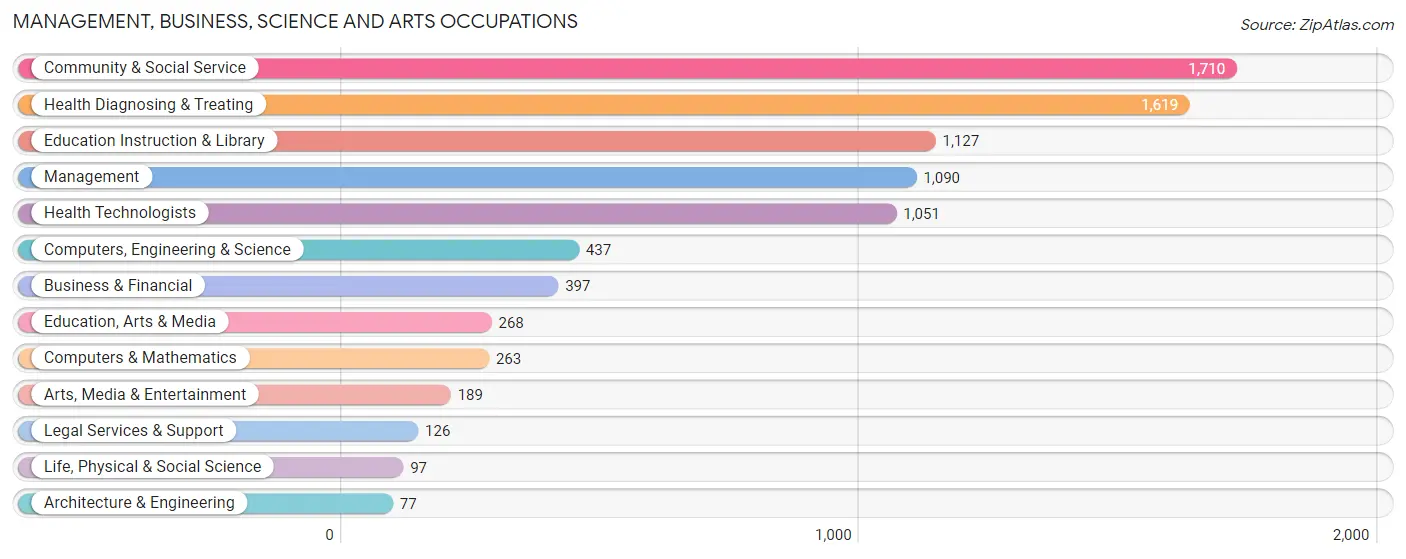
Management, Business, Science and Arts Occupations
The most common Management, Business, Science and Arts occupations in Wayne County are Community & Social Service (1,710 | 12.0%), Health Diagnosing & Treating (1,619 | 11.4%), Education Instruction & Library (1,127 | 7.9%), Management (1,090 | 7.6%), and Health Technologists (1,051 | 7.4%).
Management, Business, Science and Arts Occupations by Sex
Within the Management, Business, Science and Arts occupations in Wayne County, the most male-oriented occupations are Architecture & Engineering (93.5%), Computers, Engineering & Science (84.4%), and Computers & Mathematics (83.3%), while the most female-oriented occupations are Education, Arts & Media (82.5%), Health Diagnosing & Treating (76.8%), and Health Technologists (75.8%).
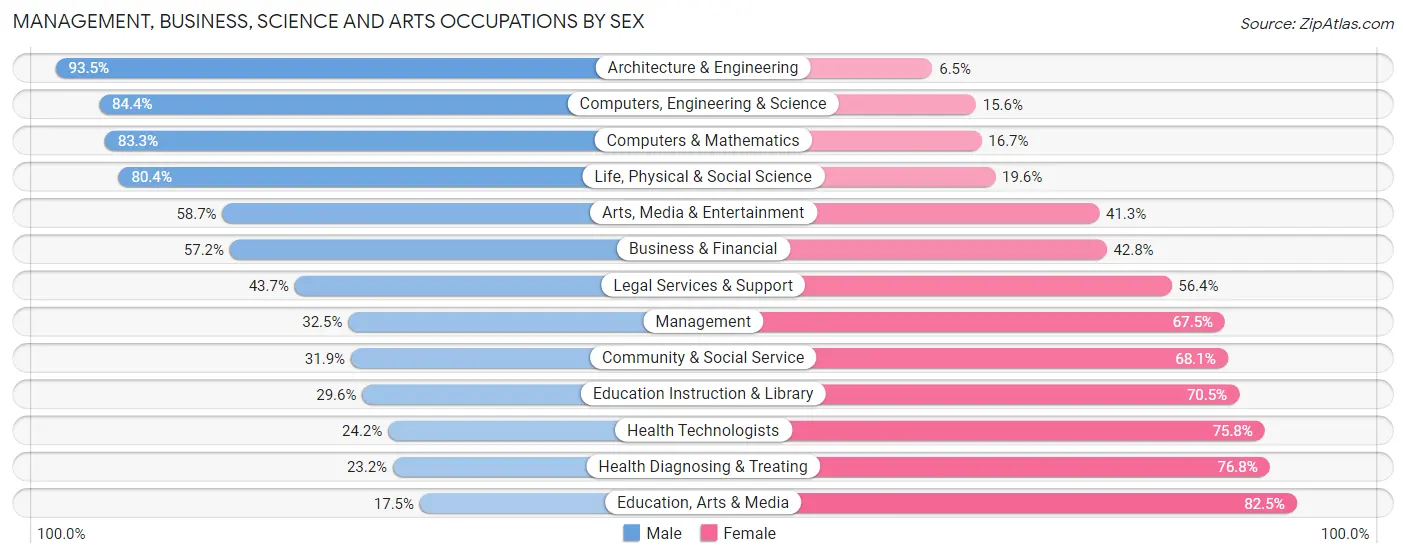
| Occupation | Male | Female |
| Management | 354 (32.5%) | 736 (67.5%) |
| Business & Financial | 227 (57.2%) | 170 (42.8%) |
| Computers, Engineering & Science | 369 (84.4%) | 68 (15.6%) |
| Computers & Mathematics | 219 (83.3%) | 44 (16.7%) |
| Architecture & Engineering | 72 (93.5%) | 5 (6.5%) |
| Life, Physical & Social Science | 78 (80.4%) | 19 (19.6%) |
| Community & Social Service | 546 (31.9%) | 1,164 (68.1%) |
| Education, Arts & Media | 47 (17.5%) | 221 (82.5%) |
| Legal Services & Support | 55 (43.6%) | 71 (56.4%) |
| Education Instruction & Library | 333 (29.5%) | 794 (70.5%) |
| Arts, Media & Entertainment | 111 (58.7%) | 78 (41.3%) |
| Health Diagnosing & Treating | 375 (23.2%) | 1,244 (76.8%) |
| Health Technologists | 254 (24.2%) | 797 (75.8%) |
| Total (Category) | 1,871 (35.6%) | 3,382 (64.4%) |
| Total (Overall) | 7,181 (50.4%) | 7,059 (49.6%) |
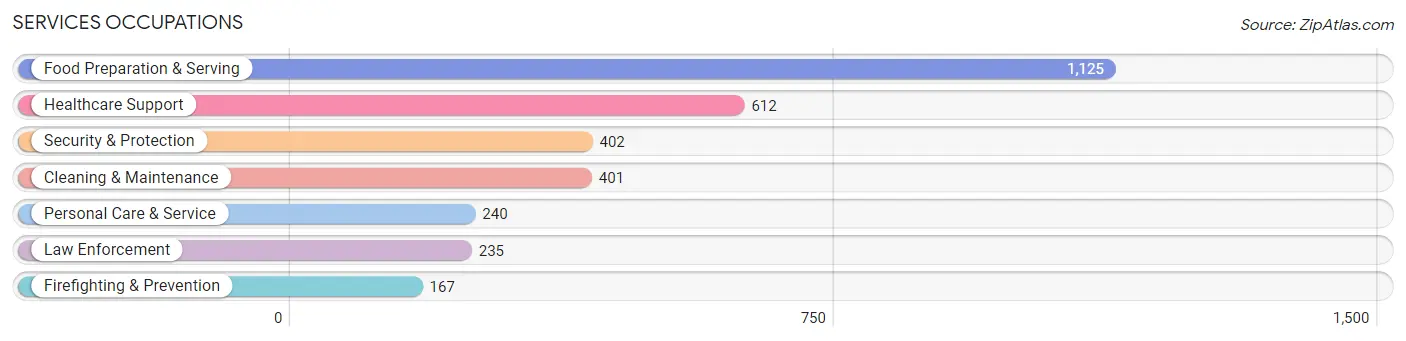
Services Occupations
The most common Services occupations in Wayne County are Food Preparation & Serving (1,125 | 7.9%), Healthcare Support (612 | 4.3%), Security & Protection (402 | 2.8%), Cleaning & Maintenance (401 | 2.8%), and Personal Care & Service (240 | 1.7%).
Services Occupations by Sex
Within the Services occupations in Wayne County, the most male-oriented occupations are Firefighting & Prevention (74.3%), Security & Protection (74.1%), and Law Enforcement (74.0%), while the most female-oriented occupations are Healthcare Support (82.0%), Food Preparation & Serving (53.5%), and Personal Care & Service (48.7%).
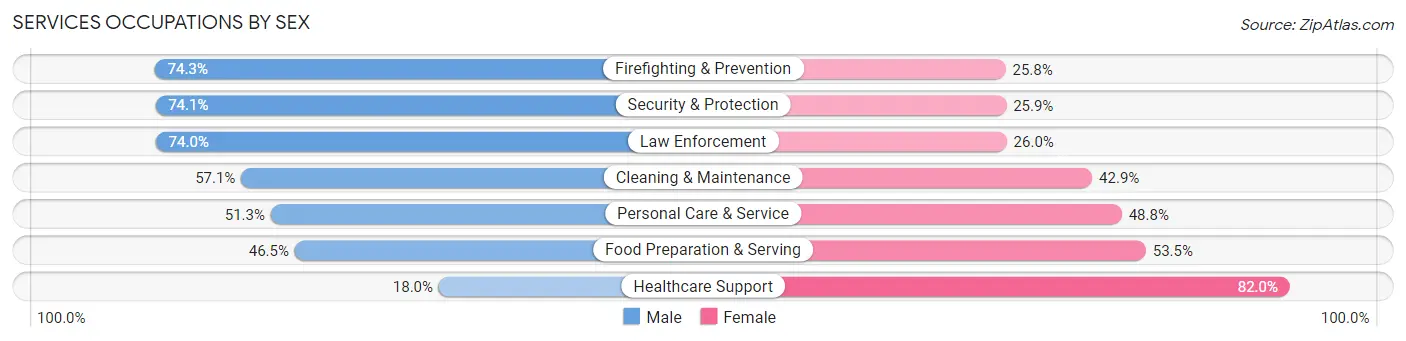
| Occupation | Male | Female |
| Healthcare Support | 110 (18.0%) | 502 (82.0%) |
| Security & Protection | 298 (74.1%) | 104 (25.9%) |
| Firefighting & Prevention | 124 (74.3%) | 43 (25.8%) |
| Law Enforcement | 174 (74.0%) | 61 (26.0%) |
| Food Preparation & Serving | 523 (46.5%) | 602 (53.5%) |
| Cleaning & Maintenance | 229 (57.1%) | 172 (42.9%) |
| Personal Care & Service | 123 (51.2%) | 117 (48.7%) |
| Total (Category) | 1,283 (46.2%) | 1,497 (53.8%) |
| Total (Overall) | 7,181 (50.4%) | 7,059 (49.6%) |
Sales and Office Occupations
The most common Sales and Office occupations in Wayne County are Sales & Related (1,570 | 11.0%), and Office & Administration (1,306 | 9.2%).

Sales and Office Occupations by Sex
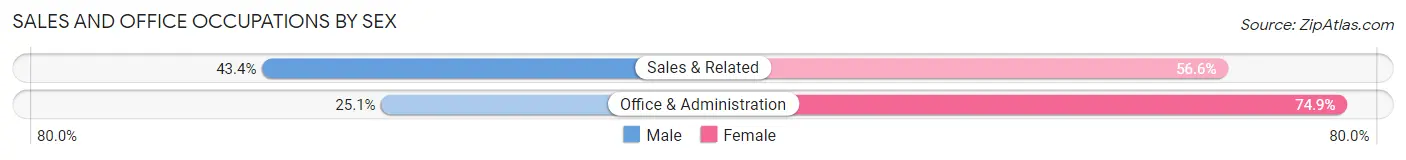
| Occupation | Male | Female |
| Sales & Related | 682 (43.4%) | 888 (56.6%) |
| Office & Administration | 328 (25.1%) | 978 (74.9%) |
| Total (Category) | 1,010 (35.1%) | 1,866 (64.9%) |
| Total (Overall) | 7,181 (50.4%) | 7,059 (49.6%) |
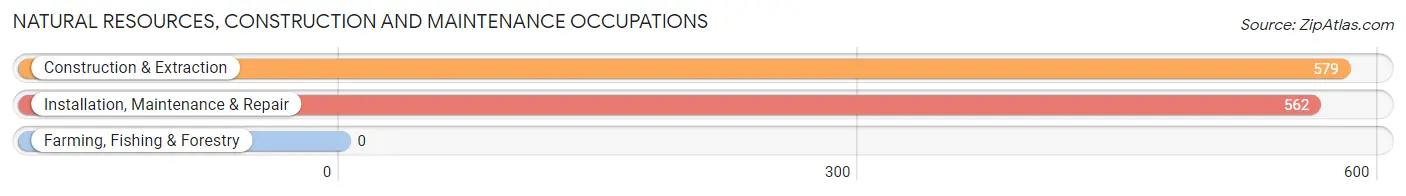
Natural Resources, Construction and Maintenance Occupations
The most common Natural Resources, Construction and Maintenance occupations in Wayne County are Construction & Extraction (579 | 4.1%), and Installation, Maintenance & Repair (562 | 4.0%).
Natural Resources, Construction and Maintenance Occupations by Sex
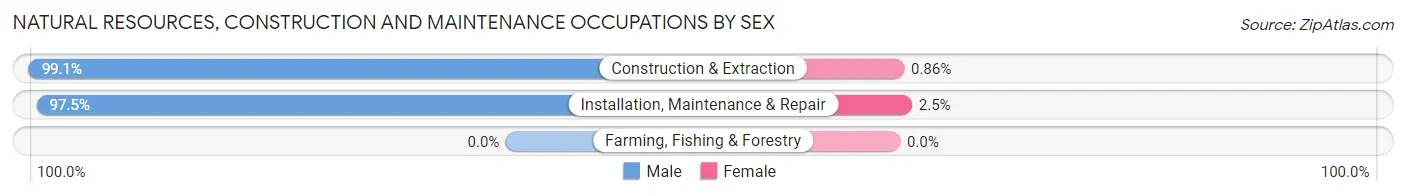
| Occupation | Male | Female |
| Farming, Fishing & Forestry | 0 (0.0%) | 0 (0.0%) |
| Construction & Extraction | 574 (99.1%) | 5 (0.9%) |
| Installation, Maintenance & Repair | 548 (97.5%) | 14 (2.5%) |
| Total (Category) | 1,122 (98.3%) | 19 (1.7%) |
| Total (Overall) | 7,181 (50.4%) | 7,059 (49.6%) |
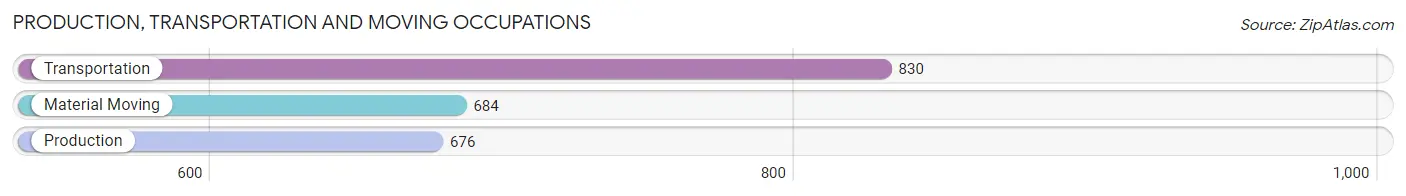
Production, Transportation and Moving Occupations
The most common Production, Transportation and Moving occupations in Wayne County are Transportation (830 | 5.8%), Material Moving (684 | 4.8%), and Production (676 | 4.8%).
Production, Transportation and Moving Occupations by Sex
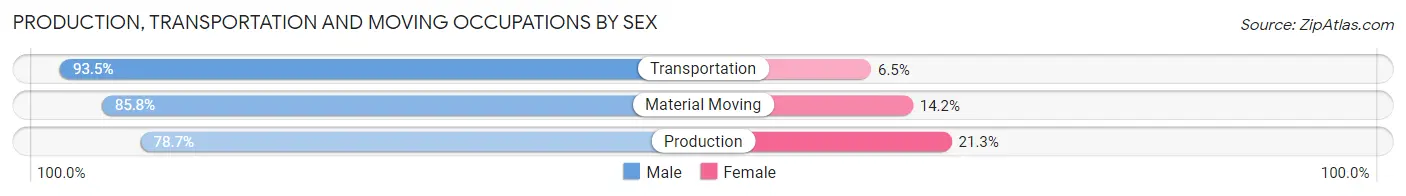
| Occupation | Male | Female |
| Production | 532 (78.7%) | 144 (21.3%) |
| Transportation | 776 (93.5%) | 54 (6.5%) |
| Material Moving | 587 (85.8%) | 97 (14.2%) |
| Total (Category) | 1,895 (86.5%) | 295 (13.5%) |
| Total (Overall) | 7,181 (50.4%) | 7,059 (49.6%) |
Employment Industries by Sex in Wayne County
Employment Industries in Wayne County
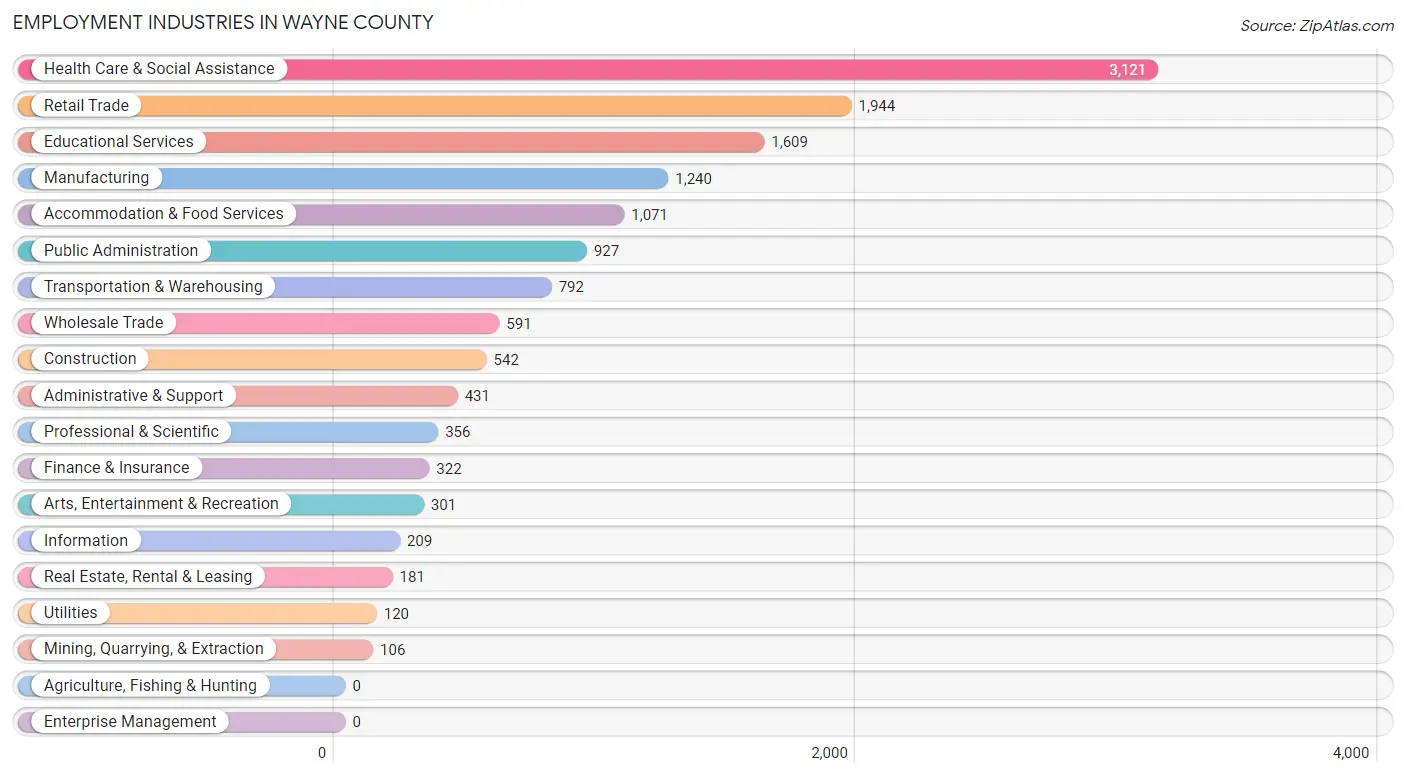
The major employment industries in Wayne County include Health Care & Social Assistance (3,121 | 21.9%), Retail Trade (1,944 | 13.7%), Educational Services (1,609 | 11.3%), Manufacturing (1,240 | 8.7%), and Accommodation & Food Services (1,071 | 7.5%).
Employment Industries by Sex in Wayne County
The Wayne County industries that see more men than women are Mining, Quarrying, & Extraction (100.0%), Transportation & Warehousing (93.9%), and Construction (90.4%), whereas the industries that tend to have a higher number of women are Health Care & Social Assistance (82.2%), Finance & Insurance (69.9%), and Educational Services (65.4%).
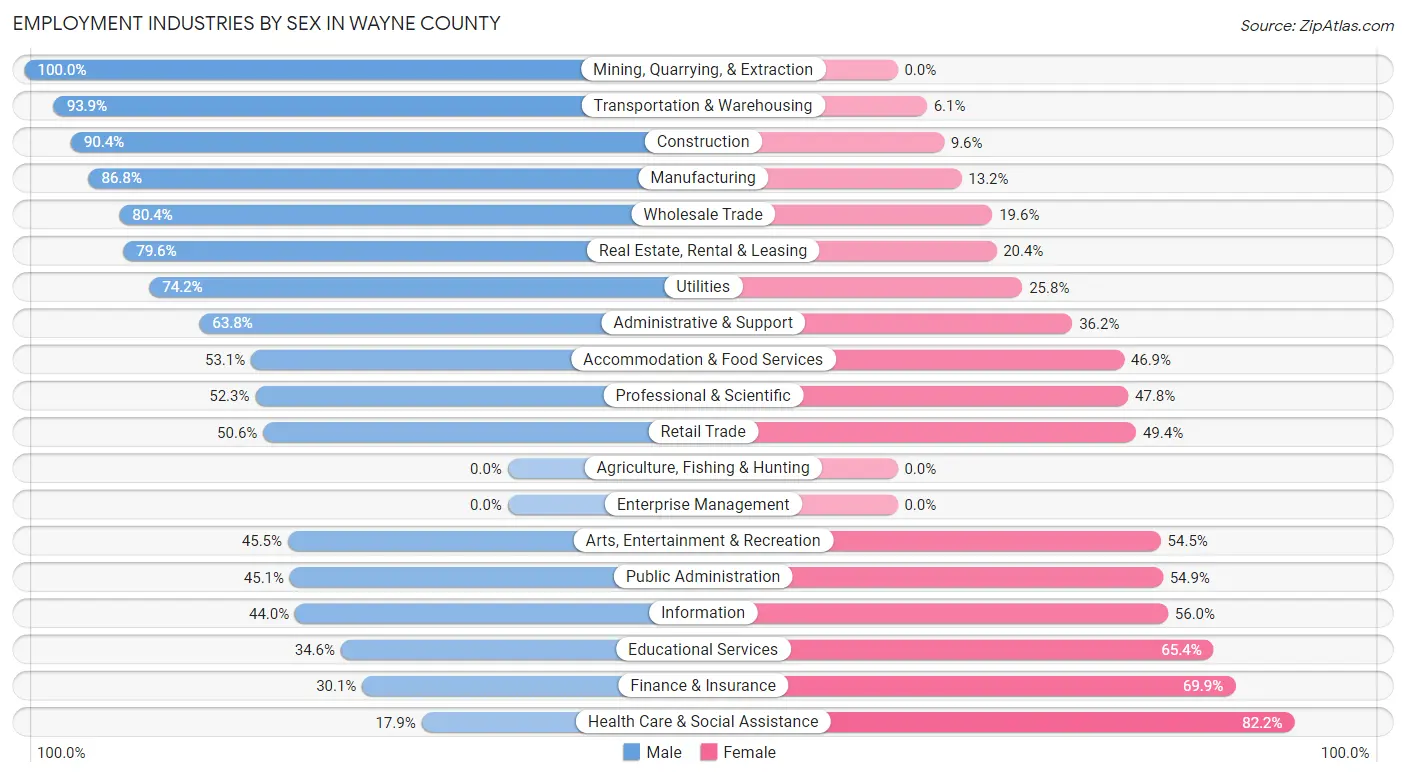
| Industry | Male | Female |
| Agriculture, Fishing & Hunting | 0 (0.0%) | 0 (0.0%) |
| Mining, Quarrying, & Extraction | 106 (100.0%) | 0 (0.0%) |
| Construction | 490 (90.4%) | 52 (9.6%) |
| Manufacturing | 1,076 (86.8%) | 164 (13.2%) |
| Wholesale Trade | 475 (80.4%) | 116 (19.6%) |
| Retail Trade | 984 (50.6%) | 960 (49.4%) |
| Transportation & Warehousing | 744 (93.9%) | 48 (6.1%) |
| Utilities | 89 (74.2%) | 31 (25.8%) |
| Information | 92 (44.0%) | 117 (56.0%) |
| Finance & Insurance | 97 (30.1%) | 225 (69.9%) |
| Real Estate, Rental & Leasing | 144 (79.6%) | 37 (20.4%) |
| Professional & Scientific | 186 (52.2%) | 170 (47.7%) |
| Enterprise Management | 0 (0.0%) | 0 (0.0%) |
| Administrative & Support | 275 (63.8%) | 156 (36.2%) |
| Educational Services | 556 (34.6%) | 1,053 (65.4%) |
| Health Care & Social Assistance | 557 (17.8%) | 2,564 (82.2%) |
| Arts, Entertainment & Recreation | 137 (45.5%) | 164 (54.5%) |
| Accommodation & Food Services | 569 (53.1%) | 502 (46.9%) |
| Public Administration | 418 (45.1%) | 509 (54.9%) |
| Total | 7,181 (50.4%) | 7,059 (49.6%) |
Education in Wayne County
School Enrollment in Wayne County
The most common levels of schooling among the 7,573 students in Wayne County are high school (1,981 | 26.2%), elementary school (1,886 | 24.9%), and middle school (1,634 | 21.6%).
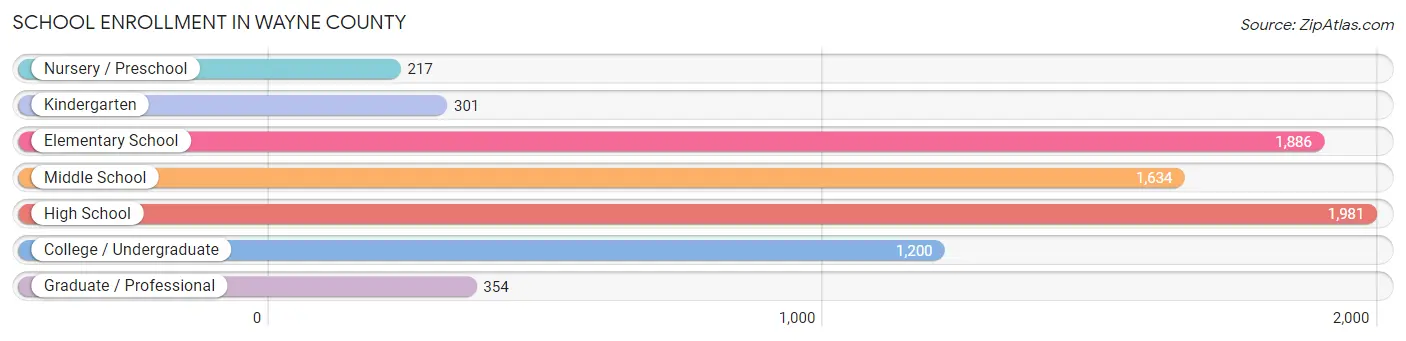
| School Level | # Students | % Students |
| Nursery / Preschool | 217 | 2.9% |
| Kindergarten | 301 | 4.0% |
| Elementary School | 1,886 | 24.9% |
| Middle School | 1,634 | 21.6% |
| High School | 1,981 | 26.2% |
| College / Undergraduate | 1,200 | 15.9% |
| Graduate / Professional | 354 | 4.7% |
| Total | 7,573 | 100.0% |
School Enrollment by Age by Funding Source in Wayne County
Out of a total of 7,573 students who are enrolled in schools in Wayne County, 833 (11.0%) attend a private institution, while the remaining 6,740 (89.0%) are enrolled in public schools. The age group of 3 to 4 year olds has the highest likelihood of being enrolled in private schools, with 30 (25.9% in the age bracket) enrolled. Conversely, the age group of 35 years and over has the lowest likelihood of being enrolled in a private school, with 273 (100.0% in the age bracket) attending a public institution.
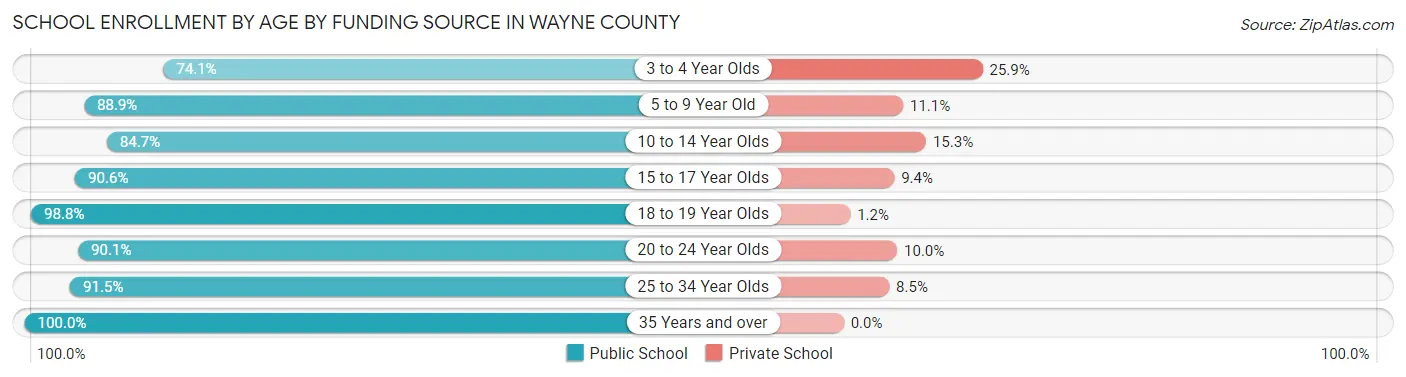
| Age Bracket | Public School | Private School |
| 3 to 4 Year Olds | 86 (74.1%) | 30 (25.9%) |
| 5 to 9 Year Old | 1,680 (88.9%) | 209 (11.1%) |
| 10 to 14 Year Olds | 1,895 (84.7%) | 343 (15.3%) |
| 15 to 17 Year Olds | 1,223 (90.6%) | 127 (9.4%) |
| 18 to 19 Year Olds | 484 (98.8%) | 6 (1.2%) |
| 20 to 24 Year Olds | 724 (90.0%) | 80 (10.0%) |
| 25 to 34 Year Olds | 378 (91.5%) | 35 (8.5%) |
| 35 Years and over | 273 (100.0%) | 0 (0.0%) |
| Total | 6,740 (89.0%) | 833 (11.0%) |
Educational Attainment by Field of Study in Wayne County
Education (1,609 | 29.6%), science & technology (1,083 | 19.9%), business (765 | 14.1%), arts & humanities (374 | 6.9%), and bio, nature & agricultural (274 | 5.0%) are the most common fields of study among 5,441 individuals in Wayne County who have obtained a bachelor's degree or higher.
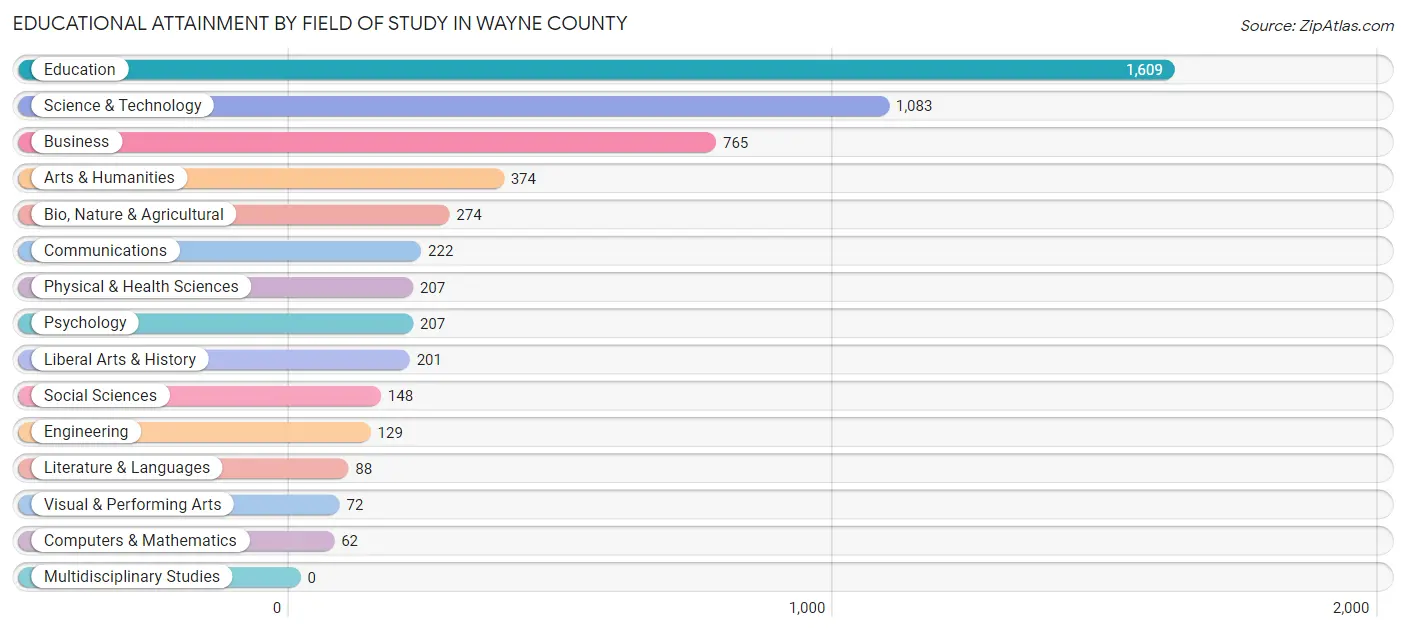
| Field of Study | # Graduates | % Graduates |
| Computers & Mathematics | 62 | 1.1% |
| Bio, Nature & Agricultural | 274 | 5.0% |
| Physical & Health Sciences | 207 | 3.8% |
| Psychology | 207 | 3.8% |
| Social Sciences | 148 | 2.7% |
| Engineering | 129 | 2.4% |
| Multidisciplinary Studies | 0 | 0.0% |
| Science & Technology | 1,083 | 19.9% |
| Business | 765 | 14.1% |
| Education | 1,609 | 29.6% |
| Literature & Languages | 88 | 1.6% |
| Liberal Arts & History | 201 | 3.7% |
| Visual & Performing Arts | 72 | 1.3% |
| Communications | 222 | 4.1% |
| Arts & Humanities | 374 | 6.9% |
| Total | 5,441 | 100.0% |
Transportation & Commute in Wayne County
Vehicle Availability by Sex in Wayne County
The most prevalent vehicle ownership categories in Wayne County are males with 2 vehicles (2,490, accounting for 35.5%) and females with 2 vehicles (2,567, making up 36.5%).
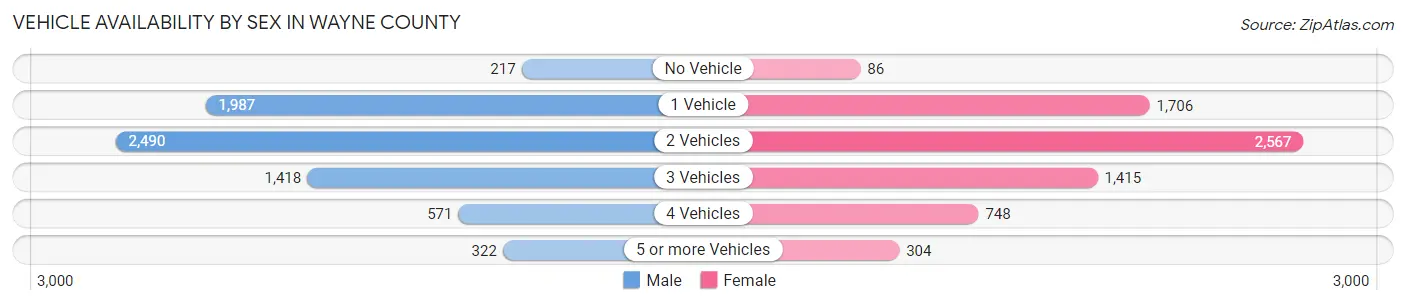
| Vehicles Available | Male | Female |
| No Vehicle | 217 (3.1%) | 86 (1.3%) |
| 1 Vehicle | 1,987 (28.4%) | 1,706 (25.0%) |
| 2 Vehicles | 2,490 (35.5%) | 2,567 (37.6%) |
| 3 Vehicles | 1,418 (20.2%) | 1,415 (20.7%) |
| 4 Vehicles | 571 (8.2%) | 748 (11.0%) |
| 5 or more Vehicles | 322 (4.6%) | 304 (4.4%) |
| Total | 7,005 (100.0%) | 6,826 (100.0%) |
Commute Time in Wayne County
The most frequently occuring commute durations in Wayne County are 20 to 24 minutes (2,389 commuters, 18.0%), 15 to 19 minutes (2,248 commuters, 16.9%), and 30 to 34 minutes (1,467 commuters, 11.1%).
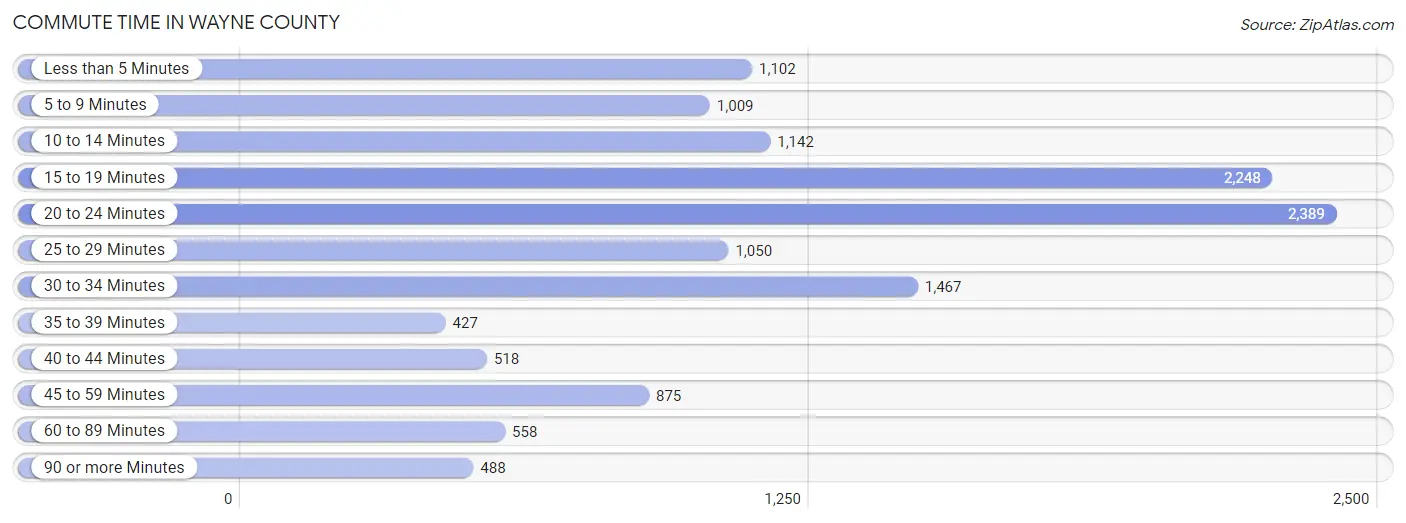
| Commute Time | # Commuters | % Commuters |
| Less than 5 Minutes | 1,102 | 8.3% |
| 5 to 9 Minutes | 1,009 | 7.6% |
| 10 to 14 Minutes | 1,142 | 8.6% |
| 15 to 19 Minutes | 2,248 | 16.9% |
| 20 to 24 Minutes | 2,389 | 18.0% |
| 25 to 29 Minutes | 1,050 | 7.9% |
| 30 to 34 Minutes | 1,467 | 11.1% |
| 35 to 39 Minutes | 427 | 3.2% |
| 40 to 44 Minutes | 518 | 3.9% |
| 45 to 59 Minutes | 875 | 6.6% |
| 60 to 89 Minutes | 558 | 4.2% |
| 90 or more Minutes | 488 | 3.7% |
Commute Time by Sex in Wayne County
The most common commute times in Wayne County are 20 to 24 minutes (1,117 commuters, 16.5%) for males and 20 to 24 minutes (1,272 commuters, 19.6%) for females.
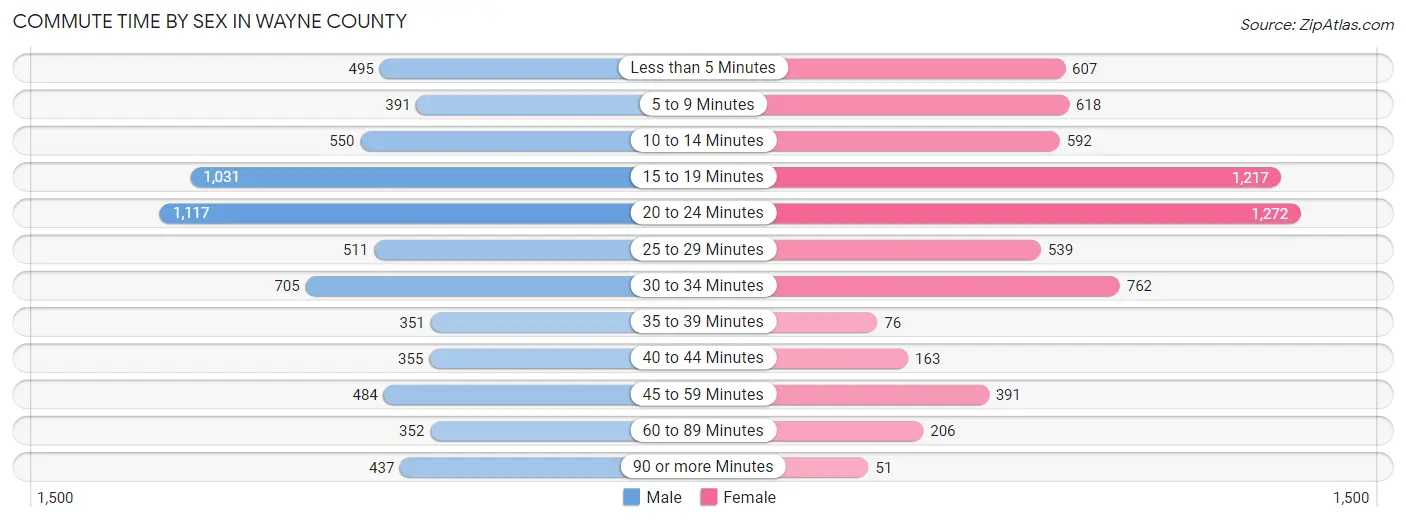
| Commute Time | Male | Female |
| Less than 5 Minutes | 495 (7.3%) | 607 (9.3%) |
| 5 to 9 Minutes | 391 (5.8%) | 618 (9.5%) |
| 10 to 14 Minutes | 550 (8.1%) | 592 (9.1%) |
| 15 to 19 Minutes | 1,031 (15.2%) | 1,217 (18.7%) |
| 20 to 24 Minutes | 1,117 (16.5%) | 1,272 (19.6%) |
| 25 to 29 Minutes | 511 (7.5%) | 539 (8.3%) |
| 30 to 34 Minutes | 705 (10.4%) | 762 (11.7%) |
| 35 to 39 Minutes | 351 (5.2%) | 76 (1.2%) |
| 40 to 44 Minutes | 355 (5.2%) | 163 (2.5%) |
| 45 to 59 Minutes | 484 (7.1%) | 391 (6.0%) |
| 60 to 89 Minutes | 352 (5.2%) | 206 (3.2%) |
| 90 or more Minutes | 437 (6.5%) | 51 (0.8%) |
Time of Departure to Work by Sex in Wayne County
The most frequent times of departure to work in Wayne County are 7:00 AM to 7:29 AM (1,091, 16.1%) for males and 7:30 AM to 7:59 AM (1,126, 17.3%) for females.
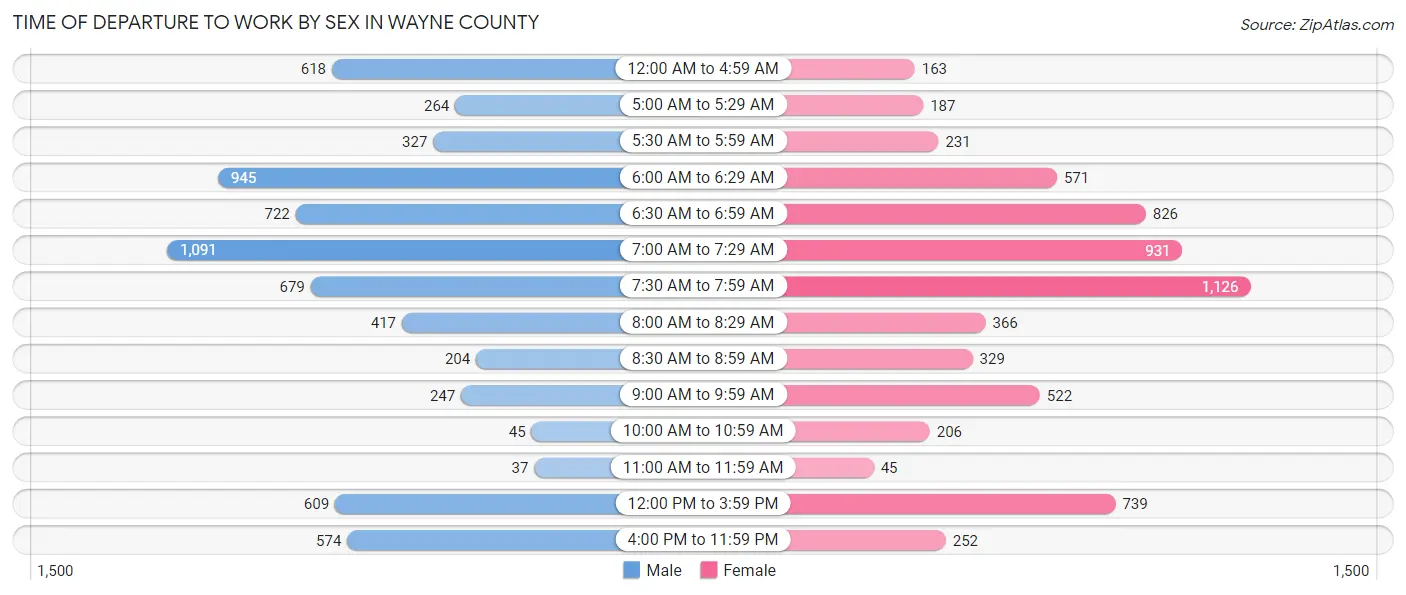
| Time of Departure | Male | Female |
| 12:00 AM to 4:59 AM | 618 (9.1%) | 163 (2.5%) |
| 5:00 AM to 5:29 AM | 264 (3.9%) | 187 (2.9%) |
| 5:30 AM to 5:59 AM | 327 (4.8%) | 231 (3.6%) |
| 6:00 AM to 6:29 AM | 945 (13.9%) | 571 (8.8%) |
| 6:30 AM to 6:59 AM | 722 (10.6%) | 826 (12.7%) |
| 7:00 AM to 7:29 AM | 1,091 (16.1%) | 931 (14.3%) |
| 7:30 AM to 7:59 AM | 679 (10.0%) | 1,126 (17.3%) |
| 8:00 AM to 8:29 AM | 417 (6.1%) | 366 (5.6%) |
| 8:30 AM to 8:59 AM | 204 (3.0%) | 329 (5.1%) |
| 9:00 AM to 9:59 AM | 247 (3.6%) | 522 (8.0%) |
| 10:00 AM to 10:59 AM | 45 (0.7%) | 206 (3.2%) |
| 11:00 AM to 11:59 AM | 37 (0.5%) | 45 (0.7%) |
| 12:00 PM to 3:59 PM | 609 (9.0%) | 739 (11.4%) |
| 4:00 PM to 11:59 PM | 574 (8.5%) | 252 (3.9%) |
| Total | 6,779 (100.0%) | 6,494 (100.0%) |
Housing Occupancy in Wayne County
Occupancy by Ownership in Wayne County
Of the total 14,959 dwellings in Wayne County, owner-occupied units account for 11,479 (76.7%), while renter-occupied units make up 3,480 (23.3%).
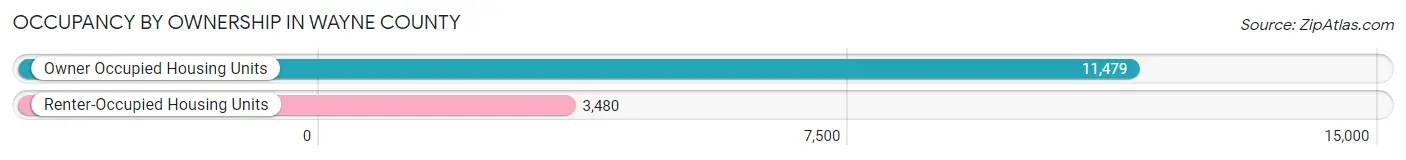
| Occupancy | # Housing Units | % Housing Units |
| Owner Occupied Housing Units | 11,479 | 76.7% |
| Renter-Occupied Housing Units | 3,480 | 23.3% |
| Total Occupied Housing Units | 14,959 | 100.0% |
Occupancy by Household Size in Wayne County
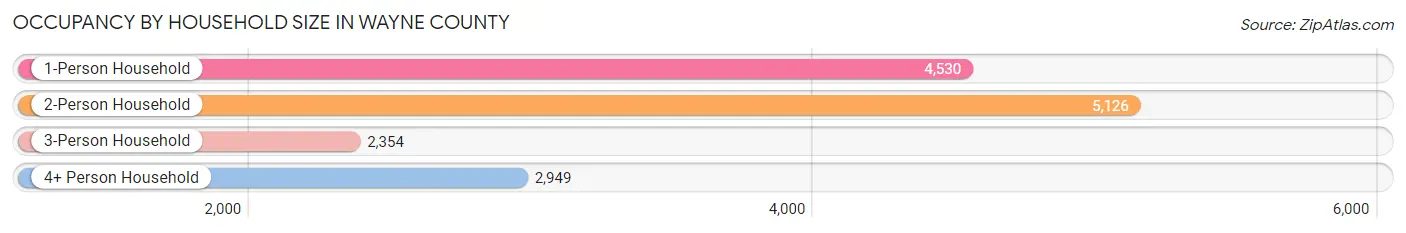
| Household Size | # Housing Units | % Housing Units |
| 1-Person Household | 4,530 | 30.3% |
| 2-Person Household | 5,126 | 34.3% |
| 3-Person Household | 2,354 | 15.7% |
| 4+ Person Household | 2,949 | 19.7% |
| Total Housing Units | 14,959 | 100.0% |
Occupancy by Ownership by Household Size in Wayne County
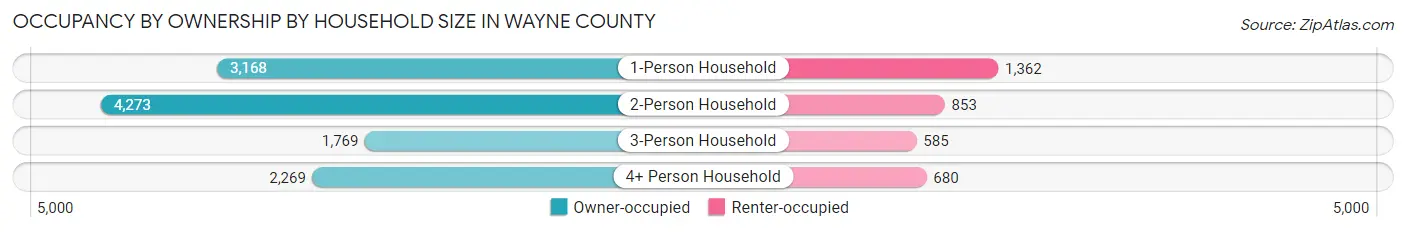
| Household Size | Owner-occupied | Renter-occupied |
| 1-Person Household | 3,168 (69.9%) | 1,362 (30.1%) |
| 2-Person Household | 4,273 (83.4%) | 853 (16.6%) |
| 3-Person Household | 1,769 (75.1%) | 585 (24.8%) |
| 4+ Person Household | 2,269 (76.9%) | 680 (23.1%) |
| Total Housing Units | 11,479 (76.7%) | 3,480 (23.3%) |
Occupancy by Educational Attainment in Wayne County
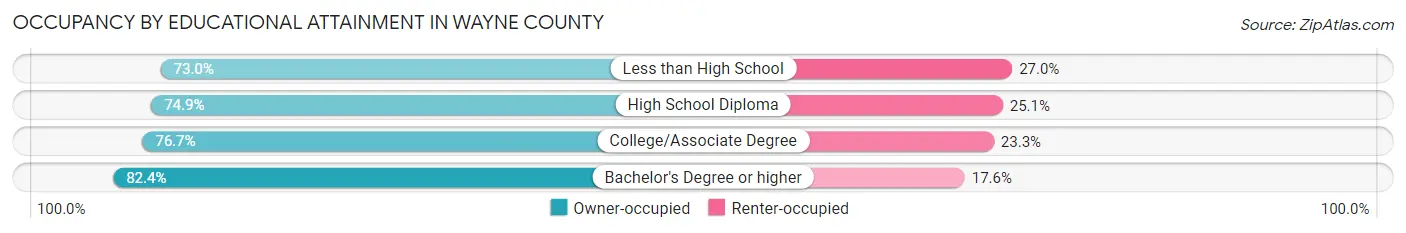
| Household Size | Owner-occupied | Renter-occupied |
| Less than High School | 1,449 (73.0%) | 535 (27.0%) |
| High School Diploma | 3,982 (74.9%) | 1,335 (25.1%) |
| College/Associate Degree | 3,515 (76.7%) | 1,070 (23.3%) |
| Bachelor's Degree or higher | 2,533 (82.4%) | 540 (17.6%) |
Occupancy by Age of Householder in Wayne County
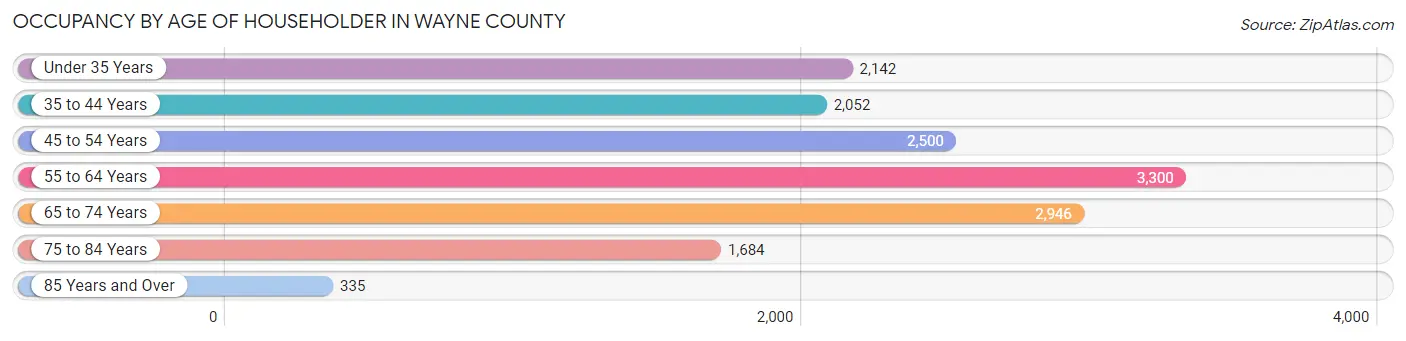
| Age Bracket | # Households | % Households |
| Under 35 Years | 2,142 | 14.3% |
| 35 to 44 Years | 2,052 | 13.7% |
| 45 to 54 Years | 2,500 | 16.7% |
| 55 to 64 Years | 3,300 | 22.1% |
| 65 to 74 Years | 2,946 | 19.7% |
| 75 to 84 Years | 1,684 | 11.3% |
| 85 Years and Over | 335 | 2.2% |
| Total | 14,959 | 100.0% |
Housing Finances in Wayne County
Median Income by Occupancy in Wayne County
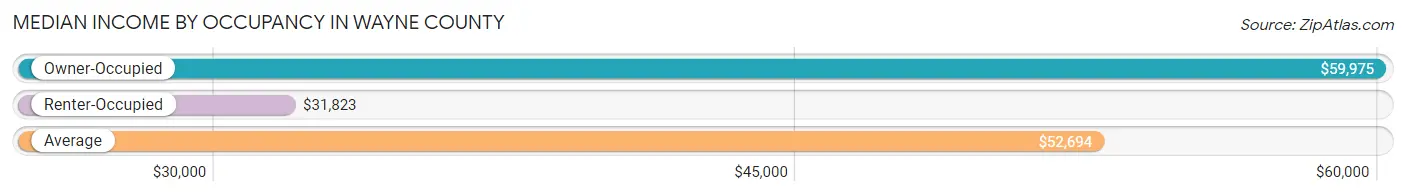
| Occupancy Type | # Households | Median Income |
| Owner-Occupied | 11,479 (76.7%) | $59,975 |
| Renter-Occupied | 3,480 (23.3%) | $31,823 |
| Average | 14,959 (100.0%) | $52,694 |
Occupancy by Householder Income Bracket in Wayne County
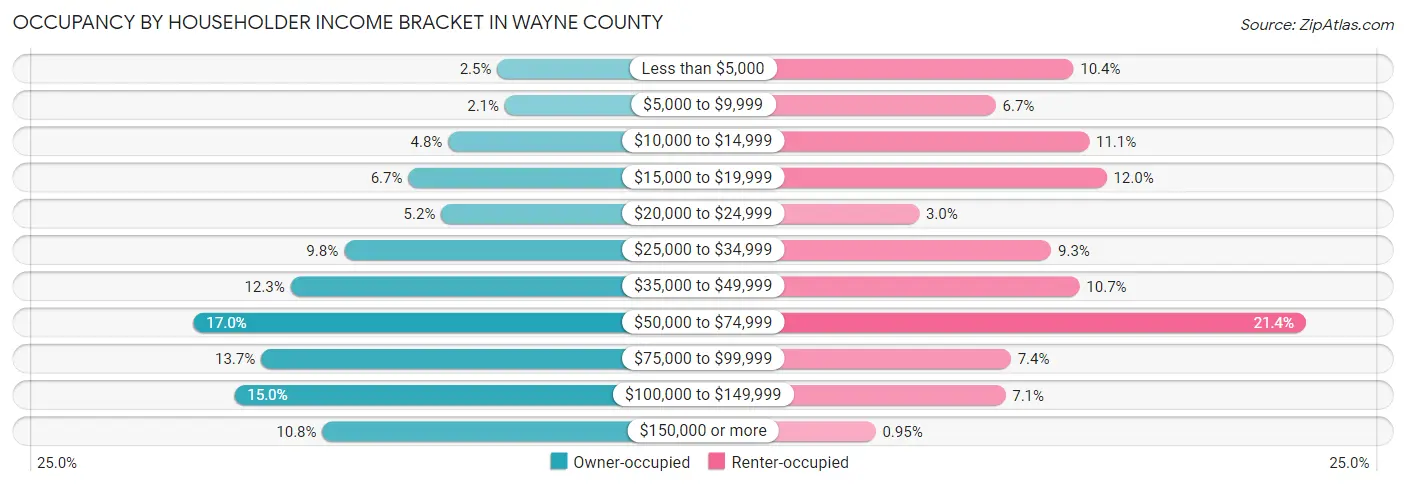
| Income Bracket | Owner-occupied | Renter-occupied |
| Less than $5,000 | 286 (2.5%) | 361 (10.4%) |
| $5,000 to $9,999 | 244 (2.1%) | 232 (6.7%) |
| $10,000 to $14,999 | 554 (4.8%) | 387 (11.1%) |
| $15,000 to $19,999 | 773 (6.7%) | 416 (11.9%) |
| $20,000 to $24,999 | 592 (5.2%) | 105 (3.0%) |
| $25,000 to $34,999 | 1,124 (9.8%) | 324 (9.3%) |
| $35,000 to $49,999 | 1,417 (12.3%) | 371 (10.7%) |
| $50,000 to $74,999 | 1,947 (17.0%) | 746 (21.4%) |
| $75,000 to $99,999 | 1,577 (13.7%) | 257 (7.4%) |
| $100,000 to $149,999 | 1,723 (15.0%) | 248 (7.1%) |
| $150,000 or more | 1,242 (10.8%) | 33 (0.9%) |
| Total | 11,479 (100.0%) | 3,480 (100.0%) |
Monthly Housing Cost Tiers in Wayne County
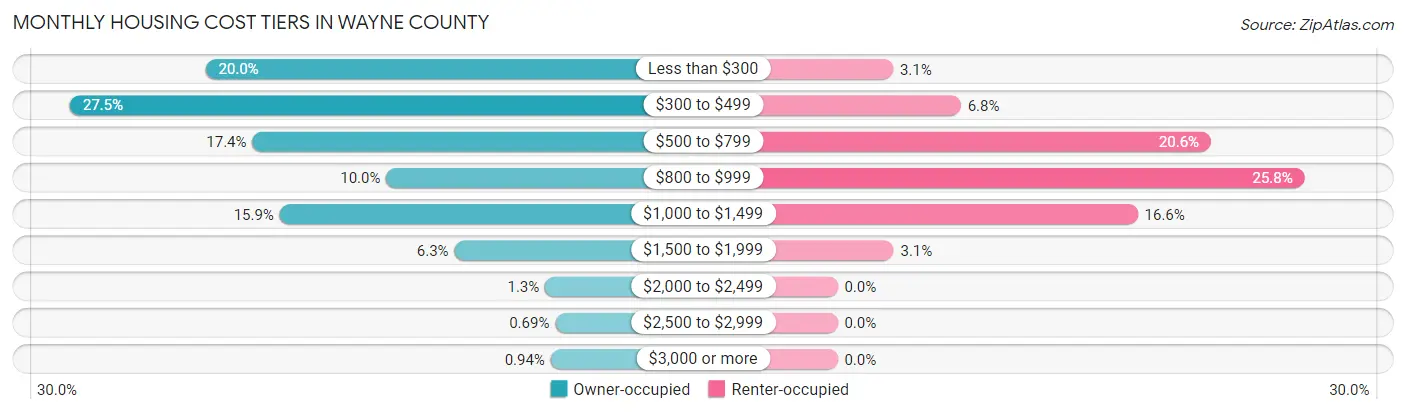
| Monthly Cost | Owner-occupied | Renter-occupied |
| Less than $300 | 2,297 (20.0%) | 107 (3.1%) |
| $300 to $499 | 3,157 (27.5%) | 237 (6.8%) |
| $500 to $799 | 2,000 (17.4%) | 718 (20.6%) |
| $800 to $999 | 1,150 (10.0%) | 898 (25.8%) |
| $1,000 to $1,499 | 1,826 (15.9%) | 577 (16.6%) |
| $1,500 to $1,999 | 719 (6.3%) | 108 (3.1%) |
| $2,000 to $2,499 | 143 (1.3%) | 0 (0.0%) |
| $2,500 to $2,999 | 79 (0.7%) | 0 (0.0%) |
| $3,000 or more | 108 (0.9%) | 0 (0.0%) |
| Total | 11,479 (100.0%) | 3,480 (100.0%) |
Physical Housing Characteristics in Wayne County
Housing Structures in Wayne County
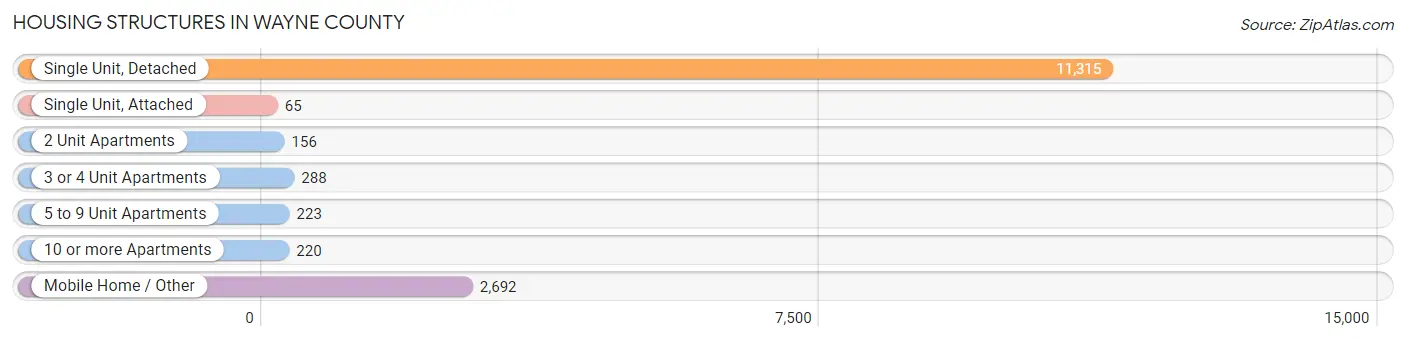
| Structure Type | # Housing Units | % Housing Units |
| Single Unit, Detached | 11,315 | 75.6% |
| Single Unit, Attached | 65 | 0.4% |
| 2 Unit Apartments | 156 | 1.0% |
| 3 or 4 Unit Apartments | 288 | 1.9% |
| 5 to 9 Unit Apartments | 223 | 1.5% |
| 10 or more Apartments | 220 | 1.5% |
| Mobile Home / Other | 2,692 | 18.0% |
| Total | 14,959 | 100.0% |
Housing Structures by Occupancy in Wayne County
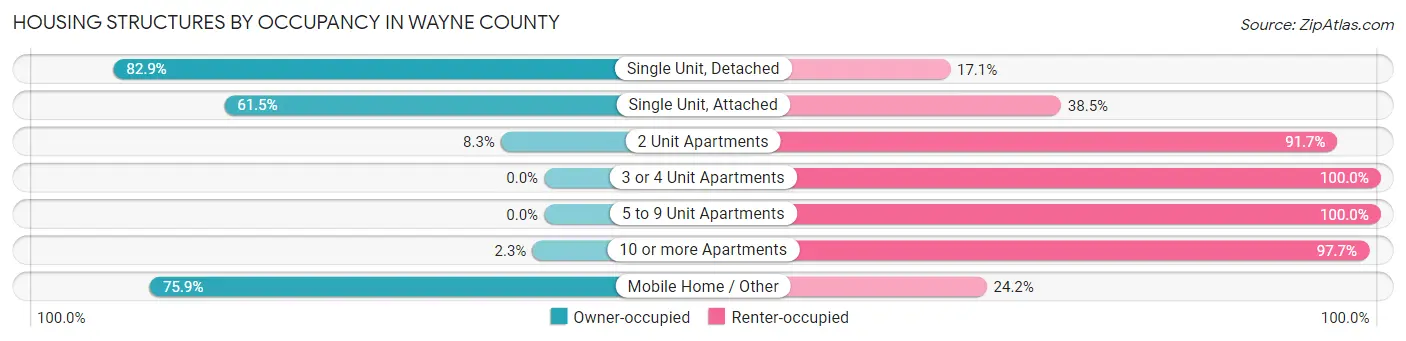
| Structure Type | Owner-occupied | Renter-occupied |
| Single Unit, Detached | 9,379 (82.9%) | 1,936 (17.1%) |
| Single Unit, Attached | 40 (61.5%) | 25 (38.5%) |
| 2 Unit Apartments | 13 (8.3%) | 143 (91.7%) |
| 3 or 4 Unit Apartments | 0 (0.0%) | 288 (100.0%) |
| 5 to 9 Unit Apartments | 0 (0.0%) | 223 (100.0%) |
| 10 or more Apartments | 5 (2.3%) | 215 (97.7%) |
| Mobile Home / Other | 2,042 (75.8%) | 650 (24.1%) |
| Total | 11,479 (76.7%) | 3,480 (23.3%) |
Housing Structures by Number of Rooms in Wayne County
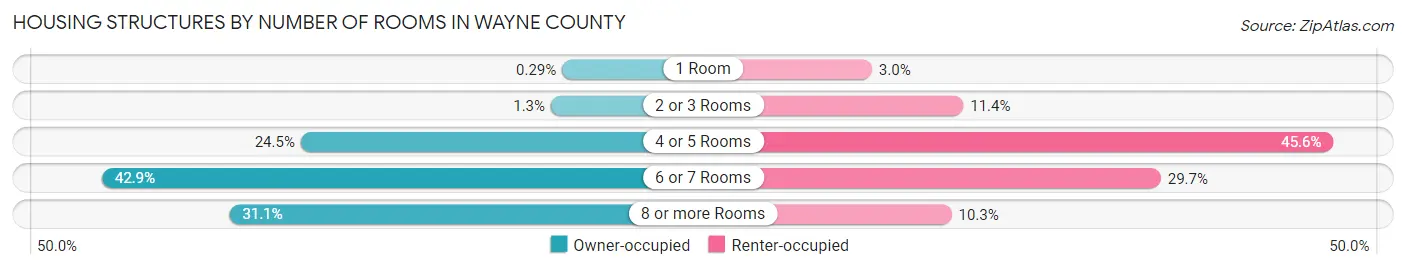
| Number of Rooms | Owner-occupied | Renter-occupied |
| 1 Room | 33 (0.3%) | 103 (3.0%) |
| 2 or 3 Rooms | 153 (1.3%) | 397 (11.4%) |
| 4 or 5 Rooms | 2,808 (24.5%) | 1,588 (45.6%) |
| 6 or 7 Rooms | 4,920 (42.9%) | 1,033 (29.7%) |
| 8 or more Rooms | 3,565 (31.1%) | 359 (10.3%) |
| Total | 11,479 (100.0%) | 3,480 (100.0%) |
Housing Structure by Heating Type in Wayne County
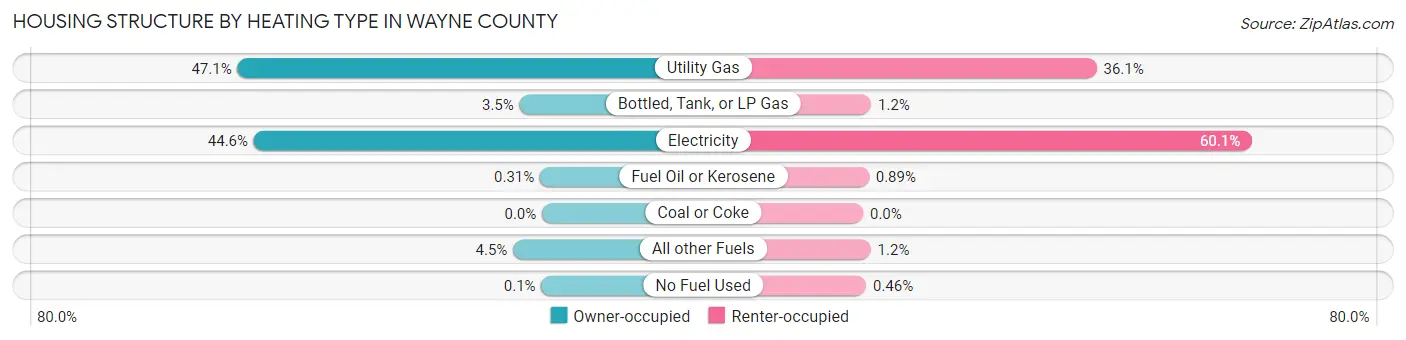
| Heating Type | Owner-occupied | Renter-occupied |
| Utility Gas | 5,405 (47.1%) | 1,256 (36.1%) |
| Bottled, Tank, or LP Gas | 399 (3.5%) | 43 (1.2%) |
| Electricity | 5,115 (44.6%) | 2,093 (60.1%) |
| Fuel Oil or Kerosene | 36 (0.3%) | 31 (0.9%) |
| Coal or Coke | 0 (0.0%) | 0 (0.0%) |
| All other Fuels | 513 (4.5%) | 41 (1.2%) |
| No Fuel Used | 11 (0.1%) | 16 (0.5%) |
| Total | 11,479 (100.0%) | 3,480 (100.0%) |
Household Vehicle Usage in Wayne County
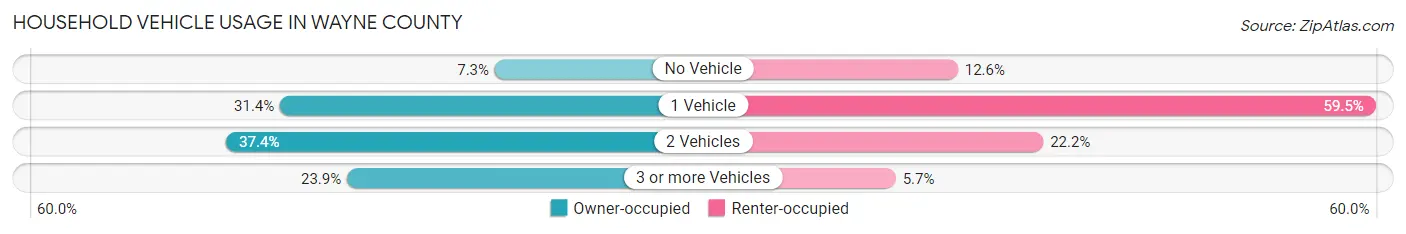
| Vehicles per Household | Owner-occupied | Renter-occupied |
| No Vehicle | 840 (7.3%) | 440 (12.6%) |
| 1 Vehicle | 3,602 (31.4%) | 2,069 (59.5%) |
| 2 Vehicles | 4,296 (37.4%) | 773 (22.2%) |
| 3 or more Vehicles | 2,741 (23.9%) | 198 (5.7%) |
| Total | 11,479 (100.0%) | 3,480 (100.0%) |
Real Estate & Mortgages in Wayne County
Real Estate and Mortgage Overview in Wayne County
| Characteristic | Without Mortgage | With Mortgage |
| Housing Units | 6,872 | 4,607 |
| Median Property Value | $93,800 | $155,100 |
| Median Household Income | $45,163 | $761 |
| Monthly Housing Costs | $352 | $108 |
| Real Estate Taxes | $510 | $239 |
Property Value by Mortgage Status in Wayne County
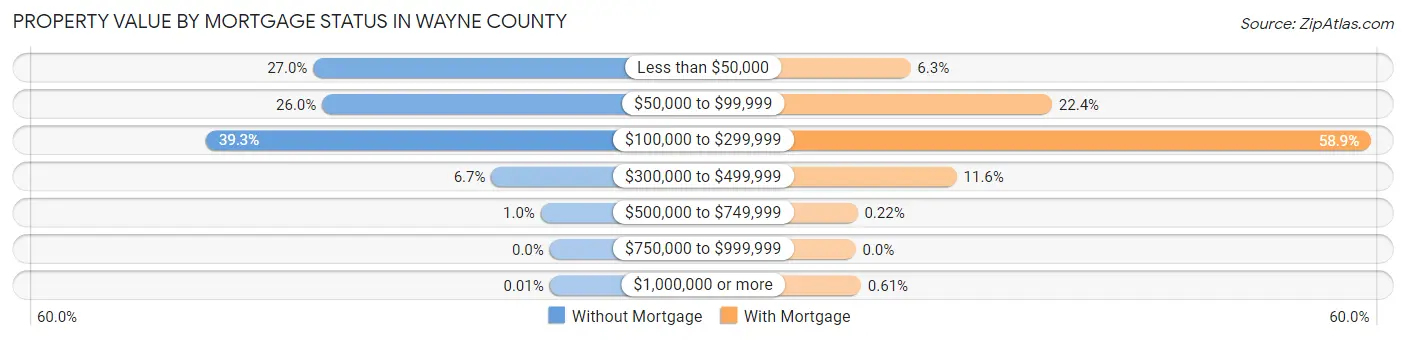
| Property Value | Without Mortgage | With Mortgage |
| Less than $50,000 | 1,857 (27.0%) | 289 (6.3%) |
| $50,000 to $99,999 | 1,787 (26.0%) | 1,034 (22.4%) |
| $100,000 to $299,999 | 2,699 (39.3%) | 2,714 (58.9%) |
| $300,000 to $499,999 | 458 (6.7%) | 532 (11.6%) |
| $500,000 to $749,999 | 70 (1.0%) | 10 (0.2%) |
| $750,000 to $999,999 | 0 (0.0%) | 0 (0.0%) |
| $1,000,000 or more | 1 (0.0%) | 28 (0.6%) |
| Total | 6,872 (100.0%) | 4,607 (100.0%) |
Household Income by Mortgage Status in Wayne County
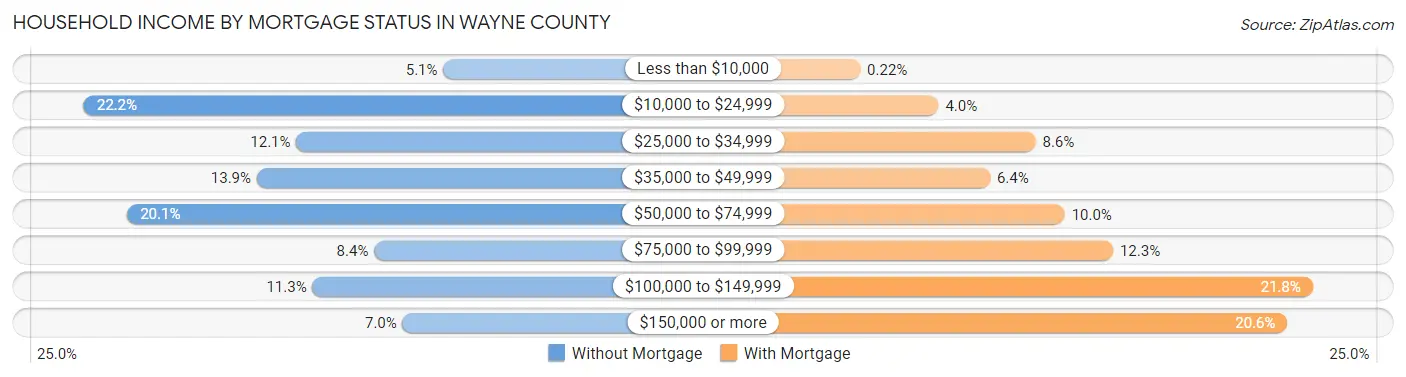
| Household Income | Without Mortgage | With Mortgage |
| Less than $10,000 | 348 (5.1%) | 10 (0.2%) |
| $10,000 to $24,999 | 1,524 (22.2%) | 182 (4.0%) |
| $25,000 to $34,999 | 829 (12.1%) | 395 (8.6%) |
| $35,000 to $49,999 | 958 (13.9%) | 295 (6.4%) |
| $50,000 to $74,999 | 1,382 (20.1%) | 459 (10.0%) |
| $75,000 to $99,999 | 574 (8.4%) | 565 (12.3%) |
| $100,000 to $149,999 | 776 (11.3%) | 1,003 (21.8%) |
| $150,000 or more | 481 (7.0%) | 947 (20.6%) |
| Total | 6,872 (100.0%) | 4,607 (100.0%) |
Property Value to Household Income Ratio in Wayne County
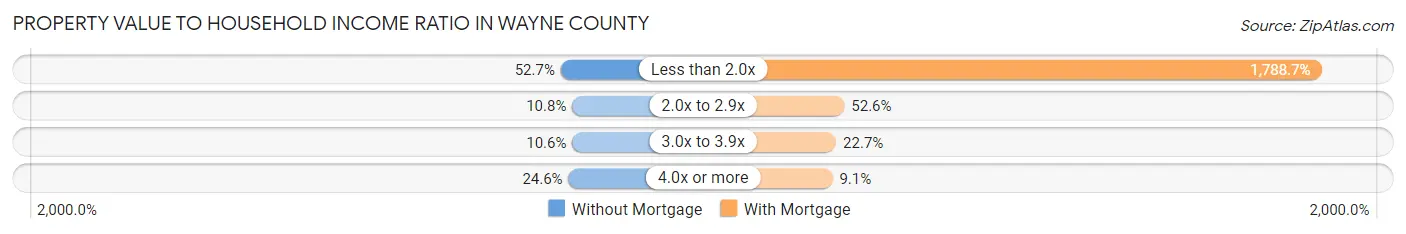
| Value-to-Income Ratio | Without Mortgage | With Mortgage |
| Less than 2.0x | 3,621 (52.7%) | 82,407 (1,788.7%) |
| 2.0x to 2.9x | 745 (10.8%) | 2,421 (52.5%) |
| 3.0x to 3.9x | 726 (10.6%) | 1,046 (22.7%) |
| 4.0x or more | 1,690 (24.6%) | 419 (9.1%) |
| Total | 6,872 (100.0%) | 4,607 (100.0%) |
Real Estate Taxes by Mortgage Status in Wayne County
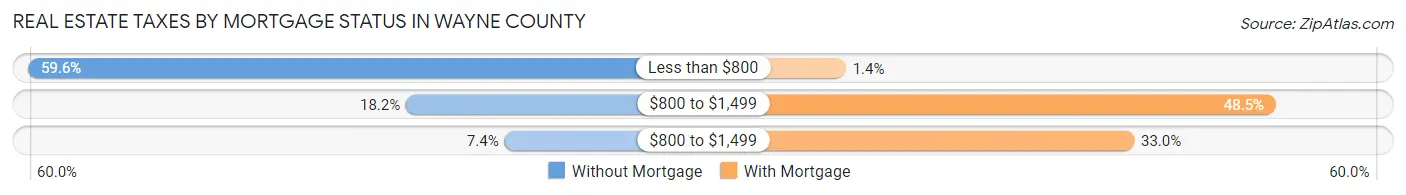
| Property Taxes | Without Mortgage | With Mortgage |
| Less than $800 | 4,098 (59.6%) | 64 (1.4%) |
| $800 to $1,499 | 1,251 (18.2%) | 2,236 (48.5%) |
| $800 to $1,499 | 509 (7.4%) | 1,520 (33.0%) |
| Total | 6,872 (100.0%) | 4,607 (100.0%) |
Health & Disability in Wayne County
Health Insurance Coverage by Age in Wayne County
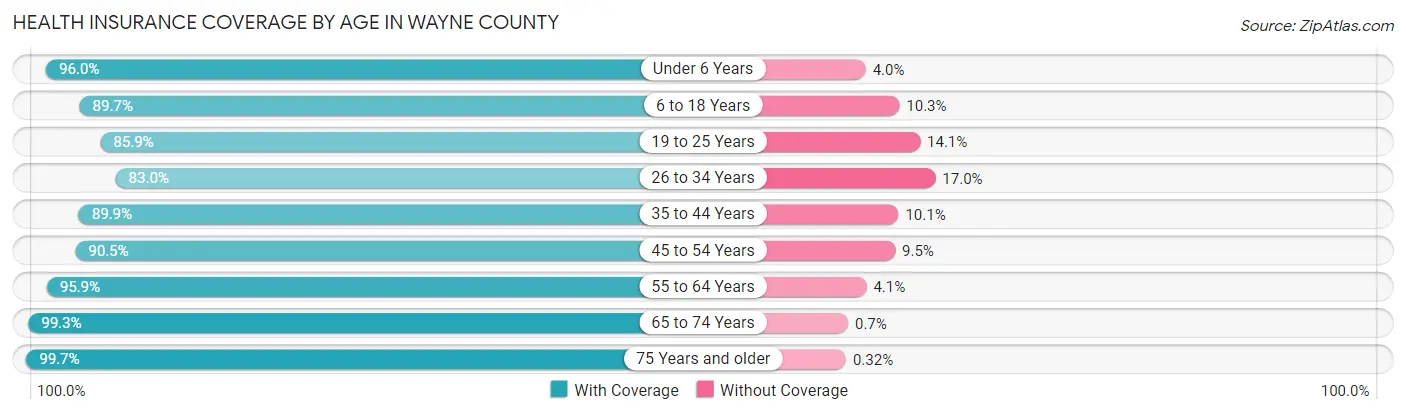
| Age Bracket | With Coverage | Without Coverage |
| Under 6 Years | 2,089 (96.0%) | 87 (4.0%) |
| 6 to 18 Years | 5,671 (89.7%) | 649 (10.3%) |
| 19 to 25 Years | 2,533 (85.9%) | 417 (14.1%) |
| 26 to 34 Years | 3,132 (83.0%) | 641 (17.0%) |
| 35 to 44 Years | 4,010 (89.9%) | 451 (10.1%) |
| 45 to 54 Years | 4,772 (90.5%) | 499 (9.5%) |
| 55 to 64 Years | 5,344 (95.9%) | 231 (4.1%) |
| 65 to 74 Years | 4,815 (99.3%) | 34 (0.7%) |
| 75 Years and older | 3,420 (99.7%) | 11 (0.3%) |
| Total | 35,786 (92.2%) | 3,020 (7.8%) |
Health Insurance Coverage by Citizenship Status in Wayne County
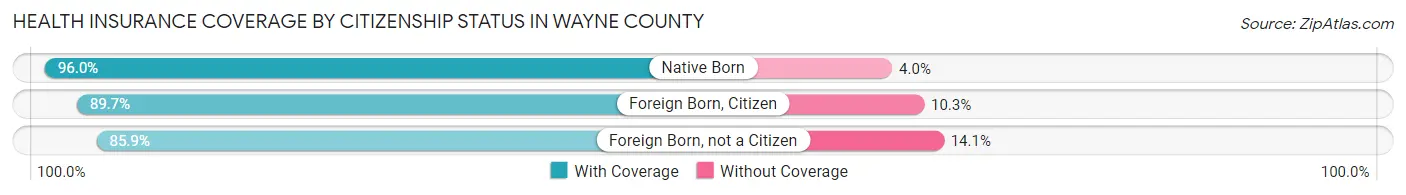
| Citizenship Status | With Coverage | Without Coverage |
| Native Born | 2,089 (96.0%) | 87 (4.0%) |
| Foreign Born, Citizen | 5,671 (89.7%) | 649 (10.3%) |
| Foreign Born, not a Citizen | 2,533 (85.9%) | 417 (14.1%) |
Health Insurance Coverage by Household Income in Wayne County
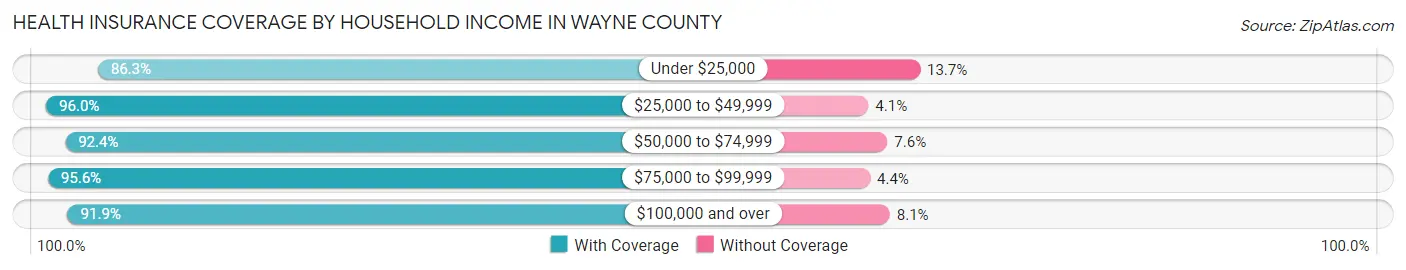
| Household Income | With Coverage | Without Coverage |
| Under $25,000 | 6,289 (86.3%) | 1,000 (13.7%) |
| $25,000 to $49,999 | 6,839 (96.0%) | 289 (4.1%) |
| $50,000 to $74,999 | 6,825 (92.4%) | 562 (7.6%) |
| $75,000 to $99,999 | 5,291 (95.6%) | 242 (4.4%) |
| $100,000 and over | 10,490 (91.9%) | 921 (8.1%) |
Public vs Private Health Insurance Coverage by Age in Wayne County
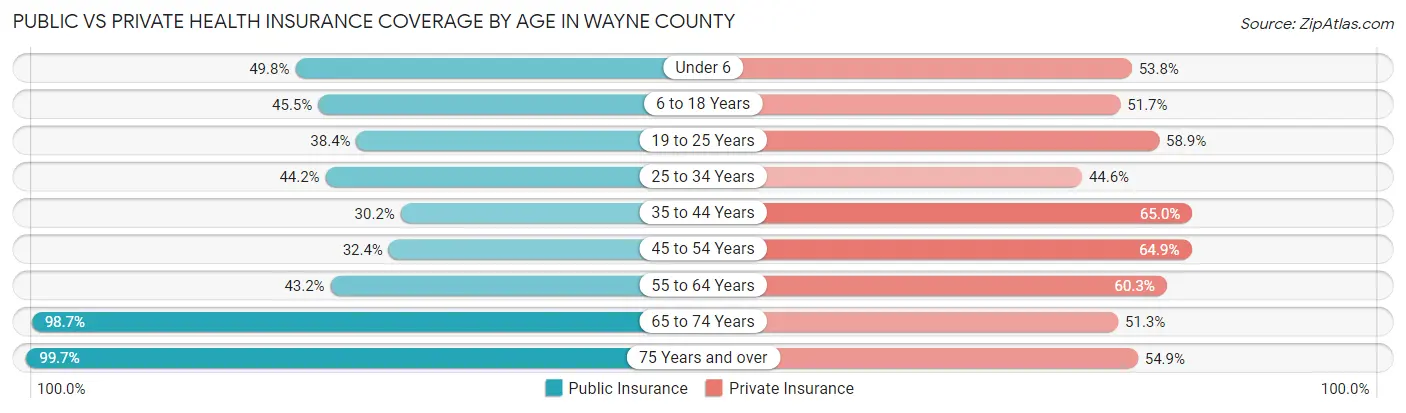
| Age Bracket | Public Insurance | Private Insurance |
| Under 6 | 1,083 (49.8%) | 1,171 (53.8%) |
| 6 to 18 Years | 2,877 (45.5%) | 3,268 (51.7%) |
| 19 to 25 Years | 1,133 (38.4%) | 1,737 (58.9%) |
| 25 to 34 Years | 1,666 (44.2%) | 1,682 (44.6%) |
| 35 to 44 Years | 1,347 (30.2%) | 2,901 (65.0%) |
| 45 to 54 Years | 1,709 (32.4%) | 3,419 (64.9%) |
| 55 to 64 Years | 2,410 (43.2%) | 3,361 (60.3%) |
| 65 to 74 Years | 4,785 (98.7%) | 2,487 (51.3%) |
| 75 Years and over | 3,420 (99.7%) | 1,885 (54.9%) |
| Total | 20,430 (52.6%) | 21,911 (56.5%) |
Disability Status by Sex by Age in Wayne County
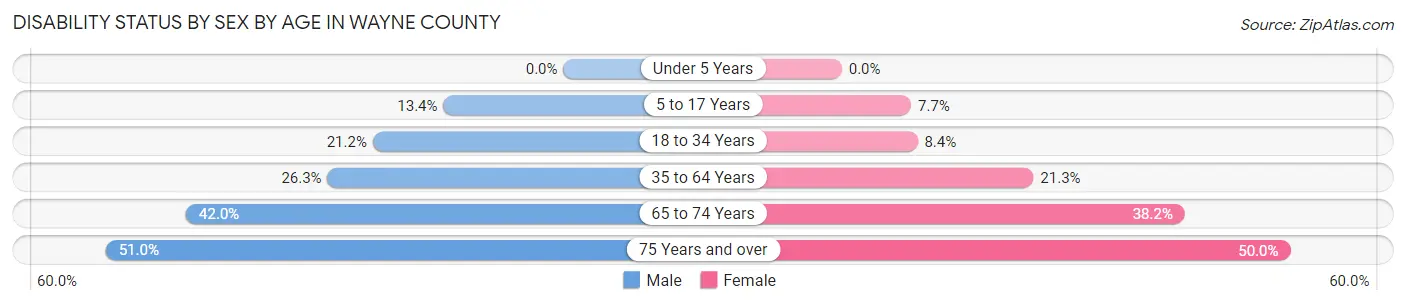
| Age Bracket | Male | Female |
| Under 5 Years | 0 (0.0%) | 0 (0.0%) |
| 5 to 17 Years | 410 (13.4%) | 227 (7.7%) |
| 18 to 34 Years | 782 (21.2%) | 304 (8.4%) |
| 35 to 64 Years | 1,981 (26.3%) | 1,657 (21.3%) |
| 65 to 74 Years | 954 (42.0%) | 985 (38.2%) |
| 75 Years and over | 770 (51.0%) | 959 (49.9%) |
Disability Class by Sex by Age in Wayne County
Disability Class: Hearing Difficulty
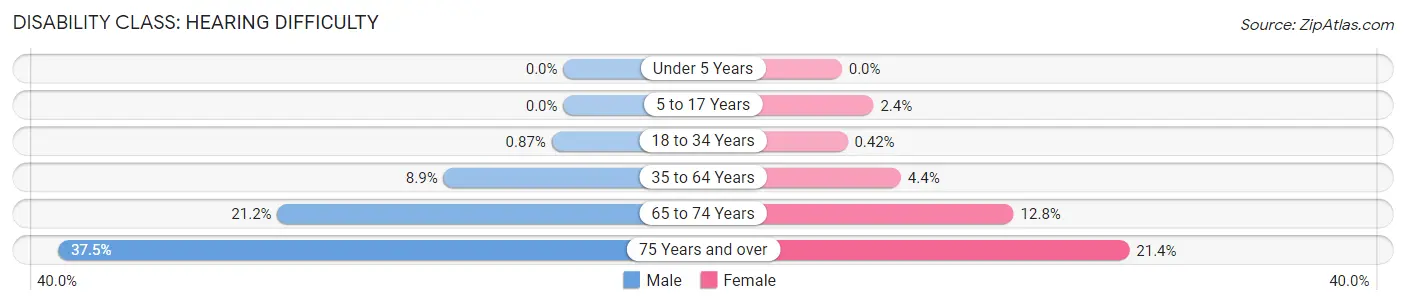
| Age Bracket | Male | Female |
| Under 5 Years | 0 (0.0%) | 0 (0.0%) |
| 5 to 17 Years | 0 (0.0%) | 69 (2.4%) |
| 18 to 34 Years | 32 (0.9%) | 15 (0.4%) |
| 35 to 64 Years | 671 (8.9%) | 341 (4.4%) |
| 65 to 74 Years | 482 (21.2%) | 329 (12.8%) |
| 75 Years and over | 567 (37.5%) | 410 (21.3%) |
Disability Class: Vision Difficulty
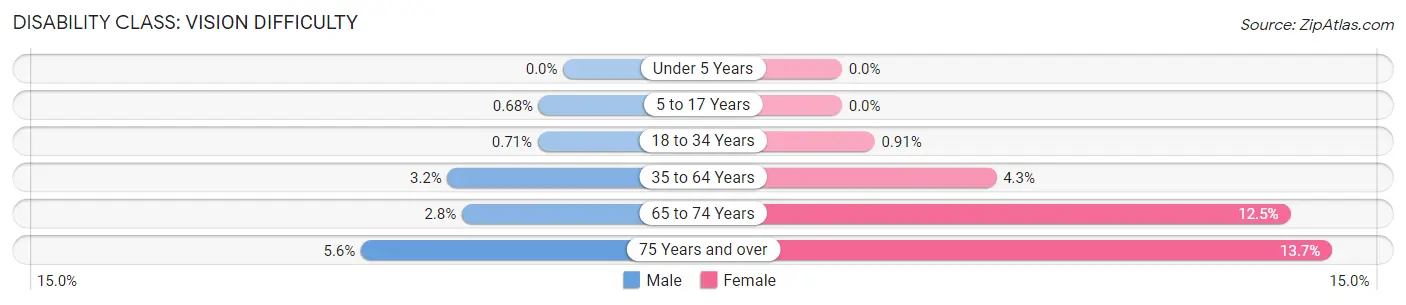
| Age Bracket | Male | Female |
| Under 5 Years | 0 (0.0%) | 0 (0.0%) |
| 5 to 17 Years | 21 (0.7%) | 0 (0.0%) |
| 18 to 34 Years | 26 (0.7%) | 33 (0.9%) |
| 35 to 64 Years | 243 (3.2%) | 334 (4.3%) |
| 65 to 74 Years | 64 (2.8%) | 322 (12.5%) |
| 75 Years and over | 85 (5.6%) | 262 (13.7%) |
Disability Class: Cognitive Difficulty
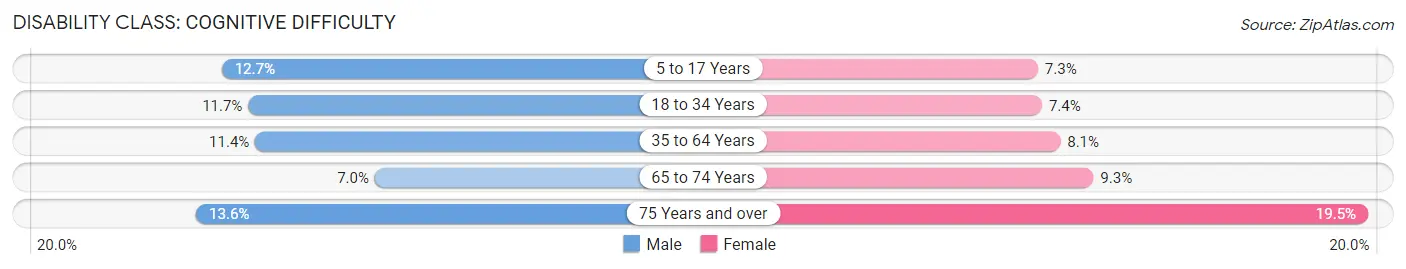
| Age Bracket | Male | Female |
| 5 to 17 Years | 389 (12.7%) | 214 (7.3%) |
| 18 to 34 Years | 431 (11.7%) | 268 (7.4%) |
| 35 to 64 Years | 863 (11.4%) | 630 (8.1%) |
| 65 to 74 Years | 159 (7.0%) | 241 (9.3%) |
| 75 Years and over | 206 (13.6%) | 375 (19.5%) |
Disability Class: Ambulatory Difficulty
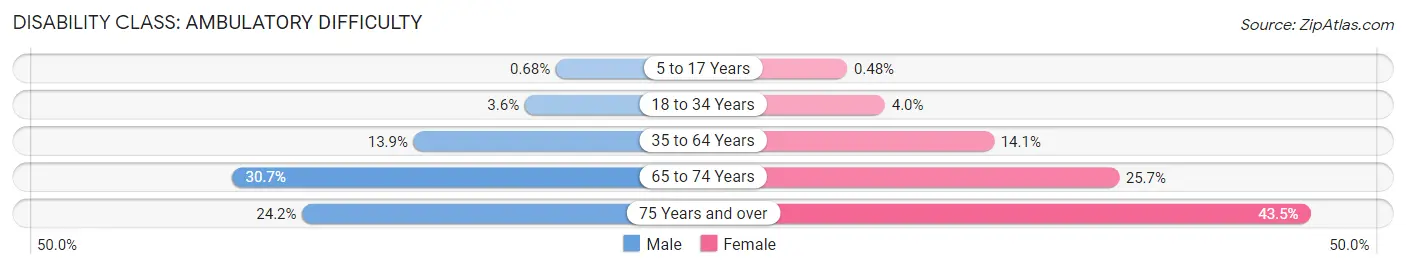
| Age Bracket | Male | Female |
| 5 to 17 Years | 21 (0.7%) | 14 (0.5%) |
| 18 to 34 Years | 131 (3.6%) | 144 (4.0%) |
| 35 to 64 Years | 1,047 (13.9%) | 1,095 (14.1%) |
| 65 to 74 Years | 697 (30.7%) | 663 (25.7%) |
| 75 Years and over | 366 (24.2%) | 835 (43.5%) |
Disability Class: Self-Care Difficulty
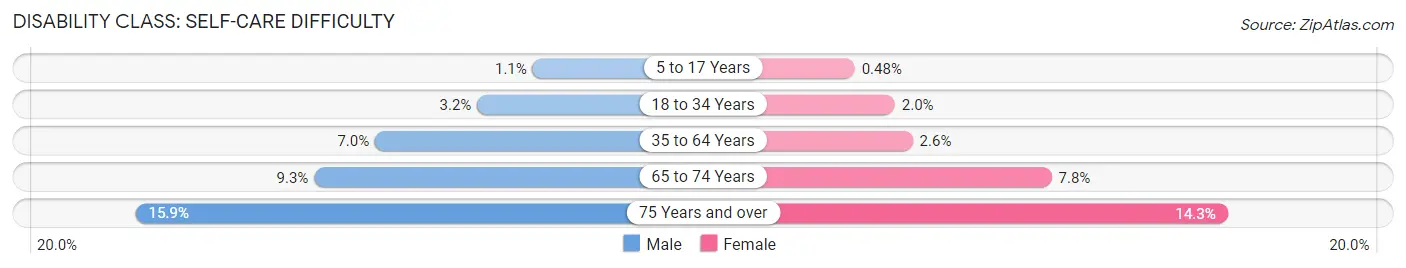
| Age Bracket | Male | Female |
| 5 to 17 Years | 35 (1.1%) | 14 (0.5%) |
| 18 to 34 Years | 118 (3.2%) | 71 (2.0%) |
| 35 to 64 Years | 527 (7.0%) | 204 (2.6%) |
| 65 to 74 Years | 210 (9.2%) | 201 (7.8%) |
| 75 Years and over | 240 (15.9%) | 275 (14.3%) |
Technology Access in Wayne County
Computing Device Access in Wayne County
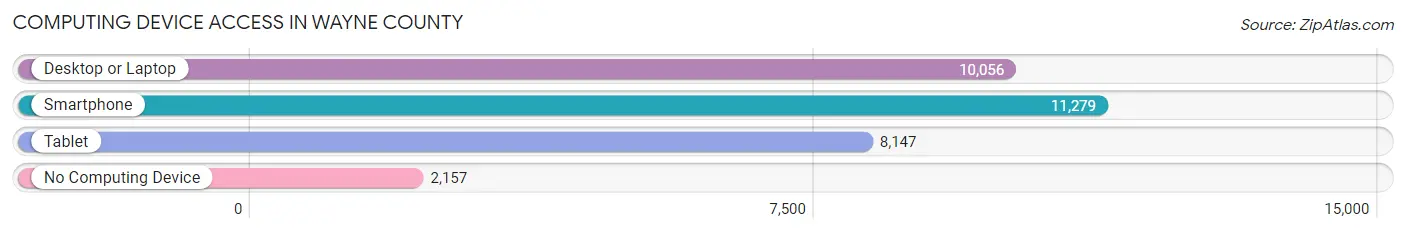
| Device Type | # Households | % Households |
| Desktop or Laptop | 10,056 | 67.2% |
| Smartphone | 11,279 | 75.4% |
| Tablet | 8,147 | 54.5% |
| No Computing Device | 2,157 | 14.4% |
| Total | 14,959 | 100.0% |
Internet Access in Wayne County
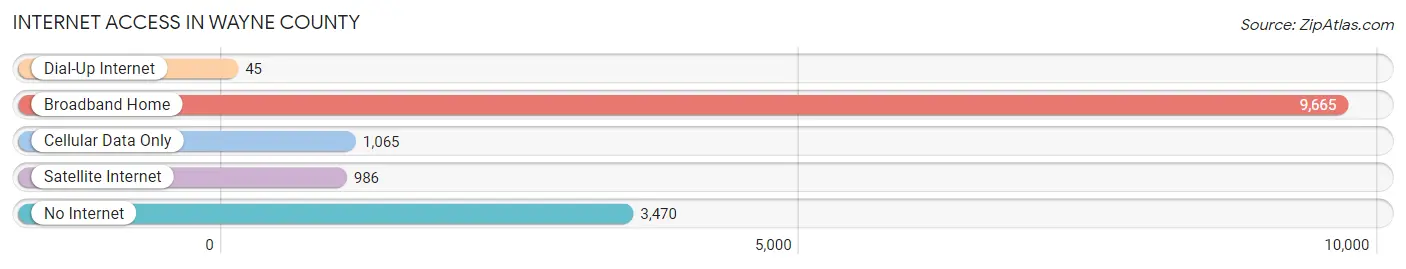
| Internet Type | # Households | % Households |
| Dial-Up Internet | 45 | 0.3% |
| Broadband Home | 9,665 | 64.6% |
| Cellular Data Only | 1,065 | 7.1% |
| Satellite Internet | 986 | 6.6% |
| No Internet | 3,470 | 23.2% |
| Total | 14,959 | 100.0% |
Wayne County Summary
Wayne County, West Virginia is located in the southwestern part of the state, and is bordered by Cabell County to the north, Lincoln County to the east, Mingo County to the south, and Putnam County to the west. The county seat is Wayne, and the county was named for General “Mad” Anthony Wayne. The county has a total area of 441 square miles, and a population of 42,481 as of the 2010 census.
History
Wayne County was formed in 1842 from Cabell and Kanawha Counties. The county was named for General “Mad” Anthony Wayne, a Revolutionary War hero. The county seat is Wayne, which was named for the county. The county was originally part of the state of Virginia, and was part of the state of West Virginia when it was formed in 1863.
The county has a rich history, and was home to many Native American tribes, including the Shawnee, Mingo, and Cherokee. The area was also home to many early settlers, including the Hatfields and McCoys. The county was also the site of the Battle of Tug Fork, which was part of the Hatfield-McCoy feud.
Geography
Wayne County is located in the southwestern part of West Virginia, and is bordered by Cabell County to the north, Lincoln County to the east, Mingo County to the south, and Putnam County to the west. The county has a total area of 441 square miles, and is mostly mountainous, with the highest point being Big Ugly Mountain, which has an elevation of 2,890 feet. The county is drained by the Tug Fork River, which forms the border between Wayne County and Mingo County.
The county is home to several state parks, including Beech Fork State Park, Chief Logan State Park, and Twin Falls State Park. The county also has several wildlife management areas, including the Wayne County Wildlife Management Area, the Beech Fork Wildlife Management Area, and the Twin Falls Wildlife Management Area.
Economy
The economy of Wayne County is largely based on agriculture and coal mining. The county is home to several large coal mines, including the Big Ugly Mine, the Beech Fork Mine, and the Twin Falls Mine. The county is also home to several large farms, including the Hatfield Farm and the McCoy Farm.
The county is also home to several manufacturing companies, including the Wayne County Manufacturing Company, which produces furniture, and the Wayne County Glass Company, which produces glass products. The county is also home to several retail stores, including the Wayne County Mall, which is the largest shopping center in the county.
Demographics
As of the 2010 census, the population of Wayne County was 42,481, with a population density of 96.3 people per square mile. The racial makeup of the county was 95.3% White, 2.2% African American, 0.3% Native American, 0.3% Asian, 0.1% Pacific Islander, 0.5% from other races, and 1.3% from two or more races. Hispanic or Latino of any race were 1.3% of the population.
The median income for a household in the county was $30,945, and the median income for a family was $37,945. The per capita income for the county was $16,845. About 17.2% of the population was below the poverty line.
Common Questions
What is the Total Population of Wayne County?
Total Population of Wayne County is 38,933.
What is the Total Male Population of Wayne County?
Total Male Population of Wayne County is 19,098.
What is the Total Female Population of Wayne County?
Total Female Population of Wayne County is 19,835.
What is the Ratio of Males per 100 Females in Wayne County?
There are 96.28 Males per 100 Females in Wayne County.
What is the Ratio of Females per 100 Males in Wayne County?
There are 103.86 Females per 100 Males in Wayne County.
What is the Median Population Age in Wayne County?
Median Population Age in Wayne County is 44.5 Years.
What is the Average Family Size in Wayne County
Average Family Size in Wayne County is 3.2 People.
What is the Average Household Size in Wayne County
Average Household Size in Wayne County is 2.6 People.
What is Per Capita Income in Wayne County?
Per Capita income in Wayne County is $29,774.
What is the Median Family Income in Wayne County?
Median Family Income in Wayne County is $67,605.
What is the Median Household income in Wayne County?
Median Household Income in Wayne County is $52,694.
What is Income or Wage Gap in Wayne County?
Income or Wage Gap in Wayne County is 33.4%.
Women in Wayne County earn 66.6 cents for every dollar earned by a man.
What is Family Income Deficit in Wayne County?
Family Income Deficit in Wayne County is $9,773.
Families that are below poverty line in Wayne County earn $9,773 less on average than the poverty threshold level.
What is Inequality or Gini Index in Wayne County?
Inequality or Gini Index in Wayne County is 0.49.
How Large is the Labor Force in Wayne County?
There are 15,009 People in the Labor Forcein in Wayne County.
What is the Percentage of People in the Labor Force in Wayne County?
46.7% of People are in the Labor Force in Wayne County.
What is the Unemployment Rate in Wayne County?
Unemployment Rate in Wayne County is 5.0%.